Abstract
A microwave assisted extraction technology was used to extract chrysophanol from rhubarb. The present study will focus on the optimum extraction conditions of chrysophanol and discuss the inhibitory effect of chrysophanol on the biofilm formation of Streptococcus suis (S. suis). A Box–Behnken design based on single-factor experiments was applied to optimize the microwave assisted extraction process and to study the factors' relationships with each other. The results showed that a microwave temperature of 56 °C, ethanol concentration of 70%, microwave power of 540 W and liquid to raw material ratio of 55 mL g−1 were the optimal conditions for the microwave method. The yield of chrysophanol was 2.54 ± 0.07% under the optimal conditions, which was in agreement with the predicted value (2.64%). Then, the chemical structure of the extracted chrysophanol was identified by LC-MS. In addition, in vitro experiments showed that chrysophanol has an inhibitory effect on S. suis (minimum inhibitory concentration was 1.98 μg mL−1) and was shown to significantly inhibit the capability of S. suis to form a biofilm using crystal violet staining. Finally, scanning electron microscopy analysis showed that the three-dimensional structure of the biofilm deposited by the S. suis community was destroyed by chrysophanol.
A microwave assisted extraction technology was used to extract chrysophanol from rhubarb.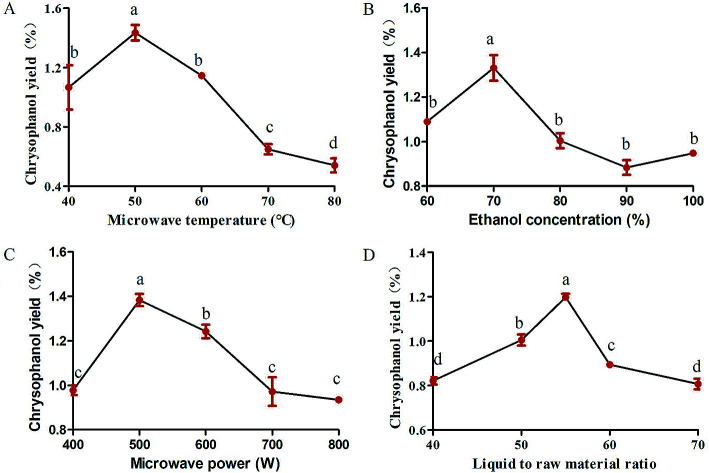
1. Introduction
Rhubarb is a famous Chinese medicinal herb which belongs to the family Polygonaceae, in which the main bioactive compounds are chrysophanol, emodin and rhein.1 Among them, chrysophanol (1,8-dihydroxy-3-methyl-anthraquinone) is a member of the anthraquinone family2 having broad-spectrum therapeutic potential and beneficial effects on human health.3 Previous study has also confirmed the beneficial biological properties of chrysophanol. It is a major component of most plant extracts that have been used for the treatment of chronic kidney disease4 and inflammation,5 gastric protection,6 treatment of diabetes,7 and so on. Most recent studies have shown that chrysophanol has significant inhibitory effects against Bacillus cereus, Escherichia coli,8Pseudomonas aeruginosa and Stenotrophomonas maltophilia.9 From our previous study, it was observed that rhubarb water extract could inhibit Streptococcus suis (S. suis) biofilm formation.10 Therefore, further investigation is required to verify whether chrysophanol in rhubarb extract interferes with the formation of S. suis biofilm. In order to study the bacteriostatic activity of chrysophanol in rhubarb, the extraction of bioactive components is a critical step.
The common extraction methods for extracting herbal medicines are mainly hot expelling, cold pressing, supercritical fluid extraction11 and Soxhlet.12 However, each method has its drawbacks. As these techniques are time-consuming and require large volumes of expensive solvents,13 factors such as effectiveness, cost, simplicity and waste have considerable influence on the extraction method chosen11 compared to traditional maceration and cyclic pressurization extraction.12 Compared with the above methods, the microwave assisted extraction is currently not a common method used in bioactive compound extraction, its advantages include rapid and convenient extraction rate, no damage to the biological activity of the extract, and lower cost of sample preparation.14 The microwave technique is widely used as a green solvent extraction technology.15 Therefore, the selection of microwave assisted extraction and optimization of herbal medicine extracts may be able to effectively improve the therapeutic effect of the main ingredients.
Therefore, the purpose of this study was to optimize the microwave assisted extraction parameters using response surface methodology (RSM) in order to obtain the maximal chrysophanol yield. The structure of chrysophanol extracted from rhubarb was characterized by LC-MS analysis. Moreover, we evaluated the inhibition of biofilm formation capability in S. suis by crystal violet staining and scanning electron microscopy (SEM).
2. Materials and methods
2.1. Extraction of rhubarb
0.5 g of rhubarb sample (purchased from the Hong Kong Pharmacy) was poured into microwave tank and extracted with a certain volume of ethanol solution with different concentration. The extraction was conducted at different temperature and power, respectively, and the warm-up time was 10 min, and the working time was 15 min. Then, the supernatant was poured into a centrifuge tube and centrifuged at 8000 rpm for 10 min at room temperature. Next, 1 mL of the supernatant was adjusted to a volume of 10 mL with 1% magnesium acetate-ethanol. The absorbance of the samples was measured on a UV spectrophotometer (Shanghai Yuan Analysis Instrument® UV-6000PC) at 515 nm, and the extraction rate of the rhubarb was calculated by the standard absorption curve of the chrysophanol. The experiments were carried out in triplicate.
2.2. Single-factor experiments
In order to obtain the optimum extraction conditions of rhubarb, four parameters including ethanol concentration, microwave temperature, microwave power, and liquid to raw material ratio were screened using single-factor experiment. Specifically, each variable was tested individually, as follows: ethanol concentration was tested in a range from 50% to 100%, microwave temperature was tested in a range from 40 to 80 °C, microwave power was tested in a range from 400 to 800 W, and liquid to raw material ratio was tested in a range from 40 to 65. When one factor changes, the other factors remain the same in each experiment.
2.3. Experimental design of chrysophanol
On the basis of single-factor experiment, the BBD is a useful statistical technique16 that can be used to assess how the extraction conditions influence the effect of chrysophanol yield. In this study, the three single factors with the greatest influence on the yield of chrysophanol were selected and the single factor value of the largest yield of chrysophanol was input into the response surface. Then, three-level BBD experimental design required 17 experimental runs with three central points, which was employed to determine the optimal extraction conditions for chrysophanol.
The selected independent variables were X1 (ethanol concentration), X2 (microwave temperature) and X3 (microwave power) (Table 1). Three levels were coded 1, 0 and −1 for high, intermediate and low level, respectively (Table 1). The actual experimental design matrix is given in Table 2. Experimental data were analyzed by a second-order polynomial model which correlate the interaction between the independent variables and the response variable.17 The second-order polynomial equation is as follow: where Y is the predicted response (the yield of chrysophanol), Xi and Xj are the input variables (ethanol concentration, microwave temperature and microwave power), b0, bi, bii, and bij represent the regression coefficients of constant, linear, quadratic, and interactions terms, respectively, and k represent the number of variables.18 According to the analysis of variance (ANOVA) with 95% confidence level, the regression coefficients, coefficient of determination, and the lack of fit for each studied response were employed to evaluate the fitness of the regression model. Design-expert software (version 8.0) was used to analyze the experimental data. The p-values < 0.05 were considered to be statistically significant.
Variables and experimental design levels for response surface.
| Coded symbol | Independent variable | Units | Min | Max | Mean |
|---|---|---|---|---|---|
| X 1 | Ethanol concentration | % | −1 | 1 | 0 |
| X 2 | Microwave temperature | °C | −1 | 1 | 0 |
| X 3 | Microwave power | W | −1 | 1 | 0 |
Box–Behnken design matrix with three independent variables expressed in coded with absorbance values.
| Run | X 1 | X 2 | X 3 | Y (%) |
|---|---|---|---|---|
| 1 | 0 | 0 | 0 | 2.5 ± 0.1 |
| 2 | 1 | 1 | 0 | 1.65 ± 0.05 |
| 3 | 0 | −1 | 1 | 2.12 ± 0.09 |
| 4 | −1 | 1 | 0 | 2.16 ± 0.06 |
| 5 | −1 | −1 | 0 | 1.98 ± 0.06 |
| 6 | 0 | 1 | −1 | 2.14 ± 0.09 |
| 7 | 1 | 0 | −1 | 2.15 ± 0.04 |
| 8 | 0 | 0 | 0 | 2.5 ± 0.1 |
| 9 | 1 | −1 | 0 | 1.7 ± 0.1 |
| 10 | 1 | 0 | −1 | 1.84 ± 0.04 |
| 11 | 0 | −1 | −1 | 1.85 ± 0.03 |
| 12 | −1 | 0 | 1 | 1.83 ± 0.03 |
| 13 | 0 | 0 | 0 | 2.5 ± 0.1 |
| 14 | 0 | 0 | 0 | 2.5 ± 0.1 |
| 15 | 0 | 1 | 1 | 1.85 ± 0.02 |
| 16 | 0 | 0 | 0 | 2.5 ± 0.1 |
| 17 | −1 | 0 | −1 | 2.14 ± 0.17 |
2.4. LC-MS analysis of chrysophanol in rhubarb
The standard chrysophanol and sample of chrysophanol in rhubarb were determined by LC-MS/MS analysis. First, separations were carried out at 40 °C on an ACQUITY UPLC BEH C18 column (100 mm × 2.1 mm, 1.7 μm) by a performance liquid chromatography (HPLC) system (SCIEX ExionLC™ AD). The mobile phase for this study was composed of 0.1% formic acid (A) and acetonitrile (B). The gradient programme was 0 min, 5% solvent B; 5 min, 95% solvent B; 11 min, 95% solvent B; 12 min, 5% solvent B and 15 min, 5% solvent B. The rate of flow was 0.4 mL min−1. The volume injected was 5 μL.
The MS system consisted of a SCIEX 5600 plus Q-TOF with an electrospray interface (ESI). Analyses were carried out in positive ESI mode. The Ion Spray Voltage Floating (ISVF) of the ESI was 5500 V, and the temperature of the source (TEM) was maintained at 550 °C. The curtain gas pressure (CUR), nebulizer gas pressure (GS1) and auxiliary gas pressure (GS2) were 35, 50 and 50 psi, respectively. The declustering potential (DP) was 90 V in ESI-MS and ESI-MS2. The collision energy (CE) in ESI-MS and ESI-MS2 were 10 and 335 V, respectively. The collision energy spread (CES) were 15 V in ESI-MS2. The MS/MS conditions were optimized by the direct infusion of standard solutions prepared in the mobile phase. Samples were analyzed in the multiple reaction monitoring mode (MRM). Data acquisition and sample quantification were performed using Analyst 1.5 software (SCIEX).
2.5. In vitro experiments
2.5.1. Biofilm formation
In this study, S. suis ATCC 700794 strain was cultured in Todd Hewitt Broth (THB) (THB: Summus Ltd, Harbin, Heilongjiang, China). The different concentrations of chrysophanol were used for MIC assays and crystal violet staining using the protocol described previously.19
2.5.2. Scanning electron microscopy
The biofilm of S. suis was examined by an electron microscopy (FEI Quanta, Netherland), which was described previously.20 Briefly, the overnight bacterial cultures were diluted with chrysophanol or without chrysophanol and then were added to each well of a six-well plate containing rough glass slide or normal glass slide. The supernatant was removed after 24 h incubation.
2.6. Statistical analysis
All the experiments were performed in triplicates. Data analysis and calculation of standard deviation were done using SPSS 11.0.0 (IBM, USA), and p < 0.05 was considered indicative of statistically significant differences.
3. Results and discussion
3.1. Effect of microwave temperature on the extraction conditions of rhubarb
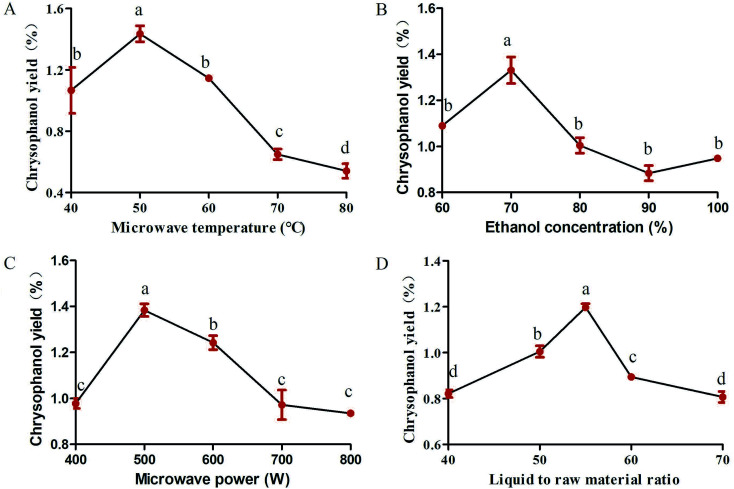
Studies were carried out to investigate whether extraction temperature is one of the important factors affecting the yield of chrysophanol. To study the effect of microwave temperature on the yield of chrysophanol obtained from rhubarb, the extraction process was carried out at the following temperature levels (40, 50, 60, 70 and 80 °C), while other extraction conditions were as follows: microwave power of 600 W, ethanol concentration of 100% and liquid to raw material ratio of 80. Fig. 1A showed the effect of different temperatures on the yield of chrysophanol from rhubarb. Fig. 1A indicated that when the temperature increased from 40 to 50 °C, the total yield of chrysophanol increased significantly (p < 0.05), and then reached a peak at 50 °C, and finally dropped significantly from 50 to 80 °C (p < 0.05). Previous study has shown that the increasing temperature may cause the chrysophanol on the cell wall to be distributed to the solvent,21 cause the loss of solvent, resulting in a lower yield22 and influence the viscosity of the polysaccharide extracting solution, leading to a high rate of macromolecule passage.23 Therefore, the center point of extraction temperature was considered to be 50 °C in this experiment.
Fig. 1. Single-factor experiments in the kinds of microwave temperature (A), ethanol concentration (B), microwave power (C) and liquid to raw material ratio (D) in the extraction conditions of rhubarb. Data are expressed as mean ± standard deviation (n = 3). Means followed by different letters are significantly different (p < 0.05).
3.2. Effect of ethanol concentration on the extraction conditions of rhubarb
Total chrysophanol yield from rhubarb was apparently influenced by ethanol concentration (100%, 90%, 80%, 70%, 60% and 50%), which was tested with a fixed microwave temperature, microwave power and liquid to raw material ratio of 50 °C, 600 W and 80, respectively. The results showed that the chrysophanol yield peaked when the ethanol concentration was 70%, at higher or lower concentrations, the yield was suppressed (Fig. 1B). This result is in consonance with previous findings that ethanol concentration had a critical role in the extraction of soluble components from different natural products, such as white tea polyphenols,24Inula helenium25 and soluble ginseng components.26 At the same time, ethanol is a polar solvent with a high dielectric constant, whose water can absorb more microwave energy and facilitate easy heat transfer to the reaction system. The extraction efficiency increased with increasing temperature.25 Furthermore, owing to these factors, 70% ethanol was chosen as the optimal ethanol concentration for rhubarb extraction.
3.3. Effect of microwave power on the extraction conditions of rhubarb
Variation in the microwave power (400, 500, 600, 700 and 800 W) is the key parameter with the most significant effect on chrysophanol yield from rhubarb and the effect was tested at a fixed microwave temperature, ethanol concentration and liquid to raw material ratio of 50 °C, 100% and 80, respectively. The experimental data showed that chrysophanol extraction yield increased significantly as the microwave power was increased from 400 to 500 W (p < 0.05). At this level (500 W), the peak rate was achieved (1.42%) (Fig. 1C). Thereafter, the chrysophanol yield decreased as the microwave power increased. It was speculated that the high microwave power might contribute to the degradation of the chrysophanol. This result was consistent with the result of Perez et al.27 Thus, 500 W was chosen as the optimal microwave power for rhubarb extraction.
3.4. Effect of liquid to raw material ratio on the extraction conditions of rhubarb
Liquid to raw material ratio, is an important extraction parameter that could significantly affect the yield of extracts.28 In order to investigate the effect of different ratios of liquid to raw material on chrysophanol yield, the liquid to raw material ratio was set at 40, 45, 50, 55, 60 and 65, while other extraction condition were tested with a fixed microwave temperature, ethanol concentration and microwave power of 50 °C, 100% and 600 W, respectively. If ratio of water to raw material is too small, extract in raw material cannot be completely extracted.22 This is in consonance with this study that the chrysophanol yield increased with increasing liquid to raw material ratio, and reached highest value when the ratio was at 55 (Fig. 1D). When liquid to raw material ratio is increased, the extraction rate of extract also increases. This is conducive to facilitate complete immersion, enhance the swelling of plant material, and increase the contact surface area between the plant matrix and the solvent.29 However, when liquid to raw material ratio is too high, there will be a resultant extremely high swelling of the material25 and high process cost when liquid to raw material ratio is too big.29 This study revealed that the chrysophanol yield dropped from 55 to 65. Thus, the optimum ratio of liquid to raw material for this study was set at 55.
3.5. Optimization of the extraction conditions of rhubarb by Box–Behnken design
3.5.1. Statistical analysis and model fitting
Currently, the RSM is one of the most conventional approach to multivariate optimization analytical methodologies30 to improve the process31,32 and indicate the possible influences of some variables on others.33 RSM is also faster and more informative than the classical one-variable-at-a-time approach or the use of full factorial designs.34 Furthermore, RSM are central composite design (CCD) and Box–Behnken design (BBD),35 which has been successfully used for developing, improving and optimizing processes.36 Compared to CCD, BBD employs a reduced number of experimental runs, having higher efficiency35 that is obtained with the best conditions of resources37 for quadratic models,37 and is extensively used in RSM for three-level factors.32
To evaluate all identified parameters together, a total 17 runs BBD experiment, a multivariate technique based on the effects of the most impacting factors, was chosen to statistically optimize the extraction conditions of rhubarb based on the single-factor experiments. This experimental design is applied to optimize the conditions during a development process and is assorted as a rotatable or nearly rotatable second-order design based on the three independent variables including X1, X2 and X3 with experimental responses as shown in Table 3. In summary, the response values for Y1 ranged from 1.65 ± 0.05% to 2.5 ± 0.1%.
ANOVA for response surface quadratic model of rhubarba.
| Source | Sum of squares | df | Mean square | F value | p-Value |
|---|---|---|---|---|---|
| Model | 0.15 | 9 | 0.016 | 7.81 | 0.0065** |
| X 1 | 8.065 × 10⁻³ | 1 | 8.065 × 10⁻³ | 3.88 | 0.0895 |
| X 2 | 3.125 × 10⁻⁴ | 1 | 3.125 × 10⁻⁴ | 0.15 | 0.7097 |
| X 3 | 5.618 × 10⁻³ | 1 | 5.618 × 10⁻³ | 2.70 | 0.1442 |
| X 1 X 2 | 1.406 × 10⁻³ | 1 | 1.406 × 10⁻³ | 0.68 | 0.4379 |
| X 1 X 3 | 2.500 × 10⁻⁷ | 1 | 2.500 × 10⁻⁷ | 1.203 × 10⁻⁴ | 0.9916 |
| X 2 X 3 | 8.742 × 10⁻³ | 1 | 8.742 × 10⁻³ | 4.21 | 0.0794 |
| X 1 2 | 0.046 | 1 | 0.046 | 22.28 | 0.0022** |
| X 2 2 | 0.045 | 1 | 0.045 | 21.86 | 0.0023** |
| X 3 2 | 0.018 | 1 | 0.018 | 8.66 | 0.0216* |
| Residual | 0.015 | 7 | 2.078 × 10⁻³ | ||
| Lack of fit | 0.015 | 3 | 4.850 × 10⁻³ | ||
| Pure error | 0.000 | 4 | 0.000 | ||
| Cor total | 0.16 | 16 |
*Significant (p < 0.05), **significant (p < 0.01).
By applying multiple regression analysis on the experimental data, the relationship of the response variable and the test variables was described by the following second-order polynomial equation:Y = 0.83 − 0.032X1 + 6.250E − 0.047X2X3 − 0.1X12 − 0.1X22 − 0.065X32
The result of ANOVA for the adjusted model for Y is presented in Table 3. The model F-value of 7.81 and the p-value < 0.05 implied that the model was significant and well adapted to the response. It indicated that the model was highly significant. The results showed that the determination coefficient (R2) was 0.9062, which was in agreement with the adjusted Radj2 of 0.9701. It also indicated that the model was highly significant. At the same time, a relatively lower value of the coefficient of variation (C.V. = 6.6%) indicated a high degree of precision and reliability of the experiments carried out and the selected quadratic models exhibited high accuracy and significant reproducibility.38
3.5.2. Diagnostics of model adequacy
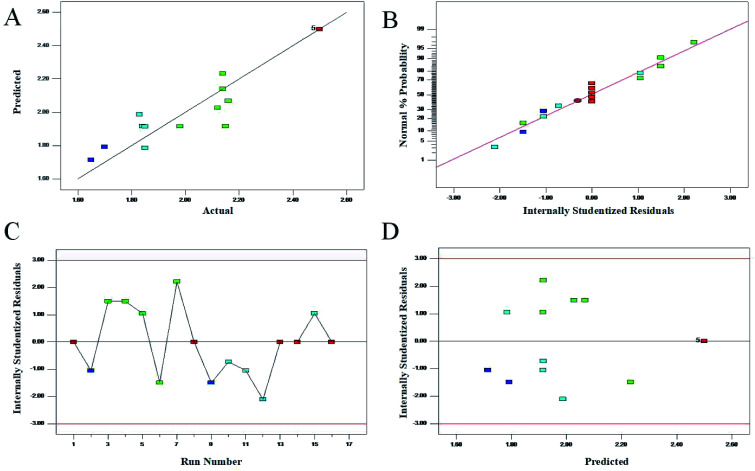
It was very important for model adequacy to check whether the approximating model would give poor or misleading results.39 The relationship between the predicted and actual values was used to evaluate the model suitability in Fig. 2A. It could be seen that the data lay almost close to the straight line, indicating a high degree of agreement between experimental and predicted data. In addition, the normal percentage probability plot of residuals for response was used to confirm the normal distribution of the data. As shown in Fig. 2B, no deviation of the variance was observed. Moreover, Fig. 2C and D showed that both the experimental points and the predicted response lay within the acceptable limits. Therefore, this mathematical model established by RSM was reliable in describing the extraction of chrysophanol chemicals that presented corresponding inhibition rate on rhubarb.
Fig. 2. Diagnostic plots for the model adequacy. (A) Plot of predicted versus the actual values; (B) the normal% probability plot; (C) plot of internally studentized residuals versus the experimental runs; (D) plot of internally studentized residuals versus the predicted response.
3.5.3. Analysis of response surfaces and verification of predictive model
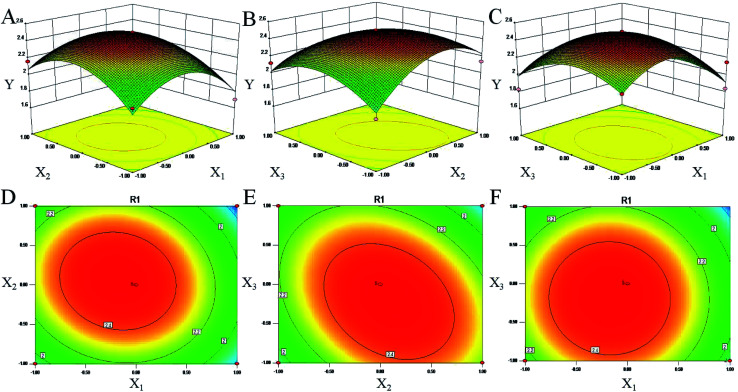
Response surface plots for each response condition and composite desirability function were also analyzed to optimize the formulation. 3D response surface plots, as presented in Fig. 3, were very useful to see the interaction effects of the factors on the responses.40 These types of plots showed effects of two factors on the response at a time. In all the presented figures, the third factor was kept at level zero. Level zeros for microwave temperature, microwave power and ethanol concentration were 50 °C, 500 W and 70%, respectively. Fig. 3A represents the effects of microwave temperature, microwave power and their reciprocal interactions on the yield of chrysophanol in rhubarb. An increase in the yield of chrysophanol in rhubarb was observed with the increase of microwave temperature and the microwave power at first but the trend was reversed when microwave temperature and microwave power reached 50 °C and 500 W, respectively. These data were consistent with the conclusion of the single factor test. Fig. 3B shows the three-dimensional plot of the response surface for the chrysophanol yield as related to ethanol concentration and microwave temperature. The yield of chrysophanol increased at first when microwave temperature was increased, but prolonging the contact temperature led to decrease in the chrysophanol yield. Fig. 3C shows the 3D plot of the response surface for the chrysophanol yield as related to ethanol concentration and microwave power. The amount of the yield of chrysophanol increased at first when microwave power was increased, but prolonging the contact power led to decrease in the chrysophanol yield. Therefore, all parameters of microwave temperature, ethanol concentration and microwave temperature would have independent optimal conditions.
Fig. 3. Response surface plots (three-dimensional) showing the effect of the ethanol concentration (X1, %), microwave temperature (X2, °C) and microwave power (X3, W) on the yield of chrysophanol (Y) in rhubarb. (A) represents the effects of X2, X3 and their reciprocal interactions on the yield of chrysophanol in rhubarb. (B) shows the three-dimensional plot of the response surface for the chrysophanol yield as related to X1 and X2. (C) shows the 3D plot of the response surface for the chrysophanol yield as related to X1 and X3. Contour plots (D–F) shows the effect of variables (X1, X2 and X3) on the chrysophanol yield.
Above all, the optimized conditions were 56.105 microwave temperature (°C), 539.190 microwave power (W) and 70.575 ethanol concentration (%) and a calculated predicted value of Y (2.64%). This similarity shows that the processing regression model is highly significant and can be used to predict the chrysophanol yield.
According to laboratory conditions, the values were corrected to 56 microwave temperature (°C), 540 microwave power (W) and 70 ethanol concentration (%) with 2.54 ± 0.07% of Y. There was no much difference between these values and the predicted values.
3.6. Identification and quantification of chrysophanol in rhubarb
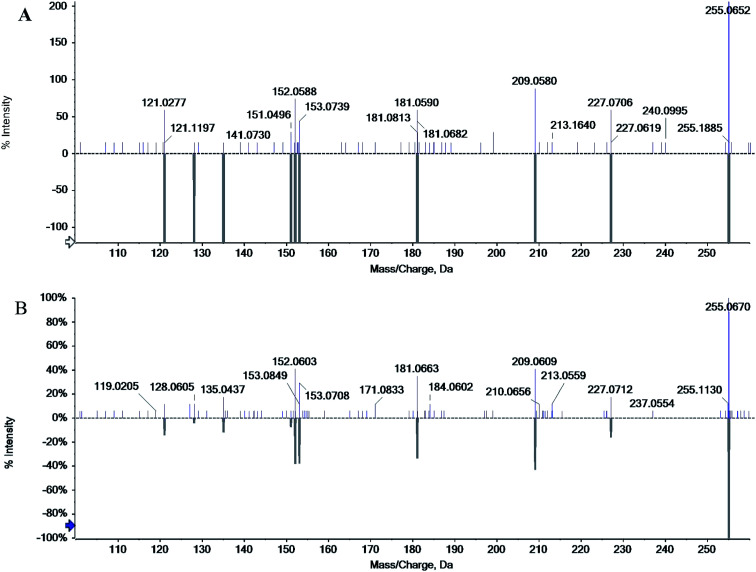
The chromatographic characteristics of chrysophanol such as retention time and molecular ions were established under the same experimental conditions as in rhubarb. The standard chrysophanol and sample analysis via ESI-MS in the positive ion mode are shown in Fig. 4, molecular cation was detected mainly in [M + H]+ form (m/z 255.0652 and 255.0670). Thus, all of these evidences confirmed the existence of chrysophanol in rhubarb.
Fig. 4. Mass spectra of standard chrysophanol (A) and chrysophanol in rhubarb (B) in positive mode.
3.7. Biofilm inhibition properties of chrysophanol
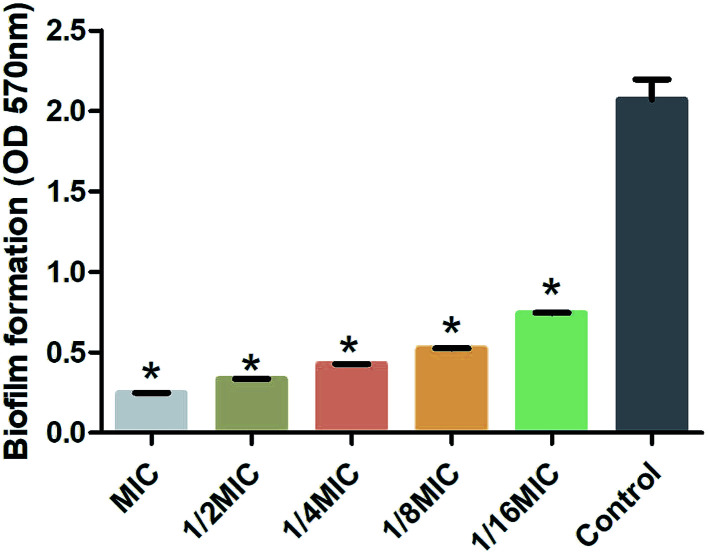
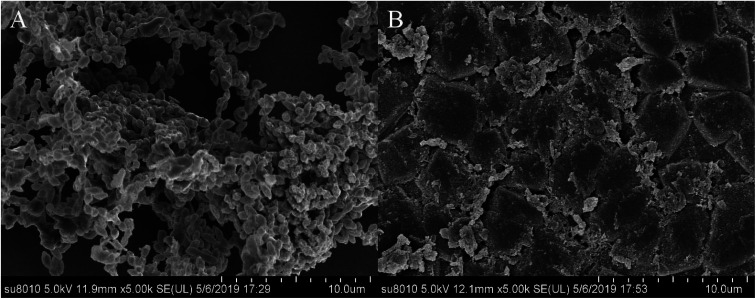
S. suis, an important and highly contagious zoonotic pathogen, is causing a variety of life-threatening infections that include arthritis, septicemia, meningitis, and even sudden death in swine and human.41–43 In recent years, due to the abuse of antibiotics, the increasing resistance of S. suis has seriously threatened the global pig industry and human life safety. It is important to control the formation of S. suis biofilm in the fight against bacterial diseases in pigs.44 Previous studies have shown that one of the main ingredients of rhubarb water extract can inhibit S. suis biofilm formation.1 However, it was difficult to know the active ingredient in rhubarb that was responsible for inhibiting the formation of biofilm in S. suis. Thus, the study involves the evaluation of the biofilm inhibitory properties of chrysophanol against S. suis biofilm formation (Fig. 5 and 6). The results showed that the minimum inhibitory concentration (MIC) of chrysophanol against S. suis was 1.975 μg mL−1. And all of 1/2 MIC, 1/4 MIC, 1/8 MIC and 1/16 MIC, of chrysophanol had a significant ability to inhibit S. suis biofilm formation (p < 0.05) compared with control (Fig. 5). Interestingly, we have further used the SEM method to confirm this finding. As shown in the control (Fig. 6A), a thick biofilm made of aggregates and microcolonies of S. suis almost completely covered the surface of the rough glass slide. S. suis molecules closely connected with each other, and formed a three-dimensional biofilm community structure with multiple layers and aggregates. The biofilm can block the external drug from entering the biofilm to exert its efficacy. However, after adding 1/2 MIC chrysophanol (0.99 μg mL−1) to S. suis (Fig. 6B), the three-dimensional structure of the bacterial biofilm was destroyed. Bacterial molecules exhibited a single molecule state, and no biomembrane structure was formed by intermolecular interconnection. This is the first report confirming that chrysophanol can inhibit the formation of S. suis biofilm. Thus, it was speculated that chrysophanol in rhubarb has potential clinical therapeutic value for solving the problem of increasing bacterial resistance related to biofilm of S. suis.
Fig. 5. Inhibitory effect on biofilm formation by Streptococcus suis (n = 5, x̄ ± SD) on the chrysophanol standard. Asterisk indicates significantly different (*p < 0.05) compared to untreated control bacteria.
Fig. 6. Scanning electron micrographs of Staphylococcus suis biofilm following growth in THB supplemented with control (A) or 1/2 MIC (0.9875 μg mL−1) of chrysophanol (B). Controls refer to the absence of chrysophanol.
4. Conclusion
In conclusion, we successfully acquired the optimum yield of chrysophanol from rhubarb by single-factor experiments and RSM. RSM confirmed that the optimal extraction conditions were microwave temperature 56 °C, microwave power 540 W, and ethanol concentration 70%. Under these conditions, the yield of chrysophanol was 2.54 ± 0.07%, which was not too different from the predicted result of 2.64%. At the same time, the chemical structure of the extracted chrysophanol was identified by LC-MS. Finally, chrysophanol inhibited the formation of S. suis biofilm. The novelty of this work lies in the use of single-factor experiments and RSM to acquire the optimum yield of chrysophanol which inhibited the biofilm formation of S. suis. Chrysophanol may be the main active ingredient in rhubarb which caused the inhibition of S. suis biofilm formation. Taken together, these data suggest that chrysophanol could be further investigated as a potential therapeutic drug that can be used to solve the problem of increasing bacterial resistance.
Author contributions
YY designed the whole experiment; J.-W. B. directed the completion of the experiment; X.-R. C. analyzed the data, and wrote the paper; YT, W.-Q. C., D.-L. L., BG provided help during the experiment.
Funding
This work was financially supported by Heilongjiang Province Natural Science Foundation (grant number C2018013), China Agriculture Research System (35), Project Science and Technology Bureau of Harbin (grant number 2017RAQXJ033) and Heilongjiang Postdoctoral Foundation (grant number LBH-Q17030).
Conflicts of interest
The authors declare no competing financial interest.
Supplementary Material
References
- Ding W. Sun J. Lian H. Xu C. Liu X. Zheng S. Zhang D. Han X. Liu Y. Chen X. God'spower B. O. Li Y. Front. Pharmacol. 2018;9:1–8. doi: 10.3389/fphar.2018.00001. [DOI] [PMC free article] [PubMed] [Google Scholar]
- Lu C.-C. Yang J.-S. Huang A.-C. Hsia T.-C. Chou S.-T. Kuo C.-L. Lu H.-F. Lee T.-H. Wood W. G. Chung J.-G. Mol. Nutr. Food Res. 2010;54:967–976. doi: 10.1002/mnfr.200900265. [DOI] [PMC free article] [PubMed] [Google Scholar]
- Prateeksha M. A. Y. Singh B. N. Sudheer S. Kharwar R. N. Siddiqui S. Abdel-Azeem A. M. Fraceto L. F. Dashora K. Gupta V. K. Biomolecules. 2019;9:1–24. doi: 10.3390/biom9020068. [DOI] [PMC free article] [PubMed] [Google Scholar]
- Tu Y. Sun W. Wan Y. G. Gao K. Liu H. Yu B. Y. Hu H. Huang Y. R. J. Ethnopharmacol. 2014;156:115–124. doi: 10.1016/j.jep.2014.08.035. [DOI] [PubMed] [Google Scholar]
- Luo L. Wang S.-M. Zhongyaocai. 2013;36:654–657. [PubMed] [Google Scholar]
- Shia C.-S. Hou Y.-C. Juang S.-H. Tsai S.-Y. Hsieh P.-H. Ho L.-C. Chao P.-D. L. Evid.-Based Complementary Altern. Med. 2011:1–9. doi: 10.1093/ecam/nep124. [DOI] [PMC free article] [PubMed] [Google Scholar]
- Onoda T. Li W. Sasaki T. Miyake M. Higai K. Koike K. J. Ethnopharmacol. 2016;186:84–90. doi: 10.1016/j.jep.2016.03.063. [DOI] [PubMed] [Google Scholar]
- Malik E. M. Muller C. E. Med. Res. Rev. 2016;36:705–748. doi: 10.1002/med.21391. [DOI] [PubMed] [Google Scholar]
- Lu C. Wang H. Lv W. Xu P. Zhu J. Xie J. Liu B. Lou Z. Fish. Sci. 2011;77:375–384. doi: 10.1007/s12562-011-0341-z. [DOI] [Google Scholar]
- Ding W. Y. Li Y. H. Lian H. Ai X. Y. Zhao Y. L. Yang Y. B. Han Q. Liu X. Chen X. Y. He Z. G. Front. Pharmacol. 2017;8:1–9. doi: 10.3389/fphar.2017.00425. [DOI] [PMC free article] [PubMed] [Google Scholar]
- Gallo M. Formato A. Ianniello D. Andolfi A. Conte E. Ciaravolo M. Varchetta V. Naviglio D. J. Supercrit. Fluids. 2017;119:104–112. doi: 10.1016/j.supflu.2016.09.012. [DOI] [Google Scholar]
- Subramanian R. Subbramaniyan P. Ameen J. N. Raj V. Arabian J. Chem. 2016;9:S537–S540. doi: 10.1016/j.arabjc.2011.06.022. [DOI] [Google Scholar]
- Bogialli S. Curini R. Di Corcia A. Lagana A. Mele M. Nazzari M. J. Chromatogr. A. 2005;1067:93–100. doi: 10.1016/j.chroma.2004.10.033. [DOI] [PubMed] [Google Scholar]
- Sun H. Li C. Ni Y. Yao L. Jiang H. Ren X. Fu Y. Zhao C. Carbohydr. Polym. 2019;206:557–564. doi: 10.1016/j.carbpol.2018.11.010. [DOI] [PubMed] [Google Scholar]
- Jacotet-Navarro M. Rombaut N. Deslis S. Fabiano-Tixier A. S. Pierre F. X. Bily A. Chemat F. Green Chem. 2016;18:3106–3115. doi: 10.1039/C5GC02542G. [DOI] [Google Scholar]
- Teixeira S. Delerue-Matos C. Santos L. Sci. Total Environ. 2019;646:168–176. doi: 10.1016/j.scitotenv.2018.07.204. [DOI] [PubMed] [Google Scholar]
- Sharma P. Singh L. Dilbaghi N. J. Hazard. Mater. 2009;164:1024–1029. doi: 10.1016/j.jhazmat.2008.08.104. [DOI] [PubMed] [Google Scholar]
- Montgomery D. C. Environ. Prog. Sustainable Energy. 2013;32:8–10. doi: 10.1002/ep.11743. [DOI] [Google Scholar]
- Liu Y.-Y. Chen X.-R. Gao L.-F. Chen M. Cui W.-Q. Ding W.-Y. Chen X.-Y. God'spower B.-O. Li Y.-H. Front. Pharmacol. 2018;9:1–10. doi: 10.3389/fphar.2018.00001. [DOI] [PMC free article] [PubMed] [Google Scholar]
- Chen X.-R. Wang X.-T. Hao M.-Q. Zhou Y.-H. Cui W.-Q. Xing X.-X. Xu C.-G. Bai J.-W. Li Y.-H. Front. Chem. 2017;5:1–8. doi: 10.3389/fchem.2017.00098. [DOI] [PMC free article] [PubMed] [Google Scholar]
- Sun J. Chu Y.-F. Wu X. Liu R. H. J. Agric. Food Chem. 2002;50:7449–7454. doi: 10.1021/jf0207530. [DOI] [PubMed] [Google Scholar]
- Sheng Z. Li J. Li Y. Afr. J. Biotechnol. 2011;10:11728–11737. [Google Scholar]
- Xue H.-Y. Li J.-R. Liu Y.-G. Gao Q. Wang X.-W. Zhang J.-W. Tanokura M. Xue Y.-L. Int. J. Biol. Macromol. 2019;121:1186–1193. doi: 10.1016/j.ijbiomac.2018.10.126. [DOI] [PubMed] [Google Scholar]
- Peiro S. Gordon M. H. Blanco M. Perez-Llamas F. Segovia F. Almajano M. P. Antioxidants. 2014;3:684–699. doi: 10.3390/antiox3040684. [DOI] [PMC free article] [PubMed] [Google Scholar]
- Guo C.-Y. Wang J. Hou Y. Zhao Y.-M. Shen L.-X. Zhang D.-S. Pharmacogn. Mag. 2013;9:192–195. doi: 10.4103/0973-1296.113260. [DOI] [PMC free article] [PubMed] [Google Scholar]
- Kwon J. H. Lee G. D. Belanger J. M. R. Pare J. R. J. Int. J. Food Sci. Technol. 2003;38:615–622. doi: 10.1046/j.1365-2621.2003.00688.x. [DOI] [Google Scholar]
- Perez L. Conde E. Dominguez H. Process Biochem. 2014;49:981–988. doi: 10.1016/j.procbio.2014.02.020. [DOI] [Google Scholar]
- Govender S. Pillay V. Chetty D. J. Essack S. Y. Dangor C. M. Govender T. Int. J. Pharm. 2005;306:24–40. doi: 10.1016/j.ijpharm.2005.07.026. [DOI] [PubMed] [Google Scholar]
- Wang Y. X. Lu Z. X. Process Biochem. 2005;40:1043–1051. doi: 10.1016/j.procbio.2004.03.012. [DOI] [Google Scholar]
- Carlos Martinez-Patino J. Gullon B. Romero I. Ruiz E. Brncic M. Zlabur J. S. Castro E. Ultrason. Sonochem. 2019;51:487–495. doi: 10.1016/j.ultsonch.2018.05.031. [DOI] [PubMed] [Google Scholar]
- Naderi P. Shirani M. Semnani A. Goli A. Ecotoxicol. Environ. Saf. 2018;163:372–381. doi: 10.1016/j.ecoenv.2018.07.091. [DOI] [PubMed] [Google Scholar]
- Londhe V. Shirsat R. AAPS PharmSciTech. 2018;19:1392–1400. doi: 10.1208/s12249-018-0954-y. [DOI] [PubMed] [Google Scholar]
- Gomes S. V. F. Portugal L. A. dos Anjos J. P. de Jesus O. N. de Oliveira E. J. David J. P. David J. M. Microchem. J. 2017;132:28–35. doi: 10.1016/j.microc.2016.12.021. [DOI] [Google Scholar]
- Singh B. Sharma H. K. Sarkar B. C. J. Food Sci. Technol. 2012;49:294–308. doi: 10.1007/s13197-011-0276-5. [DOI] [PMC free article] [PubMed] [Google Scholar]
- Tak J. W. Gupta B. Thapa R. K. Woo K. B. Kim S. Y. Go T. G. Choi Y. Choi J. Y. Jeong J.-H. Choi H.-G. Yong C. S. Kim J. O. AAPS PharmSciTech. 2017;18:1125–1134. doi: 10.1208/s12249-016-0580-5. [DOI] [PubMed] [Google Scholar]
- Liyana-Pathirana C. Shahidi F. Food Chem. 2005;93:47–56. doi: 10.1016/j.foodchem.2004.08.050. [DOI] [PubMed] [Google Scholar]
- Los F. G. B. Zielinski A. A. F. Wojeicchowski J. P. Nogueira A. Demiate I. M. Food Anal. Methods. 2019;12:148–159. doi: 10.1007/s12161-018-1347-2. [DOI] [Google Scholar]
- Vyavahare G. D. Gurav R. G. Jadhav P. P. Patil R. R. Aware C. B. Jadhav J. P. Chemosphere. 2018;194:306–315. doi: 10.1016/j.chemosphere.2017.11.180. [DOI] [PubMed] [Google Scholar]
- Xu Y. Zhang L. Yang Y. Song X. Yu Z. Carbohydr. Polym. 2015;117:895–902. doi: 10.1016/j.carbpol.2014.10.032. [DOI] [PubMed] [Google Scholar]
- Li X. Y. Liu Z. Q. Chi Z. M. Bioresour. Technol. 2008;99:6386–6390. doi: 10.1016/j.biortech.2007.11.065. [DOI] [PubMed] [Google Scholar]
- Wang Y. Zhang W. Wu Z. Zhu X. Lu C. Vet. Microbiol. 2011;152:151–160. doi: 10.1016/j.vetmic.2011.04.029. [DOI] [PubMed] [Google Scholar]
- Wang Y. Zhang W. Wu Z. F. Zhu X. L. Lu C. P. Vet. Microbiol. 2011;152:151–160. doi: 10.1016/j.vetmic.2011.04.029. [DOI] [PubMed] [Google Scholar]
- Wang S. Yang Y. B. Zhao Y. L. Zhao H. H. Bai J. W. Chen J. Q. Zhou Y. H. Wang C. Li Y. H. Front. Microbiol. 2016;7:1–9. doi: 10.3389/fmicb.2016.00384. [DOI] [PMC free article] [PubMed] [Google Scholar]
- Wang Y. Yi L. Wu Z. Shao J. Liu G. Fan H. Zhang W. Lu C. PLoS One. 2012;7:1–8. doi: 10.1371/journal.pone.0033371. [DOI] [PMC free article] [PubMed] [Google Scholar]


