Abstract
Inorganic salts (LiCl) were induced to improve the ratio of β and α of PVDF by the solution method. The vibrational spectra of PVDF polymorphic polymers were obtained by Fourier transform infrared spectroscopy (FTIR), and the results showed that the ratio of β and α of pristine PVDF was elevated from 43.66% to 53.27%. A small amount of LiCl grains was detected to be decorated on the surface of LiCl-involved electrodes by the SEM and EDS tests. The rate capability of the modified samples was evaluated when charge-discharged at 5C. The capacity of the 1/10LiCl@PVDF samples remained at a high level of 71.64% when charge-discharged at 5C, which was much higher than the value of 54.66% for pristine samples. The results of the CV and EIS tests revealed that the electrochemical polarization increasing rate and charge transfer resistance of the 1/10LiCl@PVDF samples were smaller than those of the pristine PVDF samples.
Inorganic salts (LiCl) were induced to improve the ratio of β and α of PVDF by the solution method.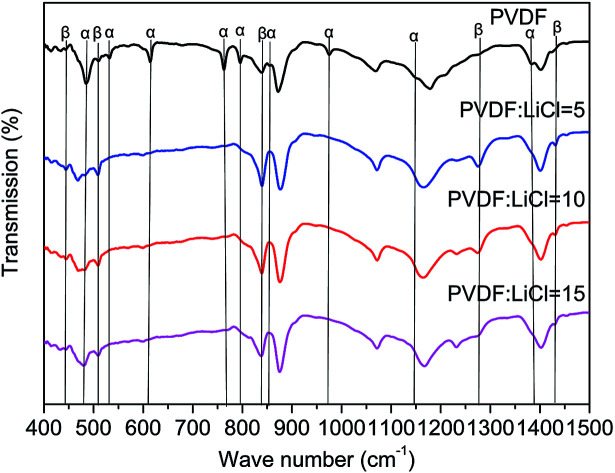
Introduction
Currently, with high energy density, high power, low cost, excellent cycle performance, and long calendar life, lithium-ion batteries (LIBs) have been one of the candidates for energy storage systems applied for plug-in electric vehicles (PEVs), hybrid electric vehicles (HEVs) and electric vehicles (EVs).1–6 The binders for LIBs are used to adhere active materials and conductive additives to a current collector. Although the binders are electrochemically inactive materials for batteries, they have a significant influence on the electrochemical performance of LIBs.7,8
Recently, binders for the electrodes in LIBs have been studied by many researchers. Fu et al.7 studied the composite of MA-g-PVDF as a binder for the LiCoO2 cathode in LIBs; the results displayed that the composite further lowered crystallinity compared with PVDF, and the rate capability and cycle stability were boosted compared to those of the PVDF binder. Zhong et al.8 compared the polyacrylic latex (LA132) to CMC and PVDF for the LiNi1/3Co1/3Mn1/3O2 (NCM) cathodes in LIBs, and it was concluded that the NCM cathode with the LA132 binder exhibited better cycle stability and rate capability than the cathodes fabricated with CMC and PVDF. Xu et al.9 used carboxymethyl cellulose (CMC), PVDF, and alginate as binders for the LiNi1/3Co1/3Mn1/3 (NCM) cathodes and revealed that rate capability with the cathodes of the CMC binder was the best. Poly(vinylidene difluoride) (PVDF) has been widely used as the binder for positive and negative electrodes in LIBs due to its excellent electrochemical stability and high adhesion.7,10 PVDF is bestowed with five distinct polymorphs referred to as α-, β-, γ-, δ- and ε-phases.11–13 P. Martins and his group14,15 discussed the study of the phase nucleation of PVDF by different particles and their dependence on surface charge. β-PVDF has maximum piezoelectric, ferroelectric, pyroelectric and dielectric properties than other phases, and it has been widely used in the field of sensors, actuators, nanogenerators and so on.16–21 C. M. Costa et al.22 studied the application of PVDF polymers and copolymers for lithium-ion batteries. At present, there are different methods for preparing β-PVDF, such as mechanical stretching,23–25 the use of high pressure,26,27 the addition of an external electric field,28–31 or the addition of a nucleating filler.32–35 The nucleation of the beta phase by salts and ionic liquids has been extensively evaluated by D. M. Correia et al.36,37
However, little research has been conducted on the effect of the transformation ratio of the β/α phase on the performance of lithium-ion batteries.38 Herein, the phase rate of β and α of PVDF was optimized by inorganic salts (LiCl) with the solution method, and the influence of PVDF with diverse ratios of the β/α phase on the performance of batteries was further explored.
Experimental
Commercial LiNi1/3Co1/3Mn1/3 (NCM) powder (Shenzhen, N8-L) with a mass ratio of 8 : 1 : 1, conductive additive Super P (40 nm), polyvinylidene fluoride (PVDF, AR) binder, and anhydrous LiCl were used as the experimental materials. First, the materials were dried in a vacuum oven at 0.085 mPa at 100 °C for 12 hours, and the moisture content of the materials was maintained at 500 ppm. Next, certain amounts of anhydrous LiCl and PVDF powders with mass ratios of 0, 1 : 5, 1 : 10 and 1 : 15 were stirred in beakers containing NMP solvent at 60 °C for 500 rpm, and the stirring was carried out for 2 h to prepare the binder with a concentration of 20 mg ml−1. Then, the NCM powder and Super-P in the ratio of 8 : 1 were stirred into a prepared binding agent for 24 h to obtain a uniform slurry. The aluminum foil was tiled on the automatic coating machine. After vacuum, the slurry was introduced into the scraper, and the push bar switch was opened to adjust the pushing speed to make the coating layer smooth and even. Finally, the foil was dried at 110 °C in a vacuum oven for 12 h, and the dried cathodes were roll-pressed with a roller press and put into a vacuum drying oven for 12 h.
The cathodes, lithium foil, diaphragm of Celgard 2400, and the cleaned battery case set of CR2025 were placed into a glove box (Universal (2440/750)) with an oxygen content of less than 0.1 ppm. The electrolyte consisting of 1 M LiPF6 in DC/EC (1 : 1 vol%) was adopted. All the cells were allowed to age for 24 h before testing. Herein, the prepared pristine and modified cathodes for cells were defined as pristine PVDF, 1/5LiCl@PVDF, 1/10LiCl@PVDF, and 1/15LiCl@PVDF samples.
The crystalline structures of pristine and modified samples were characterized by X-ray diffraction (XRD, D2-Phaser) using Cu Kα radiation. The scan range was 10°–70° with 40 mA tube current, 40 kV tube voltage, and a scan speed of 0.03° per minute. The morphology of the samples was detected by a Scanning Electron Microscope (SEM, Hitachi, S-4800). The crystal phase of PVDF was analyzed by an infrared spectrometer (FTIR, PerkinElmer, Spectrum Two).
The electrochemical performances of the samples were evaluated by the Charge–Discharge tests of a Land CT2001A battery test system with the cut-off of 2.5 V and 4.3 V (versus Li/Li+) and discharged at the rates of 0.2C, 0.5C, 1C, 2C, 3C, 4C, and 5C. Cyclic Voltammetry (CV, CHI660E) test s-1 was done with cell coins in the voltage range at 2.5 V and 4.3 V (versus Li/Li+) at the scanning rates of 0.1 mV s−1 and 0.6 mV s−1. Data analysis adopted the software Jade 6.5. The electrochemical impedance spectroscopy (EIS, CHI660E) test was also completed in the frequency range from 100 kHz to 0.01 Hz with an AC signal amplitude of 10 mV. Data analysis used the software ZSim Demo 3.30d.
Discussion and results
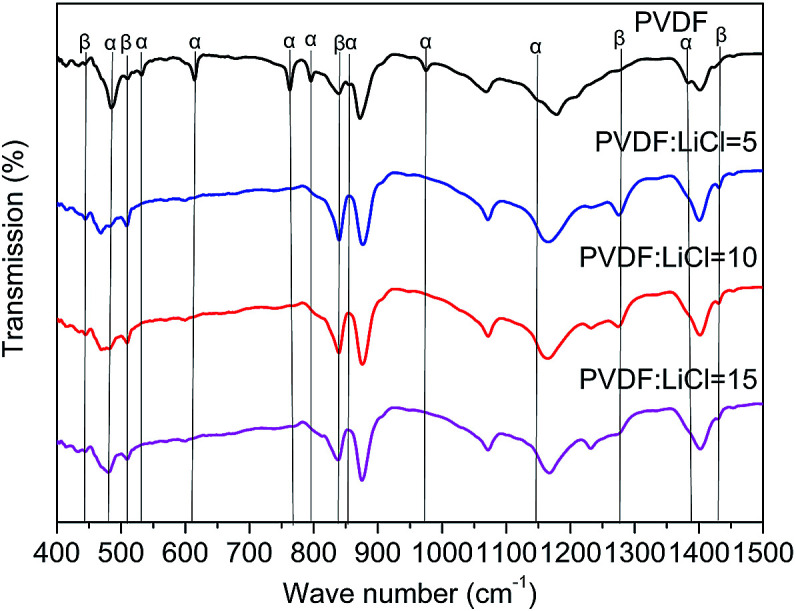
As seen in Fig. 1, the β-phase PVDF is generated at the wavenumbers of 444, 510, 840, 1274 and 1423, and the crystal peaks of the β phase of the modified samples are significantly enhanced. The FTIR characteristic diffraction peaks of α- and β-phase PVDF are summarized in Table 1. According to the Beer–Lambert law, based on the absorption peaks of the α and β phases, the FTIR results were used for the relative fraction of the β phase. The absorption coefficients at the wavenumbers of the Kα and Kβ values were 6.1 × 10⁴ and 7.7 × 104 cm2 mol−1, respectively. At the characteristic peaks of 763 and 840 cm−1 of the α phase, the relative fraction of the β phase can be given by39,40
 |
1 |
where Xα and Xβ are the crystalline solid contents of α phase and β phase; Aα and Aβ are the absorbance at 840 and 763 cm−1, respectively.
Fig. 1. FTIR spectra of modified PVDF and PVDF.
FTIR characteristic diffraction peaks of α- and β-phase PVDF.
| Crystalline phases | α | β |
| Wavenumber (cm−1) | 485 | 444 |
| 532 | 510 | |
| 614 | 840 | |
| 763 | 1274 | |
| 796 | 1423 | |
| 855 | ||
| 975 | ||
| 1148 | ||
| 1384 |
According to the eqn (1), it can be determined that the F(β) values of the pristine PVDF, 1/5LiCl@PVDF, 1/10LiCl@PVDF, and 1/15LiCl@PVDF samples are equal to 45.78%, 67.2%, 61.5%, and 54.56%, respectively. The results display that the phase ratio of β/α of PVDF of the modified samples has improved compared to that for the pristine samples.
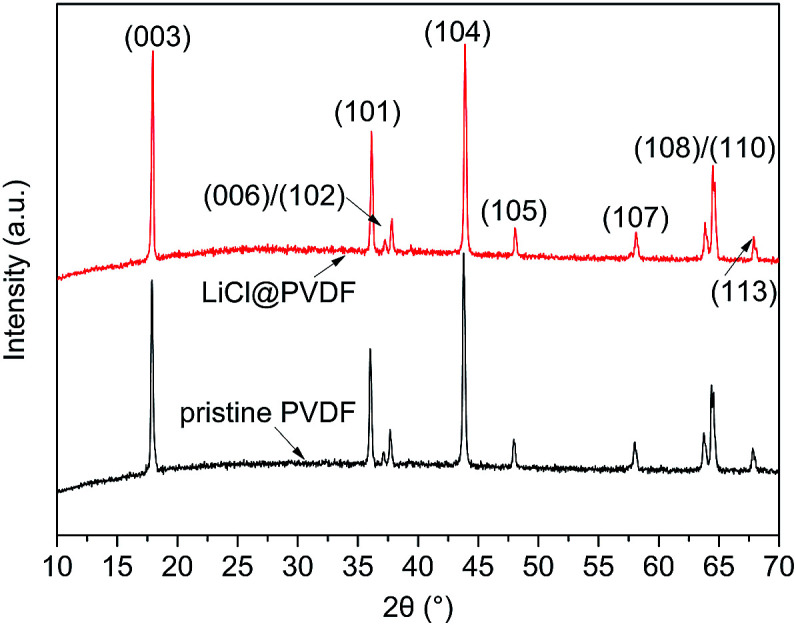
Fig. 2 shows the XRD patterns of the pristine PVDF and modified PVDF samples. All the diffraction peaks of the samples are well indexed to the hexagonal α-NaFeO2 structure with the R3m space group, and the XRD pattern of the modified cathodes has no obvious changes in the two theta positions and no other impurity phases. The two theta positions at 18.0°, 36.0°, 37.2°, 37.8°, 43.7°, 48.0°, 58.0°, 63.7°, 64.3° and 67.6° can be assigned to the X-ray diffraction from the planes of (003), (101), (006), (102), (104), (105), (107), (108), (110) and (113), respectively.
Fig. 2. XRD patterns of the pristine PVDF and LiCl@PVDF cathodes.
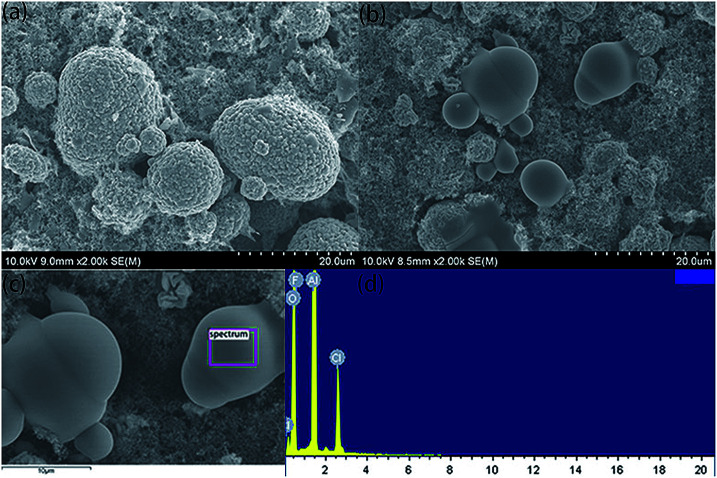
The SEM morphologies of the pristine and modified samples are shown in Fig. 3. It can be seen from Fig. 3(a) and (b) that the spherical crystals are NCM. There are some non-angular particles dotted on the modified electrode. EDS tests were conducted to clarify the composition of these particles, and the results are shown in Fig. 3(c) and (d). The results confirm that the non-angular particles on the NCM cathodes are LiCl possibly derived from the precipitation of LiCl when the samples are dried at 110 °C.
Fig. 3. SEM topography of the pristine PVDF (a) and LiCl@PVDF (b) cathodes and EDS spectrum of LiCl@PVDF cathodes (c) and (d).
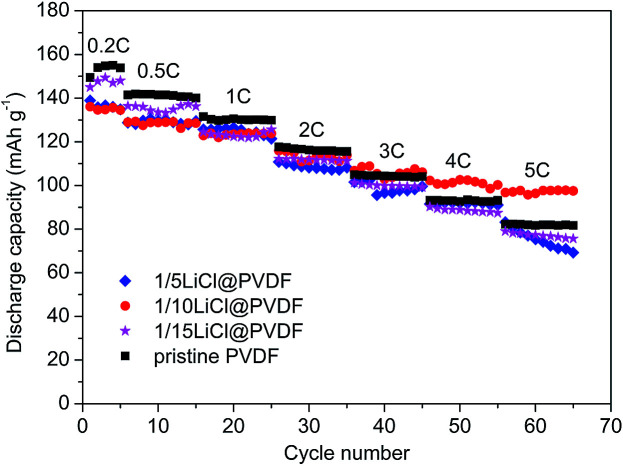
Fig. 4 compares the rate capability of the pristine PVDF and LiCl@PVDF samples. The cells were galvanostatically charged to 4.3 V and discharged to 2.5 V at different rates at room temperature. As the rate increased, the discharge specific capacity of the samples decreased. At 0.2C rate, the initial discharge capacities of the pristine PVDF, 1/5LiCl@PVDF, 1/10LiCl@PVDF and 1/15LiCl@PVDF samples were 149.48 mA h g−1, 138.94 mA h g−1, 136.12 mA h g−1, and 145.01 mA h g−1, respectively. After 10 cycles at 5C, the discharge capacities of the pristine and modified samples decreased to 81.7 mA h g−1, 69.21 mA h g−1, 97.52 mA h g−1, and 75.65 mA h g−1, corresponding to the capacity retention of the samples with 54.66%, 49.81%, 71.64%, and 52.17%. Comparatively, the capacity degradation of the 1/10LiCl@PVDF samples was much slower. This indicates that the 1/10LiCl@PVDF-modified samples effectively improve the rate capability of a lithium-ion battery; in contrast, the rate capability of the 1/5LiCl@PVDF samples is poorer than that of the pristine samples. It can be analyzed that an increase in the β crystal content can elevate the rate capability of the modified samples, but an excessive content of β crystals affects the capacity of the modified samples at a high rate. However, the slight reduction in the capacity of the modified samples may result from the fact that the adhesion is lowered due to the decrease in the crystal form content, thereby reducing the capacity of the battery. In addition, excessive dotted LiCl on the surface of the modified cathodes may block the diffusion of Li+, which can reduce the discharge capacity of the modified samples.
Fig. 4. The rate test of the pristine PVDF and LiCl@PVDF samples.
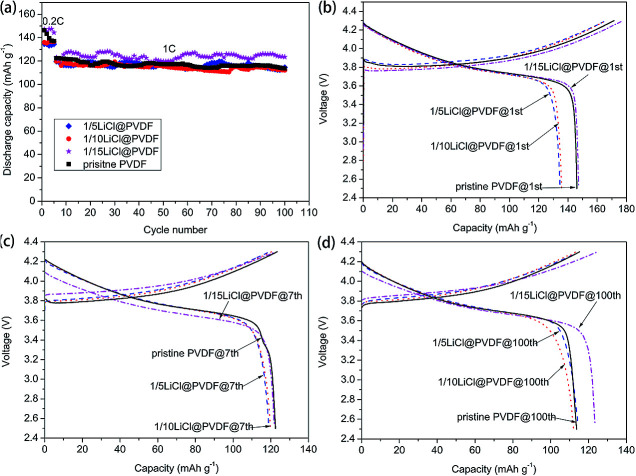
The cycle performance and the galvanostatic charge–discharge curves of the pristine PVDF and LiCl@PVDF samples are exhibited in Fig. 5. The prepared samples were charged and discharged at 0.2C rate for 5 cycles. The initial discharge capacities of the pristine PVDF, 1/5LiCl@PVDF, 1/10LiCl@PVDF and 1/15LiCl@PVDF samples were 146.4 mA h g−1, 134.56 mA h g−1, 135.95 mA h g−1, and 147.15 mA h g−1, respectively. The discharge capacities of the pristine and modified samples decreased to 113.71 mA h g−1 and 114.59 mA h g−1, 112.24 mA h g−1, and 123.56 mA h g−1 after 100 cycles at 1C rate, corresponding to the capacity retention of 77.67%, 85.16%, 82.56%, and 83.97%. On the one hand, the increase in the β crystal form content enhances the electrical activity of the PVDF binder during the charge and discharge processes; on the other hand, adhesion may be lowered due to the decrease in the α crystal form content. As a result, part of the positive cathodes was detached into the electrolyte, thereby reducing the capacity of the battery. Another possible reason is that LiCl is partially dissolved in the electrolyte, which increases the concentration of Li+ in the battery, thereby increasing the conductivity of the battery. Therefore, the cycle stability of the modified samples was slightly improved compared to that of the pristine PVDF samples. The discharge capacities of the 1st cycle, 7th cycle and 100th cycle of the pristine and modified PVDF samples are presented in Fig. 5(b), (c), and (d), respectively.
Fig. 5. The cycle performance (a) and charge–discharge curves (b)–(d) of the pristine PVDF and LiCl@PVDF samples.
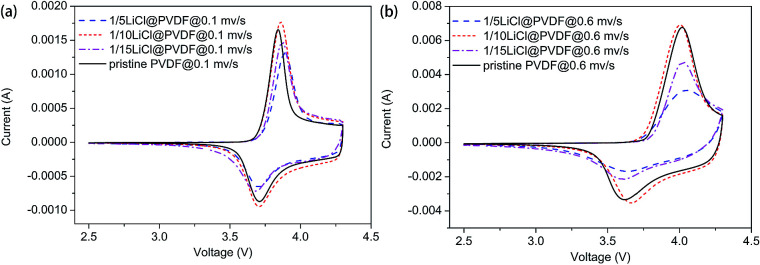
In Fig. 6, we can see that the cyclic voltammetry (CV) curves of the pristine PVDF and LiCl@PVDF samples overlap. The CV curves at the scanning rates of 0.1 mV s−1 and 0.6 mV s−1 are compared in Fig. 6(a) and (b). The peak differences of the pristine PVDF and 1/5, 1/10, 1/15 LiCl@PVDF samples at a scanning rate of 0.1 mV s−1 were 0.133 V, 0.1855 V, 0.149 V, and 0.188 V, respectively. In contrast, the peak differences of all the samples at a scanning rate of 0.6 mV s−1 were 0.404 V and 0.4119 V, 0.338 V, and 0.42 V. The results are consistent with those shown in Fig. 4.
Fig. 6. The cyclic voltammetry of the pristine PVDF and LiCl@PVDF samples.
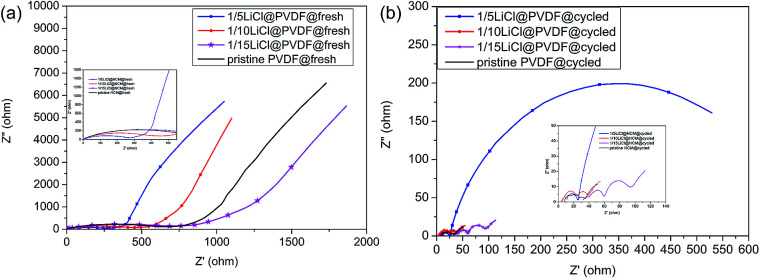
To further study the electrochemical performance, the Nyquist plots of the fresh and cycled pristine PVDF and LiCl@PVDF samples are revealed in Fig. 7. Before cycling, it can be presented that the samples that have a semicircle in the high-frequency region correspond to charge transfer resistance with the diameter of the semicircles giving the Rct value and the sloping line at the low-frequency region displays lithium-ion diffusion in the bulk material. The 1/15LiCl@PVDF and pristine PVDF samples exhibited a semicircle of a bigger diameter than the 1/5LiCl@PVDF and 1/10LiCl@PVDF samples. After 13 cycles, the EIS spectra of pristine PVDF, 1/10LiCl@PVDF, and 1/15LiCl@PVDF show three semicircles and one slope, and the spectra of the 1/5LiCl@PVDF sample have two semicircles, representing the lithium-ion diffusion through the SEI layer and charge transfer reaction. The semicircles in the high-frequency, high-to-medium frequency, and medium-frequency regions correspond to the lithium-ion diffusion through the SEI layer, the transport process of electrons in the active materials, and charge transfer reaction, with the diameter of the semicircle giving the RSEI, Re, and Rct values. Besides, the slope in the low-frequency region represents lithium-ion diffusion in the bulk materials.41,42 The RSEI, Re, and Rct values of the fresh and cycled pristine PVDF and LiCl@PVDF samples are revealed in Table 2. From Table 2, we can infer that the Rct values of the cycled pristine PVDF, 1/10LiCl@PVDF, and 1/15LiCl@PVDF samples decrease, while that of the 1/5LiCl@PVDF samples increases compared to that of the fresh samples. This indicates that the 1/10LiCl@PVDF samples have a lower increasing rate of electrochemical polarization compared to the pristine samples.
Fig. 7. The electrochemical impedance spectra (EIS) Nyquist plots of the fresh (a) and the 13-cycled (b) pristine PVDF and LiCl@PVDF samples.
The RSEI, Re, and Rct values of the fresh and 13-cycled pristine and modified PVDF samples.
| Samples | States | R SEI (Ω) | R e (Ω) | R ct (Ω) |
|---|---|---|---|---|
| Pristine PVDF | Fresh | — | 581.3 | |
| Cycled | 3.806 | 13.59 | 16.52 | |
| 1/5LiCl@PVDF | Fresh | — | — | 239.6 |
| Cycled | 14.42 | — | 595.1 | |
| 1/10LiCl@PVDF | Fresh | — | — | 178.2 |
| Cycled | 6.714 | 8.145 | 13.32 | |
| 1/15LiCl@PVDF | Fresh | — | — | 572.7 |
| Cycled | 19.26 | 7.674 | 24.33 |
Conclusions
In this work, the phase ratio of β and α of PVDF was optimized with an inorganic salt LiCl via the solution method. F(β) of 1/10LiCl@PVDF samples was 49.53%. The batteries prepared with the 1/10LiCl@PVDF samples exhibited better rate capability with high discharge capacity retention of 71.64% at 5C compared to that at 0.2C after 65 cycles between 2.5 V and 4.3 V, and the cycle stability was slightly improved. Furthermore, the increased rate performance was due to the lower rate of electrochemical polarization of the 1/10LiCl@PVDF samples at a higher voltage scan rate. Hence, the overall electrochemical properties of lithium-ion batteries were enhanced by optimizing the phase ratio of β and α of PVDF.
Conflicts of interest
There are no conflicts to declare.
Supplementary Material
Acknowledgments
This work was financially supported by Shanghai Municipal Science and Technology Commission Project (15110501100), Shanghai University Youth Teacher Training Program (E1-8500-17-022-ZZGCD15103), National Natural Science Foundation of China (Grant no. 51705306).
References
- Liu X. He P. Li H. Ishida M. Zhou H. J. Alloys Compd. 2013;552:76–82. doi: 10.1016/j.jallcom.2012.10.090. [DOI] [Google Scholar]
- Sathiya M. Abakumov A. M. Foix D. Rousse G. Ramesha K. Saubanère M. Doublet M. L. Vezin H. Laisa C. P. Prakash A. S. Nat. Mater. 2015;14:230. doi: 10.1038/nmat4137. [DOI] [PubMed] [Google Scholar]
- Stiaszny B. Ziegler J. C. Krauß E. E. Schmidt J. P. Ivers-Tiffée E. J. Power Sources. 2014;251:439–450. doi: 10.1016/j.jpowsour.2013.11.080. [DOI] [Google Scholar]
- Liu S. Xiong L. He C. J. Power Sources. 2014;261:285–291. doi: 10.1016/j.jpowsour.2014.03.083. [DOI] [Google Scholar]
- Han X. Ouyang M. Lu L. Li J. J. Power Sources. 2014;268:658–669. doi: 10.1016/j.jpowsour.2014.06.111. [DOI] [Google Scholar]
- He J. Chen Y. Li P. et al. RSC Adv. 2014;4(5):2568–2572. doi: 10.1039/C3RA45115A. [DOI] [Google Scholar]
- Fu Z. Feng H. L. Xiang X. D. Rao M. M. Wu W. Luo J. C. Chen T. T. Hu Q. P. Feng A. B. Li W. S. J. Power Sources. 2014;261:170–174. doi: 10.1016/j.jpowsour.2014.03.087. [DOI] [Google Scholar]
- Zhong H. Sun M. Li Y. He J. Yang J. Zhang L. J. Solid State Electrochem. 2015;20:1–8. doi: 10.1007/s10008-015-2967-8. [DOI] [Google Scholar]
- Xu J. Chou S.-L. Gu Q.-f. Liu H.-K. Dou S.-X. J. Power Sources. 2013;225:172–178. doi: 10.1016/j.jpowsour.2012.10.033. [DOI] [Google Scholar]
- Panjaitan E. Manaf A. Soegijono B. Kartini E. Procedia Chem. 2012;4:60–64. doi: 10.1016/j.proche.2012.06.009. [DOI] [Google Scholar]
- Tan Z. Fu C. Gao Y. Qian J. Li W. Wu X. Chu H. Chen C. Nie W. Ran X. Radiat. Phys. Chem. 2018;153:258–268. doi: 10.1016/j.radphyschem.2018.06.051. [DOI] [Google Scholar]
- Hoque N. A. Thakur P. Roy S. Kool A. Bagchi B. Biswas P. Saikh M. M. Khatun F. Das S. Ray P. P. ACS Appl. Mater. Interfaces. 2017;9(27):23048–23059. doi: 10.1021/acsami.7b08008. [DOI] [PubMed] [Google Scholar]
- An N. Liu S. Fang C. Yu R. Xing Z. Cheng Y. J. Appl. Polym. Sci. 2015;132(10) doi: 10.1002/app.41577. doi: 10.1002/app.41577. [DOI] [Google Scholar]
- Martins P. Nunes J. S. Hungerford G. Miranda D. Ferreira A. Sencadas V. Lanceros-Méndez S. Phys. Lett. A. 2009;373:177–180. doi: 10.1016/j.physleta.2008.11.026. [DOI] [Google Scholar]
- Martins P. Caparros C. Gonçalves R. Martins P. Benelmekki M. Botelho G. Lanceros-Mendez S. J. Phys. Chem. C. 2012;116:15790–15794. doi: 10.1021/jp3038768. [DOI] [Google Scholar]
- Lopes A. C. Gutiérrez J. Barandiarán J. M. Eur. Polym. J. 2017:11–116. [Google Scholar]
- Singh H. H. Singh S. Khare N. Polym. Adv. Technol. 2017:143–150. [Google Scholar]
- Xie P. Wang J. Tang R. Wu Z. Jiang Y. J. Mater. Sci.: Mater. Electron. 2015;26:9067–9073. doi: 10.1007/s10854-015-3592-0. [DOI] [Google Scholar]
- Wolff S. Jirasek F. Beuermann S. Türk M. RSC Adv. 2015;5:66644–66649. doi: 10.1039/C5RA12142F. [DOI] [Google Scholar]
- Issa A. A. Al-Maadeed M. Luyt A. S. Mrlik M. Hassan M. K. J. Appl. Polym. Sci. 2016;133 doi: 10.1002/app.43594. doi: 10.1002/app.43594. [DOI] [Google Scholar]
- Xia W. Zhou Z. Liu Y. Wang Q. Zhang Z. J. Appl. Polym. Sci. 2018;135:46306. doi: 10.1002/app.46306. [DOI] [Google Scholar]
- Costa C. M. Silva M. M. Lanceros-Méndez S. RSC Adv. 2013;3:11404. doi: 10.1039/C3RA40732B. [DOI] [Google Scholar]
- Salimi A. Yousefi A. A. Polym. Test. 2003;22:699–704. doi: 10.1016/S0142-9418(03)00003-5. [DOI] [Google Scholar]
- Sencadas V. Gregorio Jr R. Lanceros-Méndez S. J. Macromol. Sci., Part A: Pure Appl.Chem. 2009;48:514–525. doi: 10.1080/00222340902837527. [DOI] [Google Scholar]
- Sencadas V. Moreira M. V. Lanceros-Méndez S. Pouzada A. S. Gregório Filho R. Mater. Sci. Forum. 2006;514–516:872–876. [Google Scholar]
- Pan H. Na B. Lv R. Li C. Zhu J. Yu Z. J. Polym. Sci., Part B: Polym. Phys. 2012;50:1433–1437. doi: 10.1002/polb.23146. [DOI] [Google Scholar]
- Doll W. W. Lando J. B. J. Macromol. Sci., Part B: Phys. 1970;4:8. [Google Scholar]
- Ribeiro C. Sencadas V. Ribelles J. L. G. Lanceros-Méndez S. Soft Mater. 2010;8:274–287. doi: 10.1080/1539445X.2010.495630. [DOI] [Google Scholar]
- Lund A. Hagstrom B. J. Appl. Polym. Sci. 2011;120:1080–1089. doi: 10.1002/app.33239. [DOI] [Google Scholar]
- Baji A. Mai Y. W. Du X. Wong S. C. Macromol. Mater. Eng. 2012;297:209–213. doi: 10.1002/mame.201100176. [DOI] [Google Scholar]
- Zhong G. Zhang L. Su R. Wang K. Fong H. Zhu L. Polymer. 2011;52:2228–2237. doi: 10.1016/j.polymer.2011.03.024. [DOI] [Google Scholar]
- Ye H. J. Shao W. Z. Zhen L. J. Appl. Polym. Sci. 2013;129:2940–2949. doi: 10.1002/app.38949. [DOI] [Google Scholar]
- Martins P. Moya X. Phillips L. Kar-Narayan S. Mathur N. Lanceros-Mendez S. J. Phys. D: Appl. Phys. 2011;44:482001. doi: 10.1088/0022-3727/44/48/482001. [DOI] [Google Scholar]
- Mandal D. Kim K. J. Lee J. S. Langmuir. 2012;28:10310–10317. doi: 10.1021/la300983x. [DOI] [PubMed] [Google Scholar]
- Wang W. Zhang S. Srisombat L. o. Lee T. R. Advincula R. C. Macromol. Mater. Eng. 2011;296:178–184. doi: 10.1002/mame.201000271. [DOI] [Google Scholar]
- Meazzini I. Behrendt J. M. Turner M. L. Evans R. C. Macromolecules. 2017;50:4235–4243. doi: 10.1021/acs.macromol.7b00519. [DOI] [Google Scholar]
- Correia D. M. Costa C. M. Nunes-Pereira J. Silva M. M. Botelho G. Ribelles J. L. G. Lanceros-Méndez S. Solid State Ionics. 2014;268:54–67. doi: 10.1016/j.ssi.2014.09.029. [DOI] [Google Scholar]
- Kundu M. Costa C. M. Dias J. Maceiras A. Vilas J. L. Lanceros-Méndez S. J. Phys. Chem. C. 2017;121:26216–26225. doi: 10.1021/acs.jpcc.7b09227. [DOI] [Google Scholar]
- Moazed C. Overbey R. Amp R. Spector R. M. J. Polym. Sci., Part B: Polym. Phys. 1994;32:859–870. [Google Scholar]
- Cai X. Lei T. Sun D. Lin L. RSC Adv. 2017;7:15382–15389. doi: 10.1039/C7RA01267E. [DOI] [Google Scholar]
- Xu S. D. Zhuang Q. C. Tian L. L. Qin Y. P. Fang L. Sun S. G. J. Phys. Chem. C. 2011;115:9210–9219. doi: 10.1021/jp107406s. [DOI] [Google Scholar]
- Itagaki M. Honda K. Hoshi Y. Shitanda I. J. Electroanal. Chem. 2015;737:78–84. doi: 10.1016/j.jelechem.2014.06.004. [DOI] [Google Scholar]


