


Abstract
Blindness studies are important models for the comprehension of human brain development and reorganization, after visual deprivation early in life. To investigate the global and local topologic alterations and to identify specific reorganized neural patterns in early-blind adolescents (EBAs), we applied diffusion tensor tractography and graph theory to establish and analyze the white matter connectivity networks in 21 EBAs and 22 age- and sex-matched normal-sighted controls (NSCs). The network profiles were compared between the groups using a linear regression model, and the associations between clinical variables and network profiles were analyzed. Graph theory analysis revealed “small-world” attributes in the structural connection networks of both EBA and NSC cohorts. The EBA cohort exhibited significant lower network density and global and local efficiency, as well as significantly elevated shortest path length, compared to the NSC group. The network efficiencies were markedly reduced in the EBA cohort, with the largest alterations in the default-mode, visual, and limbic areas. Moreover, decreased regional efficiency and increased nodal path length in some visual and default-mode areas were strongly associated with the period of blindness in EBA cohort, suggesting that the function of these areas would gradually weaken in the early-blind brains. Additionally, the differences in hub distribution between the two groups were mainly within the occipital and frontal areas, suggesting that neural reorganization occurred in these brain regions after early visual deprivation during adolescence. This study revealed that the EBA brain structural network undergoes both convergent and divergent topologic reorganizations to circumvent early visual deprivation. Our research will add to the growing knowledge of underlying neural mechanisms that govern brain reorganization and development, under conditions of early visual deprivation.
1. Introduction
The human brain is an extremely complicated network with powerful adaptive and reorganizational capabilities. A fine example is the coordination of the complex neural plasticity processes that occur in the brain early after visual deprivation. Multiple previous studies of functional connectivity identified patterns of both increased and decreased functional connectivity in the brains of early-blind adults [1–4], especially in the visual-related areas. White matter integrity studies, using diffusion tensor imaging (DTI) method, also revealed similar structural connectivity patterns in the brains of early-blind and late-blind adults [5, 6]. This atypical pattern of brain connectivity is highly common among blind adult individuals. Despite much research, it is still unclear whether the patterns of the brain connectivity in early-blind adolescents (EBAs) and blind adults parallel one another, and how the brain develops and reorganizes after visual deprivation early in life.
Different from the regional-level approach of brain reorganization, the network-level analysis of brain connectivity provides a more comprehensive and systematic information regarding brain plasticity. In addition, the graph theory analysis method characterizes the topologic properties of brain networks, typically using both functional and structural magnetic resonance imaging (MRI) data. Among the many network analysis approaches that study brain connectivity, DTI offers a distinctive contrast that utilizes restricted directionality of water motion under anisotropic conditions. As a result, this approach is superior to others in characterizing and quantifying the white matter (WM) connectivity in the brains of blind individuals [5].
Here, we employed DTI tractography and graph theory to examine both global and regional topologic alterations and neural reorganized patterns in EBA. A recent theory, namely, reversible plasticity gradient [7], suggested that brain plasticity capacities will spontaneously decrease with age; however, it can be recovered throughout a lifespan after critical/sensitive periods. In view of this, combined with earlier work depicting impaired functional and structural connectivity in early-blind individuals, we speculated that EBAs would experience distinctly reduced topologic efficiency in WM connectivity networks, which would closely parallel clinical variables.
2. Materials and Methods
2.1. Participants
Our work received approval from the Ethics Committee of the First Affiliated Hospital of Jinan University and in compliance with the Declaration of Helsinki (1964). We have also received documented informed consent from all participants and/or guardians before magnetic resonance imaging (MRI) examinations. This study included 21 EBAs (13 males and 8 females, mean age 14.99 ± 1.97 years old, enrolled from the Guangzhou City Blind School and the clinical characteristics are listed in Table 1) with age at onset <1 year and 22 normal-sighted controls (NSCs, 11 males and 11 females, mean age 14.60 ± 2.54 years old, recruited via advertising) with matching age and sex. Given that our prior study [8] revealed a potential impact of residual light perception on the structural and functional alterations in blind brain, the EBAs eligible for this study were completely blind, with no light perception. Following are the criteria for inclusion in this study: right-handedness and between 11 and 19 years of age. Conversely, the following individuals were exempt from this study: (a) past records of head injury, psychiatric, or neurologic illnesses, (b) symptomatic or atypical neuralgia, or (c) recognizable MRI anomalies, namely, loss of myelin, vascular deformity, or tumors.
Table 1.
Clinical characteristics of blind participants.
| Subjects | Sex | Age (years) | Onset | Blind duration (months) | Causes of blindness |
|---|---|---|---|---|---|
| EBA01 | M | 14 | Age of 3rd month | 170 | ROP |
| EBA02 | M | 16 | Age of 2nd month | 194 | ROP |
| EBA03 | M | 11 | Age of 2nd month | 130 | ROP |
| EBA04 | F | 14 | Age of 1st month | 166 | ROP |
| EBA05 | M | 17 | At birth | 202 | Unknown |
| EBA06 | M | 15 | At birth | 180 | Unknown |
| EBA07 | F | 12 | Age of 3rd month | 144 | ROP |
| EBA08 | F | 16 | Age of 3rd month | 192 | ROP |
| EBA09 | M | 17 | At birth | 203 | CG |
| EBA10 | F | 17 | At birth | 205 | ROP |
| EBA11 | M | 15 | At birth | 180 | ROP |
| EBA12 | M | 18 | At birth | 213 | ROP |
| EBA13 | M | 16 | At birth | 192 | Unknown |
| EBA14 | M | 17 | At birth | 204 | Unknown |
| EBA15 | F | 15 | Age of 2nd month | 152 | ROP |
| EBA16 | F | 17 | Age of 1st month | 196 | ROP |
| EBA17 | M | 15 | Age of 4th month | 175 | ROP |
| EBA18 | M | 15 | At birth | 179 | Unknown |
| EBA19 | F | 11 | Age of 3rd month | 129 | ETE |
| EBA20 | M | 13 | At birth | 159 | Unknown |
| EBA21 | F | 14 | Age of 3rd month | 162 | ROP |
Abbreviations: ROP: retinopathy of prematurity; CG: congenital glaucoma; ETE: eyeball excision for tumor; EBA: early-blind adolescents; M: male; F: female.
2.2. Image Acquisition
MRI data were obtained from the Medical Imaging Center of the First Affiliated Hospital of Jinan University. The study subjects were examined with a 3-T MR scanner (Discovery MR 750 System; General Electric, Milwaukee, WI, USA) with an 8-channel head coil. A whole-brain high-resolution T1-weighted image was obtained, using a 3-dimensional BRAVO sequence with parameters as follows: repetition time (TR) =8.2 ms, echo time (TE) =3.2 ms, flip angle =12°, field of view (FOV) =256 × 256 mm2, matrix size =256 × 256, slice thickness = 1 mm, and 168 slices in axial plane. DTI data was accumulated axially using a spin-echo echo-planar imaging sequence with adjusted variables as follows: TR = 6000 ms, TE = 68 ms, number of excitations = 1, FOV =256 × 256 mm2, matrix size =128 × 128, section thickness = 3 mm, and no intersection gap. Diffusion sensitizing gradients were applied to 75 non-collinear directions (b = 1000 s/mm2), and 5 acquisitions with no diffusion weighting (b = 0 s/mm2) were achieved. The array spatial sensitivity encoding was employed with acceleration factor of 2 to lower acquisition duration and anamorphosis. Two neuroradiologists (Z. Z and X. L with 5 and 7 years of experience, respectively) evaluated clinical abnormalities and verified image quality.
2.3. Data Preprocessing
The DTI information was preprocessed, according to the FSL 5.0 (https://fsl.fmrib.ox.ac.uk/fsl/fslwiki) and the Diffusion Toolkit (http://www.trackvis.org/dtk/), using the PANDA toolbox (https://www.nitrc.org/projects/panda) [9]. The process was as follows: (1) the brain mask was extracted, (2) the non-brain region within the native images was cropped, (3) head motion and eddy-current were corrected by registering the diffusion-weighted images to the b0 images with an affine transformation, and (4) the diffusion tensor was predicted via a linear least-squares fitting formula. Finally, the individual fractional anisotropy (FA) images of native space were obtained.
2.4. Network Construction
The brain network was created by specifying network nodes and the connections among them. Firstly, the automated anatomical labeling (AAL) template [10] enabled the parceling of the whole brain into 90 structural network nodes, with 45 nodes in each hemisphere. These regions are listed in Table 2. Next, we registered the FA images in the native space to T1-weighted images, using affine transformation. Subsequently, the structural representations were nonlinearly normalized to the ICBM152 template in standard Montreal Neurologic Institute (MNI) space. Then, the standard space was inversely warped to the native space, following the inverse warping transformation obtained from the earlier 2 steps. Finally, the AAL template in MNI space was inversely warped back to the discrete native space. At the end, all images were individually examined to ensure quality of segmentation and registration.
Table 2.
Cortical and subcortical regions of interest defined in this study.
| Regions | Abbreviations | Regions | Abbreviations |
|---|---|---|---|
| Precentral gyrus | PreCG | Lingual gyrus | LING |
| Superior frontal gyrus, dorsolateral | SFGdor | Superior occipital gyrus | SOG |
| Superior frontal gyrus, orbital part | ORBsup | Middle occipital gyrus | MOG |
| Middle frontal gyrus | MFG | Inferior occipital gyrus | IOG |
| Middle frontal gyrus, orbital part | ORBmid | Fusiform gyrus | FG |
| Inferior frontal gyrus, opercular part | IFGoperc | Postcentral gyrus | PoCG |
| Inferior frontal gyrus, triangular part | IFGtriang | Superior parietal gyrus | SPG |
| Inferior frontal gyrus, orbital part | ORBinf | Angular gyri | IPL |
| Rolandic operculum | ROL | Supramarginal gyrus | SMG |
| Supplementary motor area | SMA | Angular gyrus | ANG |
| Olfactory cortex | OLF | Precuneus | PCUN |
| Superior frontal gyrus, medial | SFGmed | Paracentral lobule | PCL |
| Superior frontal gyrus, medial orbital | ORBsupmed | Caudate nucleus | CAU |
| Rectus gyrus | REC | Lenticular nucleus, putamen | PUT |
| Insula | INS | Lenticular nucleus, pallidum | PAL |
| Anterior cingulate and paracingulate gyri | ACG | Thalamus | THA |
| Median cingulate and paracingulate gyri | MCG | Heschl gyrus | HES |
| Posterior cingulate gyrus | PCG | Superior temporal gyrus | STG |
| Hippocampus | HIP | Temporal pole: Superior temporal gyrus | TPOsup |
| Parahippocampal gyrus | PHG | Middle temporal gyrus | MTG |
| Amygdala | AMYG | Temporal pole: Middle temporal gyrus | TPOmid |
| Calcarine fissure and surrounding cortex | CAL | Inferior temporal gyrus | ITG |
| Cuneus | CUN |
The amount of fiber connections between pair of nodes was described as the network edge. Whole-brain fiber tracking was conducted in individual native space with deterministic tracking algorithms. Fiber tracking termination condition was set such that the crossing angle of two consecutive moving directions was >45°or the FA was <0.2. Connectivity was detected only if the fiber number (FN) spanning two areas reached >3. This stringent threshold selection lowered the detection of pseudo-connections arising from noise or limitations in deterministic tractography [11]. Thus, a symmetric (90 × 90) FN-weighted WM connectivity network was generated for each subject.
2.5. Network Analysis
The topologic characteristics of the brain structural network were analyzed using graph theory [12]. Both global and nodal topological features of the brain WM connectivity networks were computed to delineate potential differences in the whole brain network between the EBA and NSC cohorts. We analyzed 8 global characteristics as listed below: network density, global efficiency (Eg), local efficiency (Eloc), clustering coefficient (Cp), shortest path length (Lp), normalized clustering coefficient (γ), normalized path length (λ), and small-world parameters (σ). The nodal variables included efficiency (Ne), clustering coefficient (NCp), and shortest path distance (NLp). A description of each parameter is summarized in supplementary materials Table S1. Additionally, hub nodes were described as the 13 (15%) top-ranking nodes with the largest mean nodal degrees among all brain regions within each cohort [13]. The GRETNA toolbox (https://www.nitrc.org/projects/gretna) [14] was employed for all network analyses and the BrainNet Viewer software (https://www.nitrc.org/projects/bnv/) [15] was employed for visualization.
2.6. Statistical Analysis
Statistical analyses were done with the Statistical Package for Social Science (SPSS Version 23.0; https://www.spss.com/). Two-sample t- and chi-square tests were used for differences between age and sex, respectively. Linear regression analyses were completed to delineate differences in topologic networks, with age and sex as covariates. Multiple comparisons were conducted with Bonferroni correction at p < 0.05. For network parameters harboring marked cohort differences, partial correlation analyses were completed between the parameters and blind duration, after adjusting for age and sex in the EBA cohort.
3. Results
Thirteen men and 8 women were included in the EBA cohort, while the NSC cohort had 11 men and 11 women. No discernible changes were observed in age and sex between the two cohorts (p > 0.05). Table 1 summarizes the clinical information of all EBAs and Table 3 reports the demographics of both EBA and NSC cohorts.
Table 3.
Demographics and clinical characteristics of all participants.
| Characteristics | EBA | NSC | Statistics | p values |
|---|---|---|---|---|
| Age (mean ± sd) (years) | 14.99 ± 1.97 | 14.60 ± 2.54 | 0.565 | 0.570 |
| Sex (M/F) | 13/8 | 11/11 | 0.617 | 0.432 |
| Blind duration (mean ± sd) (months) | 177.48 ± 24.68 | NA | NA | NA |
Note: Age was reported by participants or guardians at the time of MR imaging. Abbreviations: EBA: early-blind adolescents; NSC: normal-sighted controls; NA: not applicable.
3.1. Global Differences in WM Structural Networks between Groups
The EBA cohort exhibited markedly low network density (t = -3.78, p < 0.001, corrected), Eg (t = -2.87, p = 0.007, corrected), and Eloc (t = -2.67, p = 0.011, corrected), relative to the NSC cohort (Figure 1(a)).
Figure 1.

Group differences in global network metrics of WM structural networks (a) and the correlation between network Eloc and blind duration in the EBA cohort (b). (a) Bar charts and error bars represent the mean values and standard deviations, respectively (EBA: n = 21; NSC: n = 22). ∗p < 0.05 (Bonferroni corrected); ∗∗p < 0.001 (Bonferroni corrected). (b) Scatterplots show the significantly negative correlation between network Eloc and blind duration in the EBA cohort (n = 21). The fitted values indicate the residuals of original values of Eloc adjusted age and sex and corrected with mean value. Abbreviations: Eg: global efficiency; Eloc: local efficiency; Lp: shortest path length; Cp: clustering coefficient; λ: normalized path length; γ: normalized clustering coefficient; σ: small-world parameters; EBA: early-blind adolescents; NSC: normal-sighted controls.
3.2. Small-Worldness Differences in the WM Structural Networks between Groups
Using graph-theoretical analyses, we discovered that both cohorts displayed high normalized clustering coefficients and similar normalized path length (γ > 1, λ ≈ 1, and σ > 1) in their WM structural networks, indicating the presence of distinctive small-world organizations in both cohorts. Moreover, EBA cohorts exhibited longer Lp (t = 3.41, p = 0.002, corrected), higher normalized clustering coefficient (t = 4.56, p < 0.001, corrected), and higher small-world parameters (t = 5.74, p < 0.001, corrected) than the NSC cohort (Figure 1(a)). There were no marked alterations between the two cohorts in terms of clustering coefficient (t = 0.35, p = 0.73) and normalized path length (t = -1.10, p = 0.28).
3.3. Intercohort Differences in Regional Efficiency
The EBA cohort had lower Ne in the bilateral posterior cingulate gyri, calcarine cortices, cuneus, lingual gyri, superior occipital gyri, left precuneus, left parahippocampal gyrus, and left inferior occipital gyrus (p < 0.05, corrected) (Table 4, Figure 2(a)). Apart from the left inferior occipital gyrus, most regions, including the right fusiform gyrus and right precuneus, showed significantly longer Nlp (p < 0.05, corrected) in the EBA cohort, relative to the NSC cohort (Table 4, Figure 3(a)). Based on the functionality of these brain areas, they were classified into 3 categories: (1) the default-mode system that included bilateral posterior cingulate gyri and precuneus; (2) the visual system that included bilateral calcarine cortices, cuneus, lingual gyri, superior occipital gyri, left inferior occipital gyrus, and right fusiform gyrus; and (3) the limbic system that included the left parahippocampus. Additionally, some brain regions showed moderately significant NCp alterations in the EBA cohort, relative to NSCs, particularly, in the bilateral middle frontal gyri and left triangular parts of inferior frontal gyrus and decreased NCp in right supplementary motor area, right parahippocampus, and bilateral cuneus (p < 0.05, uncorrected; Supplementary Materials Table S2, Figure S1).
Table 4.
Brain regions with significant nodal differences between groups.
| Systems | Regions | Abbreviations | Ne | NLp | ||
|---|---|---|---|---|---|---|
| T values | p values | T values | p values | |||
| Default-mode | Left posterior cingulate gyrus | PCG.L | -5.10 | <0.001 | 4.71 | <0.001 |
| Right posterior cingulate gyrus | PCG.R | -4.04 | <0.001 | 3.81 | <0.001 | |
| Left precuneus | PCUN.L | -4.61 | <0.001 | 4.19 | <0.001 | |
| Right precuneus | PCUN.R | NA | NA | 3.76 | 0.001 | |
| Visual | Left calcarine | CAL.L | -6.24 | <0.001 | 4.81 | <0.001 |
| Right calcarine | CAL.R | -6.43 | <0.001 | 4.60 | <0.001 | |
| Left cuneus | CUN.L | -6.87 | <0.001 | 6.72 | <0.001 | |
| Right cuneus | CUN.R | -5.95 | <0.001 | 5.33 | <0.001 | |
| Left lingual | LING.L | -4.38 | <0.001 | 4.02 | <0.001 | |
| Right lingual | LING.R | -5.81 | <0.001 | 4.32 | <0.001 | |
| Left superior occipital gyrus | SOG.L | -5.26 | <0.001 | 5.67 | <0.001 | |
| Right superior occipital gyrus | SOG.R | -4.40 | <0.001 | 4.31 | <0.001 | |
| Left inferior occipital gyrus | IOG.L | -3.84 | <0.001 | NA | NA | |
| Right fusiform gyrus | FG.R | NA | NA | 4.45 | <0.001 | |
| Limbic | Left parahippocampal gyrus | PHG.L | -3.82 | <0.001 | 4.20 | <0.001 |
Note: The regions with significant group differences in nodal efficiency (Ne) and nodal shortest path (NLp) at p < 0.05 (Bonferroni-corrected) can be categorized into 3 functional systems. Abbreviations: EBA: early-blind adolescents; NSC: normal-sighted controls; NA: not applicable.
Figure 2.
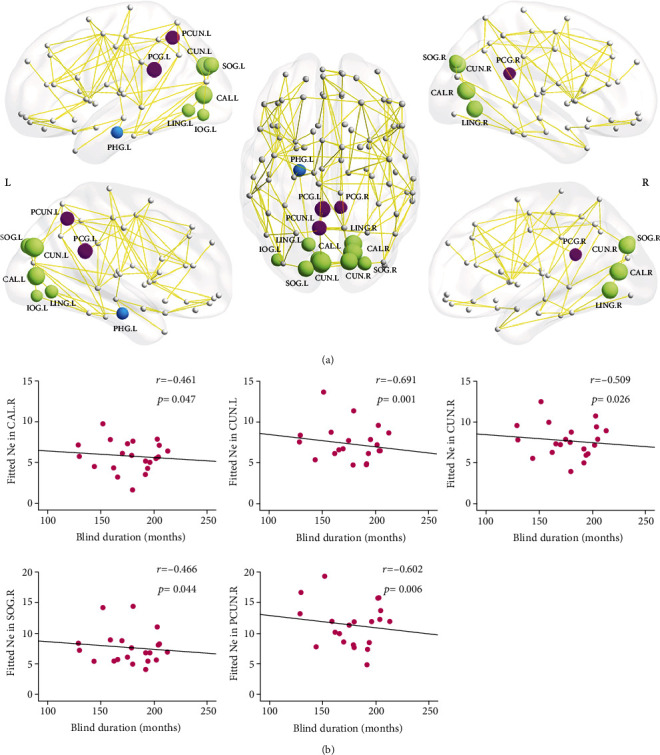
Distribution of brain regions with significant intercohort differences in nodal efficiency (Ne) (a) and the correlation with blind duration in the EBA cohort (b). (a) Regions with decreased Ne are represented in different colors: purple for the default-mode system, green for the visual system, and blue for the limbic system. The node sizes indicate the significance of intercohort differences in Ne. (b) Scatterplots show the significantly negative correlation between Ne and blind duration in EBA cohort (n = 21). The fitted values indicate the residuals of original values of Ne adjusted age and sex and corrected with mean value. The abbreviations of nodes can be referred in Table 4.
Figure 3.

Distribution of brain regions with significantly intercohort differences in nodal shortest path length (NLp) (a) and the correlation with blind duration in EBA cohort (b). (a) Regions with longer NLp are represented in different colors: purple for the default-mode system, green for the visual system, and blue for the limbic system. The node sizes indicate the significance of intercohort difference in NLp. (b) Scatterplots show a significantly positive correlation between NLp and blind duration in EBA cohort (n = 21). The fitted values indicate the residuals of original values of NLp adjusted age and sex and corrected with mean value. The abbreviations of nodes can be referred in Table 4.
3.4. Hub Regions
Based on the networks of each cohort, similar hub distribution patterns were found in the EBA and NSC cohorts. These highly similar hub locations included the bilateral precentral gyri, supplementary motor areas, precuneus, middle temporal gyri, putamen, and left postcentral gyri (Figure 4). However, two regions, i.e., the left cuneus and middle occipital gyrus, were recognized as hubs in the NSC cohort alone, and hubs in the right dorsolateral part of superior frontal gyrus and right middle frontal gyrus were unique to the EBA cohort alone.
Figure 4.
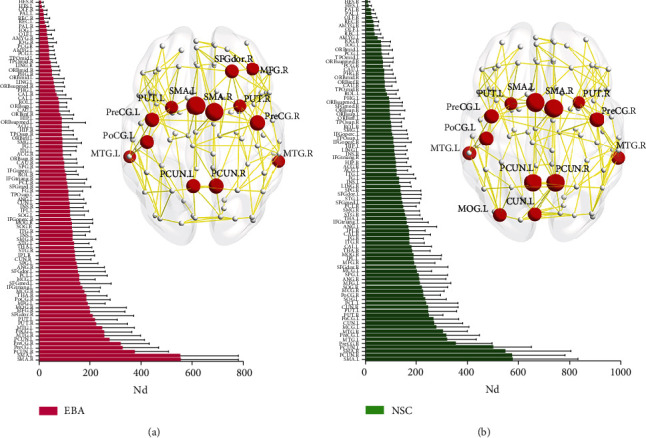
Hub region distributions (top 13) in the WM structural network in EBA (a) and NSC (b) cohorts. The left panels indicate the 90 brain regions of AAL atlas sorted by mean nodal degree (Nd) in ascending order for each cohort. The right panels show hub distributions of each cohort. The hub nodes are shown in red, and node sizes indicate the significance of intercohort difference in Nd. The abbreviations of brain regions are presented in Table 2.
3.5. Correlation between Network Efficiency and Blind Duration
In the EBA cohort, the network Eloc was inversely associated with the period of blindness (r = -0.487, p = 0.034) (Figure 1(b)). Similarly, the Ne of some regions, including the right calcarine cortex (r = -0.461, p = 0.047), bilateral cuneus (left: r = -0.691, p = 0.001; right: r = -0.509, p = 0.026), right superior occipital gyrus (r = -0.466, p = 0.044), and left precuneus (r = -0.602, p = 0.006), were also inversely related to the period of blindness. The Nlp of the left cuneus (r = 0.653, p = 0.002) and left precuneus (r = 0.524, p = 0.021) was positively associated with the period of blindness (Figures 2(b) and 3(b)).
4. Discussion
Using DTI tractography and graph theory, we explored the WM structural networks of the EBAs and NSCs brains. Structural connection matrices examined in these cohorts displayed “small-world” characteristics. The EBA cohort exhibited significantly lower network density, Eg, and Eloc, as well as significantly increased Lp, compared to the NSC cohort. In detail, the regional efficiencies of the default-mode, visual, and limbic areas were markedly reduced in the EBA cohort, relative to the NSC cohort. Moreover, decreases in Ne and increases in NLp within certain visual and default-mode regions were strongly associated with the period of blindness in the EBA cohort, indicative of a gradual decline in the function of these areas in the early-blind brain during adolescence. Additionally, the differences in hub distribution between the two groups were mainly localized within the occipital and frontal areas, suggesting that neural reorganization occurred in these brain regions after early visual deprivation during the adolescence. Taken together, our findings indicate topological reorganization of the WM connectivity networks in EBAs, relative to NSCs. Additionally, these alterations can gradually accumulate over prolonged duration of blindness.
4.1. Small-World Efficiencies in the EBA WM Network
The human brain is a complicated network of balanced global integration and local segregation processes. Here, we established the small-world features of EBA and NSC structural networks, characterized by a rapid, efficient, low-cost information flow through a complex network [16]. The conclusions of this study are in accordance with other research on blind children [17] and adults [18].
Although small-world properties were detected in both EBA and NSC networks, the Eg and Eloc were markedly reduced in the EBA networks, relative to the NSCs. The Eg, calculated from the average inverse Lp between remote brain locations, represents the ability of long-range information transmission. In contrast, the Eloc reflects the ability of short-range information transmission, which is mainly associated with the connections between neighboring brain regions. Conversely, reduced Eg and Eloc represent abnormal topological networks reorganization in EBA, likely caused by the delayed or defective development of structural connections due to the absence of visual stimuli. Our findings are also supported by multiple other DTI studies, which demonstrated dysregulated micro-structural integrity in the posterior visual radiation, occipital and temporal thalamocortical projections, and visual processing stream in early-blind individuals [6, 8, 19, 20].
4.2. Altered Regional Efficiency in the WM Network of EBA
We demonstrated lower Ne and higher NLp within EBA networks. The affected locations were classified into three discrete systems: default-mode, visual, and limbic systems.
4.2.1. Default-Mode System
EBA networks had reduced regional efficiency in the core components of the default-mode network, namely, the bilateral posterior cingulate gyri and precuneus. These locations primarily depend on visual input and are involved in attentive behavior [21, 22] and in integrating visuospatial information in sighted controls [23–25]. In EBAs, however, the function of these areas may be diminished by the lack of necessary visual input, which may lead to the reduced Ne in the corresponding regions. Likewise, using high angular resolution diffusion imaging, Bauer et al. [3] indicated decreased structural connectivity between posterior cingulate and frontal cortices and between precuneus and parietal cortices, in early-onset blind adults. In other words, the alterations in the structural connectivity of the blind brain's default-mode system appear well before adulthood. Additionally, in our study, we discovered that Ne and NLp of the left precuneus were negatively and positively associated with the period of blindness in EBA, respectively, suggesting that the function of the left precuneus gradually weaken over time in the early-blind brain during adolescence.
4.2.2. Visual System
Low regional efficiencies were also observed in most occipital areas in EBA, including the primary visual regions (calcarine, aka the striate cortex), which predominantly process the visual input from the retina, and the visual association areas (the cuneus, lingual, fusiform, superior occipital gyrus, and inferior occipital gyrus; all parts of the extrastriate visual cortex), and are mainly involved in the subsequent steps of visual input processing. These findings are supported by the disuse atrophy hypothesis of the visual cortex in early-blind brains [26]. Similarly, anatomical studies have also revealed widespread abnormal anatomical alterations, such as thin cortical thickness and reduced cortical and WM volume, in the occipital cortices of the early blind [3, 19, 27–29]. Correspondingly, reduced functional connections were reported between the visual areas and non-visual sensory [1, 3, 30–32], somatosensory [1–3, 31, 33], or motor cortices [1, 2, 31], as well as between primary visual areas and visual association areas [30, 34], in early-blind brains. Nevertheless, our results showed a broader range of alterations in the structural connections of the visual system than previously found in adults with early blindness. This may be the result of some connectivity pathways in the occipital lobe that are not dependent on visual experience developed during adulthood with increased experiential input [35, 36], thus masking some structural and functional impairments in the occipital lobe, due to lack of visual input. In addition, we found that the Ne of the right calcarine, bilateral cuneus, and right superior occipital gyrus were all inversely associated with the period of blindness in EBA. These data indicate a structurally progressive and cumulative defect in the visual system of early blind during adolescence.
4.2.3. Limbic System
The parahippocampal gyrus is an important region within the limbic system and is involved in multiple high-level cognitive processes [37, 38]. Moreover, the bilateral parahippocampal gyrus showed asymmetric functional preferences. In particular, the left parahippocampus was more likely to process semantic and language information [39–41], while the right parahippocampus was often activated during spatial navigation tasks processing [42–44]. This functional asymmetry of the bilateral parahippocampal gyrus was particularly pronounced in blind brains. For instance, the neural activity patterns associated with semantic processing in the left parahippocampus in blind adults were highly similar to those in the sighted controls, even though they were activated via verbal and auditory stimuli in blind subjects while activated by visual, verbal, and auditory stimuli in sighted individuals [45]. However, in a tactile spatial navigation task, the responses of the right parahippocampus were significantly increased in congenital blind subjects, but not in blindfolded sighted participants [46], which suggests that the right parahippocampus of blind individuals performs better at integrating visual independent multimodal information than that of sighted controls. From the perspective of neurodevelopment, a recent myelin water imaging study [47] reported increasing myelination from early adolescence to adulthood in the right parahippocampal region, but not in the left parahippocampus. In the present study, we demonstrated significantly reduced regional efficiency in the left parahippocampal gyrus of EBAs versus NSCs. Determining whether this is the result of natural neural development or neural reorganization after visual deprivation, or a combination of the previous two reasons, would require further investigation.
4.3. Reorganization of Hubs in the EBA WM Network
The nodal degree measurements enable us to recognize the most essential nodes (i.e., with the most connections to other nodes) within the brain network. Here, we discovered similar hub distribution patterns in both cohorts, which is in accordance with another study [18]. Most hub regions, such as the bilateral precentral gyri, supplementary motor areas, precuneus, putamen, middle temporal gyri, and left postcentral gyrus, were the same in both EBA and NSC cohorts, and belonged to the association cortex, which receives signals from various other cortical locations [48]. Similar to our conclusion, several prior studies have also identified the association cortex as a crucial location for the structural and functional brain networks in humans [49–51]. But, relative to the NSC cohort, the EBA cohort was missing two hub locations, namely, the left cuneus and left middle occipital gyrus, indicating low usage of these locations in the EBA brain. Interestingly, two additional hub regions, namely, the right dorsolateral part of superior frontal gyrus and right middle frontal gyrus, were found to be of significance in the EBA cohort, but not the NSC cohort, indicating increased usage of these locations in the EBA brain. In view of this, we speculate that early visual deprivation may promote neural plasticity in the frontal and occipital related areas of the early blind brain.
4.4. Limitations
Our work exclusively examined WM structural networks. In future investigations, a combined examination of structural and functional connectivity networks would facilitate a thorough comprehension of the neural reorganizations in the EBA. Moreover, the DTI-based tractography method may be affected by the crossing fibers. Thus, a more accurate model is warranted for the calculation of WM connections to verify the results of this study in the future.
5. Conclusion
In conclusion, our study revealed both convergent and divergent topologic reorganizations within the EBA brain structural network. From a network perspective, our work sheds light on the patterns of the brain development and reorganization during adolescence in blind individuals that experiences early visual deprivation. The present findings will provide further insight into the study of neural reorganization and development under visual deprivation.
Acknowledgments
We note that a shorter conference version of this paper appeared in Zhou et al. [52]. Due to the word limit of the conference paper, the results were simply presented and discussed, while the presentation of this paper is more comprehensive, and the discussion is more in-depth and specific. This work was supported by the Shenzhen Sanming Project (SZSM201512038), the Science and Technology Innovation Program of Shenzhen (JCYJ2017041310IOI7457 and JCYJ20190809161011503), and the Shenzhen Fund for Guangdong Provincial High-level Clinical Key Specialties (SZGSP013). We thank Leilei Shi for his helpful comments on this manuscript.
Data Availability
The data that support the findings of this study are available on request from the corresponding author Dr. Xia Liu (auraliu0061@126.com). The data are not publicly available due to privacy or ethical restrictions.
Conflicts of Interest
The authors have no conflict of interest to declare.
Supplementary Materials
Supplemental Table S1: Definitions and interpretations of global and nodal network metrics. Supplemental Table S2: Brain regions with moderate differences of NCp between EBA and NSC groups. Supplemental Figure S1: Brain regions with moderate differences in NCp in EBA cohort.
References
- 1.Liu Y., Yu C., Liang M., et al. Whole brain functional connectivity in the early blind. Brain . 2007;130(8):2085–2096. doi: 10.1093/brain/awm121. [DOI] [PubMed] [Google Scholar]
- 2.Wang D., Qin W., Liu Y., Zhang Y., Jiang T., Yu C. Altered resting-state network connectivity in congenital blind. Human Brain Mapping . 2014;35(6):2573–2581. doi: 10.1002/hbm.22350. [DOI] [PMC free article] [PubMed] [Google Scholar]
- 3.Bauer C. M., Hirsch G. V., Zajac L., Koo B. B., Collignon O., Merabet L. B. Multimodal mr-imaging reveals large-scale structural and functional connectivity changes in profound early blindness. PLoS One . 2017;12(3, article e0173064) doi: 10.1371/journal.pone.0173064. [DOI] [PMC free article] [PubMed] [Google Scholar]
- 4.van der Heijden K., Formisano E., Valente G., Zhan M., Kupers R., de Gelder B. Reorganization of sound location processing in the auditory cortex of blind humans. Cerebral Cortex . 2020;30(3):1103–1116. doi: 10.1093/cercor/bhz151. [DOI] [PubMed] [Google Scholar]
- 5.Li J., Liu Y., Qin W., et al. Age of onset of blindness affects brain anatomical networks constructed using diffusion tensor tractography. Cerebral Cortex . 2013;23(3):542–551. doi: 10.1093/cercor/bhs034. [DOI] [PubMed] [Google Scholar]
- 6.Reislev N. L., Dyrby T. B., Siebner H. R., Kupers R., Ptito M. Simultaneous assessment of white matter changes in microstructure and connectedness in the blind brain. Neural Plasticity . 2016;2016:12. doi: 10.1155/2016/6029241.6029241 [DOI] [PMC free article] [PubMed] [Google Scholar]
- 7.Heimler B., Amedi A. Are critical periods reversible in the adult brain? Insights on cortical specializations based on sensory deprivation studies. Neuroscience and Biobehavioral Reviews . 2020;116:494–507. doi: 10.1016/j.neubiorev.2020.06.034. [DOI] [PubMed] [Google Scholar]
- 8.Zhou Z., Xu J., Shi L., et al. Alterations of the brain microstructure and corresponding functional connectivity in early-blind adolescents. Neural Plasticity . 2019;2019:12. doi: 10.1155/2019/2747460.2747460 [DOI] [PMC free article] [PubMed] [Google Scholar]
- 9.Cui Z., Zhong S., Xu P., He Y., Gong G. Panda: a pipeline toolbox for analyzing brain diffusion images. Frontiers in Human Neuroscience . 2013;7:p. 42. doi: 10.3389/fnhum.2013.00042. [DOI] [PMC free article] [PubMed] [Google Scholar]
- 10.Tzourio-Mazoyer N., Landeau B., Papathanassiou D., et al. Automated anatomical labeling of activations in SPM using a macroscopic anatomical parcellation of the MNI MRI single-subject brain. NeuroImage . 2002;15(1):273–289. doi: 10.1006/nimg.2001.0978. [DOI] [PubMed] [Google Scholar]
- 11.Shu N., Liu Y., Li K., et al. Diffusion tensor tractography reveals disrupted topological efficiency in white matter structural networks in multiple sclerosis. Cerebral Cortex . 2011;21(11):2565–2577. doi: 10.1093/cercor/bhr039. [DOI] [PubMed] [Google Scholar]
- 12.Bullmore E., Sporns O. Complex brain networks: graph theoretical analysis of structural and functional systems. Nature Reviews Neuroscience . 2009;10(3):186–198. doi: 10.1038/nrn2575. [DOI] [PubMed] [Google Scholar]
- 13.van den Heuvel M. P., Kahn R. S., Goñi J., Sporns O. High-cost, high-capacity backbone for global brain communication. Proceedings National Academy of Sciences. United States of America . 2012;109(28):11372–11377. doi: 10.1073/pnas.1203593109. [DOI] [PMC free article] [PubMed] [Google Scholar]
- 14.Wang J., Wang X., Xia M., Liao X., Evans A., He Y. Gretna: a graph theoretical network analysis toolbox for imaging connectomics. Frontiers in Human Neuroscience . 2015;9:p. 386. doi: 10.3389/fnhum.2015.00386. [DOI] [PMC free article] [PubMed] [Google Scholar]
- 15.Xia M., Wang J., He Y. Brainnet viewer: a network visualization tool for human brain connectomics. PLoS One . 2013;8(7, article e68910) doi: 10.1371/journal.pone.0068910. [DOI] [PMC free article] [PubMed] [Google Scholar]
- 16.Watts D. J., Strogatz S. H. Collective dynamics of 'small-world' networks. Nature . 1998;393(6684):440–442. doi: 10.1038/30918. [DOI] [PubMed] [Google Scholar]
- 17.Ortiz-Terán L., Diez I., Ortiz T., et al. Brain circuit-gene expression relationships and neuroplasticity of multisensory cortices in blind children. Proceedings National Academy of Sciences. United States of America . 2017;114(26):6830–6835. doi: 10.1073/pnas.1619121114. [DOI] [PMC free article] [PubMed] [Google Scholar]
- 18.Shu N., Liu Y., Li J., Li Y., Yu C., Jiang T. Altered anatomical network in early blindness revealed by diffusion tensor tractography. PLoS One . 2009;4(9, article e7228) doi: 10.1371/journal.pone.0007228. [DOI] [PMC free article] [PubMed] [Google Scholar]
- 19.Aguirre G. K., Datta R., Benson N. C., et al. Patterns of individual variation in visual pathway structure and function in the sighted and blind. PLoS One . 2016;11(11, article e0164677) doi: 10.1371/journal.pone.0164677. [DOI] [PMC free article] [PubMed] [Google Scholar]
- 20.Reislev N. H., Dyrby T. B., Siebner H. R., Lundell H., Ptito M., Kupers R. Thalamocortical connectivity and microstructural changes in congenital and late blindness. Neural Plasticity . 2017;2017:11. doi: 10.1155/2017/9807512.9807512 [DOI] [PMC free article] [PubMed] [Google Scholar]
- 21.Hahn B., Ross T. J., Stein E. A. Cingulate activation increases dynamically with response speed under stimulus unpredictability. Cerebral Cortex . 2007;17(7):1664–1671. doi: 10.1093/cercor/bhl075. [DOI] [PMC free article] [PubMed] [Google Scholar]
- 22.Leech R., Sharp D. J. The role of the posterior cingulate cortex in cognition and disease. Brain . 2014;137(1):12–32. doi: 10.1093/brain/awt162. [DOI] [PMC free article] [PubMed] [Google Scholar]
- 23.Li R., Utevsky A. V., Huettel S. A., et al. Developmental maturation of the precuneus as a functional core of the default mode network. Journal of Cognitive Neuroscience . 2019;31(10):1506–1519. doi: 10.1162/jocn_a_01426. [DOI] [PubMed] [Google Scholar]
- 24.Bruner E., Preuss T. M., Chen X., Rilling J. K. Evidence for expansion of the precuneus in human evolution. Brain Structure & Function . 2017;222(2):1053–1060. doi: 10.1007/s00429-015-1172-y. [DOI] [PMC free article] [PubMed] [Google Scholar]
- 25.Tao Q., Chan C. C. H., Luo Y. J., et al. Prior visual experience modulates learning of sound localization among blind individuals. Brain Topography . 2017;30(3):364–379. doi: 10.1007/s10548-017-0549-z. [DOI] [PMC free article] [PubMed] [Google Scholar]
- 26.Voss P., Pike B. G., Zatorre R. J. Evidence for both compensatory plastic and disuse atrophy-related neuroanatomical changes in the blind. Brain . 2014;137(4):1224–1240. doi: 10.1093/brain/awu030. [DOI] [PubMed] [Google Scholar]
- 27.Li Q., Song M., Xu J., Qin W., Yu C., Jiang T. Cortical thickness development of human primary visual cortex related to the age of blindness onset. Brain Imaging and Behavior . 2017;11(4):1029–1036. doi: 10.1007/s11682-016-9576-8. [DOI] [PubMed] [Google Scholar]
- 28.Park H. J., Lee J. D., Kim E. Y., et al. Morphological alterations in the congenital blind based on the analysis of cortical thickness and surface area. NeuroImage . 2009;47(1):98–106. doi: 10.1016/j.neuroimage.2009.03.076. [DOI] [PubMed] [Google Scholar]
- 29.Maller J. J., Thomson R. H., Ng A., et al. Brain morphometry in blind and sighted subjects. Journal of Clinical Neuroscience . 2016;33:89–95. doi: 10.1016/j.jocn.2016.01.040. [DOI] [PubMed] [Google Scholar]
- 30.Qin W., Liu Y., Jiang T., Yu C. The development of visual areas depends differently on visual experience. PLoS One . 2013;8(1, article e53784) doi: 10.1371/journal.pone.0053784. [DOI] [PMC free article] [PubMed] [Google Scholar]
- 31.Yu C., Liu Y., Li J., et al. Altered functional connectivity of primary visual cortex in early blindness. Human Brain Mapping . 2008;29(5):533–543. doi: 10.1002/hbm.20420. [DOI] [PMC free article] [PubMed] [Google Scholar]
- 32.Burton H., Snyder A. Z., Raichle M. E. Resting state functional connectivity in early blind humans. Frontiers in Systems Neuroscience . 2014;8:p. 51. doi: 10.3389/fnsys.2014.00051. [DOI] [PMC free article] [PubMed] [Google Scholar]
- 33.Collignon O., Vandewalle G., Voss P., et al. Functional specialization for auditory-spatial processing in the occipital cortex of congenitally blind humans. Proceedings National Academy of Sciences. United States of America . 2011;108(11):4435–4440. doi: 10.1073/pnas.1013928108. [DOI] [PMC free article] [PubMed] [Google Scholar]
- 34.Hou F., Liu X., Zhou Z., Zhou J., Li H. Reduction of interhemispheric functional brain connectivity in early blindness: a resting-state fMRI study. BioMed Research International . 2017;2017:8. doi: 10.1155/2017/6756927.6756927 [DOI] [PMC free article] [PubMed] [Google Scholar]
- 35.Krubitzer L. A., Prescott T. J. The combinatorial creature: cortical phenotypes within and across lifetimes. Trends in Neurosciences . 2018;41(10):744–762. doi: 10.1016/j.tins.2018.08.002. [DOI] [PubMed] [Google Scholar]
- 36.Ricciardi E., Papale P., Cecchetti L., Pietrini P. Does (lack of) sight matter for V1? New light from the study of the blind brain. Neuroscience and Biobehavioral Reviews . 2020;118:1–2. doi: 10.1016/j.neubiorev.2020.07.014. [DOI] [PubMed] [Google Scholar]
- 37.Aminoff E. M., Kveraga K., Bar M. The role of the parahippocampal cortex in cognition. Trends in Cognitive Sciences . 2013;17(8):379–390. doi: 10.1016/j.tics.2013.06.009. [DOI] [PMC free article] [PubMed] [Google Scholar]
- 38.Barredo J., Öztekin I., Badre D. Ventral fronto-temporal pathway supporting cognitive control of episodic memory retrieval. Cerebral Cortex . 2015;25(4):1004–1019. doi: 10.1093/cercor/bht291. [DOI] [PMC free article] [PubMed] [Google Scholar]
- 39.Binder J. R., Desai R. H., Graves W. W., Conant L. L. Where is the semantic system? A critical review and meta-analysis of 120 functional neuroimaging studies. Cerebral Cortex . 2009;19(12):2767–2796. doi: 10.1093/cercor/bhp055. [DOI] [PMC free article] [PubMed] [Google Scholar]
- 40.Price C. J. A review and synthesis of the first 20 years of PET and fMRI studies of heard speech, spoken language and reading. NeuroImage . 2012;62(2):816–847. doi: 10.1016/j.neuroimage.2012.04.062. [DOI] [PMC free article] [PubMed] [Google Scholar]
- 41.Bruffaerts R., Dupont P., Peeters R., de Deyne S., Storms G., Vandenberghe R. Similarity of fmri activity patterns in left perirhinal cortex reflects semantic similarity between words. The Journal of Neuroscience . 2013;33(47):18597–18607. doi: 10.1523/JNEUROSCI.1548-13.2013. [DOI] [PMC free article] [PubMed] [Google Scholar]
- 42.Pu Y., Cornwell B. R., Cheyne D., Johnson B. W. The functional role of human right hippocampal/parahippocampal theta rhythm in environmental encoding during virtual spatial navigation. Human Brain Mapping . 2017;38(3):1347–1361. doi: 10.1002/hbm.23458. [DOI] [PMC free article] [PubMed] [Google Scholar]
- 43.Sun L., Frank S. M., Epstein R. A., Tse P. U. The parahippocampal place area and hippocampus encode the spatial significance of landmark objects. NeuroImage . 2021;236, article 118081 doi: 10.1016/j.neuroimage.2021.118081. [DOI] [PubMed] [Google Scholar]
- 44.Cona G., Scarpazza C. Where is the “where” in the brain? A meta-analysis of neuroimaging studies on spatial cognition. Human Brain Mapping . 2019;40(6):1867–1886. doi: 10.1002/hbm.24496. [DOI] [PMC free article] [PubMed] [Google Scholar]
- 45.Handjaras G., Ricciardi E., Leo A., et al. How concepts are encoded in the human brain: a modality independent, category- based cortical organization of semantic knowledge. NeuroImage . 2016;135:232–242. doi: 10.1016/j.neuroimage.2016.04.063. [DOI] [PubMed] [Google Scholar]
- 46.Gagnon L., Schneider F. C., Siebner H. R., Paulson O. B., Kupers R., Ptito M. Activation of the hippocampal complex during tactile maze solving in congenitally blind subjects. Neuropsychologia . 2012;50(7):1663–1671. doi: 10.1016/j.neuropsychologia.2012.03.022. [DOI] [PubMed] [Google Scholar]
- 47.Meissner T. W., Genç E., Mädler B., Weigelt S. Myelin development in visual scene-network tracts beyond late childhood: a multimethod neuroimaging study. Cortex . 2021;137:18–34. doi: 10.1016/j.cortex.2020.12.016. [DOI] [PubMed] [Google Scholar]
- 48.Mesulam M. M. From sensation to cognition. Brain . 1998;121(6):1013–1052. doi: 10.1093/brain/121.6.1013. [DOI] [PubMed] [Google Scholar]
- 49.Baker S. T. E., Lubman D. I., Yucel M., et al. Developmental changes in brain network hub connectivity in late adolescence. The Journal of Neuroscience . 2015;35(24):9078–9087. doi: 10.1523/JNEUROSCI.5043-14.2015. [DOI] [PMC free article] [PubMed] [Google Scholar]
- 50.Cao M., Huang H., Peng Y., Dong Q., He Y. Toward developmental connectomics of the human brain. Frontiers in Neuroanatomy . 2016;10:p. 25. doi: 10.3389/fnana.2016.00025. [DOI] [PMC free article] [PubMed] [Google Scholar]
- 51.Oldham S., Fornito A. The development of brain network hubs. Developmental Cognitive Neuroscience . 2019;36, article 100607 doi: 10.1016/j.dcn.2018.12.005. [DOI] [PMC free article] [PubMed] [Google Scholar]
- 52.Zhou Z., Shi L., Xu J., Liu X., Li H., Qian L. Montreal, Cananda; 2019. ISMRM 27 annual meeting & exhibition. https://archive.ismrm.org/2019/0347.html. [Google Scholar]
Associated Data
This section collects any data citations, data availability statements, or supplementary materials included in this article.
Supplementary Materials
Supplemental Table S1: Definitions and interpretations of global and nodal network metrics. Supplemental Table S2: Brain regions with moderate differences of NCp between EBA and NSC groups. Supplemental Figure S1: Brain regions with moderate differences in NCp in EBA cohort.
Data Availability Statement
The data that support the findings of this study are available on request from the corresponding author Dr. Xia Liu (auraliu0061@126.com). The data are not publicly available due to privacy or ethical restrictions.