Abstract
Gradient-based analyses have contributed to the description of cerebellar functional neuroanatomy. More recently, functional gradients of the cerebellum have been used as a multi-purpose tool for neuroimaging research. Here, we provide an overview of the many practical applications of cerebellar functional gradient analyses. These practical applications include examination of intra-cerebellar and cerebellar-extracerebellar organization; transformation of functional gradients into parcellations with discrete borders; projection of functional gradients calculated within cerebellar structures to other extracerebellar structures; interpretation of cerebellar neuroimaging findings using qualitative and quantitative methods; detection of differences in patient populations; and other more complex practical applications of cerebellar gradient-based analyses. This review may serve as an introduction and catalog of options for neuroscientists who wish to design and analyze imaging studies using functional gradients of the cerebellum.
Introduction
A large and expanding body of neuroimaging literature has mapped motor, cognitive, and affective task processes and resting-state networks in the human cerebellum. This field of research has played a key role in the development of modern cerebellar systems neuroscience — the cerebellum is now appreciated as a structure relevant for virtually all aspects of human behavior in health and disease. Knowledge of cerebellar organization as indexed by these studies has also served as a tool for the interpretation of neuroimaging findings in patient populations. Gradient-based analyses provide an additional mode of neuroimaging data analysis and visualization, and generate a new set of possibilities to describe and interpret cerebellar functional properties. These new possibilities range from the description of axes of macro-scale organization that define the position and relationship between different functional territories of the cerebellum, to the interpretation and detection of functional abnormalities in patients that relate to these modes of organization. The first part of this article introduces readers to the calculation and interpretation of cerebellar functional gradients; specific cases of practical applications are reviewed in the second part. This review may serve as an introduction and catalog of options for neuroscientists who wish to design and analyze imaging studies using functional gradients of the cerebellum.
Part I: Calculation and Interpretation of Functional Gradients of the Cerebellum
Calculation of Functional Gradients of the Cerebellum
Functional gradients of the cerebellum were first described by Guell and colleagues [1]. Their calculation was based on diffusion map embedding methodology introduced by Coifman [2], and first applied to resting-state fMRI data by Langs [3] and Margulies [4]. A schematic and description of this methodology are presented in Figure 1.
Fig. 1.
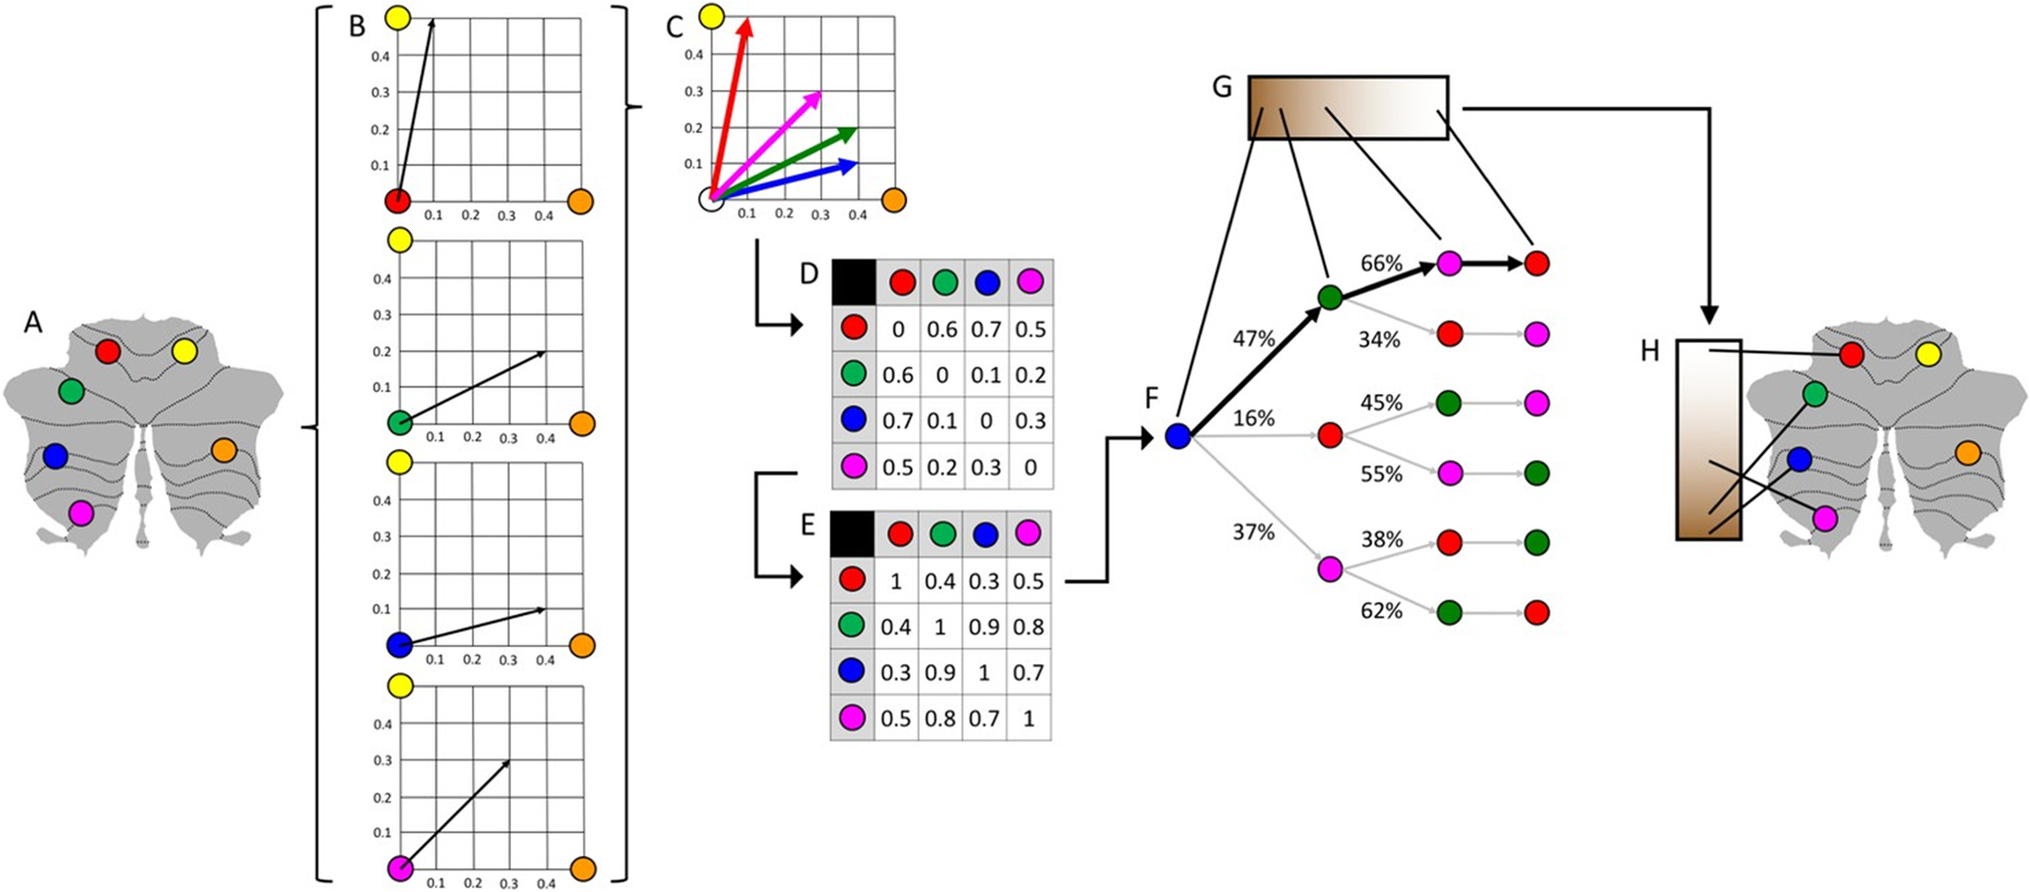
Schematic representation of the calculation of cerebellar functional gradients using resting-state MRI data. As implemented in [1], resting-state data were provided by the Human Connectome Project [5]; cerebellar cortex in this figure and other figures in this paper is represented using cerebellar flat maps as developed by Diedrichsen and colleagues [6]. A This example illustrates the calculation of the principal functional gradient of 4 cerebellar voxels (red, green, blue, magenta) based on their functional connectivity with two target cerebellar voxels (yellow, orange). B Resting-state functional connectivity from each cerebellar voxel (red, green, blue, magenta) to the two target cerebellar voxels (yellow, orange) is represented as a two-dimensional vector. C All vectors can be represented in the same two-dimensional space. D Cosine distance between each pair of vectors is calculated, and E An affinity matrix is constructed as (1-cosine distance) for each pair of vectors. This affinity matrix represents the similarity of the connectivity patterns of each pair of voxels. (F) A Markov chain is constructed using information from the affinity matrix. Information from the affinity matrix is thus used to represent the probability of transition between each pair of vectors. There will be higher transition probability between pairs of voxels with similar connectivity patterns; this probability of transition between each pair of vectors can be analyzed as a symmetric transformation matrix, allowing the calculation of eigenvectors. (G) Eigenvectors derived from this transformation matrix represent the principal orthogonal directions of transition between all pairs of voxels. Here, we illustrate the first resulting component of this analysis — the principal functional gradient of four cerebellar voxels (red, green, blue, magenta) based on their connectivity with two target cerebellar voxels (yellow, orange) progresses from the blue, to the green, to the magenta, to the red voxel. (H) This order is mapped back into a cerebellum map, allowing us to generate functional neuroanatomical descriptions. Of note, cerebellar functional gradients in [1] were calculated using functional connectivity values of each cerebellar voxel with the rest of cerebellar voxels (rather than between four voxels and only two target cerebellar voxels, as in this example); vectors in [1] thus possessed many more than just two dimensions, but cosine distance can also be calculated between pairs of high-dimensional vectors. In this way, diffusion map embedding using functional connectivity values from each cerebellar voxel to all cerebellar voxels captures the principal gradients of cerebellar functional neuroanatomy. Adapted from [1]
Interpretation of Functional Gradients of the Cerebellum
A detailed description and interpretation of the functional gradients of the cerebellum are provided in the original report by Guell and collegues [1]. In brief, Gradient 1 captures a progression from primary (motor), to attentional/executive areas, to transmodal (default-mode, task-unfocused) regions. Gradient 2 isolates attentional/executive processing. Gradient 1 explains the largest portion of variability in resting-state connectivity patterns within the cerebellum, and for this reason is interpreted as the main axis of macroscale functional organization of the cerebellar cortex. Gradient 2 is the component accounting for the second-most variance and is interpreted as a secondary axis of functional organization. See Figure 2 and [1] for further details.
Fig. 2.
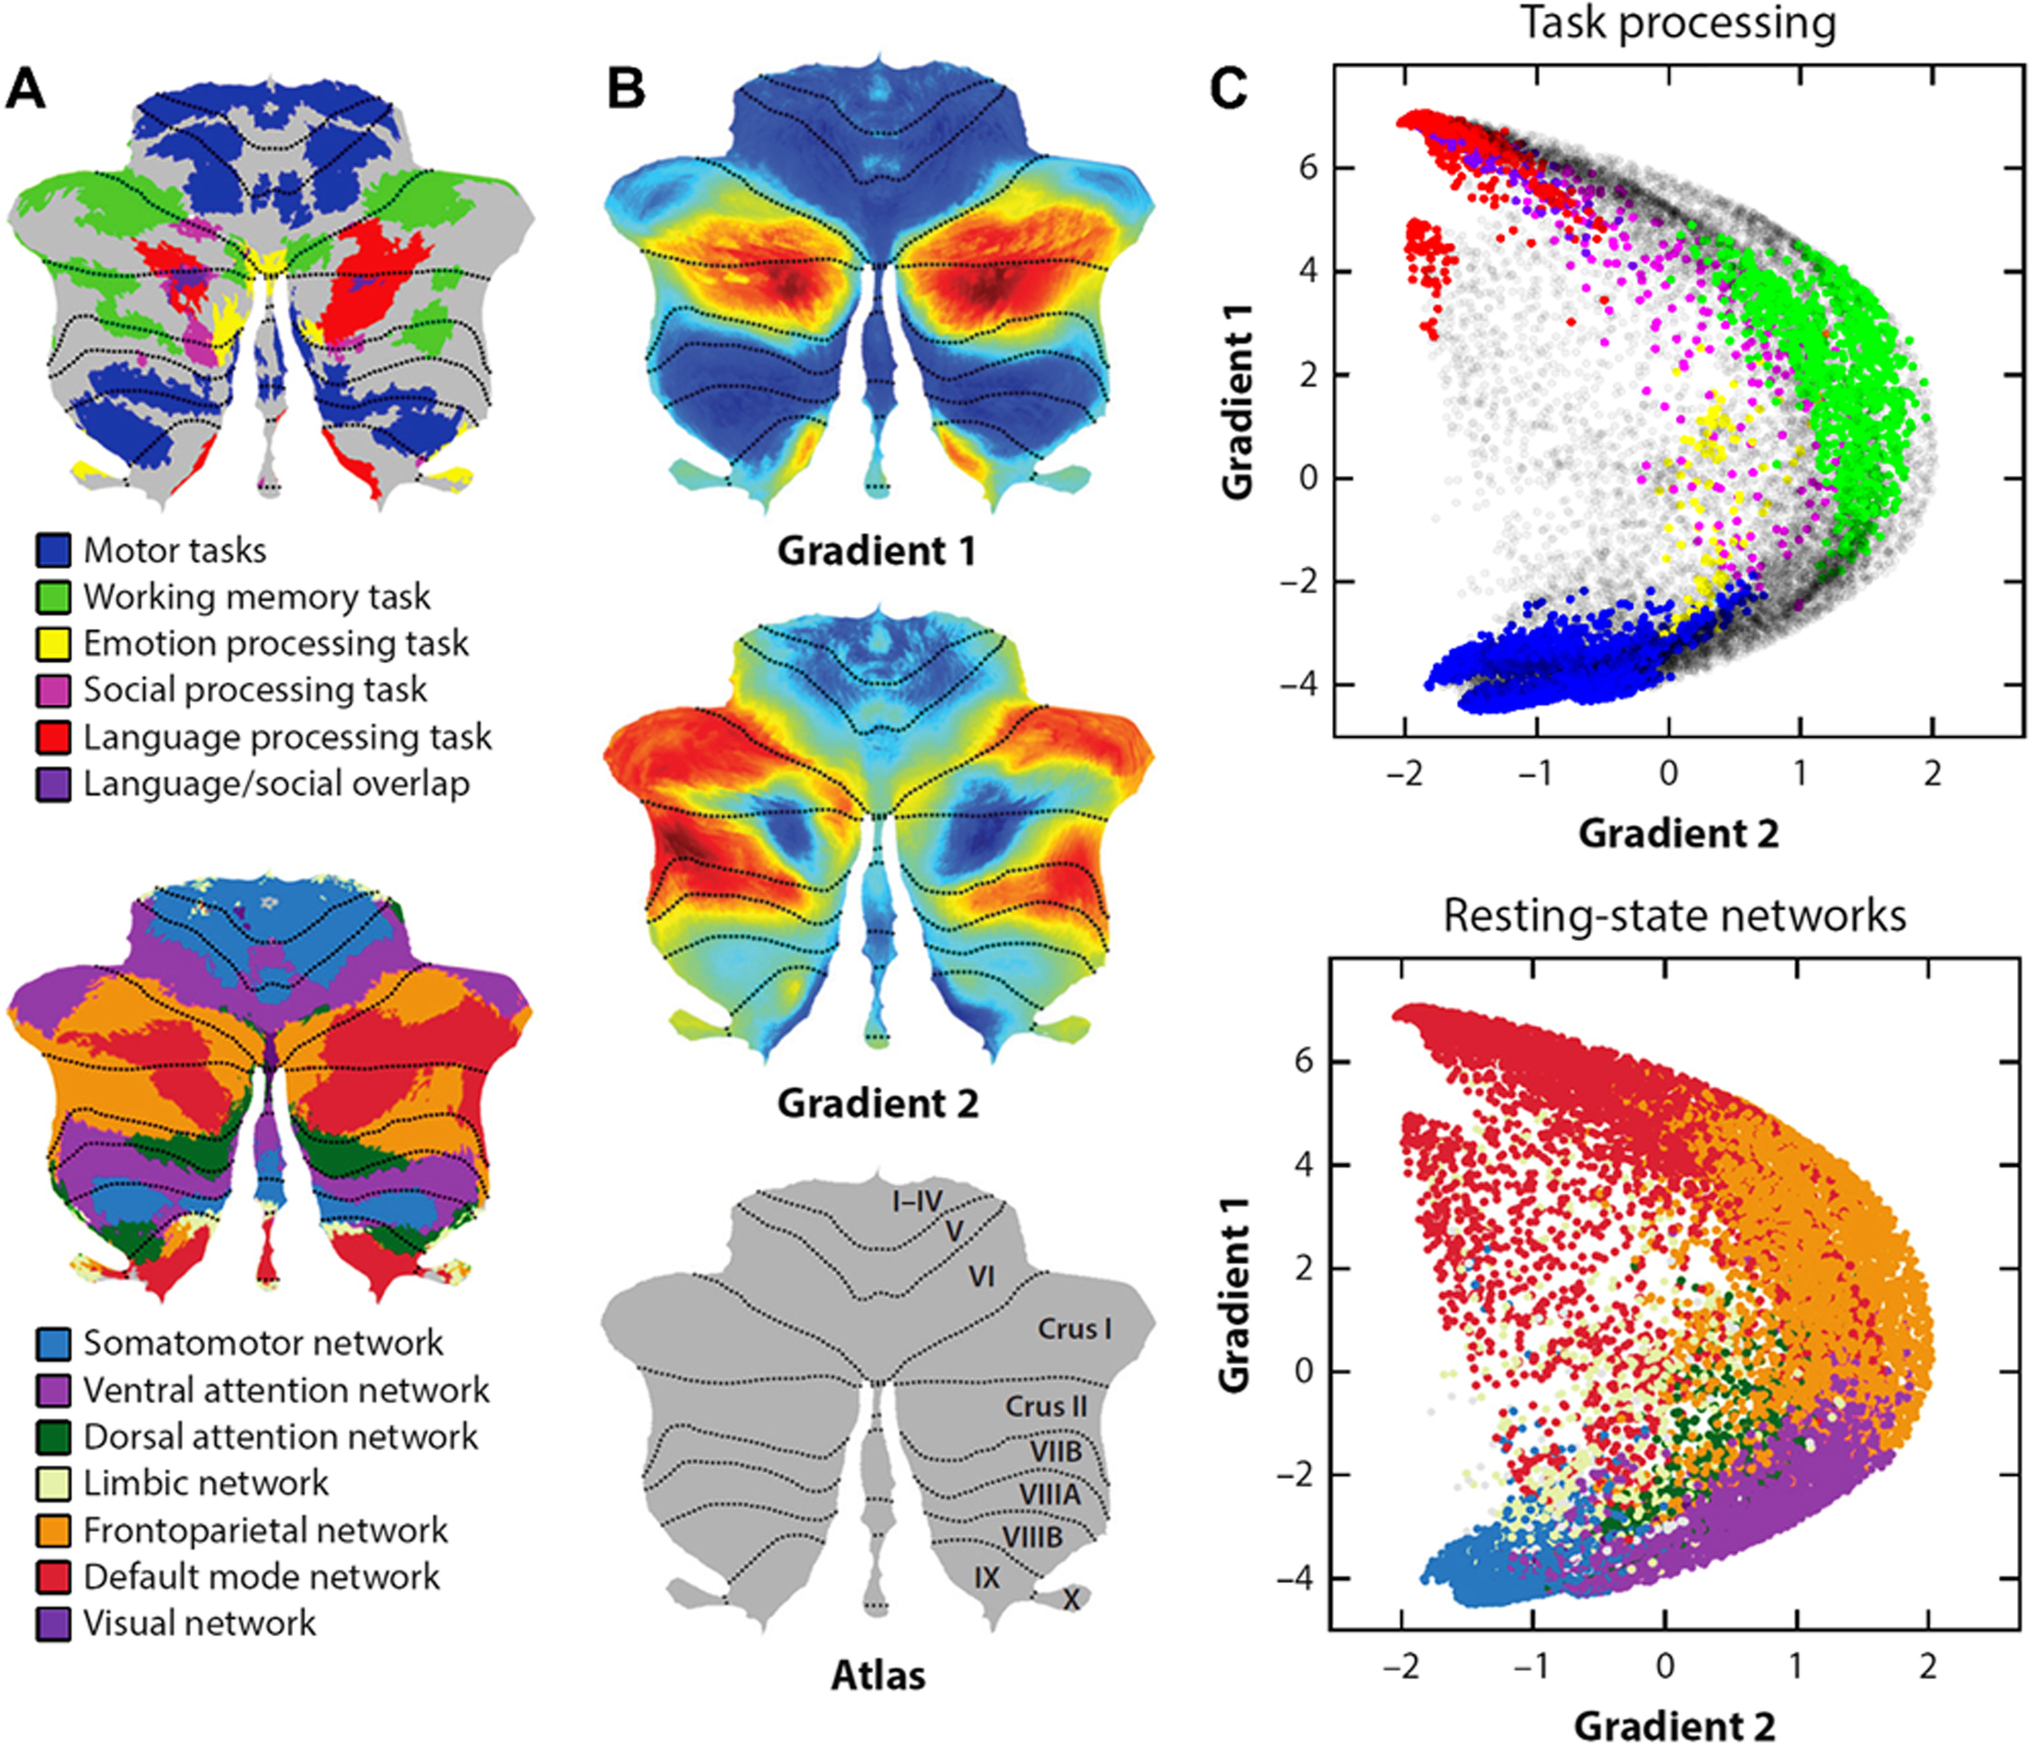
Functional gradients of the cerebellum. A Cerebellar task activation maps (top) [7] and resting-state networks (bottom) [8]. B Cerebellar functional gradients [1]. C Relationship of functional gradients 1 and 2 with task activation maps (top) and resting-state networks (bottom). Each dot corresponds to one cerebellar voxel; vertical/horizontal position of each dot corresponds to gradient 1/gradient 2 values for that voxel; color of each dot indicates whether each voxel belongs to a particular task activation (top) or resting-state network (bottom). Gradient 1 captures a progression from primary (motor), to attentional/executive areas, to transmodal (default-mode, task-unfocused) regions. Gradient 2 isolates attentional/executive processing. Note that the language task of the Human Connectome Project overlaps with default-mode network as it subtracts a condition where participants listen to stories minus a condition where participants perform math calculations; the subtraction of math calculations in this task contrast results in the subtraction of attentional processing, resulting in an activation map similar to the default-mode network.
Part II: Practical Applications
Practical Application I: Description of Intra-cerebellar Functional Anatomy
Functional gradients of the cerebellum provide a new perspective to examine intra-cerebellar functional anatomy [1]. Contrasting with classical descriptions of cerebellar function that are based on discrete borders, functional gradients capture gradual transitions between cerebellar functional territories, provide novel information regarding the relationship between distinct functional zones of the cerebellar cortex, and generate not one but multiple maps of cerebellar functional anatomy (i.e. not one but multiple functional gradients). In the example above, gradient 1 represents the main axis of cerebellar functional organization from primary (motor), to attentional/executive areas, to transmodal (default-mode, task-unfocused) regions. Gradient 2 captures a smaller portion of data variability and is understood as a secondary axis of functional organization that isolates attentional/executive processing. Additional gradients can be generated, although their relevance and replicability at the single-subject level decreases significantly (Figure 3). Code to generate functional gradients of the cerebellum is available at https://github.com/xaviergp/cerebellum_gradients.
Fig. 3.

The first eight functional gradients of the cerebellum. Note that each functional gradient explains a lower amount of data variability; their relevance and replicability at the single-subject level decreases significantly. Adapted from [1]
Practical Application II: Description of Cerebellar Functional Anatomy Based on Cerebellar-Extracerebellar Connectivity
Functional gradients of the cerebellum can be calculated based on intra-cerebellar functional connectivity data, i.e. based on functional connectivity between each datapoint in the cerebellar cortex. A different practical application is to calculate functional gradients of the cerebellum based on functional connectivity between cerebellar and extracerebellar structures. In this case, the initial correlation matrix will be asymmetric; for example, 2000 datapoints in the cerebellum can be correlated to 50,000 datapoints in the cerebral cortex. A 50,000-dimensional vector will be calculated for each datapoint in the cerebellum, resulting in 2000 vectors with 50,000 dimensions each. Each vector will represent each cerebellar datapoint’s pattern of connectivity to the cerebral cortex. Once a vector has been created for each cerebellar datapoint, cosine distances between each pair of cerebellar vectors can be calculated, resulting in a symmetric matrix (in this example, 2000 × 2000) that can be analyzed following the method described in Figure 1. The result of that analysis will be functional gradients in the cerebellar cortex that represent connectivity between the cerebellum and the cerebral cortex. An example is shown in Figure 4, adapted from [1]. Code for these analyses is available at https://github.com/xaviergp/cerebellum_gradients.
Fig. 4.
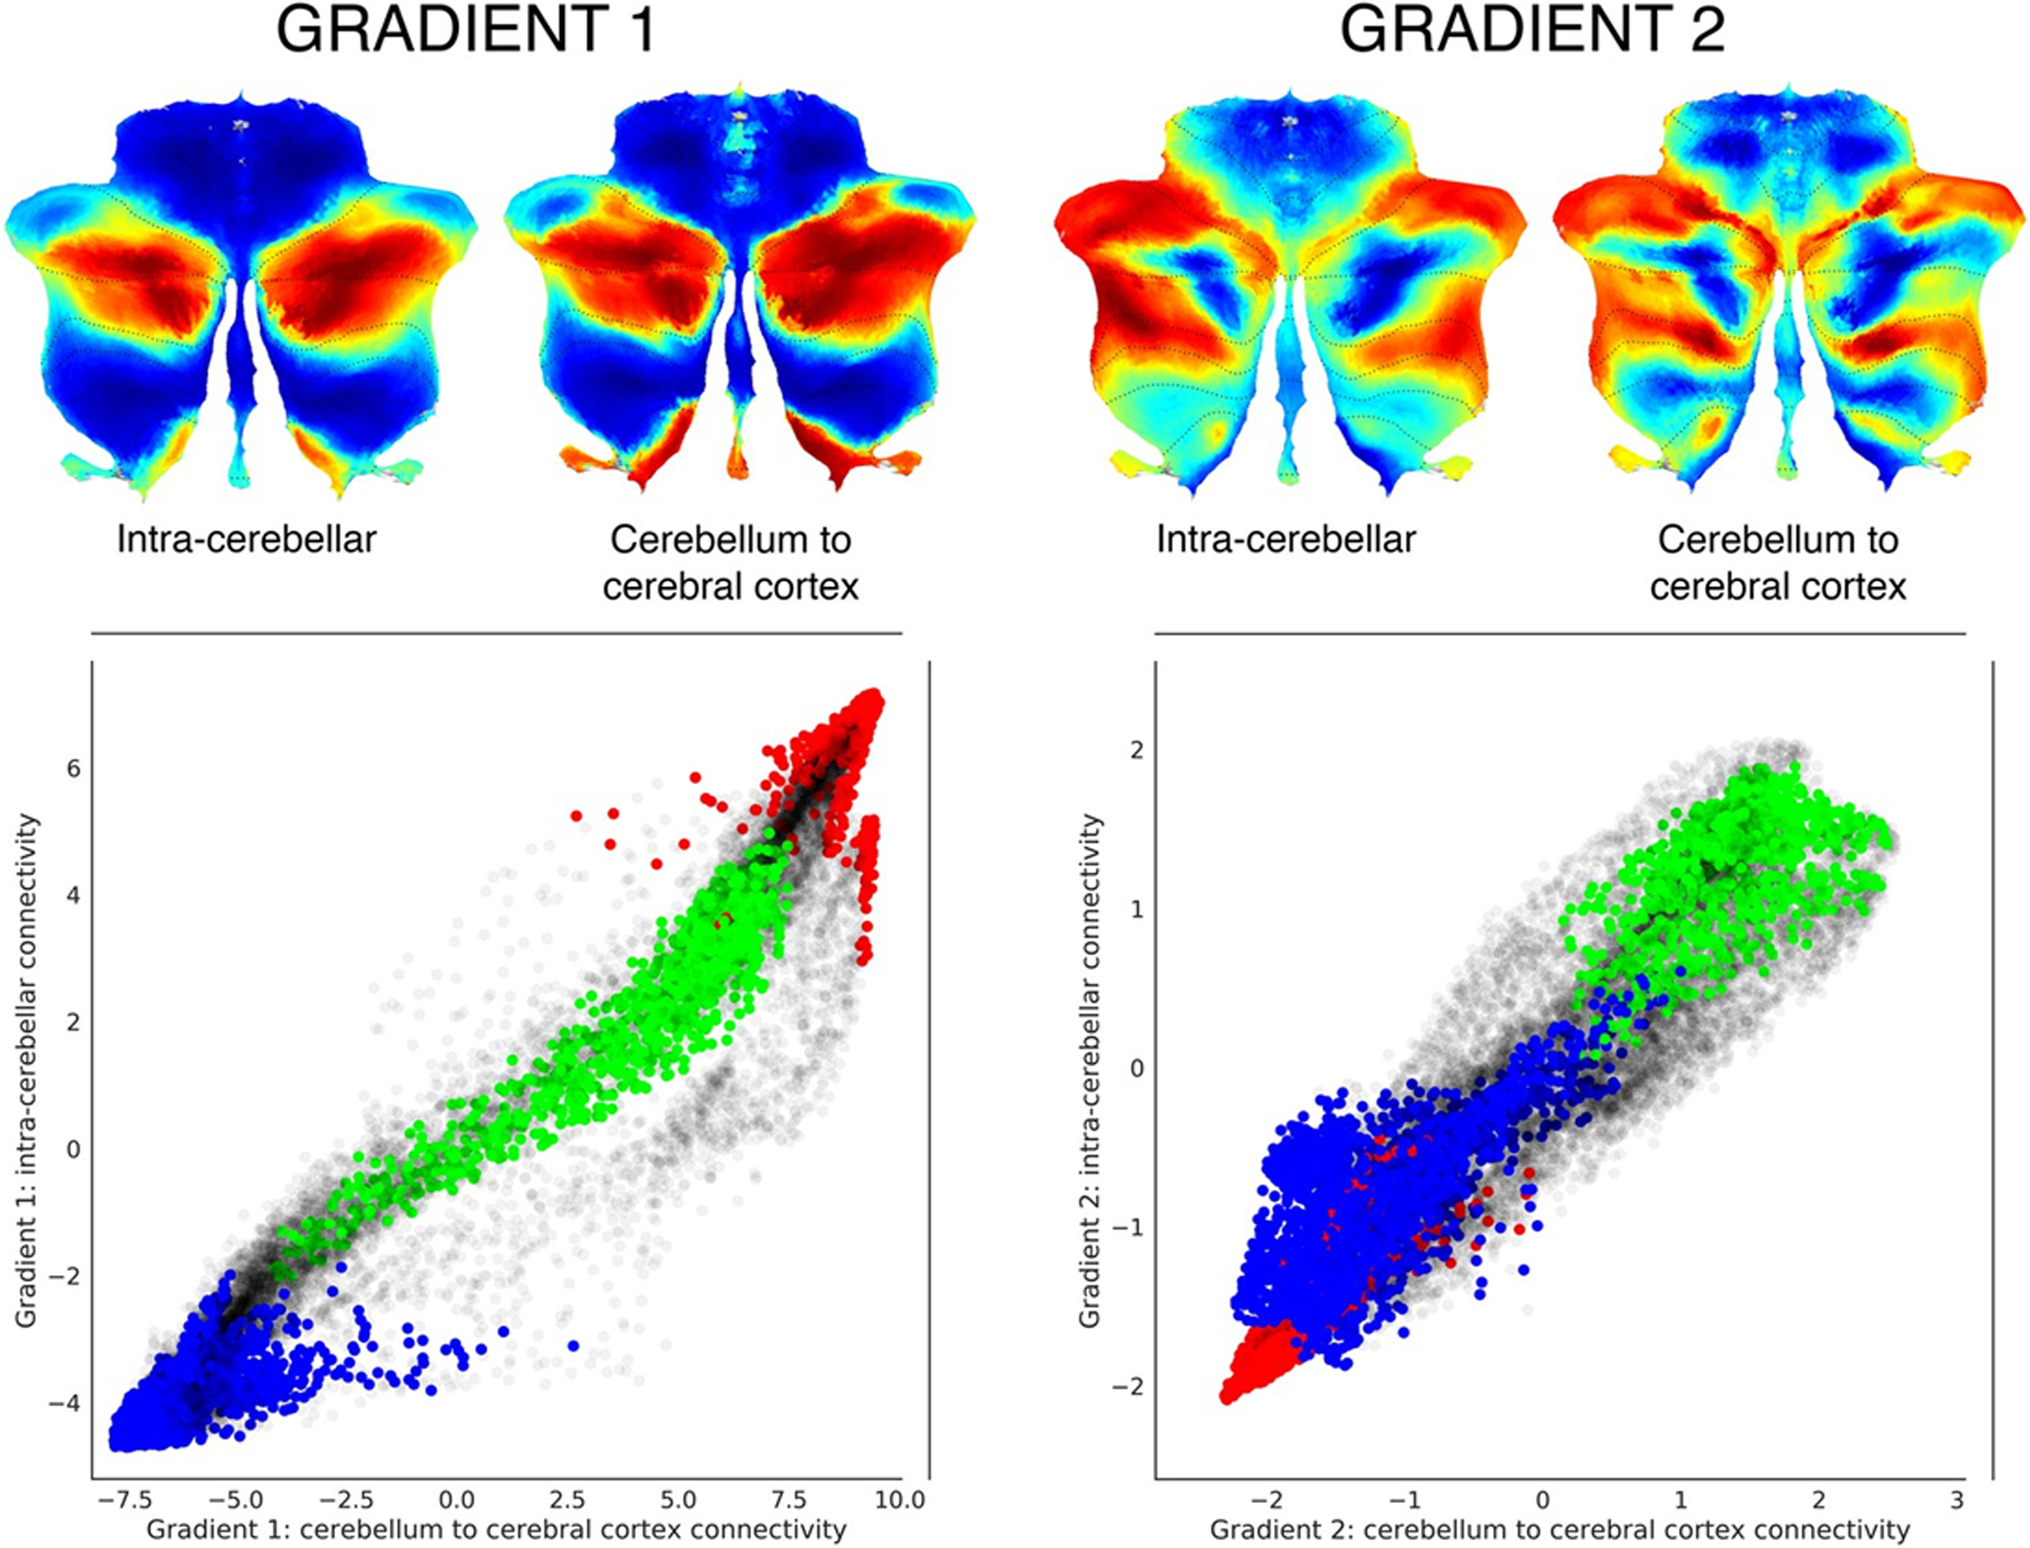
Functional gradients calculated based on functional connectivity between the cerebellum and the cerebral cortex, compared to functional gradients calculated based on functional connectivity within the cerebellum. Left scatterplot represents intra-cerebellar gradient 1 (y axis) vs. cerebellum-to-cerebral-cortex gradient 1 (x axis). Right scatterplot represents intra-cerebellar gradient 2 (y axis) vs. cerebellum-to-cerebral-cortex gradient 2 (x axis). Scatterplot colors correspond to cerebellar task activation maps as shown in Fig. 2: motor (blue), working memory (task-focused cognitive processing) (green), and language (task-unfocused cognitive processing) (red). As in the case of intra-cerebellar functional gradient 1 (left y axis), cerebello-cortical gradient 1 (left x axis) distinguishes motor (blue) vs. task-positive cognitive processing (green) vs. task-negative cognitive processing (red). Similarly, as in the case of intra-cerebellar functional gradient 2 (right y axis), cerebello-cortical gradient 2 (right x axis) isolates task-positive cognitive processing (green). This observation supports the hypothesis that the functional organization of the cerebellum is strongly linked to the connections between the cerebellum and the extracerebellum. Adapted from [1]
Practical Application III: Description of Cerebellar Functional Anatomy as a Projection to Extracerebellar Structures
Gradients calculated in cerebellar structures (e.g. dentate nuclei) can be projected to an extracerebellar structure (e.g. cerebral cortex). The result of this calculation is a functional anatomical map displayed in an extracerebellar structure (e.g. cerebral cortex) that in fact represents the functional organization of a structure in the cerebellum (e.g. dentate nuclei). For example, functional gradients can be calculated in the dentate nuclei based on functional connectivity from the dentate nuclei to the cerebral cortex (starting with an asymmetric correlation matrix, and then generating a symmetric matrix of dentate nuclei vectors, as in Practical Application II); the method then proceeds as follows. For each DN functional gradient (G) and each DN voxel (V), the cerebral cortical functional connectivity map of each voxel V is multiplied by the G value of V. For example, for DN functional gradient 1, cerebral cortical functional connectivity map of voxel A is multiplied by the functional gradient 1 value of voxel A; cerebral cortical functional connectivity map of voxel B is multiplied by the functional gradient 1 value of voxel B; and so on for each voxel in DN. Then, all weighted cerebral cortical functional connectivity maps (as many as the total number of voxels in DN) are added together. The resulting cerebral cortical maps (one for each DN functional gradient) provide a visualization of the significance of each DN functional gradient in terms of functional connectivity to cerebral cortex — i.e., DN functional gradients have been “projected” to the cerebral cortex. The result of this analysis is shown in Figure 5 and is based on [9]. Code for these analyses is available at https://github.com/xaviergp/dentate.
Fig. 5.
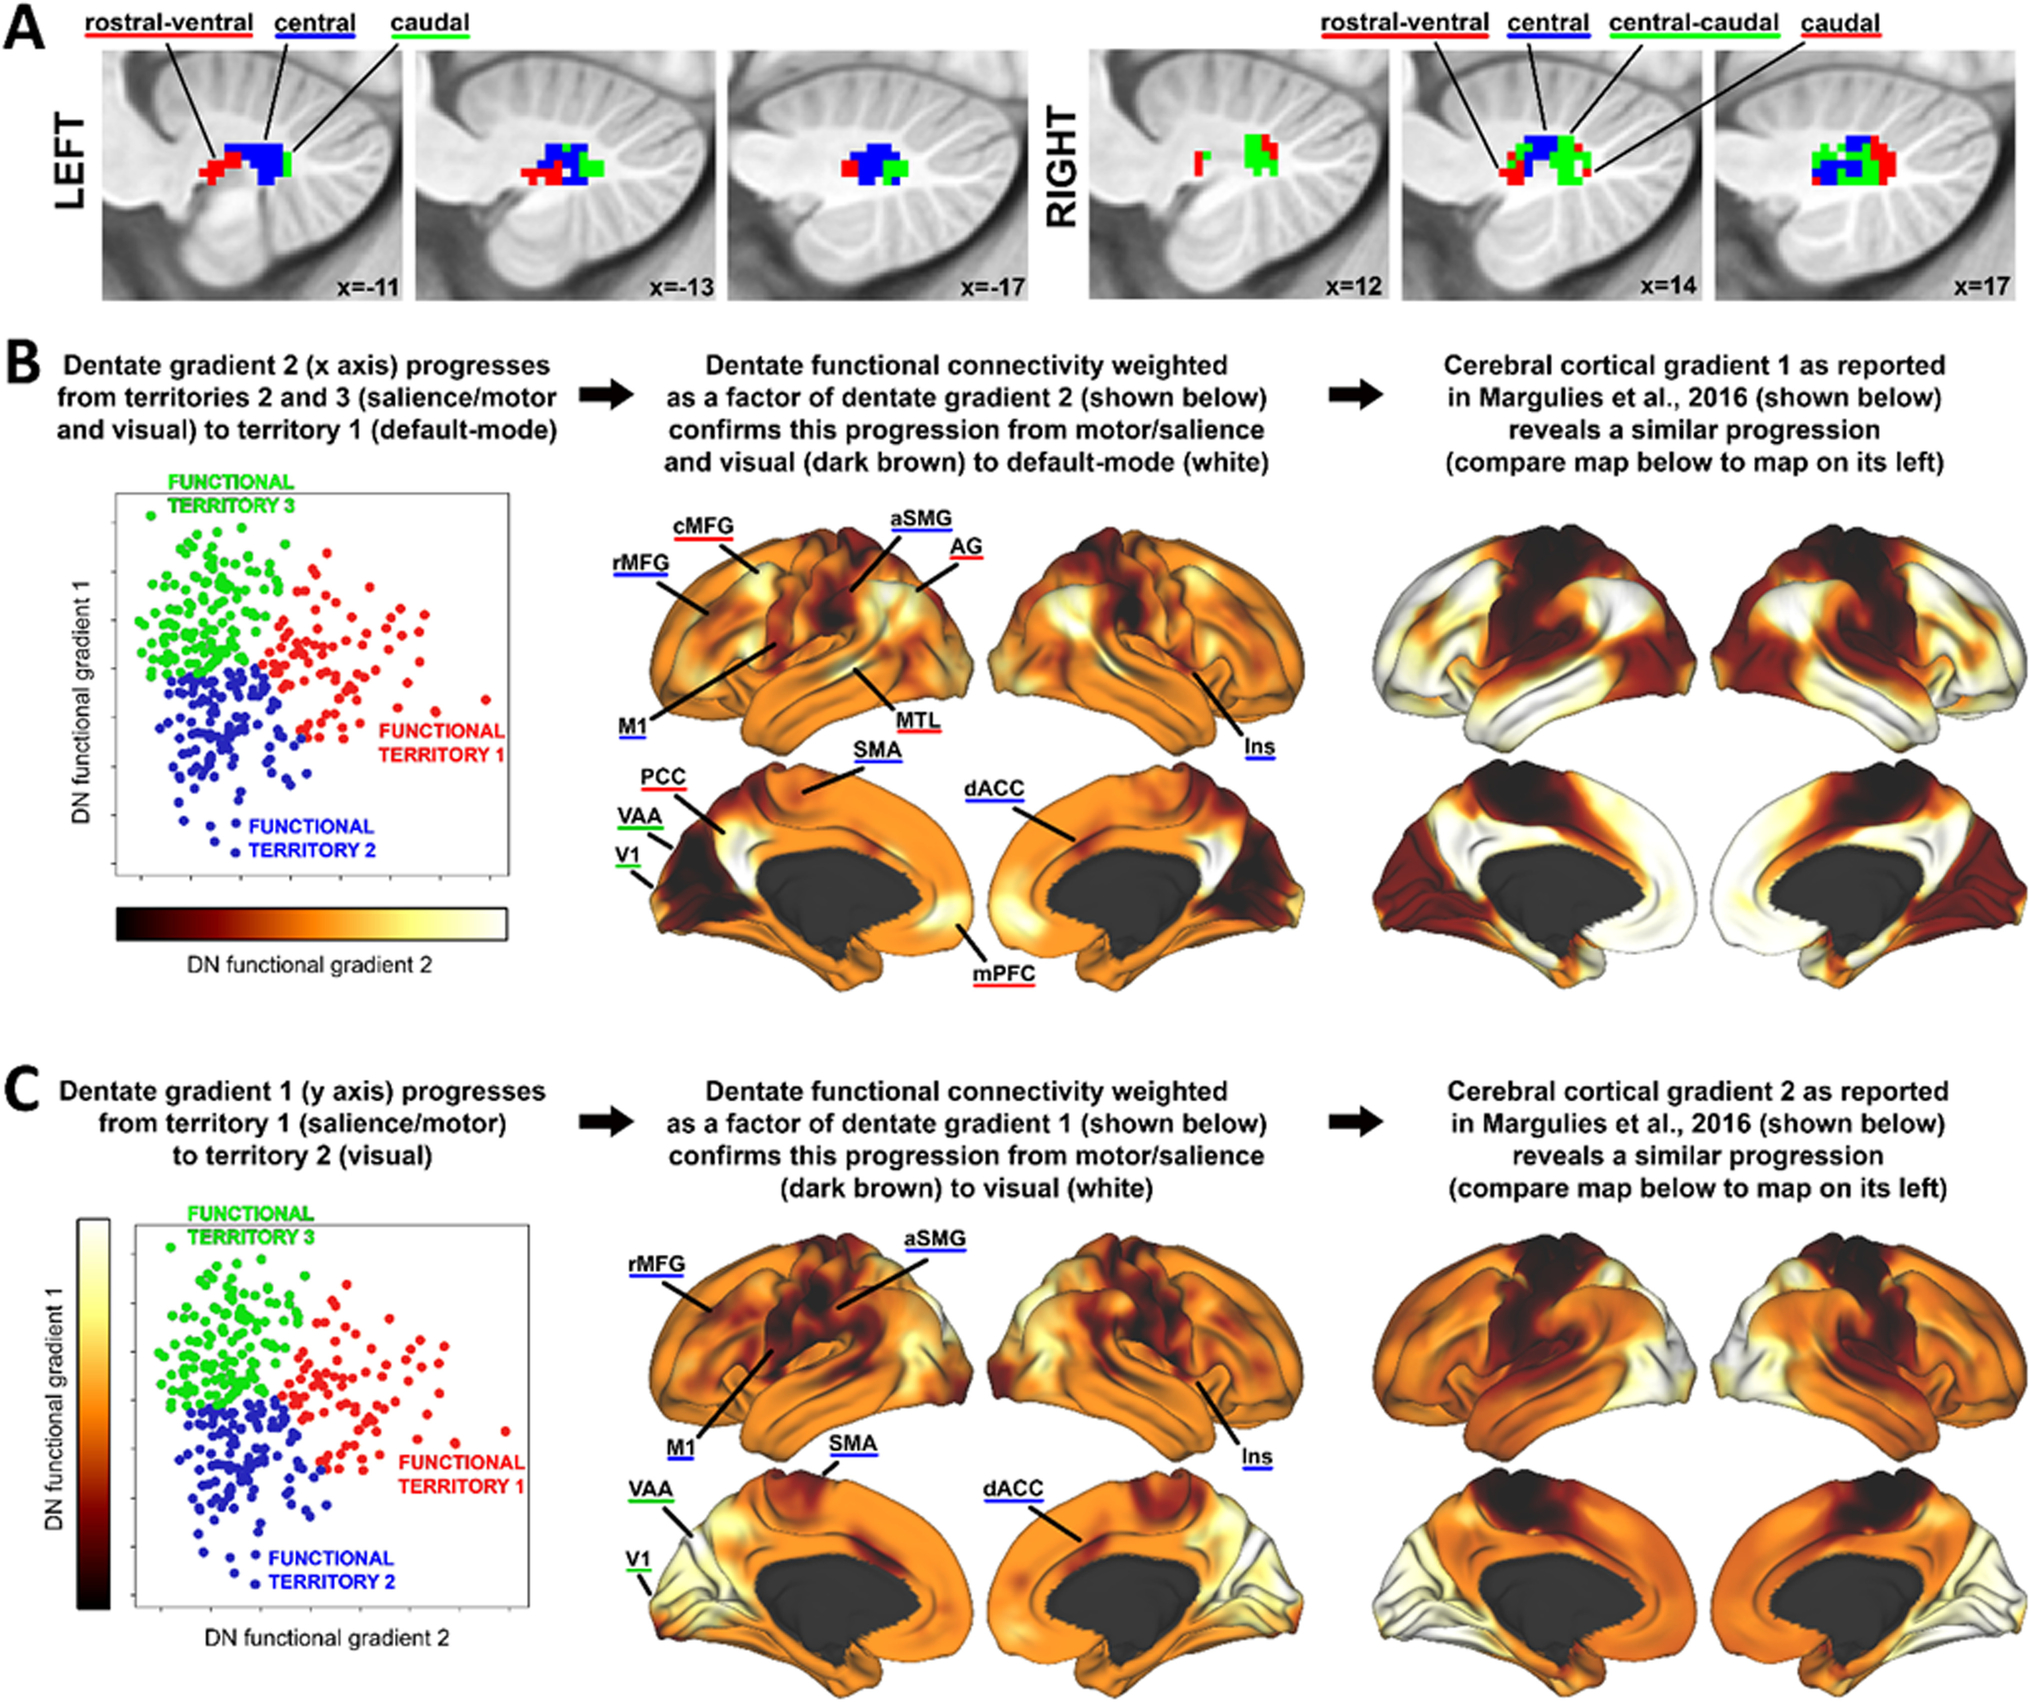
Functional gradients of the dentate nuclei projected to the cerebral cortex. A Functional territories of the dentate nuclei (red, blue, green) based on clustering of functional gradients that are calculated using resting-state functional connectivity between the dentate nuclei and the cerebral cortex, as described in [9], following the methodology described in Practical application II. B Dentate nuclei functional gradient 2 projected to the cerebral cortex (Practical application III) captures a progression toward the default-mode network (central panel), similar to the organization of the first gradient of intra-cerebral cortical functional organization reported in [4] (right panel). C Dentate nuclei functional gradient 1 captures a progression from a salience/motor network to visual network (central panel), similar to the organization of the second gradient of intra-cerebral cortical functional organization reported in [4] (right panel). Adapted from [9]
A combination of Practical Application II and III results in a wide range of possible analyses to describe the relationship between the cerebellum and the extracerebellum: functional gradient calculated in structure A, based on its connectivity with structure B, and projected to structure C; in the example above, A=dentate nuclei, B=cerebral cortex, C=cerebral cortex.
Practical Application IV: Description of Cerebellar Anatomy Based on Discrete Borders
Functional gradients of the cerebellum can be transformed into parcellations with discrete borders using clustering analyses. Multiple variations of these analyses are possible, including different methods of clustering (e.g. k-means clustering, spectral clustering), inclusion of different gradients (e.g. only the principal functional gradient, the first two gradients, the first eight gradients), different gradient pre-processing options prior to clustering (e.g. normalization of gradients to assign equal weight to all gradients), and methods to calculate the optimal number of clusters (e.g. silhouette coefficient analysis; required for methods where a specific number of clusters must be specified). These calculations can reveal, for example, that atlases based on discrete borders (e.g. [8]) may be recreated from functional gradients, as shown in the example presented in Figure 6. Clustering analyses of functional gradients can also reveal discrete parcellations that would not be obtained using more conventional methods to partition the cerebellum into discrete territories; for example, one could apply clustering analyses to non-principal functional gradients, or apply clustering analyses to functional gradients calculated based on a particular combination of cerebellar-extracerebellar connectivity (see Practical Application II and III). Thresholding of functional gradient values can also generate discrete parcellations that can be used in analyses of cerebellar function (for example, top 5% values of gradient 1 as a marker of cerebellar default mode network, bottom 5% values of gradient 1 as a marker of cerebellar motor network, and top 5% values of gradient 2 as a marker of cerebellar attentional network, as done in [10]). Code for these analyses is available at https://github.com/xaviergp/cerebellum_gradients.
Fig. 6.

Clustering of cerebellar functional gradients to obtain discrete parcellations. A Silhouette coefficient analysis reveals an optimal number of 14 and 18 clusters for k-means and spectral clustering, respectively, when using the first eight functional gradients of the cerebellar cortex. Both clustering approaches revealed a distribution of parcels similar to the 17-network cerebello-cerebral connectivity parcellation from [8]. B K-means and spectral clustering using five clusters and gradients 1 and 2 revealed a distribution of parcels similar to the 7-network cerebello-cerebral connectivity parcellation from [8], as well as a pattern of inverted representations (inverted pattern indicated with an asterisk) (5 clusters are used instead of 7 given the very small size of the limbic and visual networks in the Buckner atlas). Adapted from [1]
Practical Application V: Topographical Interpretation of Cerebellar Neuroimaging Findings
Functional gradients of the cerebellum can be used to capture subtle, progressive aspects of cerebellar functional neuroanatomy that would be difficult to visualize using conventional discrete parcellations of the cerebellum. Discrete atlases of cerebellar functional organization are commonly used to interpret results of cerebellar imaging studies. For example, the location of a region of the cerebellum that shows a reduction of grey matter volume in Alzheimer’s disease can be overlapped on an atlas of cerebellar functional networks (e.g. motor network, default-mode network, etc.) to interpret its functional significance. The same region of the cerebellum can be mapped along functional gradients, rather than overlapped on discrete atlases of the cerebellum, using the LittleBrain toolbox [11]. An example is shown in Figure 7; see also [12–15] as other examples of studies using the LittleBrain toolbox to interpret the functional significance of cerebellar neuroimaging findings. Code for these analyses is available at https://github.com/xaviergp/littlebrain.
Fig. 7.
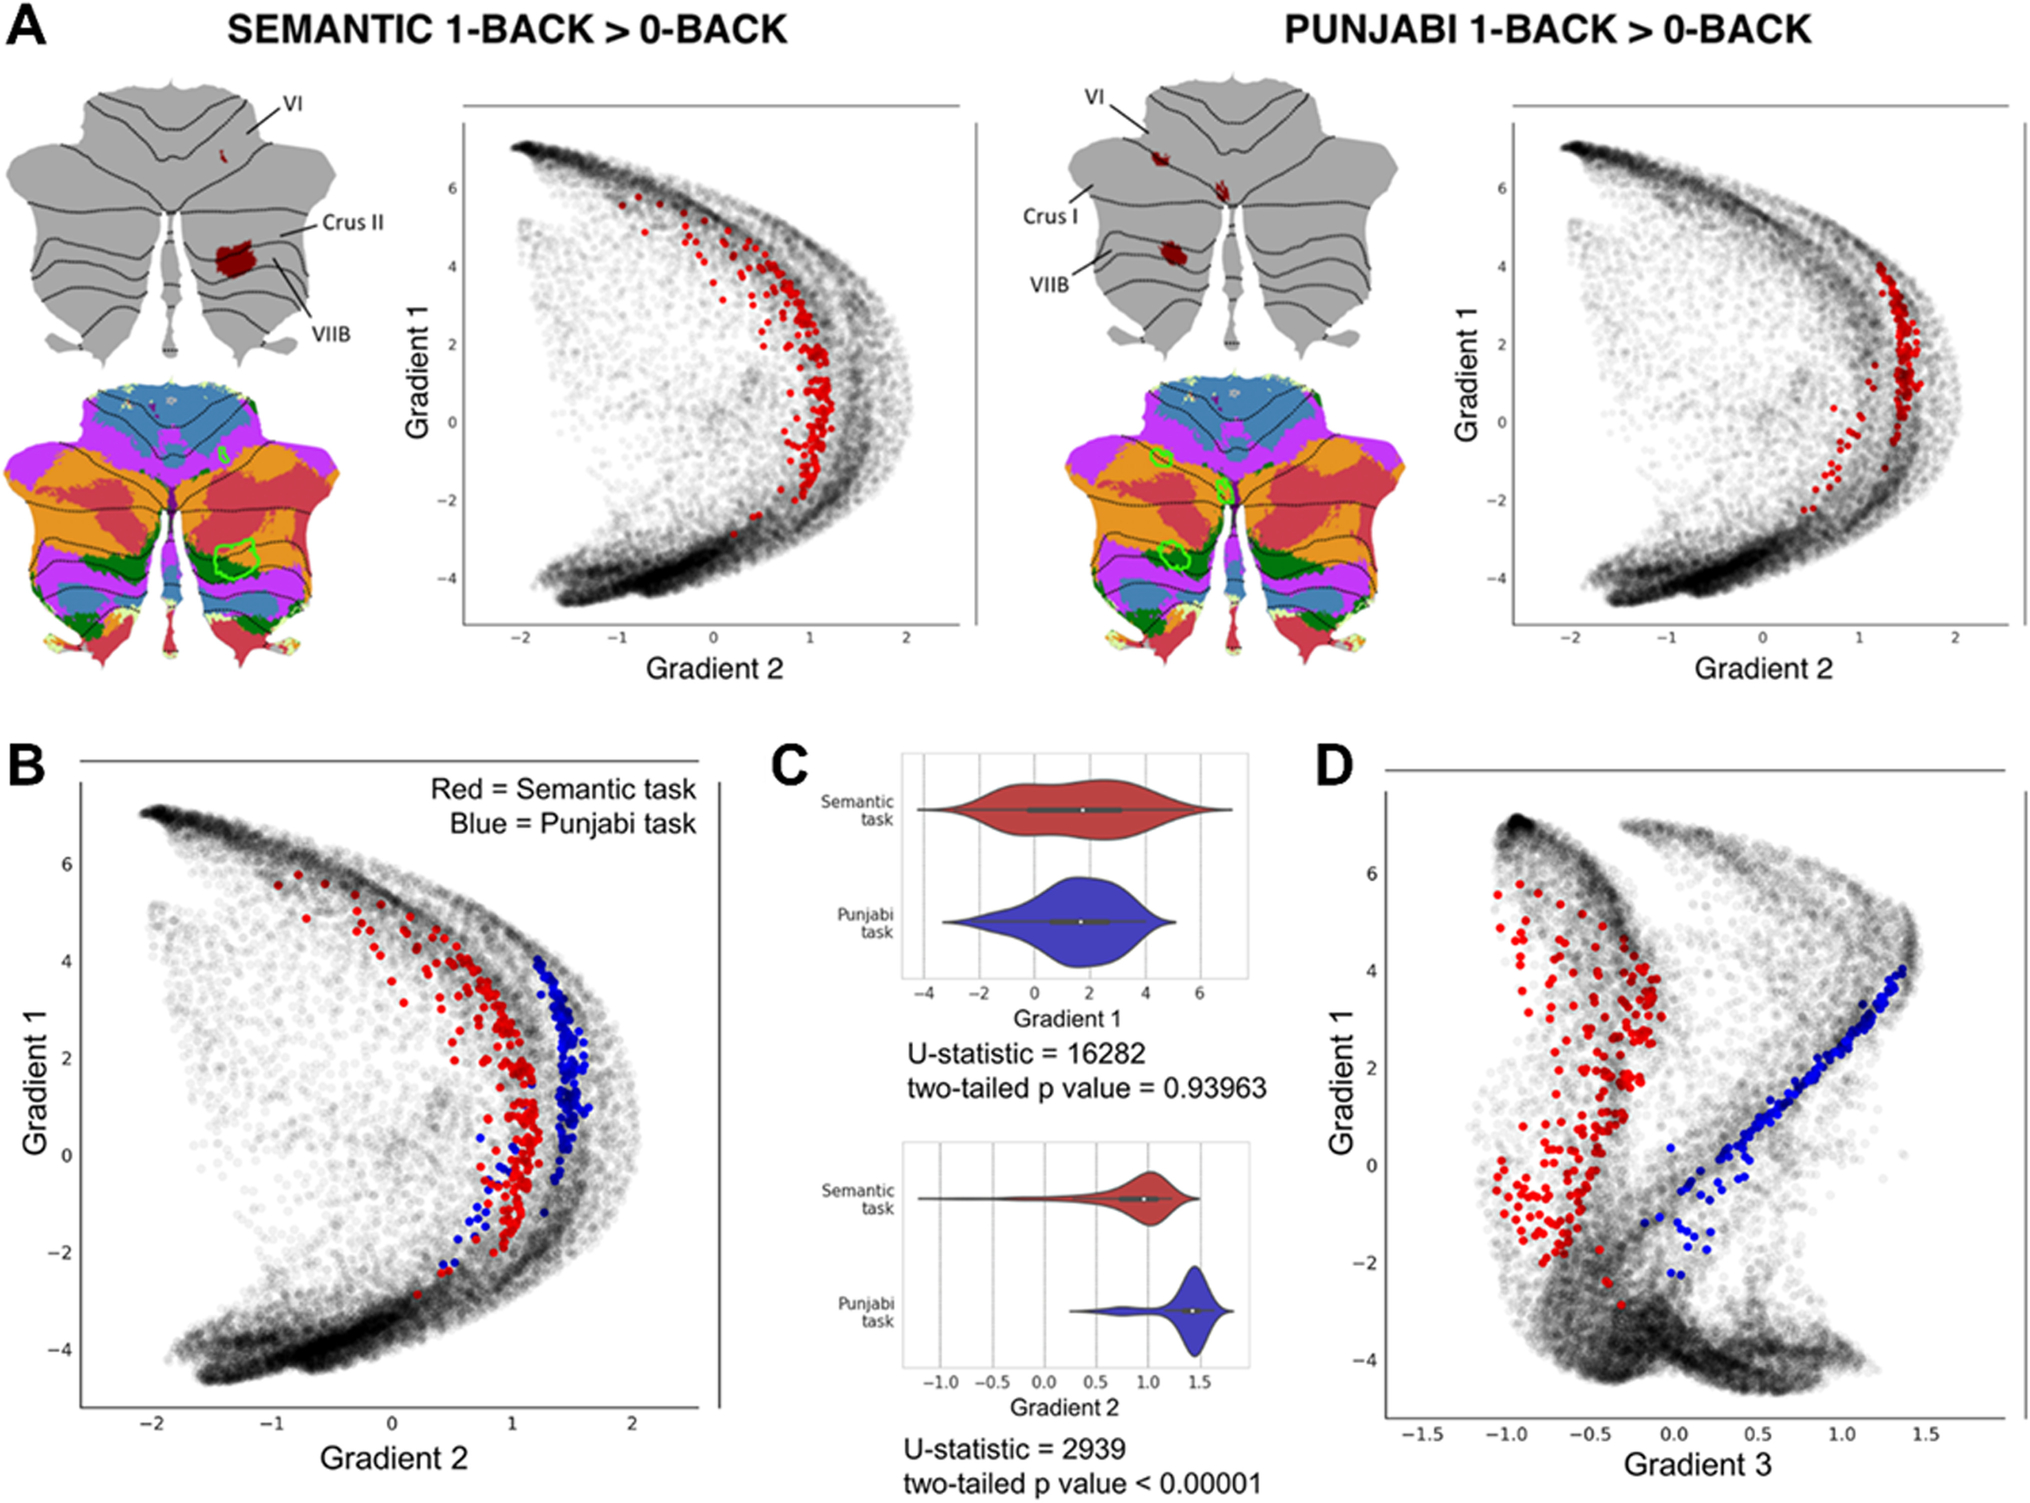
Using the LittleBrain toolbox to interpret the functional significance of cerebellar neuroimaging findings. Semantic task = subjects press a button if the semantic category of the picture of the object presented to the subject is the same as the semantic category of the previous image presented, e.g. two consecutive boats but not a boat followed by a suit; Punjabi task = subjects press a button if the word presented in an alphabet unknown to the subject has the same characters as the previous word presented. A Both tasks in this example engaged lobules VI, Crus I/II, and VIIB. Both tasks engaged ventral/dorsal attention (green and purple) and frontoparietal (orange) networks (i.e., focused cognitive processing areas). Marginal aspects of default mode network (red) (i.e., unfocused cognitive processing areas) were included in the Semantic task only. The Semantic task may engage cerebellar regions which are slightly less involved in focused cognitive processing when compared to the Punjabi task, and slightly more involved in unfocused cognitive processing. Functional gradients as used by the LittleBrain toolbox provide an unparalleled visualization of this concept — the Semantic task reveals higher gradient 1 values (i.e., more unfocused cognitive processing regions) and lower gradient 2 values (i.e., less focused cognitive processing regions). B Plotting two task maps in a single gradients map allows a better visualization of the relationship between them. Semantic task cluster is shown in red, Punjabi task cluster in shown in blue. C Gradient 1 and gradient 2 values corresponding to each task can be visualized in different forms (e.g. violin plots) and analyzed quantitatively (e.g. Mann-Whitney tests, a non-parametric equivalent of a t-test). The analysis presented in this example shows that gradient 2 but not gradient 1 differences between the two maps are statistically significant. (D) It is possible to use gradients other than gradients 1 or 2 (see also Fig. 3). For example, gradient 3 represents left-right hemisphere asymmetries in nonmotor cerebellar areas (see discussion in [1] regarding gradient 3). Accordingly, gradient 3 separates the two task maps in this example given that they both engage non-motor processing areas, but are located at opposite cerebellar hemispheres. Adapted from [11]
Practical Application VI: Quantitative Interpretation of Cerebellar Neuroimaging Findings
The interpretation of cerebellar neuroimaging findings using functional gradients as shown in practical application V can also be performed quantitatively. For example, structural abnormalities in one specific brain disorder may include areas of the cerebellar cortex that correspond to higher gradient 1 values, indicating higher involvement of default-mode regions. This observation can be analyzed quantitatively and confirmed or refuted statistically by comparing the distribution of gradient 1 values between the two maps with appropriate statistical analyses such as a Mann-Whitney test (see Figure 7C). Code for this example is available at https://github.com/xaviergp/littlebrain.
Practical Application VII: Identification of Functional Abnormalities in Patient Populations
Functional gradients can be used to identify functional abnormalities in patient populations. These analyses can be especially helpful as a dimensionality-reduction step prior to group contrast calculations, as functional gradients summarize the principal axes of macroscale functional organization in a low-dimensional space. For example, if there are a total of 2000 voxels in the cerebellum, resting-state functional connectivity data that is first processed as a correlation between all datapoints in the cerebellum generates a total matrix of 4,000,000 datapoints (2000*2000). These data can be summarized into only 2000 values (one for each voxel in the cerebellum) by calculating the principal functional gradient. This map can be used to compare differences between groups at a scale that is more practical to interpret, i.e. 2000 instead of 4,000,000 datapoints (see Figure 8 and [16] for an example). Other examples of studies using functional gradients to detect differences in patient populations in structures other than the cerebellum include [17–19].
Fig. 8.

Using functional gradients as a tool to detect differences in patient populations. Dong and colleagues [16] compared a group of healthy controls (HC) to a group of patients diagnosed with schizophrenia (SZ) and reported a prominent compression of the lowest portion of the principal functional gradient, and a less prominent compression of the highest portion of the principal functional gradient, when using functional gradients based on A functional connectivity within the cerebellum, B functional connectivity from the cerebellum to the cerebral cortex, and C functional connectivity from the cerebral cortex to the cerebellum. Horizontal axes represent principal functional gradient values, and vertical axes represent the number of cerebellar datapoints assigned to each range of functional gradient values
Other Complex Practical Applications
Functional gradients can be used to investigate other complex aspects of cerebellar functional organization. (i) Two regions of motor representation (first = lobules I-V, second = VIII) and three regions of non-motor representation (first = lobules VI-Crus I, second = Crus II-VIIB, third = IX-X) exist in the cerebellar cortex [7,8], but the functional significance of each area of motor and non-motor representation compared to the others remains uncertain. Mapping each territory of motor and non-motor representation along functional gradients reveals functional properties that are different between each area of representation, as discussed in detail in [1]. This analysis is shown as an example in Figure 9. Code for these analyses is available at https://github.com/xaviergp/cerebellum_gradients. (ii) Another complex application of cerebellar functional gradients is to evaluate the relationship between functional gradients and measures of structural variation in the cerebellar cortex [20] to test fundamental theories of cerebellar physiology such as the Universal Cerebellar Transform hypothesis [21–24] (code available at https://github.com/xaviergp/cerebellum_structurefunction), or (iii) to use functional gradients in the cerebellum and other extracerebellar structures to investigate the functional significance of left-right asymmetries in the functional organization of the brain [25] (code available at https://github.com/xaviergp/subcortical_IHFS). (iv) It is also possible to evaluate the relationship between functional gradients and measures of behavior at the single-subject level [16,26]. (v) Future studies may also explore methodologies for the calculation of cerebellar functional gradients other than diffusion map embedding [27], or (vi) use data other than resting-state functional connectivity to calculate cerebellar gradients [28,29]. Any symmetric matrix that represents a measure of similarity between every datapoint in the cerebellum would be a valid input to the calculations shown in Figure 1. (vii) Functional gradients may become clinically relevant in the field of cerebellar stimulation and modulation as a tool to identify stimulation targets. The principal functional gradient of the cerebellum can be reliably identified at the single-subject level (see [1] for single-subject analysis details). In stimulation or modulation protocols that aim to target, for example, the default-mode network (DMN), it would be possible to calculate the principal functional gradient in the cerebellum of each subject, and use the maximal value of the principal gradient of the cerebellum as a marker of the optimal DMN stimulation site for each individual. Because the principal functional gradient of the cerebellum isolates DMN in one of its two extremes, the location of the maximal principal functional gradient value is arguably the location within the DMN that is the most representative of the DMN, and thus the optimal site for stimulation of DMN in the cerebellum.
Fig. 9.
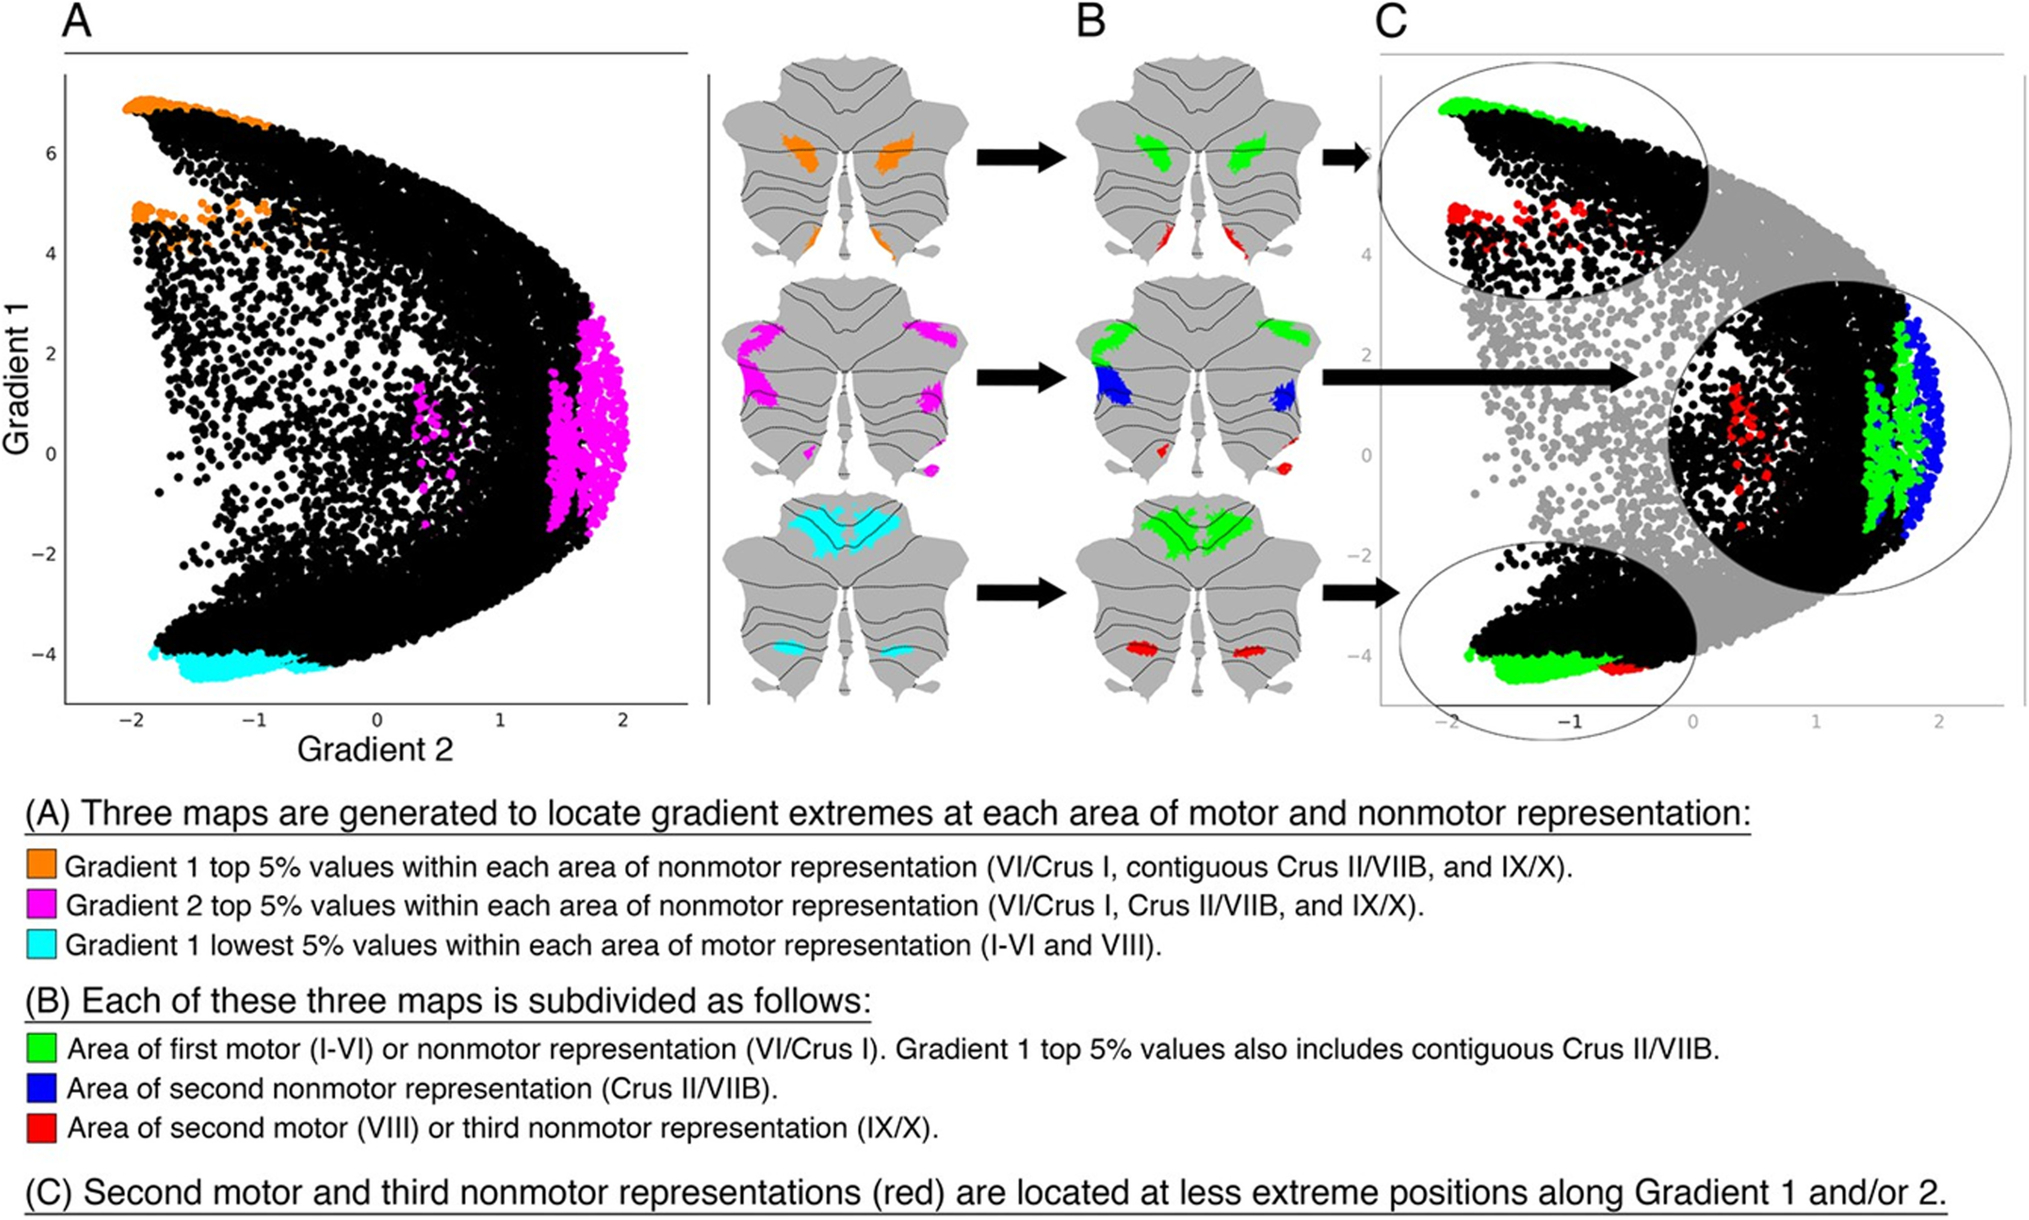
Functional gradients used as a tool to investigate the functional significance of the multiple areas of motor and nonmotor representation in the cerebellar cortex. Second motor representation (located in lobule VIII) and third nonmotor representations (located in lobules IX/X) that are shown in red in panel C are consistently located at less extreme positions along Gradient 1 and/or 2 (i.e. located more centrally in the scatterplot). This observation suggests that second motor representation is functionally distinct from first motor representation, and that third nonmotor representation is functionally distinct from first/second nonmotor representation. Because second motor and third nonmotor representations are consistently located at less extreme positions along Gradient 1 and/or 2, differences between second and first motor representation might be similar to the differences between third and first/second nonmotor representations. Specifically, second motor and third nonmotor representations might both correspond to a less extreme level of information processing (namely, information processing at a functional space which is distant from Gradient 1 or Gradient 2 extreme values). In the case of the third motor representation, this corresponds to cognitive processing that is less purely linked to default-mode network in the case of the third representation of the default-mode network, and less purely linked to attentional processing in the case of the third representation of the attentional networks. In the case of the second motor representation, this corresponds to processing that is less purely motor. See [1] for further details and additional tests that support this hypothesis
Limitations
Limitations common to all neuroimaging investigations of the cerebellum apply to functional gradient analyses. These limitations include the inability to provide definitive causal proof of human cerebellar functional anatomy in the absence of neuroimaging following non-invasive cerebellar stimulation or lesion symptom mapping, the still evolving understanding of the physiological significance of fMRI signal in cortical and subcortical structures [30], and the non-quantitative nature of fMRI signal that limits the interpretation and application of functional imaging to patient populations. Interpreting human cerebellar neuroimaging data in the context of existing evidence from other fields in neuroscience, including invasive anatomy studies in animals and clinical studies in patients with brain injury, is critical to overcome these challenges. Limitations specific to functional gradients analyses are mostly related to the novelty of this field, and include the lack of standardization for the calculation of functional gradients, the absence of a solidified framework for the interpretation of functional gradient abnormalities in patient populations, and the paucity of experiments analyzing functional gradient anatomy at the single-subject level. Efforts to address these issues are ongoing, including the development of toolboxes for the generation of functional gradients [11,31], the emergence of a field of functional gradient research that is focused on patient populations [16–19], and preliminary data supporting that general principles of functional gradient organization in the average cerebellum remain observable in individual subjects [1,16].
Conclusion
Functional gradients of the cerebellum offer a wide range of practical applications. This review may serve as an introduction and catalog of options for neuroscientists who wish to design and analyze imaging studies using gradient-based techniques. The list of possibilities reviewed here highlights the potential for functional gradients to advance our understanding of cerebellar function in health and disease, and to help develop novel and clinically relevant methods of diagnosis and treatment for cerebellar and cerebellar-linked disorders.
Acknowledgements
The author expresses his deep gratitude to Jeremy Schmahmann, MD, John Gabrieli, PhD, and Satrajit Ghosh, PhD for their mentorship and support that were essential for the development of many of the concepts presented here. The author also gratefully acknowledges the thoughtful critique of this manuscript offered by Jeremy Schmahmann, MD.
Footnotes
Declarations
Conflict of interest
The author declares no competing interests.
References
- 1.Guell X, Schmahmann J, Gabrieli J, Ghosh S. Functional gradients of the cerebellum. Elife. 2018;7:e36652. [DOI] [PMC free article] [PubMed] [Google Scholar]
- 2.Coifman RR, Lafon S, Lee AB, Maggioni M, Nadler B, Warner F, et al. Geometric diffusions as a tool for harmonic analysis and structure definition of data: multiscale methods. Proc Natl Acad Sci. 2005;102(21):7432–7. [DOI] [PMC free article] [PubMed] [Google Scholar]
- 3.Langs G, Golland P, Ghosh SS. Predicting activation across individuals with resting-state functional connectivity based multi-atlas label fusion. Med Image Comput Comput Assist Interv. 2015; [DOI] [PMC free article] [PubMed] [Google Scholar]
- 4.Margulies DS, Ghosh SS, Goulas A, Falkiewicz M, Huntenburg JM, Langs G, et al. Situating the default-mode network along a principal gradient of macroscale cortical organization. Proc Natl Acad Sci. 2016;113(44):12574–9. [DOI] [PMC free article] [PubMed] [Google Scholar]
- 5.Van Essen DC, Smith SM, Barch DM, Behrens TEJ, Yacoub E, Ugurbil K. The WU-Minn human connectome project: an overview. Neuroimage. 2013;80:62–79. [DOI] [PMC free article] [PubMed] [Google Scholar]
- 6.Diedrichsen J, Zotow E. Surface-based display of volume-averaged cerebellar imaging data. PLoS One. 2015;10(7). [DOI] [PMC free article] [PubMed] [Google Scholar]
- 7.Guell X, Gabrieli J DE, Schmahmann JD. Triple representation of language, working memory, social and emotion processing in the cerebellum: convergent evidence from task and seed-based resting-state fMRI analyses in a single large cohort. Neuroimage. 2018;172:437–49. [DOI] [PMC free article] [PubMed] [Google Scholar]
- 8.Buckner R, Krienen F, Castellanos A, Diaz JC, Yeo BT. The organization of the human cerebellum estimated by intrinsic functional connectivity. J Neurophysiol. 2011;106:2322–45. [DOI] [PMC free article] [PubMed] [Google Scholar]
- 9.Guell X, D’Mello AM, Hubbard NA, Romeo RR, Gabrieli JDE, Whitfield-Gabrieli S, et al. Functional territories of human dentate nucleus. Cereb Cortex. 2019; [DOI] [PMC free article] [PubMed] [Google Scholar]
- 10.Bukhari Q, Ruf SF, Guell X, Whitfield-Gabrieli S, Anteraper S. Interaction between cerebellum and cerebral cortex, evidence from dynamic causal modeling. The Cerebellum. 2021; [DOI] [PubMed] [Google Scholar]
- 11.Guell X, Goncalves M, Kaczmarzyk J, Gabrieli J, Schmahmann J, Ghosh S. LittleBrain: a gradient-based tool for the topographical interpretation of cerebellar neuroimaging findings. PLoS One. 2019;14(1):e0210028. [DOI] [PMC free article] [PubMed] [Google Scholar]
- 12.Gellersen HM, Guell X, Sami S. Differential vulnerability of the cerebellum in healthy ageing and Alzheimer’s disease. NeuroImage Clin. 2021; [DOI] [PMC free article] [PubMed] [Google Scholar]
- 13.Guell X, Arnold Anteraper S, Gardner AJ, Whitfield-Gabrieli S, Kay-Lambkin F, Iverson GL, et al. Functional connectivity changes in retired rugby league players: a data-driven functional magnetic resonance imaging study. J Neurotrauma. 2020; [DOI] [PubMed] [Google Scholar]
- 14.Guell X, Anteraper SA, Ghosh SS, Gabrieli JDE, Schmahmann JD. Neurodevelopmental and psychiatric symptoms in patients with a cyst compressing the cerebellum: an ongoing enigma. Cerebellum. 2020;19(1). [DOI] [PMC free article] [PubMed] [Google Scholar]
- 15.D’Mello AM, Centanni TM, Gabrieli JDE, Christodoulou JA. Cerebellar contributions to rapid semantic processing in reading. Brain Lang. 2020; [DOI] [PMC free article] [PubMed] [Google Scholar]
- 16.Dong D, Luo C, Guell X, Wang Y, He H, Duan M, et al. Compression of cerebellar functional gradients in schizophrenia. Schizophr Bull. 2020; [DOI] [PMC free article] [PubMed] [Google Scholar]
- 17.Hong SJ, de Wael RV, Bethlehem RAI, Lariviere S, Paquola C, Valk SL, et al. Atypical functional connectome hierarchy in autism. Nat Commun. 2019; [DOI] [PMC free article] [PubMed] [Google Scholar]
- 18.Dong D, Yao D, Wang Y, Hong SJ, Genon S, Xin F, et al. Compressed sensorimotor-to-transmodal hierarchical organization in schizophrenia. Psychol Med. 2021; [DOI] [PubMed] [Google Scholar]
- 19.Benkarim O, Paquola C, Park B, Hong S-J, Royer J, Vos de Wael R, et al. Connectivity alterations in autism reflect functional idiosyncrasy. Commun Biol. 2021;4(1078). [DOI] [PMC free article] [PubMed] [Google Scholar]
- 20.Guell X, Schmahmann JD, Gabrieli JDE. Functional Specialization is Independent of Microstructural Variation in Cerebellum but Not in Cerebral Cortex. bioRxiv. 2018. [Google Scholar]
- 21.Schmahmann J, Guell X, Stoodley C, Halko M. The theory and neuroscience of cerebellar cognition. Annu Rev Neurosci. 2019;42:337–64. [DOI] [PubMed] [Google Scholar]
- 22.Guell X, Gabrieli JDE, Schmahmann JD. Embodied cognition and the cerebellum: perspectives from the dysmetria of thought and the universal cerebellar transform theories. Cortex. 2018;100:140–8. [DOI] [PubMed] [Google Scholar]
- 23.Guell X, Hoche F, Schmahmann JD. Metalinguistic deficits in patients with cerebellar dysfunction: empirical support for the dysmetria of thought theory. Cerebellum. 2015;14(1):50–8. [DOI] [PubMed] [Google Scholar]
- 24.Schmahmann JD. An emerging concept: the cerebellar contribution to higher function. Arch Neurol. 1991; [DOI] [PubMed] [Google Scholar]
- 25.Guell X, Schmahmann JD, Gabrieli JDE, Ghosh SS, Geddes MR. Asymmetric functional gradients in the human subcortex. bioRxiv. 2020; [Google Scholar]
- 26.Marquand AF, Haak KV, Beckmann CF Functional corticostriatal connection topographies predict goal-directed behaviour in humans. Nat Hum Behav. 2017;1(8). [DOI] [PMC free article] [PubMed] [Google Scholar]
- 27.Haak KV, Marquand AF, Beckmann CF. Connectopic mapping with resting-state fMRI. Neuroimage. 2018;170:83–94. [DOI] [PubMed] [Google Scholar]
- 28.Bajada CJ, Jackson RL, Haroon HA, Azadbakht H, Parker GJM, Lambon Ralph MA, et al. A graded tractographic parcellation of the temporal lobe. Neuroimage. 2017;155:503–12. [DOI] [PMC free article] [PubMed] [Google Scholar]
- 29.Cerliani L, Thomas RM, Jbabdi S, Siero JCW, Nanetti L, Crippa A, et al. Probabilistic tractography recovers a rostrocaudal trajectory of connectivity variability in the human insular cortex. Hum Brain Mapp. 2012;33(9):2005–34. [DOI] [PMC free article] [PubMed] [Google Scholar]
- 30.Logothetis NK, Wandell BA. Interpreting the BOLD signal. Annual Review of Physiology. 2004. [DOI] [PubMed] [Google Scholar]
- 31.Vos de Wael R, Benkarim O, Paquola C, Lariviere S, Royer J, Tavakol S, et al. BrainSpace: a toolbox for the analysis of macroscale gradients in neuroimaging and connectomics datasets. Commun Biol. 2020;3(1). [DOI] [PMC free article] [PubMed] [Google Scholar]


