Abstract
Recently, effervescent tablets (ETs) have become increasingly popular with patients in clinics due to their fast disintegration by acid–alkali reactions in water. However, certain undesirable properties of ETs (e.g., sticking and high hygroscopicity) can limit their production and application. In particular, frequent sticking always severely decreases the tablet quality and productivity. Therefore, in this study, polyvinylpyrrolidone (PVP) at different usage levels, grades, or spray solution concentrations was coated onto the surfaces of both acidic and alkaline granules of ETs by means of the fluid-bed coating technique. In terms of fully characterized powder, tableting, and tablet properties, the following points were concluded: (i) a uniform coating of PVP onto the surfaces of these two granules not only resolved the sticking problem, but also effectively decreased the hygroscopicity and enhanced the compactibility; (ii) the improvements increased with an increase in the PVP content or PVP molecular weight and a decrease in the PVP spray solution concentration owing to the formation of an increasingly even and cohesive coating layer; (iii) the process of fluid-bed coating was not the simple superposition or simple mixing of two different materials' properties; (iv) the coating process did not cause significant influences on the disintegration time of ETs. Overall, it is fairly meaningful to further promote the development of ETs in practice since these problems have been overcome.
Recently, effervescent tablets (ETs) have become increasingly popular with patients in clinics due to their fast disintegration by acid–alkali reactions in water.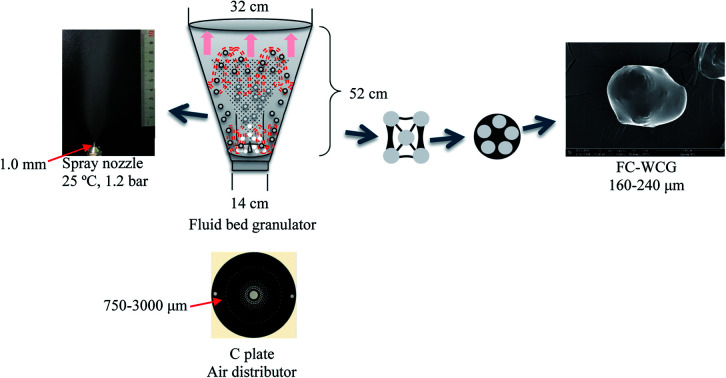
1. Introduction
Effervescent tablets (ETs) can quickly disintegrate because of the gas-generating reaction of an acidic agent (e.g., citric acid) and an alkaline agent (e.g., sodium bicarbonate) when coming into contact with water, therefore accelerating the release and improving the bioavailability of the included drugs.1,2 However, certain drawbacks (e.g., frequent sticking, high hygroscopicity, and low hardness) of the ETs limit their practical production and applications. In particular, sticking can frequently occur in the tableting process due to the ease with which the acidic agent adheres onto the punch tips of the tablets during compaction.3 Therefore, it can roughen the surface of the fabricated tablet and can even crack it slowly as the number of compaction runs increase. These can severely decrease the tablet quality, yield, and productivity.4–6
Till now, certain strategies have been used to resolve the problem of punch sticking of ETs that occurs during compaction. Traditionally, several water-soluble lubricants (like macrogol 6000) are often added in ETs, which can disperse on the surfaces of steel and/or effervescent granules to decrease their contact during tableting and therefore reduce the risk of sticking.4,7 Moreover, certain anti-adherent agents (e.g., sucrose ester) incorporated into ETs can have a beneficial impact on highly adhesive granules.3 Furthermore, in other studies, the tableting process or instruments could also influence the extent of the sticking of ETs.8 For example, irradiating the position of stuffing during compaction by infrared light could maintain the temperature and prevent the granules from absorbing moisture to become sticky, thereby decreasing the possibility of sticking. However, in general, most strategies mentioned above can only settle the problems of sticking in ETs to a limited extent, and sticking in practice can reappear with an increase in the compaction time. Therefore, some novel strategies, rather than the above-mentioned ones that simply involve adding additional lubricants or anti-adherent agents, need to be developed to completely resolve the sticking problem of ETs.
In this regard, the advancement of coprocessed fillers or drugs based on particle design by using fluid-bed coating or co-spray drying has yielded certain promising results.9–12 For example, the compactibility, flowability, and hygroscopicity of the produced composite particles (CPs) could be significantly improved in comparison to that of the original particles. Moreover, core–shell CPs formed by the fluid-bed method by coating a small amount of low hygroscopic and low viscous plastic material onto the surface of core particles yield greater advantages over the ones formed by co-spray drying due to remarkable differences in particle size, particle structure, and surface topology.11 Therefore, the fluid-bed coating technique might be feasible for coating acidic and/or alkaline granules of ETs to resolve the sticking problem in production, improve tablet hardness, and decrease tablet hygroscopicity during application.
Polyvinylpyrrolidone (PVP)—a type of nontoxic, highly hydrophilic, and plastic excipient—has been utilized in various pharmaceutical formulations for many years, primarily in solid dosage forms.13 In tablets, a PVP solution is often used as a coating agent or binder to improve the properties of the original materials.14 For example, both compactibility and drug dissolution of drug-loaded solid dispersion using PVP as the carrier were remarkably improved as compared to the initial drug.13,15–17 Moreover, coating PVP on the surfaces of acidic and/or alkaline granules of ETs may not only effectively prevent the sticky components of ETs from adhering onto the tablet punch, but also effectively prevent a premature reaction between the acid and alkaline agents.
Based on the above analysis, this study aimed to develop core–shell acidic and/or alkaline CPs of ETs by using the fluid-bed coating method to coat a series of PVP (including different contents, different molecular weights, and different spray solution concentrations) for simultaneously resolving the problems of severe sticking, high hygroscopicity, and low hardness. In addition, data regarding the particle level (particle size and distribution, as well as surface structure), powder level (bulk density, tapped density, flowability, and compactibility), and tablet level (sticking, hygroscopicity, and disintegration time) were also integrated to elucidate the improvement mechanisms.
2. Experimental
2.1. Materials
Citric acid (Weifang Ensign Industry Co., Ltd., Shandong, China), sodium bicarbonate (Hunan Hlsy Sodium Bicarbonate Co., Ltd., Hunan, China), lactose (Leprino Foods, Roswell, NM, USA), PVP (Plasdone K17, Plasdone K25, and Plasdone K29/32, Ashland, Wilmington, DE, USA), magnesium stearate, anhydrous ethanol, and polyethylene glycol (PEG) 4000 (Sinopharm Chemical Reagent Co., Shanghai, China) were used as supplied.
2.2. Method
2.2.1. Preparation of acidic and alkaline granules by wet granulation
Here, 500 g of citric acid and 400 g of lactose were placed in the vessel of a laboratory-scale high-shear mixer granulator (HLSH2-6A, Beijing, China) to be premixed for about 30 s at an impeller speed of 200 rpm. During granulation, about 75 g of 13% PVP K-30 (13% is the ratio of PVP K-30 to anhydrous ethanol) as the binder was gradually sprayed onto the vessel with impeller and chopper speeds of 1000 and 1200 rpm, respectively. After granulation, the wet granules were transferred into a tray and dried in a vacuum oven at 55 °C for about 2 h. Finally, these dry granules were passed through a 65-mesh screen to achieve uniform wet-granulation citric acid granules (WCG). With regard to the preparation of wet-granulation sodium bicarbonate granules (WSG), they were almost equal to WCG, except that the amount of 13% PVP K-30 was about 90 g.
The process yields (%) of WCG and WSG were calculated using eqn (1):
 |
1 |
where m represents the mass of the final product; m1, m2, and m3 denote the initial masses of citric acid/sodium bicarbonate, lactose, and PVP, respectively.
2.2.2. Preparation of coated acidic and alkaline granules by fluid-bed coating
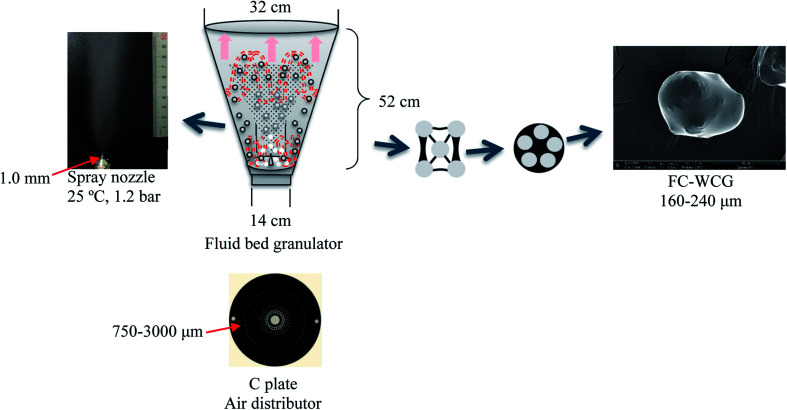
In the process of fluid-bed coating, an air flow injected upward through an air distributor at the bottom of the fluid bed fluidized the included powder mixture. Meanwhile, the coating liquid was sprayed on the fluidized powder by a spray nozzle along the direction of the air flow. The interparticle collisions or those between the droplet and particle would occur. Further, a liquid bridge or solid bridge would form and/or rupture in order to agglomerate the particles with each other.18,19 Finally, the surfaces of the agglomerated particles would be gradually coated with the solidified coating agent (Fig. 1).
Fig. 1. Schematic illustration of the working principle of the fluid-bed coating process. FC, fluid-bed coating; WCG, wet-granulation citric acid granules.
In this experiment, a laboratory-scale bottom-spray fluid bed (FLZB 1.5, Chuangzhi Group, Shanghai, China) was utilized to coat both WCG and WSG with a series of PVP compounds. Here, 500 g of citric acid/sodium bicarbonate granules were loaded onto the vessel and preheated for about 5 min before spraying the coating solution. The preparation conditions were as follows. For citric acid granules, inlet air temperature: 65 °C; binder feed rate: 8.0 rpm; spray atomization pressure: 1.2 bar; inlet airflow: 90–130 m3 h−1; spray injection time: 15–60 min; post-spray drying time: 5 min; air distributor type: C plate (aperture diameter: 750–3000 μm); spray nozzle type: Schlick 970 series (diameter: 1.0 mm). For sodium bicarbonate granules: inlet air temperature, 60 °C; binder feed rate: 8.0 rpm; spray atomization pressure: 1.2 bar; inlet airflow: 70–90 m3 h−1; spray injection time, post-spray drying time, air distributor type, and spray nozzle type were the same as those used for making the citric acid granules. The process yields (%) of the WCG and WSG coatings were calculated using eqn (2):
 |
2 |
where m denotes the mass of the final product; m1 and m2 denote the mass of WCG or WSG and PVP before coating, respectively.
2.2.3. Preparation of effervescent granules
The prepared WCG or WCG coatings were totally mixed with WSG or coating WSG at a ratio of 1.2 : 1. After that, 2% PEG 4000 was added into the mixture to prepare the effervescent granules for tableting.
2.3. Material characterization
2.3.1. Surface morphology
The morphology of the materials was determined by using a scanning electron microscope (SEM) (S-3400, Hitachi Ltd., Japan) at an acceleration voltage of 20 kV. When the samples were sputter-coated (E-1010, Hitachi Ltd., Japan) with gold–palladium, they could be observed at various magnifications.
2.3.2. Surface element analysis
The surface element compositions were obtained by SEM and an X-ray energy spectrometer (Genesis, EDAX Inc., America).
2.3.3. Moisture content
The moisture content of the materials was measured by a fast infrared moisture analyzer (Mettler Toledo HE53/02, Shanghai, China) at 105 °C.
2.3.4. Angle of repose (AR)
The AR value was measured by means of a powder property tester (BT-1000, Bettersize Instruments, Ltd., Dandong, China).
2.3.5. Carr's index (CI) and Hausner ratio (HR)
CI and HR were based on the bulk density (Pb) and tapped density (Pta). Pb and Pta values were determined by using the powder property tester. Thereafter, the CI and HR values could be calculated by using eqn (3) and (4), respectively:
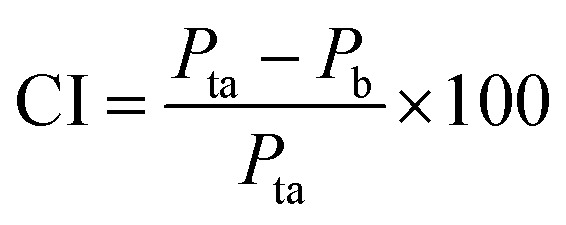 |
3 |
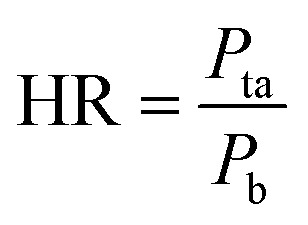 |
4 |
2.3.6. Particle size analysis
The median particle size (D0.5) and size distribution (Span) were determined by using a laser diffraction instrument (Malvern 2000, Malvern Instruments Ltd., England; dry method).
2.3.7. Viscosity of spray solution
The viscosity of the coating solution was determined by using a rheometer (Physica MCR101, Anton Paar Germany GmbH, Germany) at the temperature of 25 °C.
2.3.8. Density of spray solution
Here, 50 ml of the coating solution was precisely transferred into a 50 ml beaker (the mass of the empty one (m1, g) was measured before) by a pipette. Thereafter, the mass of the beaker (m2, g) was measured by an electronic balance (FA 1004N, Shanghai Precision & Scientific Instrument Co., Ltd., Shanghai, China). Finally, the density of the solution (Des, g ml−1) could be calculated by using eqn (5):
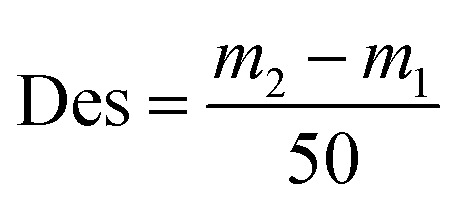 |
5 |
2.3.9. Surface tension of spray solution
The surface tension of the coating solution was determined by means of a surface tension meter (QBZY-1, Shanghai FangRui Instrument CO., LTD., Shanghai, China) at the temperature of 25 °C.
2.3.10. Evaluation of sticking propensity
The sticking punch tests were carried out via an instrumented rotary tablet press (ZP 14, Beijing Gylongli Sci. & Tech., Co., Ltd., Beijing, China) below 40% relative humidity (RH). Here, 5 pairs of 10 mm-diameter round, flat-faced, upper and lower punches were used in this study. The compaction speed was set to 16 kT h−1 to continuously tablet three types of break forces (i.e., 35, 75, and 105 N) of ETs for the required number of compaction runs by adjusting the distance between the upper and lower punches. After specific compactions, the materials' sticking punch and corresponding tablets were photographed. At the same time, the materials adhered on both upper and lower punches were transferred into 20 ml water by means of an ultrasonic method. After that, 20 μl phosphoric acid was added into the above solution as samples. Finally, the samples were filtered through a 0.45 μm filter and analyzed by ultraviolet spectrophotometry at 210 nm by using HPLC (Agilent 1260, Agilent Corporation, USA) to measure the amount of citric acid sticking on the punches. The chromatographic conditions were as follows. Analytical column: Waters Symmetry C18 (4.6 × 250 mm2, 5 μm); column temperature: 30 °C; injection volume: 10 μl; flow rate: 1.0 ml min−1; mobile phase: 0.1% phosphoric acid aqueous solution.
2.3.11. Hygroscopicity
A series of 75 N ETs were placed on a green-colored board. Subsequently, the board was transferred into humidity chambers (HC/14-063, Newtronic Lifecare Equipment Pvt., Ltd., India) at temperature and RH of 40 °C and 75%, respectively. Then, the board was taken out at 0, 5, 10, 15, 30, and 60 min. The volume-expanded ETs were immediately photographed. At the same time, the corresponding diameter (D, mm) and thickness (T, mm) at different times could be measured using a Vernier caliper ((0–200) mm, 0.01 mm, type II, Harbin Measuring & Cutting Tool Group Co., Ltd., Harbin, China). Finally, the volume (V) of the ETs at different times could be calculated using eqn (6):
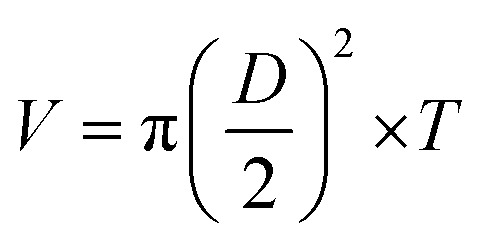 |
6 |
2.3.12. Compactibility
The compactibility of the materials was evaluated by using a fully instrumented press (Korsch XP1, Germany) with 8.5 mm, round, and flat-faced punches at three different compaction pressures (53, 106, and 159 MPa). After each compaction, the hardness (F, N), diameter (D, mm), and thickness (T, mm) of the collected tablet were immediately measured by a hardness tester (YD-20KZ, TIANDA TIANFA Pharmaceutical Testing Instruments Ltd., Tianjin, China). Subsequently, the tensile strength (TS) was calculated by using eqn (7):
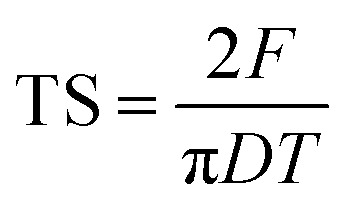 |
7 |
The work used to compact each tablet could also be measured by this press. The Esp value was calculated by using eqn (8):
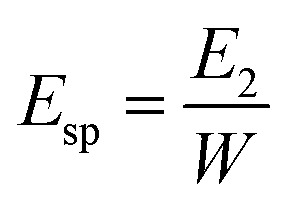 |
8 |
where W represents the tablet weight (g) and E2 is the effective compaction work (J).
2.3.13. Heckel profile analysis
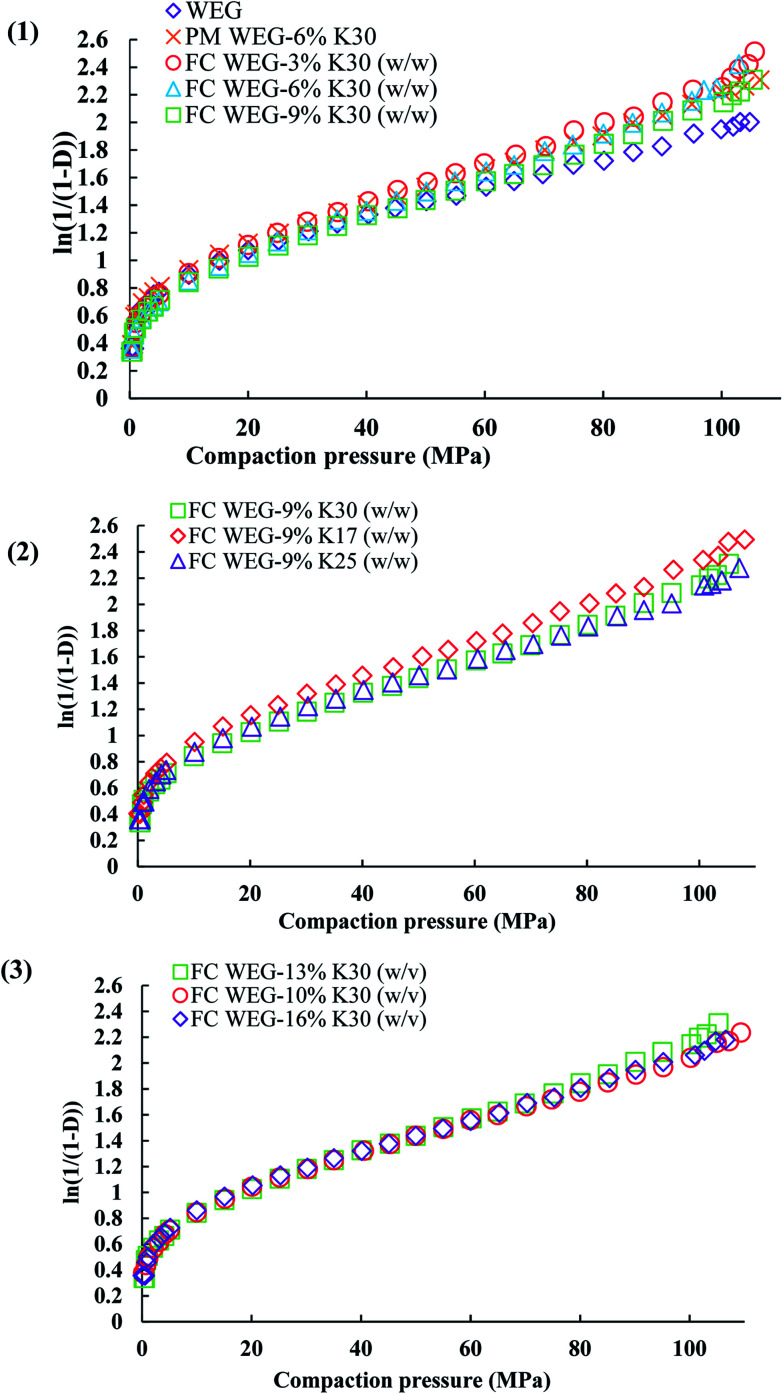
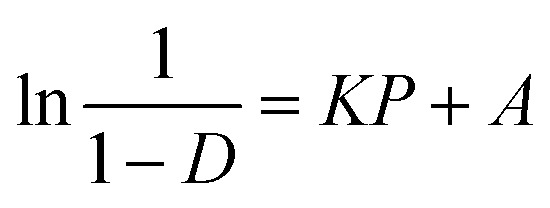
The “in-die” method was used. Here, each compaction was implemented like that described above. The Athy–Heckel equation (eqn (9)) was utilized to determine the volume reduction mechanism during tableting.
 |
9 |
where D denotes the relative density of the compacts at pressure P; K, a material constant and is equal to the slope of the linear part of the Heckel plot; Py, the reciprocal of K and inversely proportional to the plastic deformability of the materials under pressure; and A, the intercept of the extension lines of the linear part of the Heckel plot.
2.3.14. Fast elastic stretch (FES)
FES, describing the axial elastic recovery of the tablet in a die during compaction, could be calculated by using eqn (10):
 |
10 |
where T1 represents the edge thickness of the tablet without loading and T2 denotes the edge thickness at the maximum compaction pressure.
2.3.15. Tablet disintegration
The disintegration time of ETs was tested after referring to the method in the ChP (2015). The tablet was placed into a 250 ml beaker containing 200 ml distilled water at a temperature of 20 ± 5 °C and it was tested six times. All the tested tablets were totally disintegrated within 5 min without the remnants of any clustered particles.
3. Results and discussion
Traditionally, certain polymers (e.g., PEG) or sugar alcohols (e.g., mannitol) have often been utilized to coat effervescent systems.1,20 However, since they are simply physically mixed with each other, this coating method could only slightly decrease the hygroscopic degree of the produced ETs, but it could not reduce the other undesirable properties of ETs (e.g., sticking and low tensile strength). When compared with such traditional coating methods, the fluid-bed coating technique is more applicable in the preparation of the coated acidic and alkaline granules of ETs owing to the following advantages.11,12,21 (i) The relatively low product temperature could protect the alkaline source (e.g., sodium bicarbonate) from thermal decomposition during preparation; (ii) the low RH could keep the hygroscopic acidic source (e.g., citric acid) from sticking and softening during preparation; and (iii) the uniform and efficient surface distribution of the shell modifier molecules could effectively reduce the exposure of the problematic acidic granules and therefore significantly decrease the possibility of sticking during compaction.
3.1. Surface morphology and powder properties
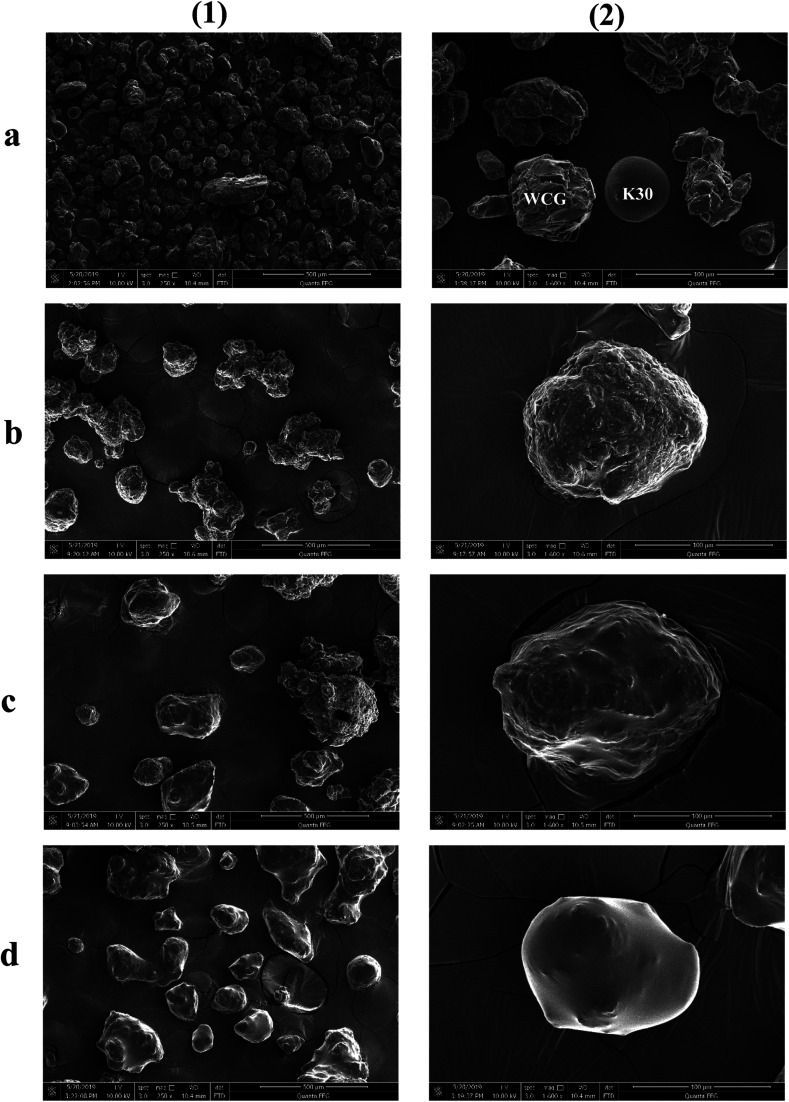
The surface morphologies of a series of WCG and fluid-bed-coated (FC) WCGs are shown in Fig. 2. Evidently, the morphology of such FC WCGs was fairly different from that of the original WCG and the corresponding physical mixture with PVP (PM). Firstly, the surface of the FC WCG was smoother, and the particle size was larger, too. Further, as the content of PVP used in the FC WCG increased, smoother and larger core–shell particles could be obtained due to the increased integrity and thickness of the coating layer.12 Secondly, being different from PM such that WCG and PVP were randomly distributed in space (Fig. 2(a)), WCG and PVP particles could no longer be distinguishable after fluid-bed coating (Fig. 2(b)–(d)), indicating that they were closely and intimately integrated together.
Fig. 2. Scanning electron microscopy photographs of the materials studied in this work. (a) PM WCG-6% K30, (b) FC WCG-3% K30 (w/w), (c) FC WCG-6% K30 (w/w), (d) FC WCG-9% K30 (w/w). PM, physical mixture; FC, fluid-bed coating; WCG, wet-granulation citric acid granules; K30, PVP-K30. (1) magnification: 250×; (2) magnification: 1600×.
The result of the powder property tests (Table 1) revealed that the AR, CI, and HR values of both “WCG or WSG” and “FC WCG or FC WSG” were considerably smaller than those of raw citric acid or sodium bicarbonate (e.g., citric acid granules; AR: 35.33° vs. 33.33–37.83° vs. 50.33°; CI: 22.28 vs. 25.56–29.13 vs. 58.50; HR: 1.29 vs. 1.34–1.41 vs. 2.42), indicating that the materials' flowability was significantly improved after high-shear wet granulation and subsequent fluid-bed coating. This is consistent with the other reports.21–23 Further, the degree of flowability improvement via these two types of processing techniques was nearly equal. Moreover, the particle size and size distribution of acidic and/or alkaline granules after fluid-bed coating were 2–3-fold larger and more uniform than only those via high-shear wet granulation (e.g., citric acid granules; D0.5: 158.84–240.92 vs. 72.78 μm; Span: 1.51–1.72 vs. 2.63), which was in accordance with the SEM results. With regard to the corresponding effervescent granules formed by physically mixing the acidic and alkaline granules, their flowability and particle size had a similar trend to those of the corresponding single granules.
Powder properties of the materials studied in this work (mean ± SD, n = 3)a.
| Materials | AR (°) | P b (g cm−3) | P ta (g cm−3) | CI | HR | D 0.5 (μm) | Span | MC (%) | PY(%) |
|---|---|---|---|---|---|---|---|---|---|
| Citric acid | 50.33 ± 0.58 | 0.394 ± 0.020 | 0.948 ± 0.012 | 58.50 ± 1.64 | 2.41 ± 0.09 | 20.52 ± 0.79 | 6.59 ± 0.10 | 0.08 ± 0.08 | — |
| Sodium bicarbonate | 44.33 ± 0.58 | 0.815 ± 0.020 | 1.428 ± 0.012 | 42.92 ± 0.96 | 1.75 ± 0.03 | 34.48 ± 0.22 | 3.17 ± 0.04 | 0.41 ± 0.08 | — |
| WCG | 35.33 ± 2.31 | 0.591 ± 0.002 | 0.760 ± 0.000 | 22.28 ± 0.29 | 1.29 ± 0.00 | 72.78 ± 1.44 | 2.63 ± 0.01 | 0.11 ± 0.03 | 86.00 |
| WSG | 35.00 ± 0.50 | 0.653 ± 0.012 | 0.880 ± 0.000 | 25.76 ± 1.31 | 1.35 ± 0.02 | 51.92 ± 1.05 | 2.15 ± 0.01 | 0.43 ± 0.03 | 89.50 |
| WEG | 35.50 ± 0.87 | 0.647 ± 0.012 | 0.850 ± 0.010 | 23.92 ± 0.73 | 1.31 ± 0.01 | 58.66 ± 0.28 | 2.61 ± 0.02 | 0.35 ± 0.05 | — |
| PM WCG-6% K30 | 36.00 ± 0.00 | 0.577 ± 0.006 | 0.780 ± 0.000 | 26.07 ± 0.74 | 1.35 ± 0.01 | 68.00 ± 0.23 | 2.59 ± 0.02 | 0.63 ± 0.03 | — |
| PM WSG-6% K30 | 34.67 ± 1.15 | 0.650 ± 0.010 | 0.880 ± 0.000 | 26.14 ± 1.14 | 1.35 ± 0.02 | 52.97 ± 0.95 | 2.26 ± 0.06 | 0.81 ± 0.13 | — |
| PM WEG-6% K30 | 35.83 ± 0.58 | 0.620 ± 0.000 | 0.820 ± 0.000 | 24.39 ± 0.00 | 1.32 ± 0.00 | 59.73 ± 0.47 | 2.58 ± 0.03 | 0.61 ± 0.02 | — |
| FC WCG-3%b K30 | 35.17 ± 0.58 | 0.530 ± 0.010 | 0.720 ± 0.000 | 26.39 ± 1.39 | 1.36 ± 0.03 | 158.84 ± 3.38 | 1.72 ± 0.02 | 0.69 ± 0.06 | 90.64 |
| FC WSG-3%b K30 | 33.00 ± 0.00 | 0.473 ± 0.023 | 0.640 ± 0.000 | 26.04 ± 3.61 | 1.35 ± 0.06 | 83.28 ± 0.71 | 1.55 ± 0.01 | 0.73 ± 0.19 | 91.40 |
| FC WEG-3%b K30 | 35.00 ± 1.00 | 0.533 ± 0.012 | 0.720 ± 0.000 | 25.93 ± 1.60 | 1.35 ± 0.03 | 111.94 ± 1.15 | 1.99 ± 0.01 | 0.57 ± 0.03 | — |
| FC WCG-6%b K30 | 33.50 ± 0.00 | 0.487 ± 0.012 | 0.687 ± 0.012 | 29.13 ± 0.49 | 1.41 ± 0.01 | 198.18 ± 1.05 | 1.70 ± 0.03 | 0.81 ± 0.20 | 93.62 |
| FC WSG-6%b K30 | 33.67 ± 0.58 | 0.473 ± 0.012 | 0.640 ± 0.000 | 26.04 ± 1.80 | 1.35 ± 0.03 | 117.75 ± 2.05 | 1.51 ± 0.04 | 0.70 ± 0.05 | 95.44 |
| FC WEG-6%b K30 | 33.33 ± 0.29 | 0.500 ± 0.000 | 0.680 ± 0.000 | 26.47 ± 0.00 | 1.36 ± 0.00 | 149.91 ± 1.90 | 1.90 ± 0.02 | 0.65 ± 0.11 | — |
| FC WCG-9%b K30 | 33.33 ± 0.29 | 0.447 ± 0.012 | 0.600 ± 0.000 | 25.56 ± 1.92 | 1.34 ± 0.03 | 231.08 ± 3.11 | 1.62 ± 0.05 | 0.81 ± 0.03 | 90.38 |
| FC WSG-9%b K30 | 33.17 ± 0.76 | 0.440 ± 0.000 | 0.620 ± 0.000 | 29.03 ± 0.00 | 1.41 ± 0.00 | 129.02 ± 2.48 | 1.37 ± 0.01 | 1.01 ± 0.11 | 95.39 |
| FC WEG-9%b K30 | 33.17 ± 0.58 | 0.467 ± 0.012 | 0.627 ± 0.012 | 25.54 ± 0.47 | 1.34 ± 0.01 | 172.67 ± 2.62 | 1.77 ± 0.01 | 0.74 ± 0.11 | — |
| FC WCG-9%b K17 | 37.83 ± 1.26 | 0.533 ± 0.012 | 0.720 ± 0.020 | 25.91 ± 1.03 | 1.35 ± 0.02 | 204.56 ± 3.72 | 1.70 ± 0.02 | 0.66 ± 0.33 | 86.62 |
| FC WSG-9%b K17 | 35.67 ± 1.15 | 0.520 ± 0.000 | 0.700 ± 0.000 | 25.71 ± 0.00 | 1.35 ± 0.00 | 106.91 ± 1.67 | 1.62 ± 0.02 | 0.83 ± 0.03 | 88.73 |
| FC WEG-9%b K17 | 36.17 ± 1.04 | 0.520 ± 0.000 | 0.700 ± 0.000 | 25.71 ± 0.00 | 1.35 ± 0.00 | 157.19 ± 2.06 | 2.02 ± 0.02 | 0.63 ± 0.14 | — |
| FC WCG-9%b K25 | 34.00 ± 0.00 | 0.533 ± 0.012 | 0.733 ± 0.012 | 27.28 ± 0.43 | 1.38 ± 0.01 | 219.03 ± 1.08 | 1.64 ± 0.02 | 0.67 ± 0.03 | 88.70 |
| FC WSG-9%b K25 | 33.83 ± 0.76 | 0.480 ± 0.000 | 0.647 ± 0.012 | 25.76 ± 1.31 | 1.35 ± 0.02 | 116.71 ± 1.92 | 1.52 ± 0.01 | 0.91 ± 0.07 | 93.69 |
| FC WEG-9%b K25 | 34.33 ± 0.76 | 0.520 ± 0.000 | 0.693 ± 0.012 | 24.99 ± 1.26 | 1.33 ± 0.02 | 167.04 ± 4.17 | 1.83 ± 0.02 | 0.70 ± 0.13 | — |
| FC WCG-10%c K30 | 35.00 ± 0.00 | 0.560 ± 0.000 | 0.753 ± 0.012 | 25.65 ± 1.15 | 1.35 ± 0.02 | 223.61 ± 3.84 | 1.51 ± 0.01 | 0.53 ± 0.11 | 92.64 |
| FC WSG-10%c K30 | 35.00 ± 0.00 | 0.507 ± 0.012 | 0.687 ± 0.012 | 26.22 ± 0.44 | 1.36 ± 0.01 | 133.93 ± 1.00 | 1.42 ± 0.01 | 0.81 ± 0.07 | 91.24 |
| FC WEG-10%c K30 | 35.00 ± 0.00 | 0.547 ± 0.012 | 0.720 ± 0.000 | 24.07 ± 1.60 | 1.32 ± 0.03 | 177.57 ± 0.76 | 1.70 ± 0.03 | 0.70 ± 0.17 | — |
| FC WCG-16%c K30 | 33.50 ± 0.87 | 0.440 ± 0.000 | 0.600 ± 0.000 | 26.67 ± 0.00 | 1.36 ± 0.00 | 240.92 ± 3.06 | 1.60 ± 0.02 | 0.65 ± 0.04 | 89.96 |
| FC WSG-16%c K30 | 34.33 ± 1.15 | 0.480 ± 0.000 | 0.660 ± 0.000 | 27.27 ± 0.00 | 1.38 ± 0.00 | 124.95 ± 1.81 | 1.46 ± 0.01 | 0.88 ± 0.07 | 91.95 |
| FC WEG-16%c K30 | 34.50 ± 0.50 | 0.473 ± 0.012 | 0.633 ± 0.012 | 25.27 ± 0.47 | 1.34 ± 0.01 | 181.38 ± 2.12 | 1.94 ± 0.03 | 0.80 ± 0.08 | — |
AR, angle of repose; Pb, bulk density; Pta, tapped density; CI, Carr’s index; HR, Hausner ratio; D0.5, median particle size; Span, particle size distribution; MC, moisture content; PY, percent yield; WCG, wet-granulation citric acid granules; WSG, wet-granulation sodium bicarbonate granules; WEG, wet-granulation effervescent granules; PM, physical mixture; K30, PVP-K30; FC, fluid-bed coating; K17, PVP-K17; K25, PVP-K25.
% was the PVP content (w/w) and the PVP spray solution concentration (w/v) was 13%.
% was the PVP spray solution concentration (w/v) and the PVP content (w/w) was 9%.
3.2. Sticking propensity during tableting
The punch sticking of ETs—the most common complication during the scale-up tableting production—always impairs the tablet surfaces and weight consistency.24–26 Moreover, it can even seriously damage the tablet press or tooling.24 Therefore, it is fairly urgent to resolve this problem.
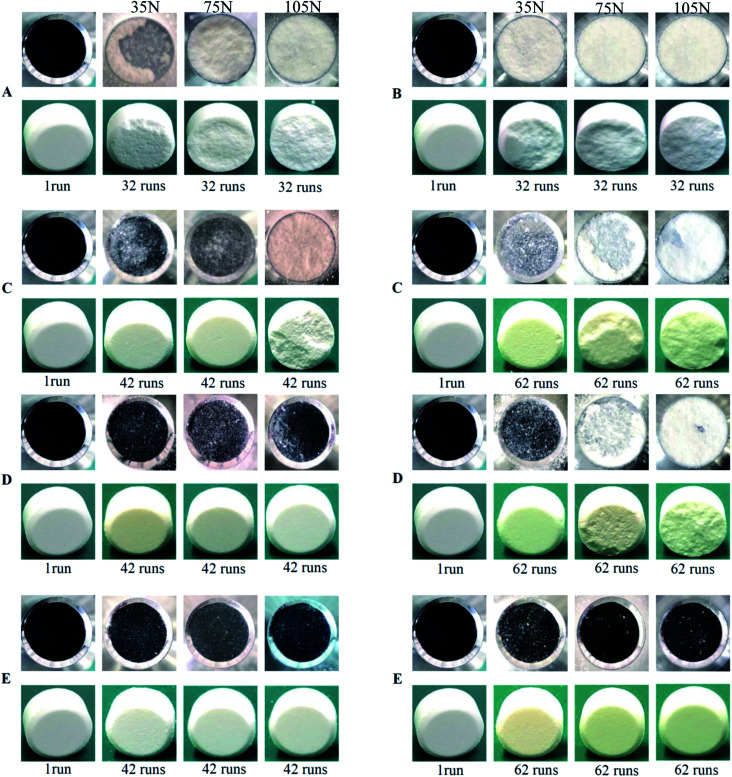
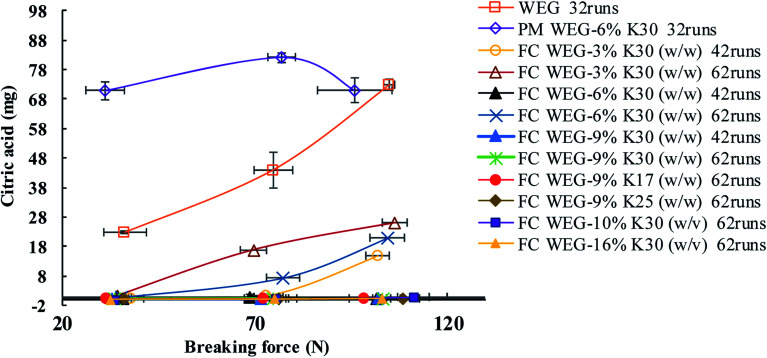
In this experiment, the bottom-spray fluid-bed coating technique was utilized to coat the WCG and WSG with a series of PVP (including PVP contents, PVP with different molecular weights, and PVP spray solution concentrations). Further, several points could be summarized from the results shown in Fig. 3 and 4 and Table 2. Firstly, after 32 compaction runs, powders of the original wet-granulation effervescent granules (WEG) group were seriously adhered onto the surface of the press punch, and the corresponding surfaces of three types of tablets with different breaking forces (i.e., 35, 75, and 105 N) were seriously damaged, particularly in 75 and 105 N tablets (Fig. 3 and Table 2; corresponding sticking punch mass: 77.56 vs. 149.56 vs. 248.16 mg). However, even after 42 compaction runs, most of the groups of FC WEG with different PVP K30 contents (i.e., 3, 6, and 9% (w/w)) showed no obvious sticking, except the 3% PVP-K30-coated WEG group, which showed marginal sticking during the compaction of the 105 N tablets (sticking punch mass: 51.87 mg). Namely, the sticking punch degree of the FC WEG significantly decreased and therefore remarkably prolonged the compaction time used to produce qualified ETs during scale-up tableting.
Fig. 3. Graphs of punch sticking and corresponding tablets after specific compactions. (A) WEG; (B) PM WEG-6% K30; (C) FC WEG-3% K30 (w/w); (D) FC WEG-6% K30 (w/w); (E) FC WEG-9% K30 (w/w). WEG, wet-granulation effervescent granules; PM, physical mixture; K30, PVP-K30; FC, fluid-bed coating. The PVP spray solution concentrations in the (C), (D), (E) groups were 13% (w/v). The punch sticking graphs of the other PVP grades (i.e., PVP-K17 and PVP-K25 groups; 9% (w/w) of PVP content, 13% (w/v) of spray solution concentration) and PVP K30 spray solution concentrations groups (i.e., 10 and 16% (w/v) groups; 9% (w/w) of PVP content) groups were comparable to those for the E group.
Fig. 4. Sticking profiles of citric acid on punch tips after specific compactions. WEG, wet-granulation effervescent granules; PM, physical mixture; K30, PVP-K30; FC, fluid-bed coating; K17, PVP-K17; K25, PVP-K25.
Punch sticking properties of the materials studied in this work (mean ± SD, n = 3)a.
| Materials | Hardness (N) | Runs | Sticking of citric acid (mg) | Sticking of punch tip (mg) | Account for tablet mass (%) |
|---|---|---|---|---|---|
| WEG | 35 | 32 | 22.80 ± 0.51 | 77.56 ± 1.74 | 15.51 ± 0.35 |
| 75 | 32 | 43.96 ± 5.94 | 149.56 ± 20.22 | 29.91 ± 4.04 | |
| 105 | 32 | 72.94 ± 1.85 | 248.16 ± 6.30 | 49.63 ± 1.26 | |
| PM WEG-6% K30 | 35 | 32 | 70.83 ± 3.13 | 256.84 ± 11.36 | 51.37 ± 2.27 |
| 75 | 32 | 82.17 ± 1.64 | 297.98 ± 5.94 | 59.60 ± 1.19 | |
| 105 | 32 | 71.03 ± 4.26 | 257.58 ± 15.44 | 51.52 ± 3.09 | |
| FC WEG-3%b K30 | 35 | 42 | 0.52 ± 0.01 | 1.83 ± 0.02 | 0.37 ± 0.00 |
| 75 | 42 | 1.22 ± 0.01 | 4.27 ± 0.03 | 0.85 ± 0.01 | |
| 105 | 42 | 14.77 ± 0.02 | 51.87 ± 0.06 | 10.37 ± 0.01 | |
| 35 | 62 | 1.31 ± 0.01 | 4.61 ± 0.03 | 0.92 ± 0.01 | |
| 75 | 62 | 16.95 ± 0.01 | 59.51 ± 0.02 | 11.90 ± 0.00 | |
| 105 | 62 | 26.11 ± 0.04 | 91.67 ± 0.13 | 18.33 ± 0.03 | |
| FC WEG-6%b K30 | 35 | 42 | 0.24 ± 0.00 | 0.85 ± 0.01 | 0.17 ± 0.00 |
| 75 | 42 | 0.78 ± 0.00 | 2.82 ± 0.00 | 0.56 ± 0.00 | |
| 105 | 42 | 0.31 ± 0.01 | 1.14 ± 0.04 | 0.23 ± 0.01 | |
| 35 | 62 | 0.68 ± 0.00 | 2.48 ± 0.01 | 0.50 ± 0.00 | |
| 75 | 62 | 7.23 ± 0.01 | 26.23 ± 0.02 | 5.25 ± 0.00 | |
| 105 | 62 | 20.80 ± 0.03 | 75.43 ± 0.12 | 15.09 ± 0.02 | |
| FC WEG-9%b K30 | 35 | 42 | 0.14 ± 0.01 | 0.54 ± 0.03 | 0.11 ± 0.01 |
| 75 | 42 | 0.22 ± 0.01 | 0.82 ± 0.03 | 0.16 ± 0.01 | |
| 105 | 42 | 0.46 ± 0.01 | 1.74 ± 0.04 | 0.35 ± 0.01 | |
| 35 | 62 | 0.20 ± 0.00 | 0.73 ± 0.01 | 0.15 ± 0.00 | |
| 75 | 62 | 0.36 ± 0.00 | 1.36 ± 0.00 | 0.27 ± 0.00 | |
| 105 | 62 | 0.46 ± 0.00 | 1.73 ± 0.00 | 0.35 ± 0.00 | |
| FC WEG-9%b K17 | 35 | 62 | 0.15 ± 0.01 | 0.58 ± 0.04 | 0.12 ± 0.01 |
| 75 | 62 | 0.23 ± 0.01 | 0.87 ± 0.02 | 0.17 ± 0.00 | |
| 105 | 62 | 0.32 ± 0.00 | 1.20 ± 0.01 | 0.24 ± 0.00 | |
| FC WEG-9%b K25 | 35 | 62 | 0.15 ± 0.00 | 0.56 ± 0.01 | 0.11 ± 0.00 |
| 75 | 62 | 0.20 ± 0.00 | 0.75 ± 0.02 | 0.15 ± 0.00 | |
| 105 | 62 | 0.43 ± 0.02 | 1.62 ± 0.07 | 0.32 ± 0.01 | |
| FC WEG-10%c K30 | 35 | 62 | 0.1 ± 0.00 | 0.37 ± 0.02 | 0.07 ± 0.00 |
| 75 | 62 | 0.14 ± 0.01 | 0.52 ± 0.02 | 0.10 ± 0.00 | |
| 105 | 62 | 0.66 ± 0.00 | 2.49 ± 0.00 | 0.50 ± 0.00 | |
| FC WEG-16%c K30 | 35 | 62 | 0.10 ± 0.00 | 0.39 ± 0.01 | 0.08 ± 0.00 |
| 75 | 62 | 0.14 ± 0.00 | 0.51 ± 0.02 | 0.10 ± 0.00 | |
| 105 | 62 | 0.36 ± 0.00 | 1.34 ± 0.02 | 0.27 ± 0.00 |
WEG, wet-granulation effervescent granules; PM, physical mixture; K30, PVP-K30; FC, fluid-bed coating; K17, PVP-K17; K25, PVP-K25.
% was the PVP content (w/w) and the PVP spray solution concentration (w/v) was 13%.
% was the PVP spray solution concentration (w/v) and the PVP content (w/w) was 9%.
Secondly, when compared with the PM group of WEG and 6% PVP K30, which induced sticking similar to the original WEG group after 32 compaction runs, the 6% PVP-K30-coated WEG group obtained by means of the fluid-bed coating technique showed no obvious sticking even after 42 runs during the tableting of the three kinds of tablets (e.g., sticking mass for 105 N tablets: 257.58 vs. 1.14 mg). Therefore, fluid-bed coating was crucial in the process of resolving the problem of punch sticking of ETs.
Thirdly, as the compaction runs increased from 42 to 62, a higher degree of sticking could be found in the 3% PVP-K30-coated WEG group (sticking mass: 1.83 vs. 4.16 mg, 35 N tablets; 4.27 vs. 59.51 mg, 75 N tablets; and 51.87 vs. 91.67 mg, 105 N tablets). Further, the corresponding tablet surfaces became much coarser and were even totally damaged. Although sticking also appeared in the 6% PVP-K30-coated WEG group when 75 and 105 N tablets were produced after 62 compaction runs, the sticking mass was much less than that of the 3% group (26.23 vs. 59.51 mg, 75 N tablets; 75.43 vs. 91.67 mg, 105 N tablets). On the other hand, as the PVP content increased to 9% (w/w), no obvious sticking could be found in all the groups that were coated with a series of PVP with different molecular weights (i.e., PVP K30, K25, and K17) and PVP spray solution concentrations (i.e., 10, 13, and 16% (w/v)). Namely, as the PVP content used for coating increased from 3 to 9%, the corresponding sticking propensity would become increasingly less.
In general, the improvement in the sticking propensity may be due to the following reasons: (i) uniform and efficient surface distribution of PVP via fluid-bed coating could effectively reduce the exposure of adhesive acidic granules and therefore significantly prevent the included adhesive components from contacting with the punch during tableting; and (ii) the adhesion force between the tablet and press punch surface was also remarkably decreased owing to the efficient coating layer, making the surface of the acidic granules more prone to the PVP's surface.27,28 Such an efficient surface coating was confirmed by the SEM and surface element analysis data (Fig. 2 and Table 3). From Fig. 2, it is evident that as the PVP content (w/w) increased, the surface of the acidic granules became increasingly smoother and gradually prone to the surface of the coating material (i.e., PVP). Moreover, the results of the surface element compositions (Table 3) also revealed that when compared with the original WCG group, the weight percentage and atomic percentage of the surface elements, namely, “carbon, nitrogen, and oxygen” of the coating groups were both increasingly closer to those of the coating material (PVP, (C6H9NO)n; elemental weight percentage ratio: 70.6 : 13.7 : 15.7%; atomic percentage ratio: 75.0 : 12.5 : 12.5%) as the PVP content increased from 3 to 9% (9 vs. 6 vs. 3% vs. WCG; elemental weight percentage ratio: 52.21 : 21.13 : 26.66% vs. 45.27 : 23.91 : 30.83% vs. 33.70 : 26.65 : 39.66% vs. 26.10 : 38.03 : 35.88%; atomic percentage ratio: 57.78 : 20.07 : 22.16% vs. 50.91 : 23.05 : 26.05% vs. 39.04 : 26.45 : 34.50% vs. 30.45 : 38.09 : 31.47%, respectively). Such results demonstrated that the shell material (PVP) was efficiently coated onto the surface of the WCG by the fluid-bed coating technique and therefore effectively prevented the sticking from appearing during the scale-up production.
Surface element compositions of the materials studied in this worka.
| Material | Element weight (%) | Element atom (%) | ||||
|---|---|---|---|---|---|---|
| Carbon | Nitrogen | Oxygen | Carbon | Nitrogen | Oxygen | |
| WCG | 26.10 ± 2.85 | 38.03 ± 0.57 | 35.88 ± 2.27 | 30.45 ± 3.09 | 38.09 ± 0.87 | 31.47 ± 2.23 |
| FC WCG-3%b K30 | 33.70 ± 1.62 | 26.65 ± 1.28 | 39.66 ± 0.34 | 39.04 ± 1.75 | 26.45 ± 1.35 | 34.50 ± 0.39 |
| FC WCG-6%b K30 | 45.27 ± 1.29 | 23.91 ± 1.66 | 30.83 ± 2.95 | 50.91 ± 1.17 | 23.05 ± 1.47 | 26.05 ± 2.65 |
| FC WCG-9%b K30 | 52.21 ± 2.22 | 21.13 ± 1.45 | 26.66 ± 0.77 | 57.78 ± 2.20 | 20.07 ± 1.47 | 22.16 ± 0.73 |
WCG, wet-granulation citric acid granules; FC, fluid-bed coating; K30, PVP-K30.
% was the PVP content (w/w) and the PVP spray solution concentration (w/v) was 13%.
3.3. Tablet hygroscopicity
ETs could rapidly absorb ambient moisture to make the surface of tables become coarse and even soften the tablets. This is mainly due to the fact that (i) when contacting with small amounts of water, the included hygroscopic acid source (like citric acid) could quickly absorb water to react with the alkali source (like sodium bicarbonate) to produce organic acid salt, carbon dioxide, and water;29 (ii) the produced water could further accelerate the process of effervescent reaction. On the other hand, the rapid moisture absorption by ETs could also lead to destabilizing the drug preparations and therefore reducing the pharmacodynamic efficacy.30,31 Therefore, it is also beneficial to reduce this undesirable property of ETs.
The water contact angle value of PVP was reported to be 75.3°,32 which means that the PVP surface is hydrophilic and can be wetted or partly wetted by water. The hydrophilic nature also makes PVP somewhat hygroscopic. According to a previously reported paper, PVP could significantly increase its moisture content at 40–50% RH and absorb about 30% water after storage for 7 days at >90% RH.33 For effervescent systems, the high hygroscopicity of PVP may provide a stabilizing effect owing to a decrease in their affinity toward moisture.1 In this study, the observed stabilizing effect of PVP on the effervescent systems should be due to the following. First, the even distribution of PVP chains on the surface of citric acid granules formed a physical barrier to reduce the direct contact of citric acid with ambient moisture. Second, due to the high hygroscopicity of the PVP molecules, the PVP-containing surface layer would rapidly absorb water and form water vapor equilibrium with the environment. Third, the high water-bonding capacity of PVP (i.e., low water activity) and viscous rubbery state of PVP induced by moisture absorption worked together to reduce the availability of water for citric acid from both environment and PVP-containing surface layer.
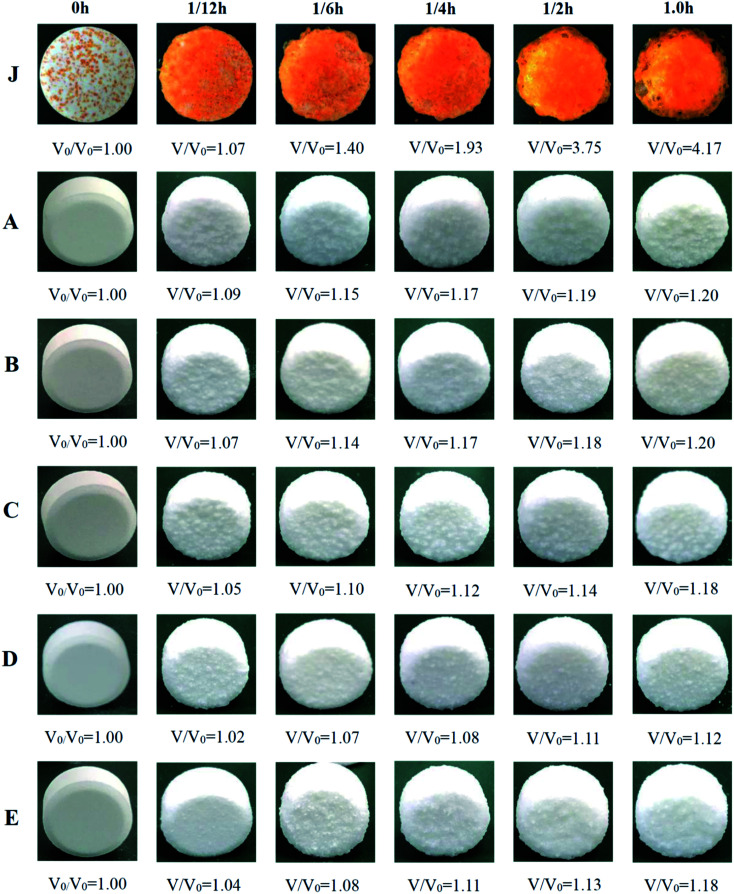
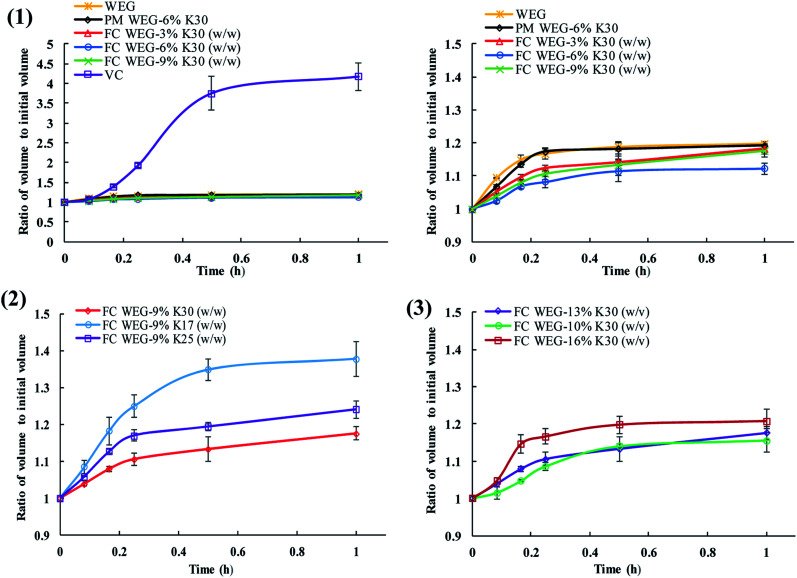
In this experiment, the fluid-bed coating of the granules of ETs with a small amount of PVP also decreased the high hygroscopicity of ETs to a certain degree. Some points can be concluded from the results shown in Fig. 5 and 6. Overall, in comparison to the commercial vitamin C ETs, the volume expansion ratio of the ETs produced in this study was significantly decreased in 1 h under high humidity and temperature conditions (i.e., RH: 75%; T: 40 °C), which accounted for only one-third that of commercial tablets at 30 min (3.75 vs. 1.11–1.35). Moreover, the moisture absorption rate constants (Kab) of the tablets for most of the fluid-bed coating groups within 15 min (0.34–0.50) were lower than those of the original WEG (0.67) and PM (0.71) groups. Namely, the hygroscopic degree of such ETs was reduced by fluid-bed coating with PVP. In general, the improvement in the stabilities of such ETs may be due to the fact that the efficient coating of PVP onto the surfaces of two kinds of granules used in ETs could create a physical barrier between the acid and alkali sources and therefore effectively prevent the acid–alkali reaction owing to the decreased affinity for moisture of these effervescent mixtures.1 Moreover, in the fluid-bed coating groups, the tablets' degree of volume expansion could be further decreased as the PVP content or PVP molecular weight increased or the PVP spray solution concentration decreased. The mechanism may be that (i) the amount of PVP-containing surface particles could be increased with an increase in PVP content and decrease in spray solution concentration (which led to an increase in the coating time) and therefore significantly increase the integrity of the barrier layer; and (ii) the increase in the molecular weight of PVP could result in increased surface viscosity, which could effectively prevent the surrounding moisture from permeating into the effervescent agents.34
Fig. 5. Graphs of moisture expansion of the compacted tablets under high humidity. (A) WEG; (B) PM WEG-6% K30; (C) FC WEG-3% K30 (w/w); D, FC WEG-6% K30 (w/w); E, FC WEG-9% K30 (w/w); J, effervescent vitamin C tablet available in the market. WEG, wet-granulation effervescent granules; PM, physical mixture; K30, PVP-K30; FC, fluid-bed coating. The PVP spray solution concentrations in the (C), (D), and (E) groups were 13% (w/v). The graphs of the moisture expansion of other PVP grades (i.e., PVP-K17 and PVP-K25 groups; 9% (w/w) of PVP contents, 13% (w/v) of spray solution concentration) and PVP-K30 spray solution concentrations groups (i.e., 10 and 16% (w/v) groups; 9% (w/w) of PVP content) groups were similar to those of the (E) group.
Fig. 6. Ratio of volume to initial volume vs. time profiles for tablets under high humidity. (1) PVP contents; (2) PVP grades; (3) PVP spray solution concentrations. WEG, wet-granulation effervescent granules; PM, physical mixture; K30, PVP-K30; FC, fluid-bed coating; K17, PVP-K17; K25, PVP-K25.
3.4. Tableting and tablet properties
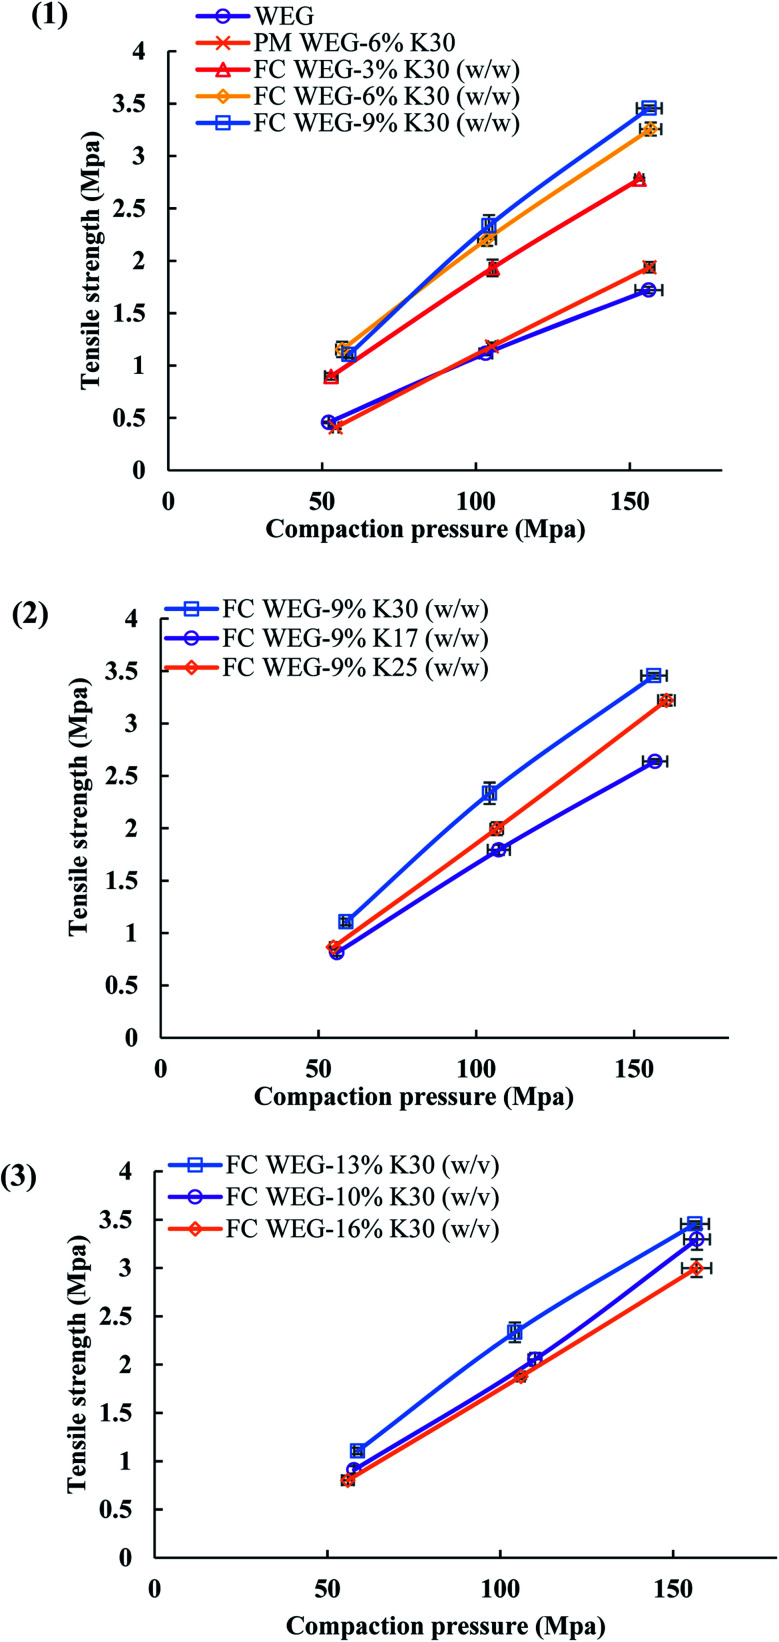
The common components of ETs generally have poor compactibility and therefore a relatively high compaction pressure is always needed to be used for producing ETs. This often considerably burdens or even damages the press punch. In this study, fortunately, the compactibility of the feed via fluid-bed coating was significantly enhanced, too (Fig. 7–9 and Table 4).
Fig. 7. Tensile strength vs. compaction pressure profiles for the materials studied in this work. (1) PVP contents; (2) PVP grades; (3) PVP spray solution concentrations. WEG, wet-granulation effervescent granules; PM, physical mixture; K30, PVP-K30; FC, fluid-bed coating; K17, PVP-K17; K25, PVP-K25.
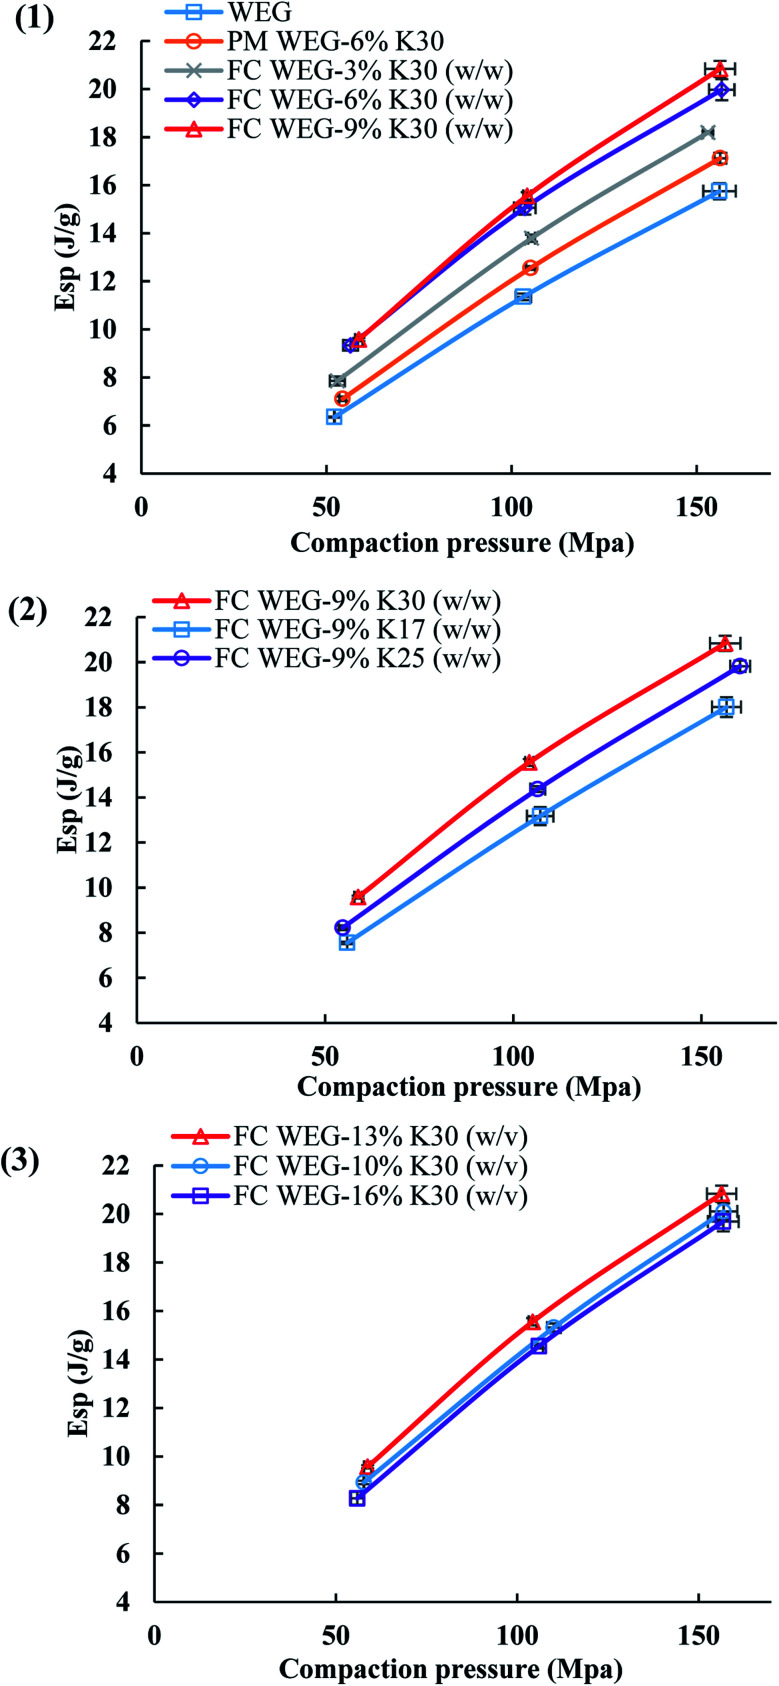
Fig. 8. E sp profiles for the materials studied in this work. (1) PVP contents; (2) PVP grades; (3) PVP spray solution concentrations. WEG, wet-granulation effervescent granules; PM, physical mixture; K30, PVP-K30; FC, fluid-bed coating; K17, PVP-K17; K25, PVP-K25.
Fig. 9. Heckel profiles of the materials studied in this work. (1) PVP contents; (2) PVP grades; (3) PVP spray solution concentrations. WEG, wet-granulation effervescent granules; PM, physical mixture; K30, PVP-K30; FC, fluid-bed coating; K17, PVP-K17; K25, PVP-K25.
Tableting parameters of the materials studied in this work (mean ± SD, n = 3)a.
| Materials | CR (%) | FES (%) | P y d (MPa) | PL (%) | PuL (%) | PuL-PL |
|---|---|---|---|---|---|---|
| WEG | 32.91 ± 0.04 | 7.72 ± 0.44 | 94.87 ± 2.00 | 7.01 ± 0.32 | 13.67 ± 0.51 | 6.66 ± 0.34 |
| PM WEG-6% K30 | 33.52 ± 0.04 | 7.95 ± 0.10 | 76.49 ± 2.88 | 6.10 ± 0.24 | 13.00 ± 0.30 | 6.90 ± 0.06 |
| FC WEG-3%b K30 | 31.22 ± 0.03 | 7.15 ± 0.32 | 68.92 ± 1.74 | 5.17 ± 0.49 | 11.51 ± 0.34 | 6.33 ± 0.29 |
| FC WEG-6%b K30 | 30.94 ± 0.03 | 7.36 ± 0.32 | 67.90 ± 1.50 | 3.19 ± 0.40 | 9.83 ± 0.34 | 6.64 ± 0.29 |
| FC WEG-9%b K30 | 29.36 ± 0.05 | 7.14 ± 0.11 | 72.15 ± 1.08 | 2.96 ± 0.09 | 9.42 ± 0.00 | 6.46 ± 0.09 |
| FC WEG-9%b K17 | 32.96 ± 0.13 | 7.18 ± 0.31 | 70.75 ± 4.45 | 2.50 ± 0.24 | 9.03 ± 0.36 | 6.53 ± 0.26 |
| FC WEG-9%b K25 | 30.46 ± 0.12 | 7.39 ± 0.31 | 80.59 ± 2.21 | 2.91 ± 0.30 | 9.60 ± 0.18 | 6.69 ± 0.28 |
| FC WEG-10%c K30 | 31.47 ± 0.03 | 7.63 ± 0.18 | 81.69 ± 3.45 | 4.34 ± 0.52 | 11.11 ± 0.61 | 6.77 ± 0.12 |
| FC WEG-16%c K30 | 30.22 ± 0.14 | 7.57 ± 0.19 | 83.98 ± 1.71 | 4.33 ± 0.60 | 11.06 ± 0.64 | 6.73 ± 0.14 |
CR, compression ratio; FES, fast elastic stretch; Py, yield pressure; PL, porosity (loaded); PuL, porosity (unloaded); CR, FES, PL, and PuL were determined under the compaction pressure of 159 MPa. WEG, wet-granulation effervescent granules; PM, physical mixture; K30, PVP-K30; FC, fluid-bed coating; K17, PVP-K17; K25, PVP-K25.
% was the PVP content (w/w) and the PVP spray solution concentration (w/v) was 13%.
% was the PVP spray solution concentration (w/v) and the PVP content (w/w) was 9%.
Yield pressure was determined under compaction pressure of 40–95 MPa.
As shown in Fig. 7, the TS values for the FC WEG groups were obviously higher than those for the parent WEG and corresponding PM groups. Moreover, TS could be further improved as the PVP content or PVP molecular weight was increased or the PVP spray solution concentration was decreased. In particular, the TS values of the tablets of PVP-coated WEG groups were 1.62–2.01 and 1.43–1.78 times higher than those of the WEG and PM groups, respectively. The improvement in the compactibility of the PVP-coated groups may be attributed to the following: (i) the plastic PVP material with superior tableting property was effectively and uniformly coated onto the surfaces of the granules of ETs and made the tableting performance of the granules come closer to that of PVP; (ii) the increase in the PVP level, PVP viscosity, and PVP coating time could help the coating layer become thicker, denser, and more even (Table 5); (iii) the lower Span values of the coated groups as compared to the WEG and PM groups (1.70–2.02 vs. 2.61 vs. 2.58) (Table 1) implied more uniform particle size distribution, which was helpful in compaction; and (iv) both lower bulk and tapped densities of the coated groups in comparison to those of the WEG and PM groups (0.467–0.547 vs. 0.647 vs. 0.620 g cm−3; 0.629–0.720 vs. 0.820 vs. 0.850 g cm−3) (Table 1) could ensure more volume was reduced during compacting, thereby enhancing compactibility.
Density, viscosity, and surface tension of the spray solution used in this work (mean ± SD, n = 3).
| Coating solution | Viscosity (mPa s) | Density (g ml−1) | Surface tension (mN m−1) |
|---|---|---|---|
| 13% PVP-K17 (w/v) | 2.38 ± 0.01 | 1.0107 ± 0.0003 | 65.7 ± 0.1 |
| 13% PVP-K25 (w/v) | 5.02 ± 0.03 | 1.0113 ± 0.0004 | 67.3 ± 0.1 |
| 13% PVP-K30 (w/v) | 7.14 ± 0.04 | 1.0121 ± 0.0003 | 65.1 ± 0.1 |
| 10% PVP-K30 (w/v) | 4.79 ± 0.04 | 1.0069 ± 0.0003 | 66.3 ± 0.1 |
| 16% PVP-K30 (w/v) | 10.1 ± 0.0 | 1.0166 ± 0.0014 | 64.6 ± 0.1 |
Besides the above analysis, the tableting parameters (summarized in Table 4 and Fig. 8 and 9) obtained from the analytical system of the press could also be used to illustrate the mechanism of compactibility improvement.
The Esp values—the net energy used for the irreversible deformation of the compacted feed—reflect the materials' deformability. As shown in Fig. 8, the variation tendency in the Esp profiles was fairly similar to that of the TS profiles. Namely, the Esp values of the PVP-coated groups were higher than those of the WEG and PM groups, too. This is due to the fact that for the groups with higher Esp, more energy input was required to compact the feed, thereby producing tablets with higher TS values.
The yield pressure (Py)—the inverse of the slope of the linear part of the Athy–Heckel plot (Fig. 9)—is often used to indicate the mechanism of material densification.35 The lower the Py value, the higher is the plastic deformation and better compactibility of the material.36 As compared to the WEG group, the Py values of the PVP-coated groups were significantly lower (94.87 vs. 67.90–83.98 MPa), suggesting that both plastic deformability and compactibility were improved after fluid-bed coating with PVP. Moreover, other tableting parameters, such as compression ratio (CR), were also improved after coating. CR indicates the deformation performance of the materials during compaction: a lower CR value implies better compactibility.
However, tablet porosity (PuL) decreased after fluid-bed coating as compared to those of the WEG and PM groups (9.03–11.51 vs. 13.67 vs. 13.00%). This resulted in a delay of nearly 15–40 s in the disintegration time of ETs due to the relatively high porosity (which is essential for water penetration), thereby facilitating faster disintegration.1 Fortunately, in this study, the disintegration time of all the produced ETs was within 2 min, which was much lower than the upper limit value (i.e., 5 min) for common ET products.
Overall, when compared with the above fluid-bed coating technique, most of the traditional strategies could only improve either the sticking or hygroscopicity of ETs to a relatively limited extent. For example, after the addition of lubricants and anti-adherent agents, the highly adhesive granules could easily come into contact with the punch surfaces due to the difficulty in uniform mixing and sufficient covering. Therefore, sticking would still frequently appear. On the other hand, although the addition of certain desiccants and moisture-resistance excipients could partly decrease the hygroscopicity of ETs, this would often cause other undesirable problems such as safety and dissolution. Moreover, during the scale-up tableting production, it is fairly difficult to effectively control the ambient humidity to the desirable value (e.g., below 40% RH) and therefore the included hygroscopic substances (e.g., citric acid) could still absorb moisture to become sticky. In comparison with the above traditional technologies, the fluid-bed coating technique used in this study could not only effectively address both the sticking and hygroscopic problems of ETs, but also markedly enhance their compactibility.
4. Conclusion
The frequent punch sticking and high hygroscopicity of ETs have always restricted their development in practical production and application. The coating of a small amount of plastic material onto the surface of ET granules is a type of useful and pragmatic strategy to effectively improve such undesirable properties. In this study, PVP, rather than other plastic materials (e.g., HPMC-E3, which was believed to seriously retard the disintegration time of ETs21), was utilized to coat ET granules by means of the fluid-bed coating technique. When compared with the parent WEG and the corresponding PM groups, the PVP-coated WEGs not only showed much lower or no punch sticking, but also exhibited lower hygroscopicity and better compactibility. This implied that the relationship between the PVP and wet-granulation granules via the fluid-bed coating is not simple superposition or simple mixing just like that in the PM group. In contrast, PVP can be gradually combined onto the granule surfaces with the passage of fluid-bed coating time. Eventually, if both the coating time and PVP are sufficient, a type of core–shell composite particle structure can be produced, thereby (i) effectively preventing the problematic acidic granules from exposure and significantly reducing the possibility of sticking; (ii) effectively preventing the hygroscopic effervescent agents from coming into contact with ambient moisture to prematurely cause acid–alkali reactions; and (iii) effectively increasing the surface's plastic deformation to improve material compactibility. Overall, in this study, these properties were improved with an increase in the PVP content (from 3 to 9%, w/w) and PVP molecular weight (K30 > K25 > K17) or a decrease in the PVP spray solution concentration (from 16 to 10%, w/v) owing to the formation of an increasingly uniform and cohesive coating layer.
This novel fluid-bed coating strategy is applicable in practice and should also be popular with relevant practitioners due to (i) decreasing press punch wastage; (ii) reducing ET cost owing to the materials saved for tableting; and (iii) improving tablet qualities.
Conflicts of interest
There are no conflicts to declare.
Supplementary Material
Acknowledgments
This work was sponsored by Natural Science Foundation of Shanghai (18ZR1439800, 18ZR1436600), China; Three-year Action Plan for the Development of Traditional Chinese Medicine of Shanghai Municipal Health Planning Commission (ZY(2018-2020)-CCCX-2001-03), China; the Xinglin Young Scholar Program of Shanghai University of Traditional Chinese Medicine, China (A1-U17205010416); and the Graduate Student Innovation Ability Project of Shanghai University of Traditional Chinese Medicine, China (Y2019082).
References
- Jacob S. Shirwaikar A. Nair A. Drug Dev. Ind. Pharm. 2009;35:321–328. doi: 10.1080/03639040802337021. [DOI] [PubMed] [Google Scholar]
- Jaipal A. Pandey M. M. Charde S. Y. Sadhu N. Srinivas A. Prasad R. G. Drug Delivery. 2016;23:452–458. doi: 10.3109/10717544.2014.917388. [DOI] [PubMed] [Google Scholar]
- Sendall F. E. Staniforth J. N. J. Pharm. Pharmacol. 1986;38:489–493. doi: 10.1111/j.2042-7158.1986.tb04620.x. [DOI] [PubMed] [Google Scholar]
- Li Z. Zhao L. J. Lin X. Shen L. Feng Y. Int. J. Pharm. 2017;529:543–556. doi: 10.1016/j.ijpharm.2017.07.035. [DOI] [PubMed] [Google Scholar]
- Uchimoto T. Iwao Y. Yamamoto T. Sawaguchi K. Moriuchi T. Noguchi S. Itai S. Int. J. Pharm. 2013;441:128–134. doi: 10.1016/j.ijpharm.2012.12.006. [DOI] [PubMed] [Google Scholar]
- Chattoraj S. Daugherity P. McDermott T. Olsofsky A. Roth W. J. Tobyn M. J. Pharm. Sci. 2018;107:2267–2282. doi: 10.1016/j.xphs.2018.04.029. [DOI] [PubMed] [Google Scholar]
- Zhou X. Y. Huang X. B. Chen H. H. Meng D. P. Zhao W. J. Northwest Pharm. J. 2012;27:452–454. [Google Scholar]
- Reed K. Davies C. Kelly K. Powder Technol. 2015;285:103–109. doi: 10.1016/j.powtec.2015.05.005. [DOI] [Google Scholar]
- Li J. Z. Wu F. Lin X. Shen L. Wang Y. J. Feng Y. RSC Adv. 2015;5:69289–69298. doi: 10.1039/C5RA10496C. [DOI] [Google Scholar]
- Li J. Z. Lin X. Wu F. Shen L. Wang Y. J. Feng Y. RSC Adv. 2015;5:94105–94114. doi: 10.1039/C5RA15941E. [DOI] [Google Scholar]
- Dong Q. Q. Zhou M. M. Lin X. Shen L. Feng Y. Eur. J. Pharm. Sci. 2018;119:147–158. doi: 10.1016/j.ejps.2018.04.001. [DOI] [PubMed] [Google Scholar]
- Li Z. Xian J. C. Wu F. Lin X. Shen L. Feng Y. Powder Technol. 2018;338:481–492. doi: 10.1016/j.powtec.2018.07.014. [DOI] [Google Scholar]
- Oo M. K. Mandal U. K. Chatterjee B. Pharm. Dev. Technol. 2017;22:2–12. doi: 10.3109/10837450.2015.1116568. [DOI] [PubMed] [Google Scholar]
- Becker D. Rigassi T. BauerBrandl A. Drug Dev. Ind. Pharm. 1997;23:791–808. doi: 10.3109/03639049709150550. [DOI] [PubMed] [Google Scholar]
- Danda L. J. A. Batista L. M. Melo V. C. S. Soares Sobrinho J. L. Soares M. F. R. Eur. J. Pharm. Sci. 2019;133:79–85. doi: 10.1016/j.ejps.2019.03.012. [DOI] [PubMed] [Google Scholar]
- Yousaf A. M. Malik U. R. Shahzad Y. Mahmood T. Hussain T. Journal of pharmaceutical analysis. 2019;9:34–39. doi: 10.1016/j.jpha.2018.09.003. [DOI] [PMC free article] [PubMed] [Google Scholar]
- Motallae S. Taheri A. Homayouni A. J. Drug Delivery Sci. Technol. 2018;46:188–196. doi: 10.1016/j.jddst.2018.05.020. [DOI] [Google Scholar]
- Liu H. Wang K. Schlindwein W. Li M. Int. J. Pharm. 2013;448:329–338. doi: 10.1016/j.ijpharm.2013.03.057. [DOI] [PubMed] [Google Scholar]
- Pietsch W. Powder Technol. 2003;130:8–13. doi: 10.1016/S0032-5910(02)00218-8. [DOI] [Google Scholar]
- Luo X. J. Xin H. L. Rao X. Y. Xiao Z. Q. Gao L. L. Sun T. T. Guo Q. L. Chin J Chin Mater Med. 2008;33:973–976. [PubMed] [Google Scholar]
- Li Z. Zhou M. M. Wu F. Shen L. Lin X. Feng Y. Int. J. Pharm. 2019;564:10–21. doi: 10.1016/j.ijpharm.2019.04.021. [DOI] [PubMed] [Google Scholar]
- Grdesic P. Sovany T. Ilic I. G. Drug Dev. Ind. Pharm. 2018;44:1770–1782. doi: 10.1080/03639045.2018.1496447. [DOI] [PubMed] [Google Scholar]
- Ehlers H. Raikkonen H. Antikainen O. Heinamaki J. Yliruusi J. Int. J. Pharm. 2009;368:165–170. doi: 10.1016/j.ijpharm.2008.10.013. [DOI] [PubMed] [Google Scholar]
- Al-Karawi C. Leopold C. S. Eur. J. Pharm. Biopharm. 2018;128:107–118. doi: 10.1016/j.ejpb.2018.04.004. [DOI] [PubMed] [Google Scholar]
- Paul S. Sun C. C. Pharm. Res. 2018;35:10. doi: 10.1007/s11095-017-2301-5. [DOI] [PubMed] [Google Scholar]
- Ito M. Aoki S. Uchiyama J. Yamato K. J. Pharm. Sci. 2018;107:2144–2151. doi: 10.1016/j.xphs.2018.04.012. [DOI] [PubMed] [Google Scholar]
- Paul S. Taylor L. J. Murphy B. Krzyzaniak J. Dawson N. Mullarney M. P. Meenan P. Sun C. C. J. Pharm. Sci. 2017;106:151–158. doi: 10.1016/j.xphs.2016.07.015. [DOI] [PubMed] [Google Scholar]
- Paul S. Taylor L. J. Murphy B. Krzyzaniak J. F. Dawson N. Mullarney M. P. Meenan P. Sun C. C. Int. J. Pharm. 2017;521:374–383. doi: 10.1016/j.ijpharm.2017.02.053. [DOI] [PubMed] [Google Scholar]
- Zhang Z. Z. Hao L. Man Y. Xu G. Z. Zhou W. Y. Wei H. Y. Sci. Technol. Food Ind. 2012;33:114–117. [Google Scholar]
- Yang H. Q. Liu Y. X. Huang Y. M. Tang B. Guo D. Li H. Anal. Lett. 2016;49:2077–2091. doi: 10.1080/00032719.2015.1130715. [DOI] [Google Scholar]
- Zhou P. Chen K. Gao M. Qu J. Zhang Z. Dahlgren R. A. Li Y. Liu W. Huang H. Wang X. Food Chem. 2018;268:468–475. doi: 10.1016/j.foodchem.2018.06.099. [DOI] [PubMed] [Google Scholar]
- Planinsek O. Pisek R. Trojak A. Srcic S. Int. J. Pharm. 2000;207:77–88. doi: 10.1016/S0378-5173(00)00535-4. [DOI] [PubMed] [Google Scholar]
- Thakral S. Garcia-Barriocanal J. Thakral N. K. Int. J. Pharm. 2019;557:221–228. doi: 10.1016/j.ijpharm.2018.12.058. [DOI] [PubMed] [Google Scholar]
- Chan L. W. Wong T. W. Chua P. C. York P. Heng P. W. S. Chem. Pharm. Bull. 2003;51:107–112. doi: 10.1248/cpb.51.107. [DOI] [PubMed] [Google Scholar]
- Zhou M. M. Wang Y. J. Wu F. Shen L. Lin X. Feng Y. RSC Adv. 2018;8:24250–24260. doi: 10.1039/C8RA04125C. [DOI] [PMC free article] [PubMed] [Google Scholar]
- Osei-Yeboah F. Chang S. Y. Sun C. C. Pharm. Res. 2016;33:1126–1132. doi: 10.1007/s11095-016-1858-8. [DOI] [PubMed] [Google Scholar]


