Abstract
Conjugation of an anticancer drug with a cancer-specific carrier and a fluorescent dye to form a theranostic system enables real time monitoring of targeted drug delivery (TDD). However, the fluorescence signal from the dye is affected by the light absorption and scattering in the body, photobleaching, and instrumental parameters. Ratiometric measurements utilizing two fluorescence signals of different wavelengths are known to improve sensitivity, reliability and quantitation of fluorescence measurements in biological media. Herein, a novel theranostic system comprising the anticancer drug chlorambucil (CLB), cancer-specific peptide octreotide amide (OctA), and a long-wavelength dual fluorescent cyanine dye IRD enabling ratiometric monitoring of drug delivery was developed and evaluated on the cancer cell line PANC-1.
Novel theranostic system that first combines a cancer-targeting peptide with a long-wavelength dual fluorescent dye IRD in order to provide ratiometric monitoring of anticancer drug delivery is developed and evaluated in pancreatic cancer cell line.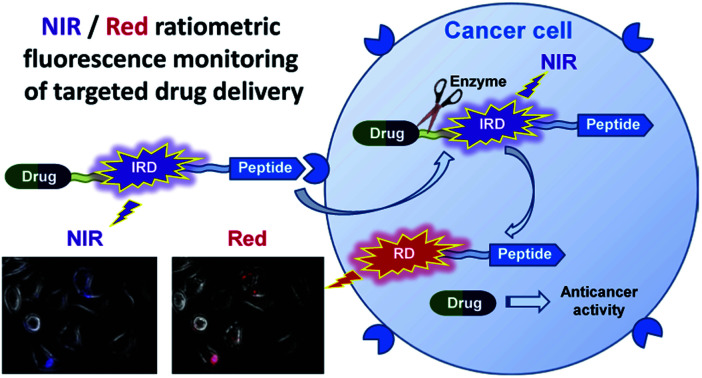
1. Introduction
Targeted delivery of anticancer drugs, as compared to conventional chemotherapy, improves therapeutic efficacy and minimizes side effects caused by nonspecific drug distribution.1 A basic targeted drug delivery (TDD) system comprises an anticancer drug covalently bound to a cancer-specific carrier such as a peptide, antibody or nanoparticle.2 Peptides have some advantages as carriers due to their small size, high selectivity, reduced toxicity, and ease of chemical modification.3,4 Combining this classical drug-carrier TDD system with a turn-on fluorogenic dye bound to the drug by means of a biodegradable linker predominantly cleavable in target tissue enables real-time monitoring of the efficacy and accuracy of drug delivery.5 The principle of the drug delivery detection consists of a noticeable increase in the fluorescence intensity of the fluorogenic dye upon the linker cleavage, with the fluorescence intensity correlating with the concentration of the released drug molecules.6
However, the fluorescence signal from the dye is affected by the light absorption and scattering in the body, kind of biological tissue and organs, light path depth, dye photobleaching, and instrumental parameters.7 Therefore, the quantitative measurements of the drug concentration and the drug release degree8 (the ratio between the number of the released drug molecules and the number of TDD conjugates accumulated in tissue sites) are problematic.
The ratiometric measurements using two fluorescence signals recorded at two different wavelengths are known to provide effective internal referencing and self-calibration that greatly improve sensitivity, reliability and quantification in biological samples.9 Ratiometry is unaffected by the sample nature and the instrumentation.
Recently, several dual fluorescent long-wavelength heptamethine cyanine dyes, containing a triggering hydroxyl group in the central cyclohexene moiety, were proposed for ratiometric sensing applications such as the determination of cysteine, hydrogen sulfide, hydrogen polysulfides, and superoxide anion in living cells.10 One of these dyes was suggested also for the dual-channel fluorescent in vivo tracking of an activatable prodrug delivery.11 Nevertheless, to the best of our knowledge, these heptamethine dyes have never been utilized to create ratiometric, carrier-driven TDD systems.
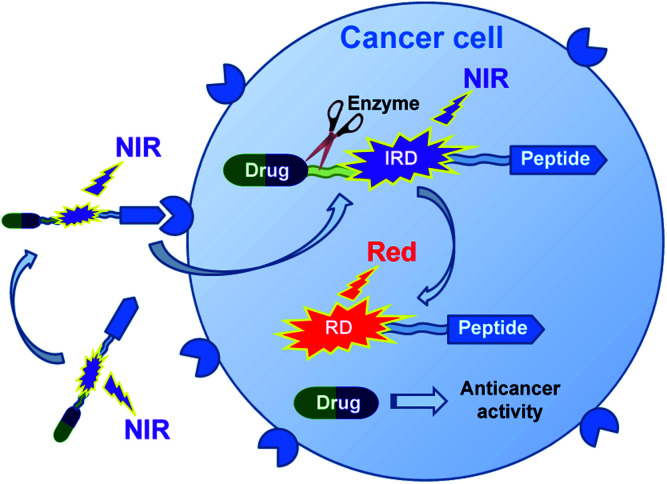
In this research, we report on design of a theranostic system that first combines a cancer-targeting peptide with a new long-wavelength dual fluorescent (switchable) dye in order to provide ratiometric monitoring of anticancer drug delivery. This model system comprises the anticancer drug chlorambucil (CLB) serving as a DNA alkylator,12 peptide carrier octreotide amide (OctA) which specifically binds to SSTR-2 and SSTR-5 somatostatin receptors overexpressed in many human tumor cells,13 and the switchable cyanine dye IRD bound to the drug by means of a hydrolytically cleavable (biodegradable) ester linker (Fig. 1). The developed system was evaluated in homogenous solutions and in human pancreatic cancer (PANC-1) cell line overexpressing SSTR-2 and STTR-5.14
Fig. 1. Functioning principle of the proposed TDD system comprising anticancer drug CLB, targeting peptide OctA and a switchable fluorescent dye IRD, which enables ratiometric measurements.
2. Experimental
2.1. General information
All protected amino acids, resin and coupling reagents were purchased from Tzamal d-Chem Laboratories, Ltd. All other chemicals were supplied by Alfa Aesar Israel or Sigma-Aldrich. Octreotide was purchased from Glentham Life Sciences. Solvents were purchased from Bio-Lab Israel and used as is. Cell culture medium (CM, 500 mL) contained a RPMI-1640 standard cell culture medium from Sigma-Aldrich (435 mL), 50 mL fetal bovine serum (FBS) containing acetylcholinesterase, 5 mL penicillin (10 000 U mL−1), 5 mL streptomycin (10 mg mL−1), 5 mL of 200 mM glutamine, and 5.3 mg l−1 phenol red indicator. Chemical reactions were monitored by TLC (Silica gel 60 F-254, Merck). All reagents and solvents were used as received without further purification.
2.2. Experimental procedures
NMR: 1H NMR and 13C NMR spectra were measured at 300 K on a Bruker Avance III HD (1H 400 MHz and 13C 100 MHz) spectrometer and a BBO probe equipped with a Z gradient coil. The signal of the remaining non-deuterated solvent was used as an internal standard reference of the chemical shifts (1H δ = 3.31 ppm and 13C δ = 49.0 ppm). The samples were dissolved in CDCl3 or MeOD according to their solubility.
LC/MS analyses were performed using an Agilent Technologies 1260 Infinity (LC) 6120 quadruple (MS), column Agilent SB-C18, 1.8 mm, 2.1 × 50 mm, column temperature 50 °C, eluent water–acetonitrile (ACN) + 0.1% formic acid.
HPLC purifications were carried out on an ECOM preparative system, with dual UV detection at 230 nm and 254 nm. A Phenomenex Gemini® 10 μm RP18 110 Å, LC 250 × 21.2 mm column was used. The column was kept at ambient temperature. Eluent A (0.1% TFA in water) and B (0.1% TFA in ACN) were used. A typical elution was a gradient from 100% A to 100% B over 35 min at a flow rate of 25 mL min−1.
HRMS was measured in the ESI positive mode using an Agilent 6550 iFunel Q-TOF LC/MS.
Cell culture: PANC-1 cell line was cultured in an RPMI-1640 medium supplemented with 2 mM glutamine, 10% fetal bovine serum (contained acetylcholinesterase) and with penicillin streptomycin (100 IU mL−1 of each). The cell culture was grown at a 37 °C incubator in an environment containing 6% CO2 to final concentration ∼1 × 10⁴ cell per mL.
2.3. Absorption and fluorescence measurements
Absorption spectra were recorded on a Jasco V-730 UV-Vis spectrophotometer and the fluorescence spectra were measured on Edinburgh Instruments FS5 spectrofluorometer. The absorption and fluorescence spectra (Fig. S1†) and the quantum yields (ΦF) were measured at 25 °C in 1 cm quartz cells at ∼0.5 μM dye concentrations in 10 mM phosphate buffer pH 7.5 (PB) and RPMI 1640 cell medium pH 7.5 (CM). Excitation wavelengths were 532 nm and 710 nm. The recorded fluorescence spectra were corrected using the wavelength-dependent instrument sensitivity coefficients. Absorption and emission maxima were measured with accuracy of ±0.3 nm and ±0.5 nm, respectively, and rounded. For the determination of the quantum yields, the integrated relative intensities were measured versusICG in methanol as the reference (ΦF = 0.044)15 and Cy3™ in PBS (ΦF = 0.04).16 The absorbances of the samples and the references at the excitation wavelength were 0.04–0.06 measured in a 1 cm cell. The absolute quantum yields were calculated according to eqn (1).17
| ΦF = Φst × (F/Fst) × (Ast/A) (n2/n2st), | 1 |
where Φs is the quantum yield of the reference, Fs and F are the integrated emission intensities of the reference and the dye under examination, Ast and A are the absorbances at the excitation wavelength of the reference and the dye under examination and nst and n are the refractive indexes of the solvents used for the reference and the dye under examination. The quantum yield of each sample was independently measured three times and the average value was taken. The reproducibility was within 5%.
2.4. Fluorescence measurements of the cleavage rates for IRD-CLB and 5-CLB
A stock solution of IRD-CLB and 5-CLB in DMSO was added to 10 mM PB pH 7.5 at 25 °C and cell medium pH 7.5. The final concentration of DMSO was 2.5%. The absorbances of the resulted solutions at the maximum were 0.10 ± 0.02, when measured in a 1 cm standard quartz cell. The solutions were incubated at 37 °C during 24 h. The fluorescence spectra were measured over time (Fig. S1†) and the corresponding profiles were obtained as function of “intensity at maximum vs. time”. First-order exponential decay functions were fitted to the obtained profiles and the cleavage half-lives (τ1/2) were calculated.
2.5. Fluorescence imaging
The images were acquired by Photometrics CoolSNAP HQ2 camera mounted on an Olympus iX81 fluorescent microscope. For the red channel a cube comprising a ET560/40x bandpass excitation filter, ET630/75m bandpass emission filter and T585lpxr dichroic filter was used. For the NIR channel a cube comprising a ET740/40x bandpass excitation filter, ET780lp long pass emission filter and T770lpxr dichroic filter was used. To monitor drug release, PANC-1 cell line was grown in six-well culture plates, twice washed with PBS (pH 7.4) and then incubated 10 min with 5-CLB 10 μM solution in PBS containing 2.5% DMSO. After incubation, the samples were twice washed thoroughly with PBS pH 7.4 to remove excess conjugate and the fluorescence changes immediately measured by using fluorescent microscope. All images were taken over time at 37 °C under 6% CO2 atmosphere. Concentration of cells in the imaging experiments was ∼1 × 10⁴ cell per mL. The images were taken in the red and NIR channels. About 10–12 cells were in the entire field of view for each image. The fluorescence intensities of cells were quantified as the integrated density of the full image using ImageJ software.18 The imaging experiments were carried out in triplicate.
2.6. Cytotoxicity test
The cytotoxicity of the peptide-drug conjugates was determined by measuring the mitochondrial enzyme activity, using a commercial XTT assay kit. PANC-1 cell line was cultured in RPMI medium containing 10% heat-inactivated Fetal Bovine Serum (FBS), 2 mM glutamine, 1% penicillin and streptomycin; and cultured at 37 °C in a humidified incubator with 6% CO2. Cells were initiated in microplate wells at a concentration of 2–4 × 10⁴ and allowed to adhere for 24 h. Then the cells were washed with PBS pH 7.4 buffer twice, then PBS buffer containing 2.5% DMSO and different concentrations of the 5-CLB, CLB and OctA (1.6, 3.1, 6.2, 12.5, and 25 μM) were added and the cells were incubated for an additional 10 min. The solvent was removed; all the wells were washed with PBS and cultured for 24 h in fresh medium without drug substances. The cells were washed again, a fresh medium containing the XTT reagent was added, and the cells were incubated for 2 h. The absorbance in the wells were measured with a TECAN Infinite M200 ELISA reader at both 480 nm and 680 nm; the latter being the background absorbance. The difference between these measurements was used for calculating the percent of Growth Inhibition (GI) in test wells compared to the cells that were exposed only to the medium with 2.5% DMSO. All the tests were done in triplicate (Fig. S4†).
2.7. Competitive SSTRs' mediated delivery
In a series of experiments, PANC-1 cell line was incubated for 10 min in PBS buffer contained 2.5% DMSO with a constant concentration of 5-CLB (10 μM) and variable concentration of octreotide (1×, 3× and 10× molar excess) and washed out. Then the fluorescence images were taken in the NIR channel in 60 min after the incubation and a plot of the total fluorescence intensity vs. [Oct]/[5-CLB] ratio was obtained (Fig. S5†).
2.8. Synthesis and characterization
The syntheses of 2-chloro-3-(hydroxymethylene)cyclohex-1-ene-1-carbaldehyde (1), quaternized indolenines 2 and 3 were previously reported.19
2.8.1. 2-(2-(3-(2-(1-(5-Carboxypentyl)-3,3-dimethylindolin-2-ylidene)ethylidene)-2-chlorocyclohex-1-en-1-yl)vinyl)-1,3,3-trimethyl-3H-indol-1-ium bromide (4)
Quaternized indolenine 2 (0.9 g, 3.2 mmol, 1.0 equiv.) was dissolved at 80 °C in 50 mL of a mixture of toluene and dioxane (1 : 1). Compound 1 (0.55 g, 3.2 mmol, 1 equiv.) was added to the obtained solution and stirred at 80 °C for 4 h. The solution was cooled to room temperature and filtered out; the product was precipitated from solution with 100 mL of hexane. The precipitate was dissolved in 50 mL of toluene and dioxane (1 : 1). Then a mixture of quaternized indolenine 3 (1.1 g, 3.2 mmol, 1.0 equiv.) in 10 mL NMP was added to the reaction mixture and heated at 80 °C for 4 h. The resulted mixture was cooled to room temperature and the product was precipitated with 100 mL of diethyl ether to give cyanine 4 (1.2 g, 56% yield) as a green solid. The product 4 was used in the next step without purification. For NMR and MS analyses, 50 mg of cyanine 4 was purified by column flash chromatography (silica gel, DCM : methanol, 90 : 10), yielding purified product 4 (17 mg). 1H NMR (400 MHz, CDCl3) δ = 8.36 (d, J = 13.7, 1H), 8.32 (d, J = 14.1, 1H), 7.45–7.32 (m, 4H), 7.25–7.14 (m, 4H), 6.22 (d, J = 14.2, 1H), 6.18 (d, J = 14.0, 1H), 4.15 (t, J = 7.6, 2H), 3.71 (s, 3H), 2.72 (t, J = 6.2, 4H), 2.53 (t, J = 7.2, 2H), 1.98 (p, J = 6.4, 2H), 1.87 (p, J = 7.5, 2H), 1.78 (p, J = 7.5, 2H), 1.71 (s, 12H), 1.62–1.50 (m, 2H). 13C NMR (101 MHz, CDCl3) δ = 176.12, 172.75, 172.72, 150.89, 144.92, 144.31, 142.97, 142.19, 141.20, 140.98, 129.10, 128.94, 127.98, 127.96, 125.62, 125.32, 122.38, 122.24, 111.20, 110.79, 101.68, 101.42, 49.54, 49.26, 44.78, 34.57, 32.13, 28.27, 28.22, 27.09, 26.77, 26.72, 26.37, 24.64, 20.82. ESI-HRMS m/z (M+) calcd (M+) 583.3086, found 583.3099 (M+) (Fig. S2–S5†).
2.8.2. 6-(3,3-Dimethyl-2-(2-(2-oxo-3-(2-(1,3,3-trimethylindolin-2-ylidene)ethylidene)cyclohexylidene)ethylidene)indolin-1-yl)hexanoic acid (RD)
Compound 4 (1 g, 1.5 mmol, 1 equiv.) was dissolved in 50 mL of dry DMF. Then anhydrous sodium acetate (0.37 g, 4.5 mmol, 3 equiv.) was added and the mixture was heated at 90 °C for 2 h. After reaction completed (LC/MS monitoring), the solvent was evaporated under reduced pressure, dissolved in DCM and extracted with water, organic phase was dried with anhydrous sodium sulfate and the crude product was purified using column flash chromatography (silica gel, DCM : dioxane, 85 : 15). The product RD was obtained after evaporation as a red-pink oil (0.27 g, 32% yield). 1H NMR (400 MHz, MeOD) δ = 8.19 (d, J = 13.0 Hz, 2H), 7.26 (d, J = 7.5 Hz, 2H), 7.21 (t, J = 7.7 Hz, 2H), 6.94 (t, J = 7.4 Hz, 2H), 6.87 (d, J = 7.9 Hz, 2H), 5.59 (d, J = 13.3 Hz, 1H), 5.53 (d, J = 13.2 Hz, 1H), 3.85–3.75 (m, 2H), 3.28 (s, 3H), 2.61 (t, J = 5.8 Hz, 4H), 2.31 (t, J = 7.2 Hz, 2H), 1.91–1.81 (m, 2H), 1.80–1.67 (m, 4H), 1.65 (s, 12H), 1.47 (m, 2H). ESI-MS m/z (M+) calcd 564.3, found 565.0 (M + H+) (Fig. S6–S8†).
2.8.3. 2-(2-(2-((4-(4-(bis(2-chloroethyl)amino)phenyl)butanoyl)oxy)-3-(2-(1-(5-carboxypentyl)-3,3-dimethylindolin-2-ylidene)ethylidene)cyclohex-1-en-1-yl)vinyl)-1,3,3-trimethyl-3H-indol-1-ium (IRD-CLB)
Dye RD (40 mg, 0.07 mmol, 1 equiv.) was dissolved in 3 mL of DCE. Then a mixture of CLB (43 mg, 0.14 mmol, 2 equiv.), BTC (25 mg, 0.1 mmol, 0.7 equiv.) and collidine (55 μl, 0.42 mmol, 6 equiv.) in 3 mL DCE was added. The reaction mixture was stirred for 2 h, evaporated and purified by RP chromatography; the fractions were lyophilized to give purified IRD-CLB (23 mg, 67% yield). 1H NMR (400 MHz, MeOD) δ = 7.68 (d, J = 14.2, 1H), 7.64 (d, J = 13.7, 1H), 7.44–7.32 (m, 4H), 7.30–7.19 (m, 4H), 7.15 (d, J = 8.8, 2H), 6.76 (d, J = 9.0, 2H), 6.14 (d, J = 14.6, 1H), 6.11 (d, J = 14.1, 1H), 4.08 (t, J = 7.4, 2H), 3.74 (t, J = 7.4, 4H), 3.63 (t, J = 6.6, 4H), 3.59 (s, 3H), 2.82 (t, J = 8.0, 2H), 2.71 (t, J = 7.2, 2H), 2.63 (t, J = 6.3, 4H), 2.26 (t, J = 7.2, 1H), 2.09 (p, J = 8.3, 2H), 1.91 (p, J = 5.9, 2H), 1.78 (p, J = 7.6, 2H), 1.64 (p, J = 7.3, 2H), 1.50 (s, 6H), 1.49 (s, 6H), 1.47–1.37 (m, 2H). 13C NMR (101 MHz, MeOD) δ = 174.26, 173.11, 172.56, 161.13, 146.47, 144.26, 143.62, 142.38, 141.73, 141.20, 131.10, 131.01, 129.92, 126.46, 126.27, 123.40, 123.28, 123.25, 123.12, 113.68, 112.12, 112.08, 101.80, 101.31, 54.50, 50.29, 50.24, 49.85, 44.91, 41.78, 34.97, 34.77, 34.38, 31.71, 28.68, 28.51, 28.35, 28.00, 27.39, 25.71, 25.35, 25.29, 22.08. ESI-HRMS m/z (M+) calcd 850.4112, found 850.4126 (M+) (Fig. S9–S12†).
2.8.4. Solid phase synthesis of octreotide amide-GABA-NH2 (OctA-GABA-NH2)
The synthesis of the cyclic peptide octreotide was done according to the previously described procedure.20 Rink amide resin (0.65 mmol g−1) was placed in a sintered glass bottom and swelled in NMP by agitation overnight. The Fmoc group was removed from the resin by treatment with 20% piperidine/NMP (2 × 15 min). The completion of the removing of Fmoc was monitored by ninhydrin test (blue). After washing the resin with NMP (7 × 2 min), a mixture of Fmoc–Thr(Trt)-OH (2 equiv.), DIPEA (8 equiv.) and PyBOP (2 equiv.) in NMP was added. The reaction was carried out for 1.5 h at room temperature. The peptidyl resin was washed with NMP (5 × 2 min). The completion of the reaction was monitored by ninhydrin test (yellow). Then a linear SPPS was applied using standard Fmoc procedures introducing the amino acids in the following order: Fmoc–Cys(Acm)-OH, Fmoc–Thr(Trt)-OH, Fmoc–Lys(Boc)-OH, Fmoc–DTrp(Boc)-OH, Fmoc–Phe-OH, Fmoc–Cys(Acm)-OH, Fmoc–DPhe-OH, Fmoc–GABA-OH. All the couplings were performed in NMP with 2-fold excess of amino acid, DIPEA (8 equiv.) and PyBop (2 equiv.) for activation. Each coupling cycle was conducted for 1.5 h. The completion of each coupling reaction and Fmoc removal were monitored by the ninhydrin test. After the coupling of the last amino acid, the sequence was cyclized by I2 (10 eq.) in DMF : H2O (4 : 1) for 2 h, washed with DMF : H2O (4 : 1) 5 × 2 min, DCM 5 × 2 min, chloroform 5 × 2 min, 2% ascorbic acid in DMF, and DMF 5 × 2 min. Then N-terminus Fmoc was deprotected using regular procedure yielding the cyclic peptidyl residue (OctA-GABA-NH2) on Rink amide resin ready for next conjugation.
2.8.5. Synthesis of OctA–GABA–IRD–CLB (5-CLB)
A mixture of RD (40 mg, 72 μmol, 1.2 equiv.), HATU (35 mg, 90 μmol, 1.5 equiv.) and DIPEA (50 μl, 300 μmol, 5 equiv.) in NMP was stirred for pre-activation for 2 min and consequently added to the OctA-GABA-NH2 immobilized on solid phase (synthesized from 100 mg, loading 0.6 mmol g−1). The coupling reaction was carried out for 1.5 h at room temperature. After coupling (ninhydrin test – yellow), the peptidyl resin was washed with 4 mL NMP (5 × 2 min) and 4 mL DCE (5 × 2 min). Thereafter, CLB (37 mg, 120 μmol, 2 equiv.) was activated by treatment with BTC (26 mg, 90 μmol, 1.5 equiv.) and collidine (45 μl, 300 μmol, 6 equiv.) in 4 mL DCE for 1 min and added to the peptidyl resin. The reaction was carried out for 2 h. After coupling, the peptidyl resin was washed with 4 mL DCE (5 × 2 min). Cleavage procedure for 5-CLB on Rink amide resin: 5-CLB on the peptidyl-resin was treated with the cold TFA without scavengers for 1.5 h. Noteworthy, addition of the scavengers like TIS or EDT lead to the decomposition of the product. The solvent was removed under a gentle flow of N2, cold Et2O added and the crude product was precipitated from Et2O. The obtained crude 5-CLB was purified by preparative RP HPLC, the fractions were lyophilized yielding purified 5-CLB (12.6 mg, 10.8% total yield calculated by peptide loading 0.6 mmol g−1, HPLC purity > 97%). ESI-HRMS m/z (M+) calcd 1949.8925, found 650.9694 (M++2H+)/3, 975.9507 (M++H+)/2 (Fig. S13 and S14†).
3. Results and discussion
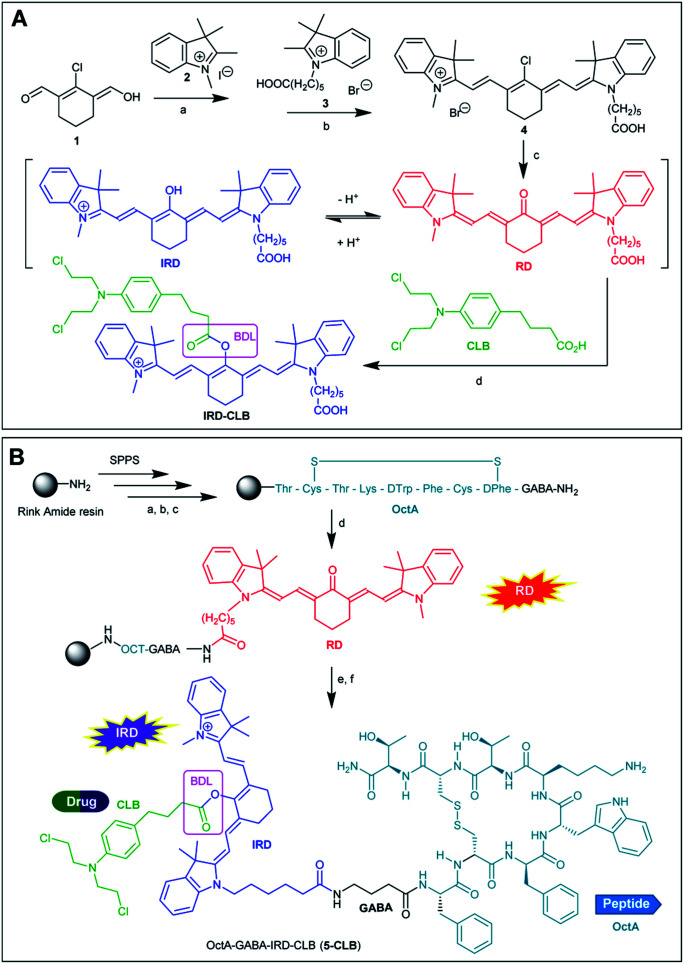
As compared to many other sensing applications, the dyes used in theranostic conjugates must have a reactive functionality for binding to the targeting carrier. We synthesized a new asymmetric, switchable NIR dye IRD that was modified with a single carboxylic functionality to facilitate coupling with the carrier. The dye was isolated in its deprotonated, red emitting “keto” form RD (Scheme 1A). The synthesis was performed starting from carbaldehyde 1 that was subsequently reacted with quaternized indolenines 2 and 3 to form the cyanine dye 4 (one-pot reaction), which was then converted to the aimed RD dye.
Scheme 1. (A) Synthesis of RD and IRD-CLB. BDL is a biodegradable ester linker. Reaction conditions: a—toluene/dioxane (1 : 1, v/v), reflux 4 h; b—toluene/dioxane/NMP (5 : 5 : 2, v/v/v), reflux 4 h; c—NaOAc in DMF, 90 °C; 2 h; d—BTC, collidine, DCE, 2 h, RT. (B) Synthesis of 5-CLB. Reaction conditions: a—Fmoc removal: 20% piperidine in NMP; b—coupling: PyBOP (2 equiv.), AA (2 equiv.), DIPEA (8 equiv.), 1.5 h; c—cyclization step: I2 (10 equiv.) in DMF—H2O (4 : 1, v/v), 2 h; d—HATU, DIPEA, RD, NMP; e—BTC, collidine, DCE; CLB; f — TFA.
Then, starting from RD, we synthesized the TDD conjugate OctA–GABA–IRD–CLB (5-CLB) comprising the IRD dye bound to the anticancer drug CLB by means of a biodegradable ester linker (BDL) at one side, and to the targeting peptide OctAvia a non-cleavable GABA linker at the other side (Scheme 1B). GABA was introduced to avoid steric hindrance of the receptor recognition pharmacophore of the peptide carrier.21
The ester bond, which is known to be rapidly hydrolyzed by esterases in the tumor,22 was employed as a biodegradable moiety. This linker is sufficiently stable in various peptide conjugated anticancer agents such as cilengitide–CLB, angiopep-2–paxlitaxel and GnRH-doxorubicin, upon target delivery of these agents via the bloodstream to cancer tissue.3,23
In order to investigate the impact of the OctA peptide on the spectral properties and drug release kinetics of the developed 5-CLB system, we also synthesized an IRD-CLB platform (Scheme 1A). The latter was obtained by the condensation of RD with CLB pre-activated by treatment with triphosgene and collidine. The 5-CLB conjugate was synthesized on Rink amide resin (RAM) by solid phase peptide synthesis (SPPS). The N-terminus of the resin bound OctA-GABA peptidyl residue was coupled with pre-activated RD using HATU and DIPEA (Scheme 1B) followed by reaction with pre-activated CLB (BTC, collidine). The crude 5-CLB was obtained by the TFA promoted cleavage of the aimed TDD conjugate from the solid support.
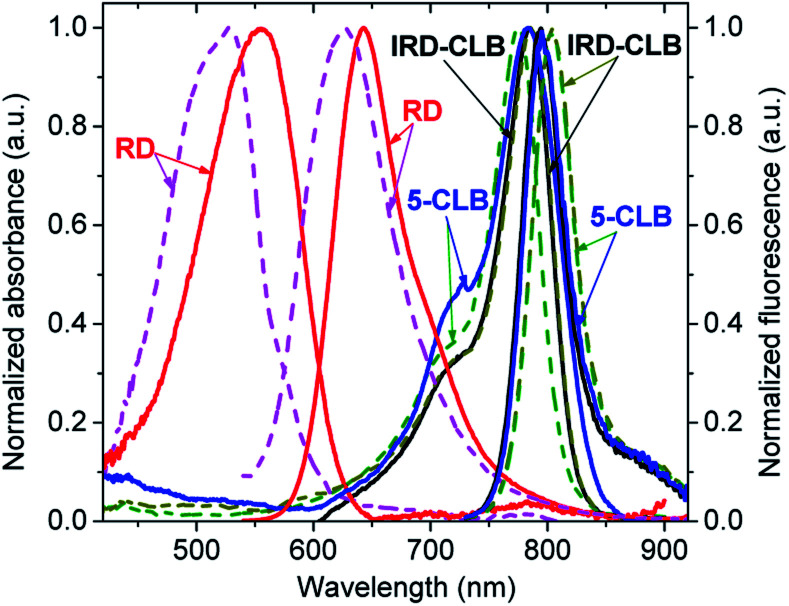
The spectral properties of the RD dye and its conjugates IRD-CLB and 5-CLB were measured at the 0.6 μM concentrations in 10 mM phosphate buffer pH 7.5 (PB) and acetylcholinesterase containing cell culture medium pH 7.5 (CM). The obtained absorption and emission spectra are shown in Fig. 2 while the spectral characteristics are presented in Table 1.
Fig. 2. Normalized absorption and emission spectra of RD, IRD-CLB, and 5-CLB measured at c = 0.6 μM in PB (solid line) and CM (dashed line). The excitation wavelength was 532 nm for RD and 720 nm for IRD-CLB and 5-CLB.
Absorption (λmaxAb) and emission (λmaxFl) maxima, extinction coefficients (ε) and fluorescence quantum yields (ΦF) of RD dye and IRD-CLB and 5-CLB conjugates measured at 25 °C in 10 mM phosphate buffer pH 7.5 (PB) and cell medium pH 7.5 (CM).
| Dye/conjugate | PB : ACN (4 : 1, v/v) | CM : ACN (4 : 1, v/v) | |||||
|---|---|---|---|---|---|---|---|
| λ max Ab (nm) | ε (M−1 × cm−1) | λ max Fl (nm) | Φ F (%) | λ max Ab (nm) | λ max Fl (nm) | Φ F (%) | |
| RD | 555 | 57 000 | 643 | 9.9 ± 0.8 | 526 | 626 | 2.6 ± 0.1 |
| IRD-CLB | 775 | 160 000 | 795 | 2.9 ± 0.3 | 785 | 805 | 6.3 ± 0.5 |
| 5-CLB | 783 | 160 000 | 796 | 1.5 ± 0.2 | 787 | 805 | 5.9 ± 0.4 |
RD dye in PB has λmaxAbs = 555 nm (ε∼57 000 M−1 cm−1); λmaxAbs = 643 nm and the fluorescence quantum yield (ΦF) 9.9%. In CM, which due to the presence of proteins is a more hydrophobic and less polar media, the spectral bands are blue-shifted by 29 nm and 17 nm, respectively, and the ΦF is about 4 fold decreased (2.6%). Conjugation of RD with CLB to form IRD-CLB causes a pronounced red-shift of the absorption and emission bands to the NIR region (by 220 nm and 152 nm, respectively, in PB and even more, 259 nm and 178 nm in CM) and a 2.8 fold increase in the ε (160 000 M−1 cm−1). The ΦF after conjugation decreases by factor of 3.4 (IRD-CLB) and 6.6 (5-CLB) in PB but increases by factor of 2.4 in CM. Binding of IRD-CLB to OctA-GABA to form conjugate 5-CLB causes a minor effect on the spectral bands.
As both CLB-bound and unbound forms of the dye (RD and IRD) are fluorescent and the emissions of these forms lie in different spectral regions, red and NIR respectively, this dye is suitable for the ratiometric fluorescence measurements. In addition, the long-wavelength emission of RD and IRD reduces interference from auto-absorption and auto-fluorescence of biological samples and is therefore beneficial for sensing applications in particular in vivo.
In the proposed mode of action, the biodegradable ester linker (BDL) in IRD-CLB and 5-CLB can be hydrolyzed to release free CLB molecules and, accordingly, IRD turns into RD, which is accompanied by a considerable change in the spectral properties. The time-dependent emission spectra of IRD-CLB and 5-CLB were recorded in PB and CM (Fig. S1A–S1D, ESI†) using the excitation wavelengths 720 nm and 532 nm. The first wavelength enabled monitoring of the decrease in the concentration of these conjugates, while the second one enabled monitoring of the increase in the concentration of the resulted red fluorescent products, RD and OctA-RD, correspondingly, which should correlate with concentration of the released CLB molecules. Only the NIR fluorescence of IRD-CLB and 5-CLB was detected when excited at 720 nm and only the red fluorescence of RD and OctA-RD was detected when excited at 532 nm. No spillover between these two emission spectra was observed: IRD-CLB and 5-CLB exhibited no detectable emission when excited at 532 nm, and therefore no compensation was required to analyze the red and NIR signals.
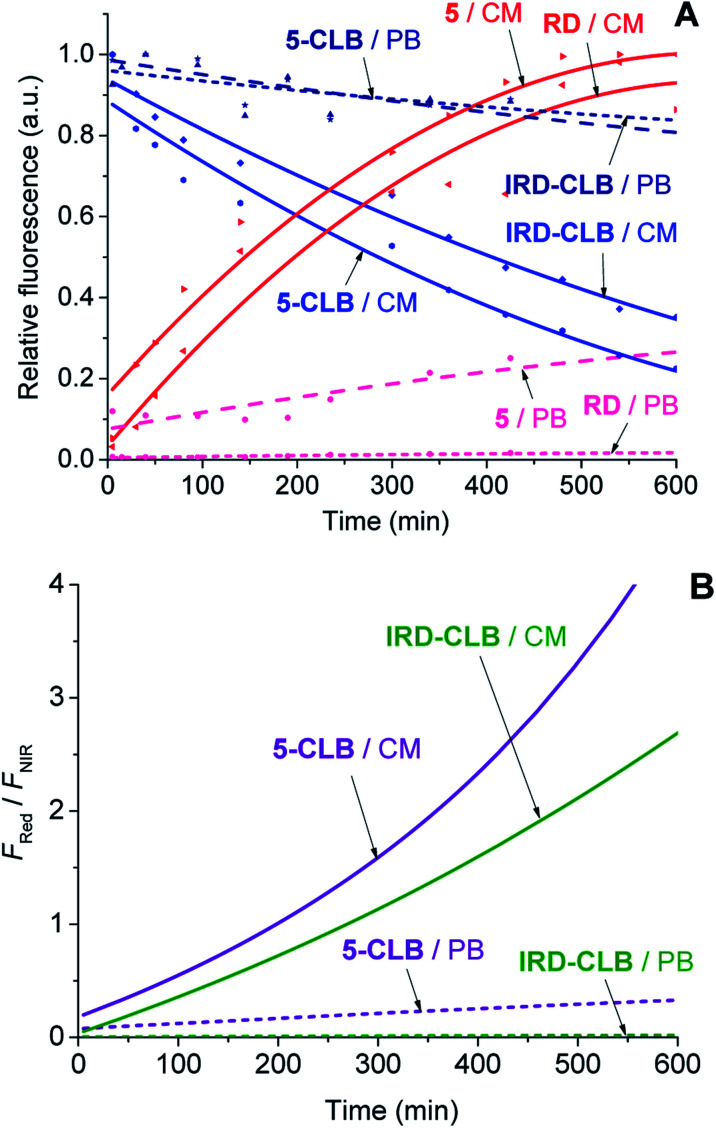
Upon the hydrolytic cleavage, the NIR emission band (FNIR) related to IRD decreases and the red emission band (FRed) of RD increases (Fig. S1A–S1D, ESI†). Based on the time-dependent emission spectra, the drug cleavage profiles for IRD-CLB and 5-CLB were obtained (Fig. 3A) and the drug release rates were quantified by the half-lives (τ1/2). First-order exponential decay functions were fitted to the profiles (Fig. 3A) and the τ1/2 were calculated. The half-life of the CLB cleavage for IRD-CLB is about τ1/2–60 h in PB and τ1/2–6.7 h in CM, while for 5-CLBτ1/2–43.5 h and 4.4 h, respectively. This indicates that the conjugation of OctA with IRD-CLB to form 5-CLB slightly accelerates the CLB release rate by ∼1.4 fold in PB and ∼1.5 fold in CM. The cleavage rate in CM is about 9–10 fold faster compared to that in PB.
Fig. 3. The CLB cleavage profiles (A) and the ratiometric curves (FRed/FNIR) (B) for IRD-CLB and 5-CLB (c = 0.6 μM) measured in PB (dashed line) and CM (solid line) at 25 °C after incubation at 37 °C. The fluorescence intensities for 5-CLB and IRD-CLB were measured using the excitation wavelength (λex) 720 nm while for 5 and RDλex was 532 nm. The experiments were carried out during 24 h but only the initial 10 h time scale is shown.
Then the ratiometric curves (the changes in the FRed/FNIR ratio over time) measured for IRD-CLB and 5-CLB conjugates in PB and CM were obtained (Fig. 3B). Both the intensity based and ratiometric curves can be correlated with the concentration of the released CLB drug molecules and the drug release degree by known methods.24 However, in contrast to the intensity based profiles (Fig. 3A), the ratiometric measurements are advantageous because they are independent of the initial TDD conjugate concentration, the sample and instrumental setup.7
According to the LC/MS, the ester bond cleavage resulting in the release of free CLB molecules occurs much faster compared to the hydrolysis of chlorine atoms (Fig. S2 and S3†).
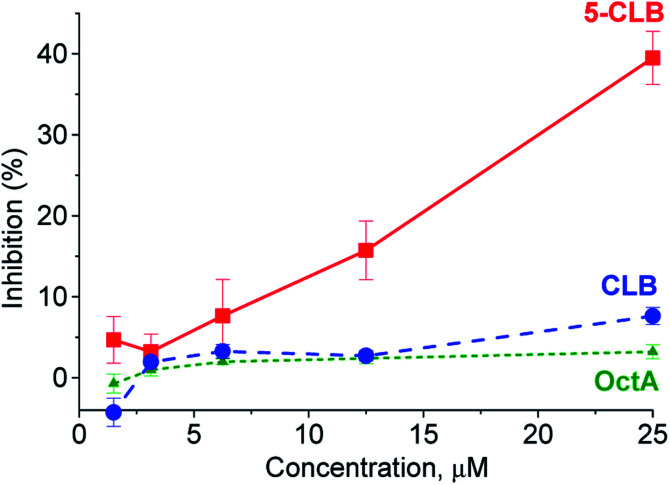
In the next step, application of the 5-CLB conjugate was studied in the TDD monitoring in a PANC-1 cell line. First, enhanced cytotoxicity of 5-CLBversus free CLB to PANC-1 was verified by the XTT cell survival assay.25 In this assay, cytotoxicity of 5-CLB to PANC-1 was compared to that of CLB and OctA added separately. The compounds taken at equal concentrations up to 25 μM were incubated with cells at 37 °C for 10 min, washed out, and then the growth inhibition compared to naïve cells was assessed after 24 h. The 5-CLB was found to cause a noticeably higher growth inhibition compared to CLB or OctA (Fig. 4).
Fig. 4. Inhibition of the PANC-1 growth by 5-CLB, CLB and OctA. At the end of 20 min incubation period and subsequent washing, cell growth was assessed using the XTT assay at 24 h. The inhibition for each concentration point is represented by the mean ± standard error for each independent experiment conducted in triplicate.
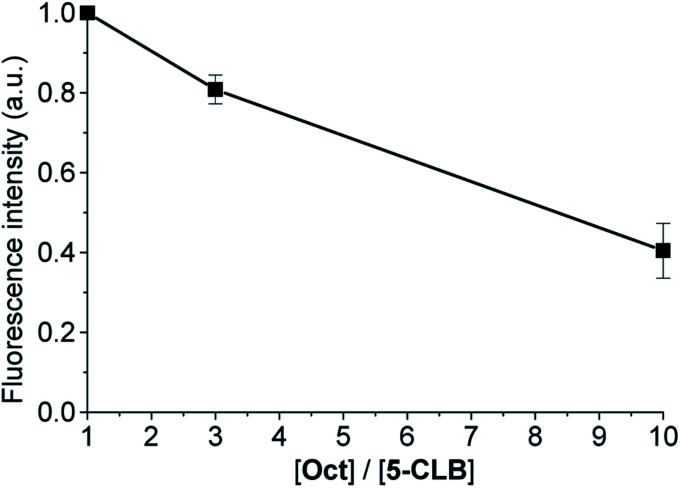
The SSTRs' mediated delivery of 5-CLB was assessed by testing whether free OctA can competitively inhibit delivery of 5-CLB to PANC-1. These cells were incubated for 10 min at 37 °C in PB with 5-CLB (10 μM) and increasing concentrations of OctA (×1, ×3 and ×10 molar excess) and both compounds were washed out. Fluorescence images were taken in the NIR channel (IRD emission) at 60 min after the incubation and fluorescence intensities remaining in the cells were measured.
Fluorescence of 5-CLB that accumulated in the cells decreased proportionally to the OctA concentration, indicating that these two compounds compete for the same binding sites, i.e. SSTRs (Fig. 5).
Fig. 5. Decrease of the normalized fluorescence intensity of PANC-1 after incubation with 5-CLB (10 μM) and Oct at different [Oct]/[5-CLB] ratios at 60 min after incubation. The fluorescence intensity for each concentration point was measured in the NIR channel and represented by the mean ± standard error for three independent experiments.
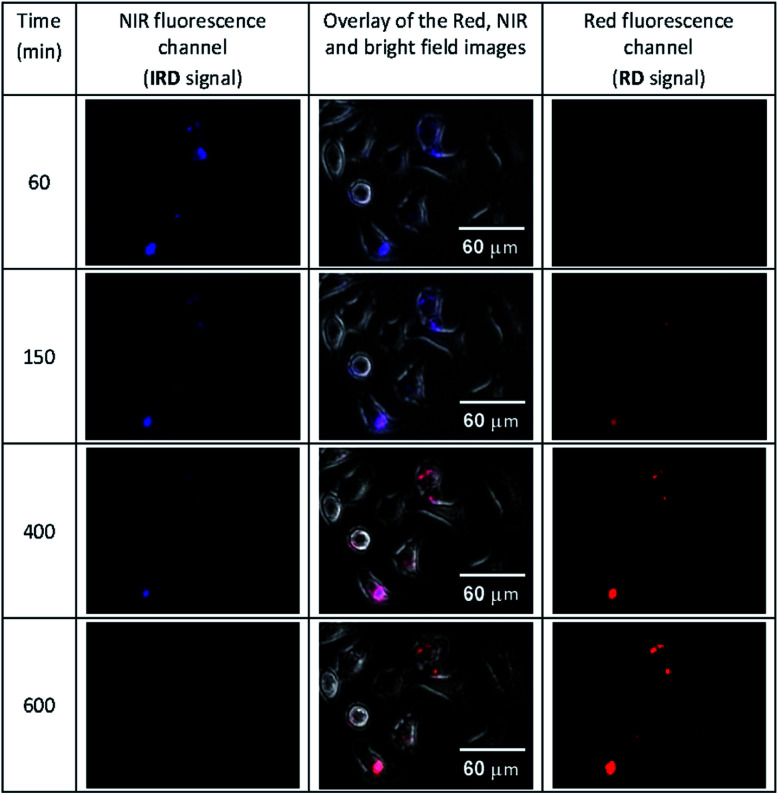
Then we conducted the ratiometric fluorescence imaging monitoring of CLB release from the 5-CLB delivered into the PANC-1. The cells were incubated with 5-CLB for 10 min to allow accumulation of the conjugate. Then fluorescence images were taken over time in two channels. The NIR channel enabled measurements of the signal from 5-CLB and the red channel detected the signal from the RD formed upon the CLB release. The representative time-dependent fluorescence images obtained in the red and NIR channels and an overlay of these images with bright field images are shown in Fig. 6 (see also Movie S1, ESI†). In these illustrations, the NIR channel is represented by blue pseudo-color, while the red channel is shown with red color.
Fig. 6. The time-dependent images of PANC-1 cell line stained with 5-CLB that were obtained in the fluorescence NIR and red channels and overlaid with transmitted light images. The NIR signal is represented with blue pseudo-color. See also Movie S1 (ESI†).
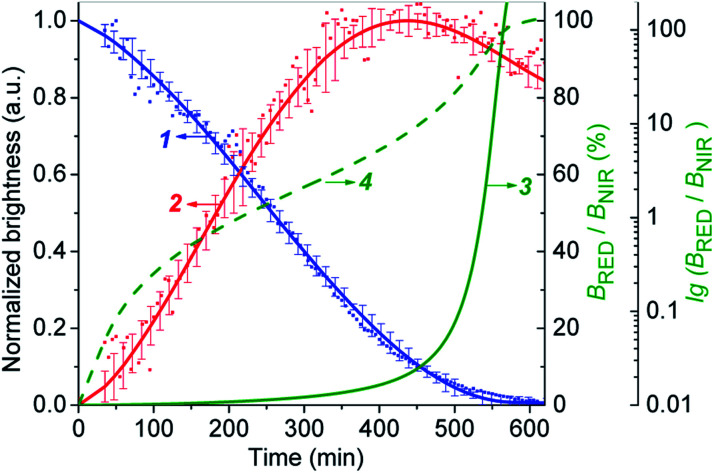
The Fig. 6 shows that the fluorescence intensity of IRD (in the NIR channel) decreases with time while the RD signal (in the red channel) increases. Simultaneously, in the overlay images, the NIR fluorescence turns to red, signaling the drug release. The time-dependent changes in cell brightness in the NIR and red channels (BNIR and BRed) are shown in Fig. 7 (curves 1 and 2). Using these curves, the half-life of the CLB release in the PANC-1 cell line was estimated to be about 200 min. Ratiometric curves obtained from the two signals (BRed/BNIR) are presented in Fig. 7 (curve 3). By taking the ratio between the red and NIR intensities over time, the concentration of the released CLB drug can be directly correlated to these kinetic curves.7
Fig. 7. The CLB cleavage profiles obtained by fluorescence imaging of PANC-1 cell line stained with 5-CLB. (1) – Decrease of the BNIR. (2) – Increase of the BRed. (3) – Ratiometric curve (BRed/BNIR). (4) – Ratiometric curve in logarithmic scale [lg(BRed/BNIR)]. Curves 1 and 2 represent the mean ± standard error for three independent experiments.
On the base of the drug cleavage profile (Fig. 7) we calculated the change of the CLB release degree over time (Drug degree = cCLB/c5-CLB = 1 − BNIR) (Fig. S17,† curve 1) and the relative concentration of free CLB molecules estimated as cCLB = [BRed/(BRed + BNIR)]×100% (Fig. S17,† curve 4). The absolute CLB concentrations can be found after calibration by using standard solutions with known drug and/or dye concentration.
4. Conclusions
In summary, we designed the new theranostic system 5-CLB comprising the anticancer drug chlorambucil (CLB), SSTR specific peptide OctA and a long-wavelength dual fluorescent dye IRD. The synthetic approach to this system was elaborated. The spectral properties, drug cleavage kinetics and cytotoxicity of 5-CLB were investigated, and the effect of the conjugation of OctA peptide on these properties was studied. 5-CLB exhibits absorption and emission in the NIR spectral region while upon the drug release the fluorescence turns red. OctA peptide has a minor effect on the spectral properties.
It was shown by XTT cell survival assay that 5-CLB has a greatly increased cytotoxicity in a human pancreatic cancer (PANC-1) cell line compared to free CLB or free OctA. The SSTRs' mediated delivery of the OctA-guided 5-CLB to PANC-1 was confirmed by a fluorescently monitored competitive binding of 5-CLBvs. free OctA.
The hydrolytically mediated CLB release from 5-CLB was monitored using the red and NIR channels by the two techniques: spectrofluorimetry (in phosphate buffer and acetylcholinesterase containing culture medium) and fluorescent microscopy (in the PANC-1 cell line). The corresponding kinetic curves of CLB release were obtained.
Finally, the 5-CLB conjugate was demonstrated to enable real time ratiometric monitoring of targeted delivery of the anticancer drug CLB in the PANC-1 cell line.
To conclude, the model 5-CLB system was utilized in the in vitro imaging study to prove the principle of the ratiometric fluorescence monitoring of peptide-guided anticancer drug delivery, investigation of drug release kinetics and determination of the drug release degree. The proposed approach of combining a long-wavelength dual fluorescent dye with a peptide carrier could be useful for the development of more advanced TDD systems enabling ratiometric fluorescence drug delivery monitoring in vivo.
Conflicts of interest
There are no conflicts of interest to declare.
Supplementary Material
Acknowledgments
This research was supported by the Israel Scientific Foundation (ISF), project 810/18. Leonid Patsenker is thankful to the Center for Absorption in Science of the Ministry of Immigrant Absorption of Israel for the financial support under the KAMEA program. Gary Gellerman is thankful to the Gale Foundation for the generous donation to support this research. The authors are grateful to Prof. Michael Sherman (Ariel University, Israel) for helpful recommendations and discussion on biological experiments.
Electronic supplementary information (ESI) available: Absorption and emission spectra, NMR, MS and HPLC data. See DOI: 10.1039/c9ra06334j
Notes and references
- Chow E. K.-H. Ho D. Sci. Transl. Med. 2013;5:216rv4. doi: 10.1126/scitranslmed.3005872. [DOI] [Google Scholar]; Chen W. H. Luo G. F. Zhang X. Z. Adv. Mater. 2018:1802725. doi: 10.1126/scitranslmed.3005872. [DOI] [Google Scholar]; Mishra N. Pant P. Porwal A. Jaiswal J. Samad M. A. Tiwari S. Am. J. PharmTech Res. 2016;6:1–24. doi: 10.1126/scitranslmed.3005872. [DOI] [Google Scholar]
- Vrettos E. I. Mező G. Tzakos A. G. Beilstein J. Org. Chem. 2018;14:930–954. doi: 10.1039/C9CC00603F. [DOI] [PMC free article] [PubMed] [Google Scholar]; Wang D. Huang H. Zhou M. Lu H. Chen J. Chang Y. T. Gao J. Chai Z. Hu Y. Chem. Commun. 2019;55:4051–4054. doi: 10.1039/C9CC00603F. [DOI] [Google Scholar]; Kennedy P. J. Oliveira C. Granja P. L. Sarmento B. Pharmacol. Ther. 2017;177:129–145. doi: 10.1039/C9CC00603F. [DOI] [PubMed] [Google Scholar]; Sousa F. Castro P. Fonte P. Kennedy P. J. Neves-Petersen M. T. Sarmento B. Expert Opin. Drug Delivery. 2017;14:1163–1176. doi: 10.1039/C9CC00603F. [DOI] [Google Scholar]
- He R. Finan B. Mayer J. P. DiMarchi R. D. Molecules. 2019;24:1855. doi: 10.3390/molecules24101855. [DOI] [Google Scholar]
- Wang J. Masehi-Lano J. J. Chung E. J. Biomater. Sci. 2017;5:1450–1459. doi: 10.1039/C7BM00271H. [DOI] [PMC free article] [PubMed] [Google Scholar]; Gilad Y. Firer M. Gellerman G. Biomedicines. 2016;4:11. doi: 10.1039/C7BM00271H. [DOI] [Google Scholar]
- Lee M. H. Sharma A. Chang M. J. Lee J. Son S. Sessler J. L. Kang C. Kim J. S. Chem. Soc. Rev. 2018;47:28–52. doi: 10.1039/C7CS00557A. [DOI] [PMC free article] [PubMed] [Google Scholar]; Zeng X. Chen Z. Tang L. Yang H. Liu N. Zhou H. Li Y. Wu J. Deng Z. Yu Y. Deng H. Hong X. Xiao Y. Chem. Commun. 2019;55:2541–2544. doi: 10.1039/C7CS00557A. [DOI] [Google Scholar]; Etrych T. Lucas H. Janouskova O. Mäder K. J. Controlled Release. 2016;226:168–181. doi: 10.1039/C7CS00557A. [DOI] [Google Scholar]; Lee M. H. Kim J. Y. Han J. H. Bhuniya S. Sessler J. L. Kang C. Kim J. S. J. Am. Chem. Soc. 2012;134:12668–12674. doi: 10.1039/C7CS00557A. [DOI] [PubMed] [Google Scholar]
- Zhang J. Chai X. He X. P. Kim H. J. Yoon J. Tian H. Chem. Soc. Rev. 2019;48:683–722. doi: 10.1039/C7CS00907K. [DOI] [PubMed] [Google Scholar]; Bazylevich A. Patsenker L. D. Gellerman G. Dyes Pigm. 2017;139:460–472. doi: 10.1039/C7CS00907K. [DOI] [Google Scholar]
- Ash C. Dubec M. Donne K. Bashford T. Lasers Med. Sci. 2017;32:1909–1918. doi: 10.1007/s10103-017-2317-4. [DOI] [PMC free article] [PubMed] [Google Scholar]; Badugu R. Lakowiczand J. R. Geddes C. D. Curr. Opin. Biotechnol. 2005;16(1):100–107. doi: 10.1007/s10103-017-2317-4. [DOI] [PMC free article] [PubMed] [Google Scholar]
- Kocaaga B. Kurkcuoglu O. Tatlier M. Batirel S. Guner F. S. J. Appl. Polym. Sci. 2019;136:47640. doi: 10.1039/C6NR00859C. [DOI] [PubMed] [Google Scholar]; Song N. Zhou L. Li J. Pan Z. He X. Tan H. Wan X. Li J. Ran R. Fu Q. Nanoscale. 2016;8:7711–7722. doi: 10.1039/C6NR00859C. [DOI] [PubMed] [Google Scholar]
- Lee M. H. Kim J. S. Sessler J. L. Chem. Soc. Rev. 2015;44:4185–4191. doi: 10.1039/C4CS00280F. [DOI] [PMC free article] [PubMed] [Google Scholar]; Wang X. Sun J. Zhang W. Ma X. Lv J. Tang B. Chem. Sci. 2013;4:2551–2556. doi: 10.1039/C4CS00280F. [DOI] [Google Scholar]; Yu F. Gao M. Li M. Chen L. Biomaterials. 2015;63:93–101. doi: 10.1039/C4CS00280F. [DOI] [PubMed] [Google Scholar]; Yang Y. Xia M. Zhao H. Zhang S. Zhang X. ACS Sens. 2018;3:2278–2285. doi: 10.1039/C4CS00280F. [DOI] [PubMed] [Google Scholar]
- Guo Z. Nam S. Park S. Yoon J. Chem. Sci. 2012;3:2760–2765. doi: 10.1039/C2SC20540H. [DOI] [Google Scholar]; Pascal S. Haefele A. Monnereau C. Charaf-Eddin A. Jacquemin D. Le Guennic B. Andraud C. Maury O. J. Phys. Chem. A. 2014;118:4038–4047. doi: 10.1039/C2SC20540H. [DOI] [PubMed] [Google Scholar]
- Ye M. Wang X. Tang J. Guo Z. Shen Y. Tian H. Zhu W. H. Chem. Sci. 2016;7:4958–4965. doi: 10.1039/C6SC00970K. [DOI] [PMC free article] [PubMed] [Google Scholar]
- Singh R. K. Kumar S. Prasad D. N. Bhardwaj T. R. Eur. J. Med. Chem. 2018;151:401–433. doi: 10.1016/j.ejmech.2018.04.001. [DOI] [PubMed] [Google Scholar]; Mohamed D. Mowaka S. Thomale J. Linscheid M. W. Chem. Res. Toxicol. 2009;22:1435–1446. doi: 10.1016/j.ejmech.2018.04.001. [DOI] [PubMed] [Google Scholar]
- Grace R. R. Erchegyi J. Samant M. Cescato R. Riek R. Reubi J. C. Rivier J. E. J. Med. Chem. 2009;51:2676–2681. doi: 10.1021/jm701445q. [DOI] [PMC free article] [PubMed] [Google Scholar]; Barbieri F. Bajetto A. Pattarozzi A. Gatti M. Würth R. Thellung S. Corsaro A. Villa V. Nizzari M. Florio T. Int. J. Pept. 2013:926295. doi: 10.1021/jm701445q. [DOI] [PMC free article] [PubMed] [Google Scholar]
- Li M. Li W. Kim H. J. Yao Q. Chen C. Fisher W. E. J. Surg. Res. 2004;119:130–137. doi: 10.1016/j.jss.2004.03.006. [DOI] [PubMed] [Google Scholar]
- Rungta P. Bandera Y. P. Roeder R. D. Li Y. Baldwin W. S. Sharma D. Sehorn M. G. Luzinov I. Foulger S. H. Macromol. Biosci. 2011;11:927–937. doi: 10.1002/mabi.201100043. [DOI] [PMC free article] [PubMed] [Google Scholar]
- Mujumdar R. B. Ernst L. A. Mujumdar S. R. Lewis C. J. Bioconjugate Chem. 1993:105–111. doi: 10.1021/bc00020a001. [DOI] [Google Scholar]
- Stegemeyer H., Photoluminescence of Solutions, Von C. A. Parker, Elsevier Publishing Co, 1969 [Google Scholar]
- Rasband W., National Institutes of Health, USA, http://imagej.nih.gov/ij [Google Scholar]
- Prasad P. R. Selvakumar K. Singh H. B. Butcher R. J. J. Org. Chem. 2016;81:3214–3226. doi: 10.1021/acs.joc.6b00173. [DOI] [PubMed] [Google Scholar]; Ong M. J. H. Srinivasan R. Romieu A. Richard J. A. Org. Lett. 2016;18:5122–5125. doi: 10.1021/acs.joc.6b00173. [DOI] [PubMed] [Google Scholar]; Tan X. Luo S. Wang D. Su Y. Cheng T. Shi C. Biomaterials. 2012;33:2230–2239. doi: 10.1021/acs.joc.6b00173. [DOI] [PubMed] [Google Scholar]
- Redko B. Ragozin E. Bazylevich A. Tuchinsky H. Albeck A. Shekhter Zahavi T. Oron-Herman M. Kostenich G. Gellerman G. Biopolymers. 2015;104:743–752. doi: 10.1002/bip.22694. [DOI] [PubMed] [Google Scholar]; Gilad Y. Noy E. Senderowitz H. Albeck A. Firer M. A. Gellerman G. Bioorg. Med. Chem. 2016;24:294–303. doi: 10.1002/bip.22694. [DOI] [PubMed] [Google Scholar]; Redko B. Tuchinsky H. Segal T. Tobi D. Luboshits G. Ashur-Fabian O. Pinhasov A. Gerlitz G. Gellerman G. Oncotarget. 2017;8:757–768. doi: 10.1002/bip.22694. [DOI] [PMC free article] [PubMed] [Google Scholar]; Gellerman G. Elgavi A. Salitra Y. Kramer M. J. Pept. Res. 2001;57:277–291. doi: 10.1002/bip.22694. [DOI] [PubMed] [Google Scholar]
- Uddin Z. Li X. Jasti B. Curr. Trends Biotechnol. Pharm. 2019;13:146–155. [Google Scholar]
- Tian L. Yang Y. Wysocki L. M. Arnold A. C. Hu A. Ravichandran B. Sternson S. M. Looger L. L. Lavis L. D. Proc. Natl. Acad. Sci. 2012;109:4756–4761. doi: 10.1073/pnas.1111943109. [DOI] [PMC free article] [PubMed] [Google Scholar]
- Gilad Y. Noy E. Senderowitz H. Albeck A. Firer M. A. Gellerman G. Bioorg. Med. Chem. 2016;24:294–303. doi: 10.1016/j.bmc.2015.12.020. [DOI] [PubMed] [Google Scholar]
- Cherkas V. Grebenyuk S. Osypenko D. Dovgan A. V. Grushevskyi E. O. Yedutenko M. Sheremet Y. Dromaretsky A. Bozhenko A. Agashkov K. Kononenko N. I. Belan P. PLoS One. 2018;13:e0194031. doi: 10.1371/journal.pone.0194031. [DOI] [PMC free article] [PubMed] [Google Scholar]; Zuriani R. Sevakumaran V. Azizan M. N. M. Majid M. I. A. Amirul A. A. Biotechnol. Bioprocess Eng. 2013;18:1–7. doi: 10.1371/journal.pone.0194031. [DOI] [Google Scholar]; Yamasakia M. Murakia Y. Nishimotob Y. Murakawa Y. Matsuo T. Biochem. Biophys. Res. Commun. 2017;494:188–193. doi: 10.1371/journal.pone.0194031. [DOI] [PubMed] [Google Scholar]
- Kuhn D. M. Balkis M. Chandra J. Mukherjee P. K. Ghannoum M. A. J. Clin. Microbiol. 2003;41:506–508. doi: 10.1128/JCM.41.1.506-508.2003. [DOI] [PMC free article] [PubMed] [Google Scholar]
Associated Data
This section collects any data citations, data availability statements, or supplementary materials included in this article.


