Abstract
Nowadays, improving the physico-chemical properties of nanomaterials to enhance their performance towards various applications is urgent. Accordingly, gamma irradiation (GI) has evolved and attracted wide attention as a promising green technique to meet this need. In the current study, a Co–Fe LDH was used as a model 2D nanomaterial and was irradiated by GI (dose = 100 kGy). The sample was characterized via XRD, FTIR, FESEM, HRTEM, hydrodynamic size, zeta potential, and BET surface area measurements. The results showed that after irradiation, the surface area of the sample increased from 83 to 89 m2 g−1. Moreover, irradiation increased its dielectric constant, dielectric loss and AC conductivity. In addition, the sample showed superparamagnetic behavior, where its saturation magnetization increased from 1.28 to 52.04 emu g−1 after irradiation. Furthermore, the adsorption capacity of the irradiated LDH towards malachite green (MG) and methylene blue (MB) as model wastewater pollutants was also studied. The exposure of LDH to GI enhanced its adsorption capacity for MG from 44.73 to 54.43 mg g−1. The Langmuir–Freundlich, Sips, and Baudu models were well suited for both MG and MB adsorption among the six fitted isotherm models. The pseudo-first and second order models fit the adsorption kinetics better than the intraparticle diffusion model for both dyes. The interaction of MB and MG with the LDH surface was further investigated in dry and aqueous solution using Grand canonical Monte Carlo and molecular dynamics simulations. These two techniques provided insight into the adsorption mechanism, which is vital to understand the adsorption process by the LDH nanosheets and their possible use in practical applications. Moreover, the Co–Fe LDH showed good antibacterial activity against both Gram-positive and Gram-negative bacteria strains. Furthermore, due to its magnetic property, the Co–Fe LDH could be simply recovered from water by magnetic separation at a low magnetic field after the adsorption process.
Nowadays, improving the physico-chemical properties of nanomaterials to enhance their performance towards various applications is urgent.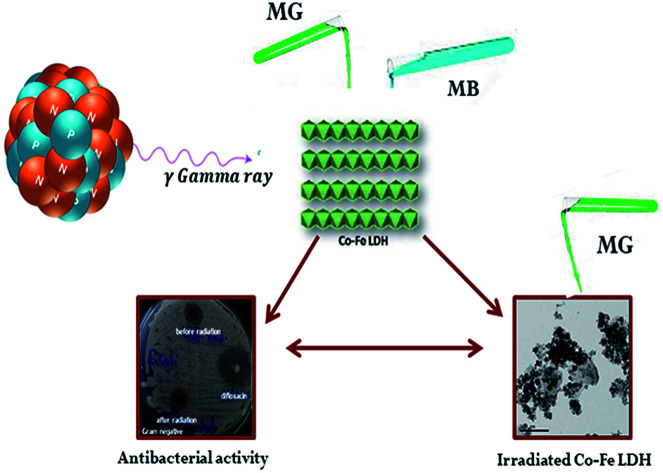
1. Introduction
Nowadays, natural and synthetic dyes are extensively used by numerous industries such as the plastic, textile, paper, paint, and rubber industries. Dyes are ionic organic chemicals that bind with materials to give colour, which is due to the presence of a chromophore group. Dyes are discarded by manufacturing factories in industrial wastewater streams, which have a serious impact on the environment if not treated. Generally, dyes are non-biodegradable compounds that can affect the photosynthesis process in aquatic systems by preventing the penetration of sunlight.1 Moreover, and during the chlorination process, dyes may reduce the solubility of gases in water, which enhances the production of the carcinogenic tri-halo methane compounds.
As two common models of extensively used industrial dyes, this study focused on two basic dyes, methylene blue (MB) and malachite green (MG) (Fig. 1). MB is an aniline dye with a crystalline solid structure and dark green colour,2 which has a variety of biological uses, while MG is an N-methylated diamino triphenyl methane dye that has a green crystalline structure with a metallic luster. MG is also a water soluble dye and has effective biocidal activity in the aquaculture industry. Moreover, MG dye has highly toxic effects on mammals, aquatic organisms and humans. The presence of MB and MG dyes in water supply systems has serious impacts on the environment and human health under the influence of some factors such as the temperature, time of exposure and dye concentration.3 Therefore, the removal of both dyes from wastewater is essential for environmental protection.
Fig. 1. Structures of (a) malachite green and (b) methylene blue.
Several techniques have been adopted for dye removal from wastewater streams, such as coagulation, adsorption, flocculation, membrane separation and photo-catalytic-based processes. Among them, adsorption has shown supreme efficiency for dye removal from aqueous solutions. Besides, nano-adsorbents are highly effective and characterized by their low cost, energy efficiency, easy operation and commercial availability. Recently, layered double hydroxides (LDHs) have been investigated as a promising 2D nano-adsorbent for dye removal from aqueous solution. In this study, Co–Fe LDH, as a magnetic model LDH, was prepared for use as a layered nano-adsorbent for the adsorption of MB and MG dyes from aqueous solutions due to its advantage of easy recovery, which is considered the key parameter for its application. To meet the requirements in real-life applications, enhanced nano-adsorbents with superior properties are necessary. Several techniques have been applied to enhance the properties of 2D nanomaterials, LDH in particular, including exfoliation, size reduction and compositing with other materials. However, these techniques require extensive and complicated synthetic procedures, the use of toxic and expensive chemicals and are time consuming.
Recently, irradiating nanomaterials with gamma radiation (GI) has emerged as a new green technique aimed at changing the properties and possibly the structure of materials. The interaction of radiant energy with materials, especially (GI), is an important field of research from both theoretical and practical viewpoints. When energized irradiation acts on a material, its electrical properties may be altered and new electrical phenomena may be observed.4 Thus, the interaction of GI (high energetic radiation) with materials can produce temporary or permanent changes. It can create structural defects, which in turn produce changes in electrical and magnetic properties.5 GI can produce various types of defects such as point defects, clusters, and atoms ionization. Thus, absorbing a large amount of gamma radiation may alter the structural properties of materials.6–8
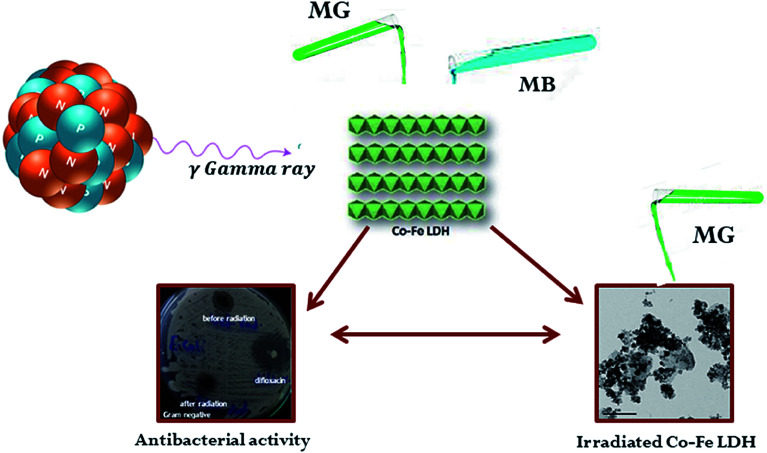
The present study was carried out in an attempt to (i) gain insights into the effect of ionizing radiation on the structural, dielectric, and magnetic properties on Co–Fe LDH, and to understand the interaction mechanism of ionizing radiation with Co–Fe LDH. (ii) Study the removal efficiency of MB and MG dyes from aqueous solutions using the Co–Fe LDH under various experimental conditions. The adsorption mechanism of MB and MG by the LDH was investigated via Monte Carlo (MC) and molecular dynamics (MD) simulations. The effect of the antibacterial activity of the LDH before and after irradiation was also determined, as illustrated in Scheme 1.
Scheme 1. Application of Co–Fe LDH before and after irradiation in MG and MB adsorption, and its antibacterial activity.
2. Experimental
2.1. Chemicals
Iron nitrate [Fe(NO3)3·9H2O] was purchased from SDFCL, India. Cobalt nitrate [Co (NO3)2·4H2O] was supplied by Oxford Laboratory Reagent, India. Sodium hydroxide and hydrochloric acid were purchased from Piochem for Laboratory Chemicals, Egypt. Methylene blue (C16H18N3SCl·3H2O) and malachite green (C23H25N2Cl) were obtained from E. Merck, India and used as received without further purification. All used chemicals were of analytical reagent grade and were used as received without further purification while all solutions were prepared using bi-distilled water.
2.2. Preparation of Co–Fe layered double hydroxide
The Co–Fe–NO3 LDH was prepared by mixing cobalt nitrate and iron nitrate solutions (3 : 1 molar ratio)9 with 8 M NaOH solution. The resulting product was inserted into a ball milling vessel (Photon, Egypt) for 10 h at 200 rpm. After ball milling, the dark brown precipitate was separated by filtration and washed with bi-distilled water several times. Finally, the obtained precipitate was dried at 80 ± 0.5 °C for 24 h.
2.3. Gamma irradiation
The powder was then pressed into a cylindrical shape (discs). The samples were placed in polyethylene sachets, where irradiation was carried out using a 60Co gamma source with 1.332 and 1.173 MeV energies at a dose rate of 7.5 kGy h−1. The irradiation process was carried out at the Atomic Energy Authority, Egypt and the samples were irradiated with a 100 kGy dose using energetic gamma radiation.
2.4. Electric and magnetic properties measurements
The samples were polished to obtain discs with two parallel and uniform surfaces. Next, the surfaces of the samples were covered with silver paste, acting as contact materials for the electrical measurements.
The real part of the dielectric constant (ε′) was calculated using the following equation: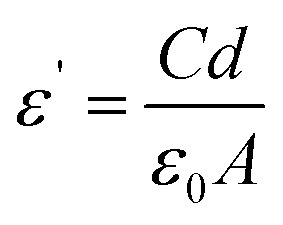 where C (F) and d (cm) are the capacitance and thickness of the samples, respectively. ε0 (F cm−1) is the permittivity of free space and A (cm2) is the sample area. On the other hand, the dielectric loss ε′′ is given by ε′′ = ε′ tan δ, where the loss tangent tan δ = 1/2πRfC, R (ohm) is the sample resistance and f is the frequency. In addition, the ac conductivity σ (ohm−1 cm−1) was calculated from the relation σ = ωε′′ε0 such that ω = 2πf.
Dielectric and electrical measurements were carried out at the room temperature using a U2826 programmable automatic RCL (EUCOL) meter. The variation in magnetization according to the magnetizing field was measured in the range of −20 kOe to +20 kOe at room temperature using a vibrating sample magnetometer (7410-LakeShore, USA).
2.5. Characterization
X-ray diffractograms were obtained using a PANalytical (Empyrean) X-ray diffractometer employing Cu Kα radiation (wavelength 0.154 cm−1) at an accelerating voltage 40 kV and current of 35 mA, in the 2θ range of 20° to 70° at a scan step of 0.02°. FT-IR spectra were recorded with a Bruker (Vertex 70 FTIR-FT Raman) spectrometer. The microstructures of the adsorbents were examined by high-resolution transmission electron microscopy (HRTEM, JEOL-JEM 2100), and their morphologies were characterized using field-emission scanning electron microscopy (FESEM). The BET specific surface area, specific pore volume, and pore sizes of the adsorbent materials were determined by N2 adsorption isotherms using an automatic surface analyzer (TriStar II 3020, Micromeritics, USA). Hydrodynamic particle sizes and zeta potentials were determined on a Malvern zeta sizer instrument (Malvern Instruments Ltd).
2.6. Dye adsorption study
Batch adsorption experiments were conducted by adding known amounts of Co–Fe LDH powder to a series of 250 mL of Erlenmeyer flasks containing 50 mL of MG and MB solutions with various initial concentrations (10–150 mg L−1). Subsequently, the vessels were agitated using a shaker at 120 rpm at room temperature until equilibrium was reached, and then 5 mL of suspension was withdrawn, and the adsorbent was removed by filtration. The equilibrium concentrations of the dyes in the solutions were measured at 665 nm for methylene blue and 615 nm for malachite green using a UV-visible spectrophotometer. The pH of the solution was adjusted with 0.1 N HCl.
The amount of dye adsorbed on the Co–Fe LDH nanosheets was calculated based on the following mass balance equation: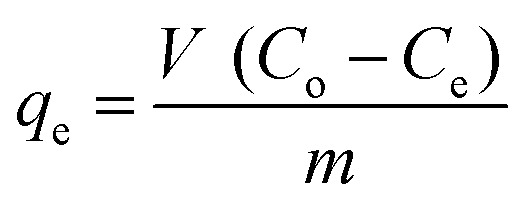 where qe is the adsorption capacity (mg dye adsorbed on the mass unit of Co–Fe LDH, mg g−1); V is the volume of the dye solution (L); C0 and Ce (mg L−1) are initial and equilibrium dye concentrations, respectively; and m (g) is the mass of dry Co–Fe LDH added. The equilibrium relationship between the quantity of adsorbate per unit of adsorbent (qe) and its equilibrium solution concentration (Ce) at a constant temperature is known as the adsorption isotherm. Several isotherm models have been developed for evaluating the equilibrium adsorption of compounds from solutions. Moreover, the kinetics of dye adsorption was investigated using the pseudo-first order, pseudo-second order and intra-particle models.10,11
2.7. Computational details
All calculations in this work were computed using the Materials Studio (BIOVIA, 2017) package, and the overall quality was set to fine. The crystal structure of Co–Fe LDH was similar to the hydrotalcite structure [Mg3Al(OH)8], where Mg2+ and Al3+ cations were replaced with Co2+ and Fe3+, respectively. Two layers with the formula [Co6Fe2(OH)16]2NO3·2H2O were constructed according to the idealized structure that represents 3 (Co2+/Fe3+) molar ratios.12 The LDH crystal structure was optimized via density functional theory (DFT) with the DNP basis set. The generalized gradient approximation (GGA) with the Perdew–Burke–Ernzerhof (PBE) functional was applied. MB, MG, and water molecules were also optimized at the same level of theory. The effective core potential was applied for the treatment of the core electrons of the LDH, while all electrons were used for dyes and water. The DFT calculations were carried out using the DMol3 code.13,14 A vacuum slab with a thickness of 15 Å was constructed on the Co–Fe-LDH surface, and the top layer was re-optimized by the same level of theory. Next, a supercell with (30.8 × 32.3 × 45.8) Å lattice parameters was built and used in the Grand Canonical Monte-Carlo (GCMC) simulation and molecular dynamics (MD) simulations. The atomic charges of the LDH, dyes and water obtained from the DFT calculations were used in the GCMC and MD simulations. The GCMC and MD simulations were computed by the Absorption and FORCITE modules, respectively. Four systems were simulated: (1) 10 MB molecules + 10 Cl− + LDH surface; (2) 10 MG molecules + 10 Cl− + LDH surface; (3) 10 MB molecules +10 Cl− + LDH surface + 1376 water molecules; and (4) 10 MG molecules + 10 Cl− + LDH surface + 1321 water molecules. The first two systems were prepared via MC simulation using the Absorption module, which located ten dye molecules on the LDH surface based on the lowest energy dye-LDH configuration. These two systems were followed by MD simulation for 20 ns. Next, both simulation boxes were filled with water molecules (systems 2 and 3) and simulated with MD for 20 ns. In the MC and MD simulations, the dye and water molecules were optimized by the COMPASSII force field.15 The van der Waals and electrostatic forces were treated with the atom-based summation method and the Ewald method, respectively. The cubic boxes were simulated with the NVT ensemble at 298.0 K controlled with the Nose thermostat. The time step was set to 1 fs.
2.8. Isolation and identification of bacterial pathogens
2.8.1. Isolation of bacterial pathogens
E. coli was grown on its selective MacConkey agar media (Oxoid; CM 0115) and Eosin methylene blue agar (EMB; Oxoid; CM 69) plates, whereas the other strains (Staphylococcus and Streptococcus) were grown on agar plates (Gram stain and colony morphology). The plates were incubated at 37 °C for 48 h and the bacterial growth was observed for all of the isolates.16
2.8.2. Biochemical and serological identification of bacterial pathogens
The standard (Biomerieux, Marcy L'etoil, France) API kit was used for both physiological and biochemical identification of the Gram-positive/negative bacterial isolates.
2.8.3. Bacterial strains and culture conditions
For the antibacterial studies, the Gram-positive St. coccus, S. aureus and Gram-negative E. coli and P. Aeruginosa, which are four microbial agents of multiple infective diseases in humans and animals, were chosen as the target organisms for this investigation. E. coli (ATCC 25922), S. aureus (ATCC 25913), St. coccus (ATCC 49619), and P. aeruginosa (ATCC 27853) were purchased from Cairo Microbiology Research Center besides two different strains of fungi species (Aspergillus flocculosus and Aspergillus nigricans). All tubes were sterilized in an autoclave before the experiments. Muller Hinton broth was used to culture E. coli, S. aureus, St. coccus and P. aeruginosa at 37 °C for 24 h in an incubator. The liquid cultures were finally diluted to obtain the bacterial cell concentration of approximately 107 colony forming units (CFU) per ml for the following antibacterial test.
2.9. Antibacterial measurements
2.9.1. Determination of minimum inhibition concentration (MIC)
Using the broth dilution method according to Clinical Laboratory Standards Institute (CLSI) (4), the MIC can be defined as the lowest concentration that completely inhibits the growth of microorganisms for 24 h. Bacterial strains were grown overnight on MHA plates at 37 °C before being used. The antimicrobial activity of Co–Fe LDH was examined using the standard broth dilution method.17 For each sample, different concentrations were diluted with Muller Hinton broth to give a final concentration ranging from (1000 μg mL−1–6.25 μg mL−1). In the presence of both positive and negative control tubes, the bacterial isolate was sub-cultured on Muller Hinton Agar (M. H. A) and incubated at 37 °C for 24 h.18 The colony from the tested microorganisms was suspended in 5 mL saline then the suspension was adjusted to 0.5 McFarland standards to yield the organism suspension of 1 × 10⁸ CFU mL−1. The bacterial suspension was diluted with saline to obtain 107 CFU mL−1. All tubes were incubated at 37 °C for 24 h. Results were recorded in terms of MIC, which is defined as the lowest concentration of antimicrobial agent causing almost complete inhibition of growth or giving no visible growth.
2.9.2. Minimal bactericidal concentration (MBC)
After MIC determination of the tested nanosheets, aliquots of 100 μL were withdrawn from all the tubes where no visually observable bacterial growth was observed and seeded in MHA plates, then incubated for 24 h at 37 °C. The MBC endpoint is defined as the minimum concentration of antimicrobial agent that kills all the initial bacterial population. The number of plates without colonies was noted.16
2.9.3. Evaluation of antibacterial activity
The MIC of Co–Fe–NO3 LDH was measured via a broth dilution test under dark conditions. The tubes were incubated on a rotary platform at 37 °C for 48 h. The visual turbidity of the tubes was noted before and after incubation. The MIC was defined as the endpoint where no observed turbidity could be detected.
2.9.4. Antibacterial sensitivity using agar well diffusion method
Each of the tested nanomaterials was prepared to give a final stock concentration of 10 mg mL−1. Subsequently, this stock solution was used to prepare different diluted concentrations of each material in distilled water. The antibacterial activity of Co–Fe–NO3 was measured using the agar well diffusion method in the presence of 92.9% Difloxacin as a standard reference drug to E. coli and Tylvalosin to S. aureus. The agar diffusion method is one of the formal techniques used, in which the tested samples were spread on an agar layer in a Petri-dish. The growth of the tested microorganisms was limited to a circular zone around the pores containing the tested nanosheets. The antimicrobial effects were determined and measured as a diameter zone in millimeters using a caliber. The experimental procedure was as follows. The bacterial strains were suspended in saline solution (1.5 × 10⁸ viable organism per mL), and the population of the investigated pathogen was matched to McFarland tube no. 0.5 (1.5 × 10⁸ colony forming units, CFU mL−1).
3. Results and discussion
3.1. Characterization of Co–Fe LDH before and after irradiation
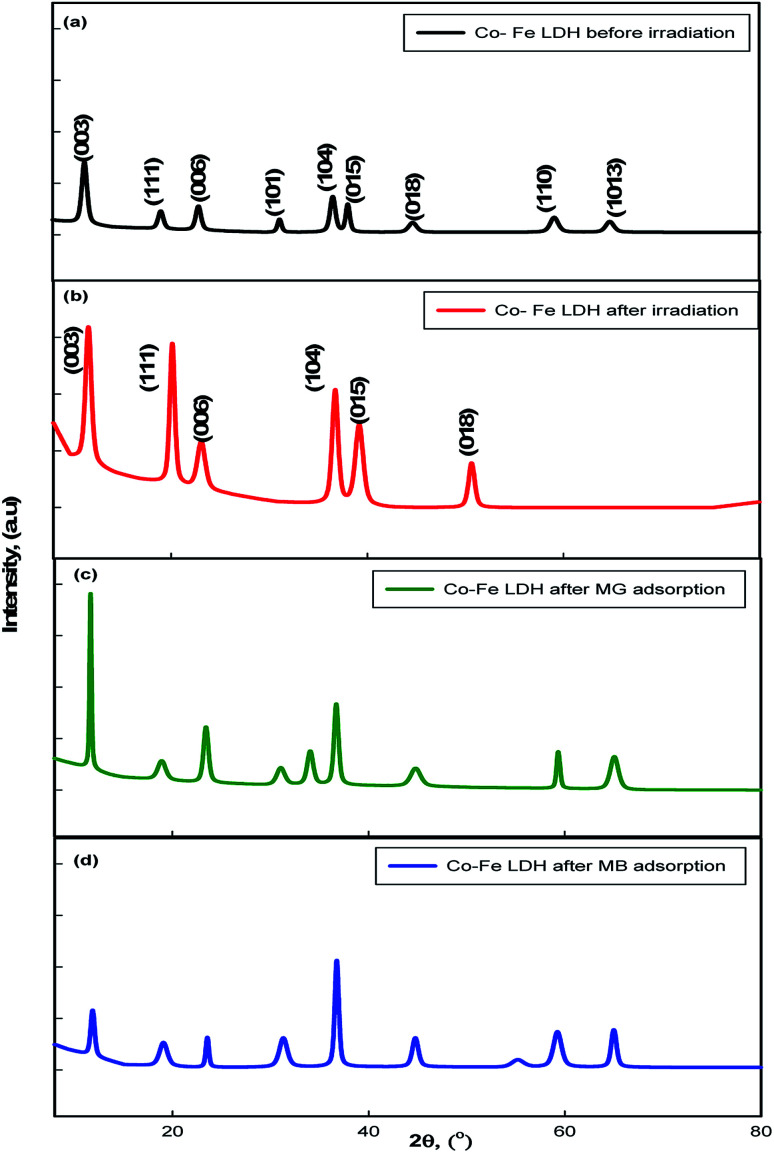
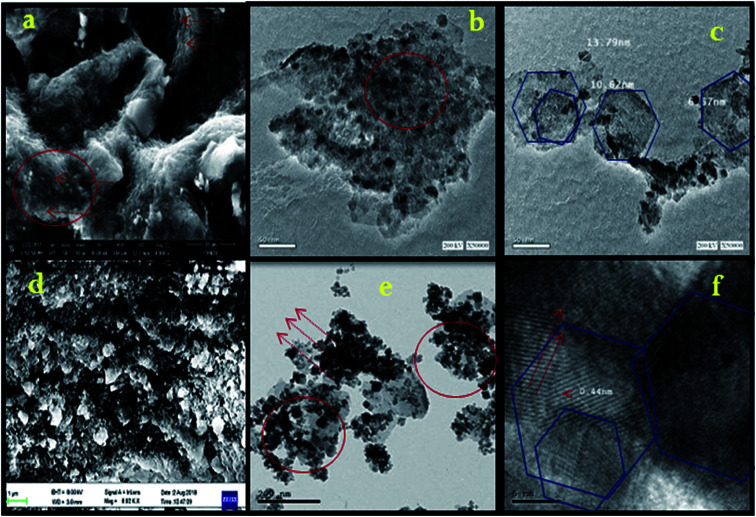
Fig. 2a shows the X-ray diffraction (XRD) patterns of the Co–Fe LDH. The diffraction peaks appeared at 11.64°, 23.4°, 18.3°, 33.2°, 36.6°, 38.7°, 46.2°, 59.05°, and 63.35°, which correspond to the (003), (006), (111), (101), (104), (015), (018), (110) and (1013) planes, respectively, according to JCPDS card no. 00-050-0235. The (003) basal plane spacing was determined to be 7.5 Å. The peak corresponding to the (110) plane signifies the regular arrangement of the metal ions in the Co–Fe LDH and the formation of plates, as shown in Fig. 3a–c.19 The XRD pattern for the irradiated Co–Fe LDH is shown in Fig. 2b, in which some peaks disappeared, such as (101), (110) and (1013), due to the agglomeration of the LDH particles, as shown in Fig. 3d–f. The higher intensities of the peaks at (003), (111), (006), (104), (015) and (018) can be attributed to the increase in OH− after irradiation. The higher intensities of the peaks indicate the improvement in the crystallinity of the irradiated LDH. This suggests that Co–Fe LDH had had higher crystallinity after irradiation. The HRTEM image shows fine striped layers, indicative of a layered structure after irradiation with a lattice spacing 0.44 nm, as illustrated in Fig. 3f compared to Fig. 3c. The average crystallite size increased from 12.7 nm before irradiation to 14.3 nm after irradiation, whereas the basal plane d-spacing did not show a significant change (7.7 Å to 7.8 Å).
Fig. 2. XRD patterns of the prepared Co–Fe LDH (a) before irradiation and (b) after irradiation, (c) Co–Fe LDH after MG adsorption and (d) Co–Fe LDH after MB adsorption.
Fig. 3. (a) FESEM image of the Co–Fe LDH before irradiation, (b) and (c) HR-TEM images of Co–Fe LDH before irradiation, (d) FESEM image of Co–Fe LDH after irradiation and (e and f) HR-TEM images of Co–Fe LDH after irradiation.
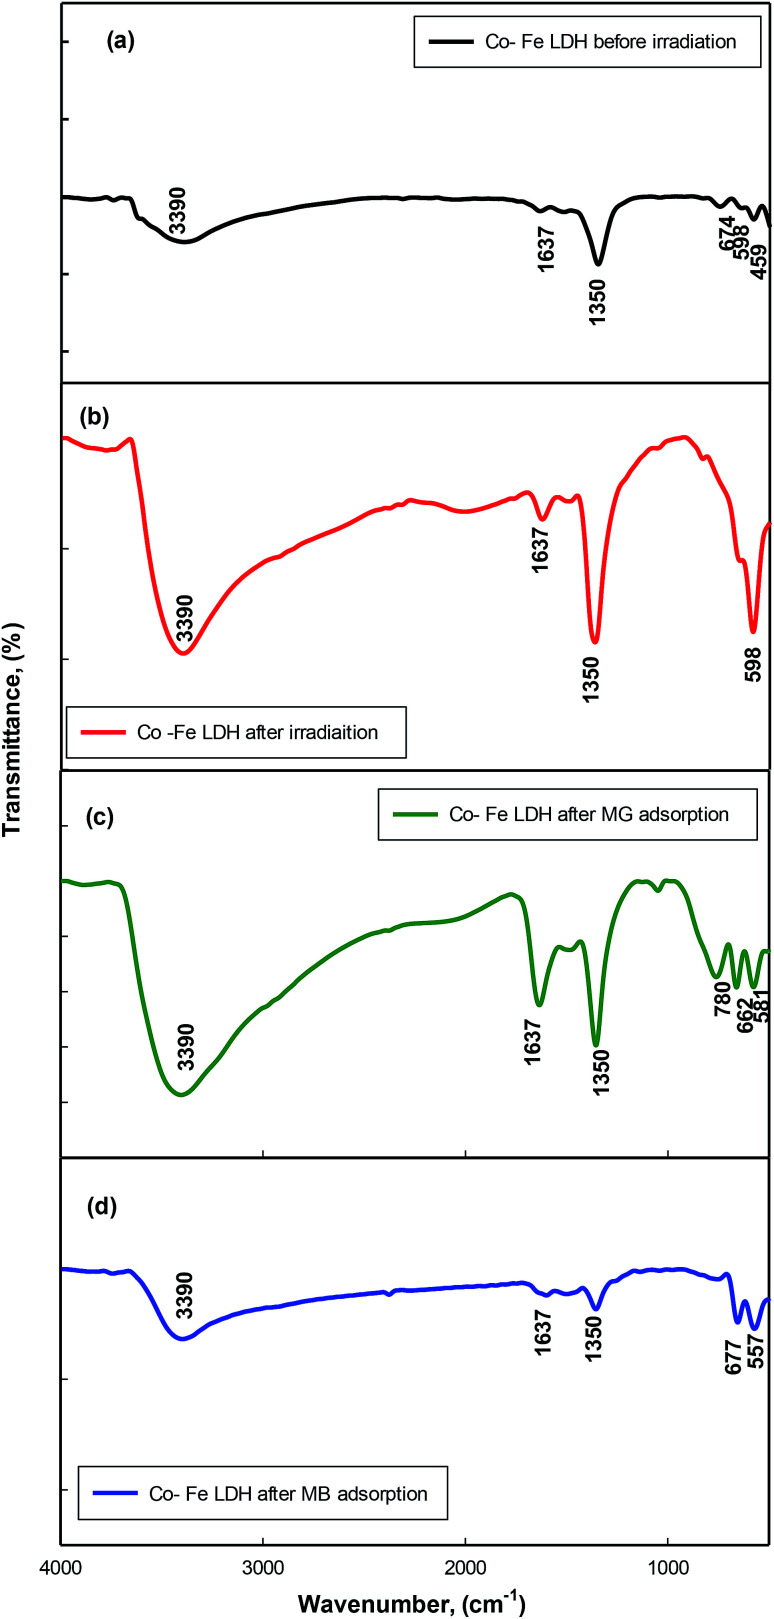
The FT-IR spectrum of the Co–Fe LDH are shown in Fig. 4a. The peaks at 3390 and 1637 cm−1 are ascribed to the OH-stretching vibration and bending respectively. The peak located at 1350 cm−1 can be attributed to the ν3 stretching vibration of the NO3 groups in the LDH interlayer. The peaks at approximately 674, 598 and 459 cm−1 originate from the metal–oxygen bond M-O vibration in the brucite-like and M–OH bending vibrations (M = Co or Fe).20 The FTIR spectrum of the Co–Fe LDH after irradiation is represented in Fig. 4b. After irradiation, the intensity of all the peaks increased due to the increase in OH− and the higher crystallinity of the sample.
Fig. 4. FT-IR spectra of Co–Fe LDH (a) before irradiation and (b) after irradiation; (c) Co–Fe LDH after MG adsorption; and (d) Co–Fe LDH after MB adsorption.
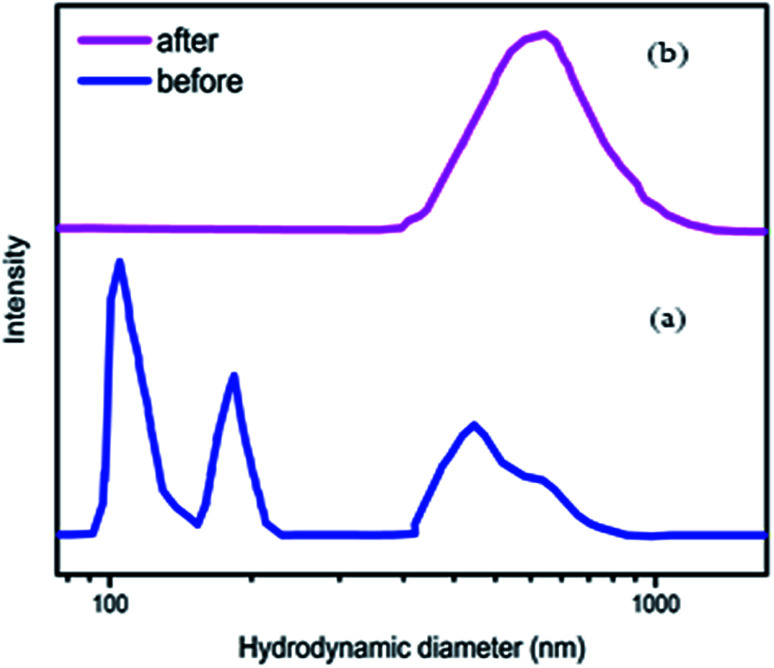
In Fig. 5a, the hydrodynamic particle size shows three distinct but broad peaks at around 104, 165 and 564 nm, where after radiation the hydrodynamic particle size demonstrated much broader peaks at approximately 628 nm (Fig. 5b).
Fig. 5. Hydrodynamic particle size distribution of the Co–Fe LDH (a) before irradiation and (b) after irradiation.
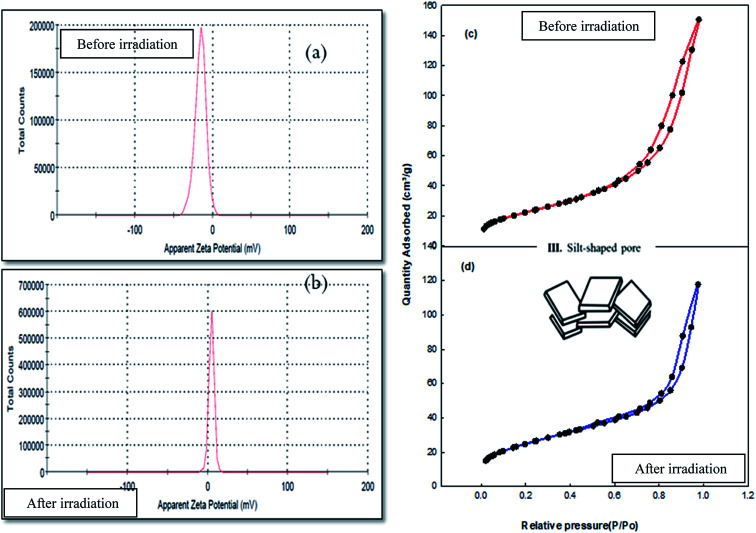
Zeta potential determination has important uses in the water treatment field. It is a measure of the magnitude of the charge repulsion/attraction between particles in solution, and one of the main factors known to affect stability. Also, it gives details about the causes of dispersion or aggregation. Fig. 6a illustrates that the zeta potential of the aqueous dispersion of the Co–Fe LDH was −15.6 mV at pH 7.0. This value was negative, as expected for an LDH around neutral pH.9Fig. 6b illustrates that the zeta potential of an aqueous dispersion of the irradiated Co–Fe LDH is 4.72 mV at pH 7.0. The results show that the positive zeta potential of the irradiated Co–Fe LDH nanomaterial is attributed to the extra stability of the particles after exposure to irradiation. The particle size distribution was determined after irradiation to be 628 nm. This increase in the particle size is due to the occurrence of agglomeration after the irradiation process.
Fig. 6. (a) and (b) Zeta potential of Co–Fe LDH nanoparticles before and after irradiation and (c) and (d) N2 sorption isotherms of Co–Fe LDH before and after irradiation, respectively.
The results from the surface area measurements of Co–Fe LDH are presented in Fig. 6c and Table 1. The results revealed that the BET surface area of the Co–Fe LDH was 83 m2 g−1 with a total pore volume of 0.159 cm3 g−1. The pore diameter was determined using the Barrett–Joyner–Halenda (BJH) analysis, which was found to be 6.6 nm. The isotherms followed type H3, revealing the presence of mesoporous structures. Furthermore, the Co– Fe LDH sample had a slit-shaped pore network, which was confirmed through the presence of H3-type hysteresis loops.21 The pore size distribution of the Co–Fe LDH was relatively broad (25–120 nm) with a maximum of 120 nm. The surface area measurements of Co–Fe LDH after irradiation (Fig. 6d) showed that the its BET surface area increased to 89 m2 g−1, resulting in an increase in the amount of new active sites and efficiency of Co–Fe LDH; however, its total pore volume, average pore diameter and micropore volume decreased after irradiation. Its pore size distributions and the isotherm hysteresis loop remained unchanged after irradiation. Also, its pore geometry was still a slit-shaped pore network, as illustrated in Fig. 6c and d.
Surface area measurement results for Co–Fe LDH before and after irradiation.
| Co–Fe LDH before irradiation | Co–Fe LDH after irradiation | |
|---|---|---|
| Surface area (m2 g−1) | 83 | 89 |
| Total pore volume (cm3 g−1) | 0.159 | 0.107 |
| Average pore diameter (nm) | 6.6 | 4.7 |
| Micro pore volume (cm3 g−1) | 0.005 | 0.001 |
3.1.1. Dielectric properties
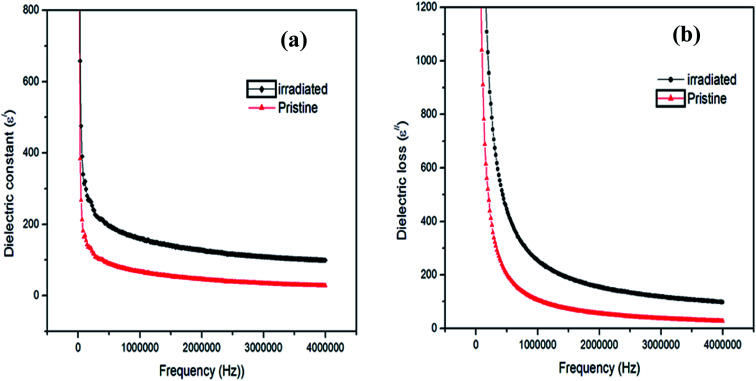
The variation in the dielectric constant, ε′, and the dielectric loss, ε′′, determined in the frequency range of 50 Hz to 4 MHz at room temperature for Co–Fe LDH before and after irradiation is shown in Fig. 7a and b, respectively. The general trends for the sample is that, ε′ and ε′′ were found to initially decrease rapidly with an increase in frequency, then it became almost frequency independent at high frequencies both before and after irradiation, i.e. the dispersion was high in the low frequency region. This typical behaviour was reported in ref. 22.
Fig. 7. Frequency dependence of the (a) real dielectric constant and (b) dielectric loss.
The observed behaviour with regard to the dielectric relaxation intensity can be explained based on space charge polarization due to the homogeneous dielectric structure of the samples.23 The electron hopping is favourable at a low applied field frequency. Thus, at low frequencies, the dielectric values are large. Thus, by electronic exchange (Fe2+ and Fe3+ions), one can obtain local displacements of electrons in the direction of the applied electric field, which determine the polarization of the sample. The effect of polarization is to reduce the field inside the medium. When the applied frequency was increased, the dielectric parameters ε′ and ε′′ decreased since beyond a certain frequency of the electric field, the electronic exchange between ferrous Fe2+ and ferric Fe3+ ions cannot follow the alternating field. Thus, the dielectric parameters ε′ and ε′′ may decrease substantially as the frequency increases. In addition, it can be seen from Fig. 7a and b that an increase in ε′ and ε′′ was observed after γ-irradiation, respectively. This can be explained by the interaction of γ-rays with the material, which is attributed to the change in the ratio of Fe2+/Fe3+ on the octahedral sites as a consequence of γ + Fe2+ ⇔ Fe3+ + e−, which leads to a change in the crystal size.24 As the number of ferrous ions available for the electron exchange interaction increases, the polarization increases, which leads to an increase in the dielectric values with γ-radiation.23
3.1.2. Electrical conductivity
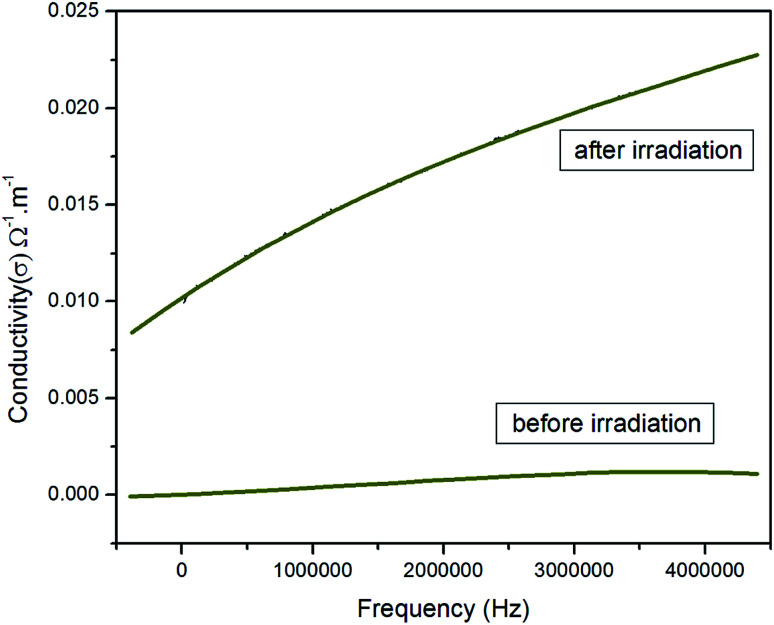
Fig. 8 presents the frequency dependence on the AC conductivity at room temperature for the Co–Fe LDH sample before and after irradiation. It can be seen that the AC conductivity increased with an increase in the frequency for both samples. The AC conductivity is caused by mobile charge carriers. As the mobile charge carriers hop to a new site from their original position, they face some displacements between the two minimum potential energy states.
Fig. 8. Variation in the electrical conductivity with respect to the frequency before and after irradiation.
Generally, the electrical conductivity is directly related to the amount of free or bonded charge carriers and their mobility. The conduction mechanism in this system is due to the valence exchange between Fe3+ ⇔ Fe2+ and the hole hopping between Co2+ ⇔ Co3+ at the B sites. Then, the increase in frequency enhances the electron hopping rate, and hence increases the conductivity, i.e. decreases the resistivity. It is also obvious that the AC conductivity increased after γ-irradiation. The increase in conductivity for the investigated sample after γ-irradiation can be attributed to the increase in the Fe2+/Fe3+ ratio. The increase in AC conductivity after γ-irradiation was reported by different authors.23
3.1.3. Magnetic properties
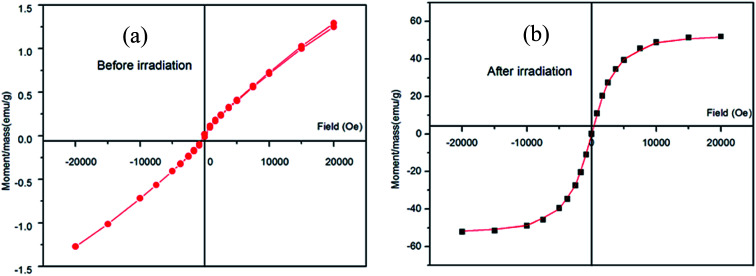
The magnetization (M) was measured using an applied magnetic field (H) between −20 kOe and +20 kOe to build M–H curves. The magnetization curves in Fig. 9a and b show that neither hysteresis nor coercivity and remanence for both the irradiated and non-irradiated samples was observed, indicating good superparamagnetism of the obtained samples. By increasing the external magnetic field of strength (H), the M–H curve of Co–Fe LDH indicated that the magnetization (M) had also increased, reaching a saturation value of 52.04 emu g−1 and 1.28 emu g−1 for the irradiated and non-irradiated samples, as shown in Fig. 9a and b, respectively. Also, Fig. 9a and b exhibit a hysteresis loop, including two branches for the magnetization and demagnetization processes, which means that the Co–Fe LDH exhibits ferromagnetic behaviour. The variation trend of Ms, Hc and Mr is illustrated in Table 2, from which it can be seen that the magnetization (Ms) values for the irradiated sample are higher than that of the non-irradiated sample.
Fig. 9. Magnetization M–H curves of the Co–Fe LDH (a) before and (b) after radiation.
Magnetic data for Co–Fe LDH before and after irradiation.
| Sample | M s (emu g−1) | M r (emu g−1) | H c (Oe) |
|---|---|---|---|
| Irradiated | 52.04 | 0.14643 | 11.029 |
| Non-irradiated | 1.28 | 15.462 × 10⁻³ | 117.45 |
It was observed that the saturation magnetization increased after irradiation, which is related to the increase in the crystallite size.25,26 The increase in the ratio of Fe2+/Fe3+ after irradiation resulted in an increase in the saturation magnetization values of the irradiated samples. Moreover, it also increased the magnetic disordering, resulting in an overall magnetization of the system, which may be the cause for the increase in the saturation magnetization.27
The magnetic saturation (MS) of Co–Fe LDH after irradiation increased from 1.2 to 52.04 emu g−1 due to the high surface area of the irradiated LDH. Moreover, its room temperature superparamagnetic behaviour was maintained simultaneously similar to the synthesized Co–Fe LDH.28 From the above characterizations of the LDH before and after irradiation, it is clear that the irradiation process has an effect on the crystallinity and surface area of the LDH. This led to enhancement in the function of the irradiated LDH as an adsorbent for malachite green. Its adsorption capacity increased from 104 to 191 mg g−1 before and after irradiation, respectively.
3.2. Dye adsorption study
3.2.1. Influence of pH of Co–Fe LDH solutions for malachite green and methylene blue removal
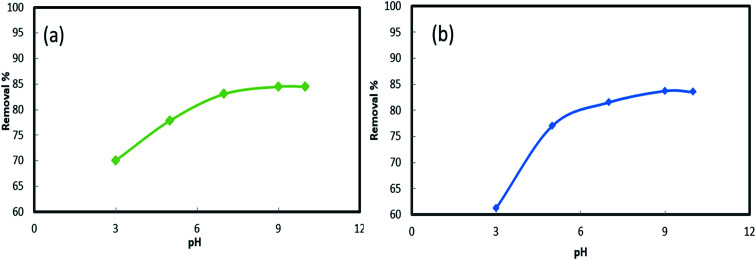
It is well established that the solution pH can affect the surface properties of the adsorbent, the degree of dye ionization and the structure of dye molecules. Thus, the solution pH can be considered an important variable during the dye adsorption process. The effects of pH on the adsorption of MG and MB were investigated at different initial pH values with initial MG and MB concentrations of 25 mg L−1. As shown in Fig. 10, the removal of MG and MB using the Co–Fe LDH displayed strong pH dependence between pH 3.0 and 10.0. It is clear that the removal percentage of both dyes increased to 84% and 83% for MG and MB, respectively. At a lower pH, large number of H+ ions causes protonation of the adsorbent surface, which leads to a decrease in the interaction between the positively charged surface and the positively charged MG and MB molecules. As the pH increases, the surface of the adsorbent may become negatively charged, which will facilitate its interaction with the positively charged MG and MB cations through electrostatic attraction, and therefore an increase in the adsorption of MG and MB by Co–Fe LDH was observed up to pH 10.29
Fig. 10. Effect of different pH on the adsorption of (a) MG and (b) MB by Co–Fe LDH.
3.2.2. Influence of time and kinetics of adsorption
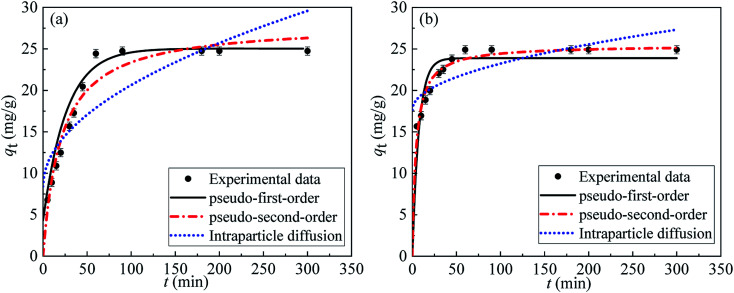
The influence of time on the adsorption of MG and MB on Co–Fe LDH is shown in Fig. 11. It was found that the removal percentage increased with an increase in contact time to about 83% for the two dyes. The kinetics of adsorption is an important aspect in the MG and MB removal process. Thus, three kinetic models were applied to fit the experimental data, the pseudo-first-order model,30 pseudo-second-order model, and intraparticle diffusion model.31 The fitting results are shown in Fig. 11 and the expressions of these models, as well as their coefficients are summarized in Table 3.
Fig. 11. Regression fitting of the kinetic models for the removal of MB (a) and MG (b).
Coefficients of the pseudo-first-order, second-order and intraparticle diffusion adsorption kinetic models (MG, MB = 60 mg L−1, Co–Fe-LDH 0.06 g).
| Isotherm model | Parametersa | Methylene blue | Malachite green | ||
|---|---|---|---|---|---|
| Values | R 2 | Values | R 2 | ||
| Pseudo-first-order: qt = qe(1 − e−k1t) | q e | 25.04 | 0.987 | 23.88 | 0.969 |
| k 1 | 0.0378 | 0.1356 | |||

|
q e | 28.10 | 0.978 | 25.46 | 0.950 |
| k 2 | 0.00176 | 0.00933 | |||

|
k ip | 1.223 | 0.724 | 0.5581 | 0.633 |
| c ip | 8.410 | 17.65 | |||
Where qt and qe are the amounts of MG and MB adsorbed on the LDH adsorbent in mg (adsorbate)/g (adsorbent) at equilibrium and at time, t, respectively; k1 is the rate constant of the pseudo first-order model (min−1); and k2 is the rate constant of the pseudo second-order model (g mg−1 min−1).
By comparing the regression coefficients for each kinetic model, it appeared that both the pseudo-first order and pseudo-second order models were valid for modelling the kinetics of the adsorption, unlike the intraparticle diffusion model. The pseudo-first order model showed a better fitting to the experimental data of MB than the pseudo-second order model, but the latter model showed a better fitting than the former one for the MG data, as illustrated by the correlation coefficients (R2). This was also supported via the comparison between both the theoretical and experimental qe values. Consequently, this provides an indication that the adsorption of MB and MG by the Co–Fe LDH catalyst is controlled kinetically via a pseudo-first order and pseudo-second order reaction, respectively.
3.2.3. Adsorption isotherms
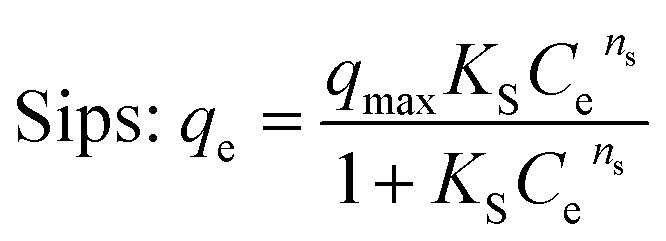
At different aqueous equilibrium concentrations, adsorption efficiency can be demonstrated through the use of adsorption isotherms. Thus, the adsorption isotherms of Co–Fe LDH for MG and MB were studied at room temperature under the optimum operating conditions. The results are illustrated in Fig. 12. The adsorption isotherm data were fitted to 6 equilibrium models, namely the Langmuir, Freundlich, Dubinin–Radushkevich, Langmuir–Freundlich, Sips, and Baudu models. The non-linear plots of these equilibrium models are shown in Fig. 12. Table 4 summarizes the fitted constants for all the models with their regression coefficient. The values of R2 obtained for the studied isotherm models followed the order: (Langmuir–Freundlich = Sips = Baudu) > Dubinin–Radushkevich > Langmuir > Freundlich. Despite the good fit of the Langmuir model to the experimental data (R2 ≈ 0.99) for both dyes, Fig. 12 clearly shows that this model was unable to fit the experimental data at a higher Ce concentration.
Fig. 12. Adsorption isotherms for MB (a) and MG (b) on the Co–Fe LDH before radiation, and the adsorption isotherm for MG on the Co–Fe LDH after radiation (c).
The isotherm models and fitted parameters for methylene blue and malachite green removal by Co–Fe LDH.
| Isotherm model | Parametersa | MB | MG on LDH before radiation | MG on LDH after radiation | |||
|---|---|---|---|---|---|---|---|
| Values | R 2 | Values | R 2 | Values | R 2 | ||

|
q max | 45.22 | 0.963 | 52.73 | 0.967 | 58.37 | 0.975 |
| K L | 0.0481 | 0.0552 | 0.2773 | ||||
| Freundlich: qe = KfCe1/nF | K f | 5.20 | 0.873 | 6.49 | 0.868 | 12.31 | 0.834 |
| 1/nF | 0.4160 | 0.4120 | 0.2907 | ||||

|
q max | 41.62 | 0.991 | 48.51 | 0.993 | 57.21 | 0.991 |
| K DRD | 0.0020 | 0.0017 | 0.00046 | ||||

|
q max | 38.04 | 1.000 | 44.73 | 1.000 | 54.43 | 1.000 |
| K LF | 0.0868 | 0.0949 | 0.4695 | ||||
| β | 2.091 | 1.894 | 1.9291 | ||||
|
q max | 38.04 | 1.000 | 44.73 | 1.000 | 54.43 | 1.000 |
| K S | 0.0060 | 0.01155 | 0.2325 | ||||
| n s | 2.091 | 1.894 | 1.9291 | ||||

|
q max | 38.04 | 1.000 | 44.73 | 1.000 | 54.43 | 1.000 |
| b 0 | 0.0060 | 0.0116 | 0.2325 | ||||
| x | 1.092 | 0.8947 | 0.9291 | ||||
| y | 0 | 0 | 0 | ||||
Where; qe is the amount of adsorbate in the adsorbent at equilibrium (mg g−1); Ce is the equilibrium concentration (mg L−1); qmax is the maximum adsorption capacity (mg g−1); KL is the Langmuir adsorption constant (L mg−1); Kf is the Freundlich adsorption capacity (mg g−1); 1/nF is the Freundlich adsorption intensity; KDR is the Dubinin–Radushkevich constant; β is the Langmuir–Freundlich heterogeneous parameter; R is the gas constant (8.31 J mol−1 K−1); T is the absolute temperature (K); KLF is the Langmuir–Freundlich equilibrium constant for a heterogeneous solid; KS is the Sips isotherm model constant (L mg−1); ns is the Sips isotherm exponent; x and y are the Baudu parameters and b0 is the Baudu equilibrium constant.
3.3. Mechanism of adsorption
3.3.1. Molecular dynamics (MD) simulations
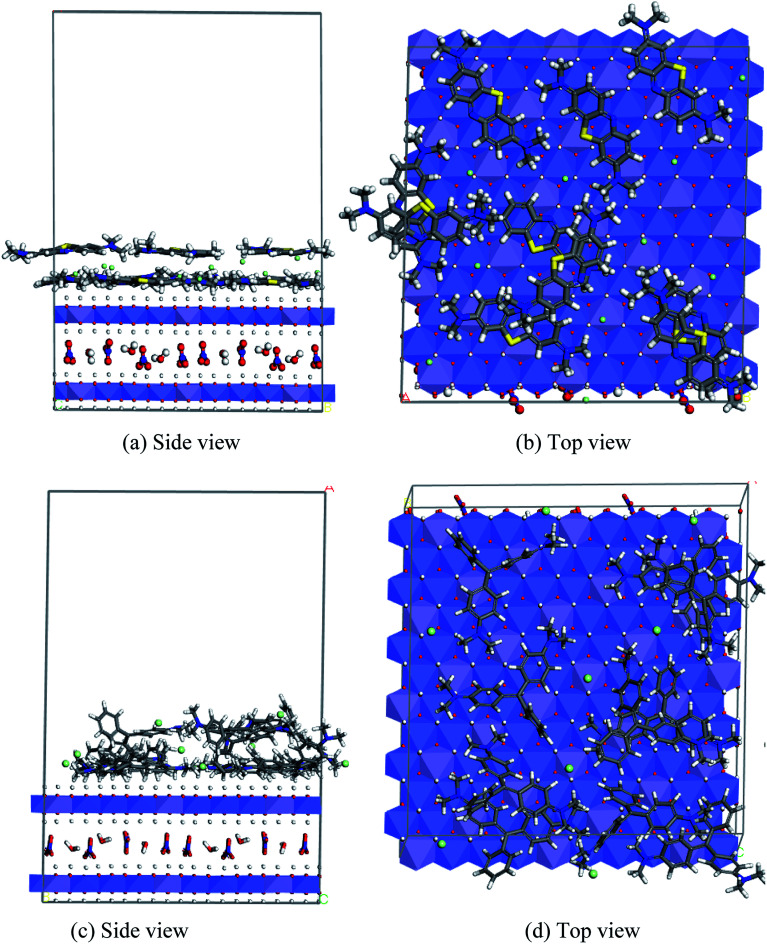
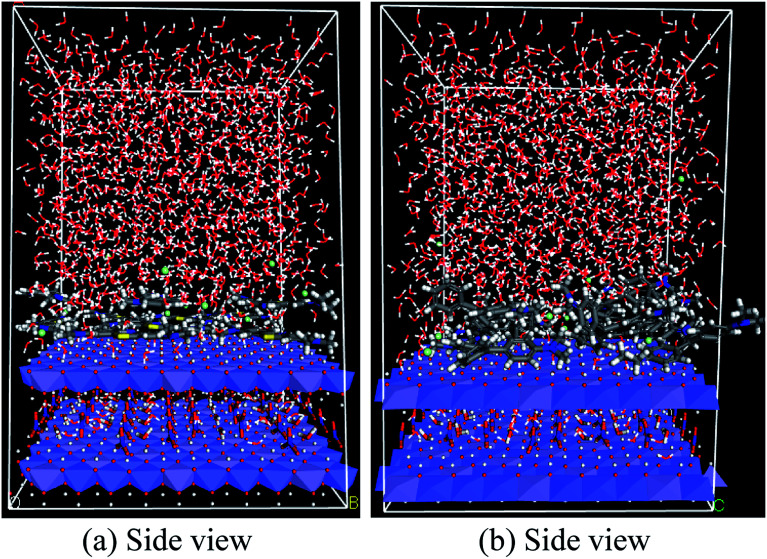
To clarify how the adsorption process occurs, we performed MD simulations for the adsorbed dyes in a dry system. Fig. 13 shows the final MD snapshots of the MB and MG molecules on the LDH surface. The adsorption of ten MB molecules displays that seven MB molecules were spread over the LDH surface and formed a monolayer, while the other three molecules had formed another layer above the monolayer. The interaction between the monolayer and the second layer was mainly through π–π stacking. Similar behaviour was also obtained for the adsorption of ten MG molecules on the LHD surface. To explore the effect of solvent molecules on the adsorption of the dyes on the LDH surface, both dry systems were re-simulated using MD in aqueous solution. By visual inspection of the adsorbed dyes in an aqueous solution (Fig. 14), it was found that the adsorbate molecules were still adsorbed parallel to the LDH surface. The formation of two layers was also observed, and thus the inability of the Langmuir isotherm model to fit the experimental data at a higher Ce concentration can be attributed to the formation of multilayer adsorption because this model assumes monolayer adsorption and no adsorbate–adsorbate interactions.
Fig. 13. MD snapshots of the adsorption of ten MB (a and b) and MG (c and d) molecules on the LDH surface in a dry system at 20 ns. Carbon, gray; hydrogen, white; oxygen, red; nitrogen, blue; and chlorine, cyan.
Fig. 14. MD snapshots of the adsorption of ten MB (a) and MG (b) molecules on the LDH surface in an aqueous solution at 20 ns. Carbon (gray), oxygen (red), hydrogen (white), nitrogen (blue) and chlorine (cyan).
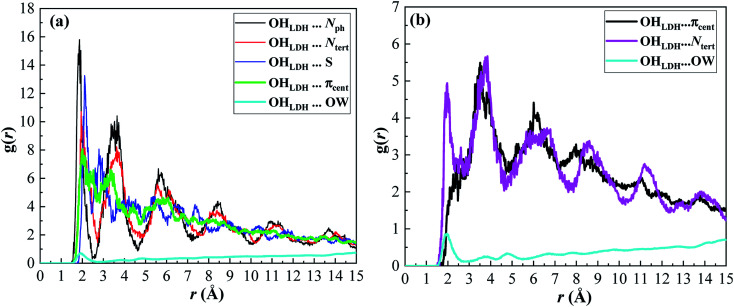
Non-covalent interactions play an important role in the adsorption mechanism. Using the radial distribution function (RDF), the non-covalent interactions between the hydrogen atoms of the hydroxyl group of the LDH top layer LDH (OHLDH) with several atomic sites in the MB molecule, e.g., S atoms, nitrogen atom of the phenothiazine moiety (Nph) atoms, tertiary nitrogen (Ntert) atoms, and aromatic rings centroid (πcent) were investigated from the MD simulation.
Moreover, the RDFs of the interactions between the OHLDH atoms and the atomic sites of MG, e.g., Ntert and πcent, were explored. The RDF is denoted by g(r), which is defined as the probability of finding a particle (atom, group or molecule) around any given particle within the system at a distance r. It is a very valuable quantity obtained from the MD simulation, and can be extensively used to understand the binding process. The computed RDFs from the MD simulations are plotted in Fig. 15.
Fig. 15. RDFs for the adsorption of MB (a) and MG (b) on the LDH surface in an aqueous solution obtained from MD simulations.
Hydrogen bonding is a representative non-covalent interaction, which is primarily an electrostatic attraction in origin, although strong H-bonds may have some covalent character. The H-bonding interactions formed between both dyes and LDH surface can be classified into two categories. The first is the conventional H-bond between the HLDH atoms with Nph, Ntert, and S atoms of MG or MB. The second is the relatively week H-bond between the OHLDH atoms and πcent of the aromatic rings in both dyes. It is widely accepted that XH/π interactions (X = O, N, or C) are commonly observed in aromatic molecules, and therefore the solubility of a non-polar aromatic molecule, e.g. benzene, in water is attributed to the OH/π interactions.32
It can be seen from Fig. 15a that the first peak of the (OHLDH⋯Nph), (OHLDH⋯Ntert), and (OHLDH⋯S) RDFs for the MB adsorption appeared at ∼1.9 Å, 2.0 Å and 2.1 Å, respectively. This should be ascribed to the occurrence of H-bond formation since the H-bonding distance is 3.5 Å. This figure indicates that the Nph atoms mostly interact with the hydroxyl groups of the LDH, followed by Ntert and S atoms. A was observed peak at ∼2.0 Å with a very low intensity resulting from the H-bonding between the OHLDH atoms and the water oxygen atoms (OW), displaying that the water molecules are excluded from the LDH surface due to the adsorption of the dye. The first peak of the (OHLDH··· πcent) RDF appears at ∼2.0 Å, indicating that this non-conventional H-bond contributes significantly in the adsorption mechanism. In case of the adsorption of MG, the interaction is mainly through the (OHLDH⋯Ntert) RDF, which shows a sharp peak at ∼1.9 Å (Fig. 15b), while the (OHLDH⋯πcent) RDF shows a small hump at ∼2.3 Å and a strong peak at ∼3.5 Å. The (OHLDH⋯OW) RDF also shows low intensity peak at ∼1.9 Å.
3.3.2. Characterization of Co–Fe LDH after MG and MB adsorption
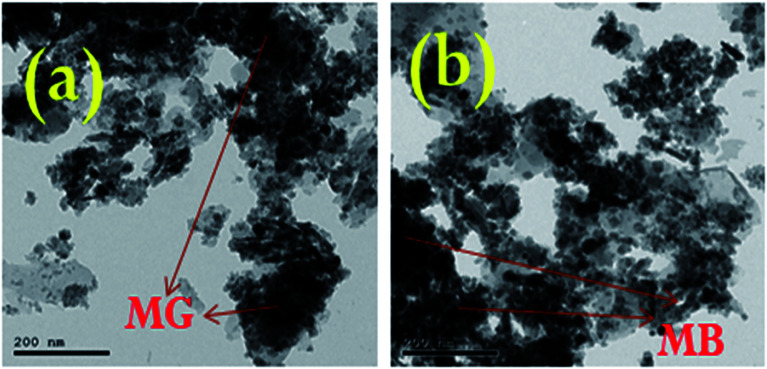
Fig. 2a–d illustrate the XRD patterns for the Co–Fe LDH before and after adsorption. It is clear that the XRD peak intensities increased and some peaks were slightly shifted upon MG and MB adsorption, which confirm the intermolecular interactions between MG and MB and the solid phases of the LDH. As shown in Fig. 16a and b, the HRTEM images before and after adsorption for the Co–Fe LDH demonstrate the formation of inner-sphere complexes, respectively.
Fig. 16. HRTEM images of Co–Fe LDH after the adsorption of (a) MG and (b) MB.
The FT-IR spectra of the Co–Fe LDH before and after adsorption are presented in Fig. 4a–d. The appearance of new peaks and an increase in the intensity of other peaks were observed as a result of the presence of new active sites in the LDH due to the bonding of the dyes. The intensity of the broad band of the –OH stretching vibration at the wavenumber of 3390 cm−1 increased due to the adsorption of the dyes, indicating that the oxygen atom in the hydroxyl groups of the LDH participated in the dye adsorption.33,34 An increase in intensity was also observed for the peaks located at the wavenumbers of 1637 and 1350 cm−1, which can be assigned to the bending vibration of the interlayer water molecules and NO3− stretching vibration, respectively. The adsorption of the dyes influenced in the bonds related to the nitrate group and the interlayer water molecules, which indicates that both groups may be the main adsorption sites for dye attachment.
3.4. Comparative study with pervious literature
The removal efficiency of malachite green and methylene blue by several reported adsorbents is illustrated in Table 5. In the present work, the Co–Fe LDH before and after irradiation showed good adsorption capacity towards both dyes compared to the other types of adsorbents. This is due to the distinctive properties of layered structure materials, such as high crystallinity, high anion exchange capacities, large surface area and substantial thermal stability, which are beneficial for use in water and wastewater treatment. On one hand, Co–Fe LDH presented higher removal towards the two dyes, and on the other hand, higher adsorption capacity for malachite green was obtained by functionalized multi-walled carbon nanotubes, which may be related to the electrostatic attraction between the cationic dye (+ve charge) and F-MMWCNTs (-ve charge) surface. The other reason may be attributed to the van der Waals interactions between the aromatic backbones of the dyes and the hexagonally arrayed carbon atoms forming the structure of F-MMWCNTs.35 However, the adsorption capacity for Zn–Al LDH is probably due to its high surface area. Meanwhile, the good removal % by organo/Zn–Al LDH for methylene blue is attributed to the strong π–π interactions and high surface area of this LDH.36
Reported malachite green and methylene blue adsorption capacity using different adsorbents.
| Dye | Adsorbent | Q m (mg g−1) | pH | Reference |
|---|---|---|---|---|
| Malachite green | Functionalized multi-walled carbon nanotubes | 142.9 | 4 | 35 |
| Cadmium hydroxide nanowires-AC | 19 | 6 | 37 | |
| Nickel hydroxide nanoplate-AC | 76.92 | 7 | 38 | |
| Cobalt ferrite-silica nanocomposites | 75.5 | 4–11 | 39 | |
| Zn–Al LDH | 126.6 | 4–11 | 40 | |
| Co–Fe LDH before irradiation | 44.73 | 4–11 | This study | |
| Co–Fe LDH after irradiation | 54.43 | |||
| Methylene blue | Mg–Al LDH | 43.48 | 2–11 | 41 |
| Organo/Zn–Al LDH | 113 | 3–11 | 42 | |
| Ni-LDH | 23.4 | 4–11 | 43 | |
| Ni-CLDH | 32.5 | 4–11 | 43 | |
| Mg-LDH | 13.6 | 4–11 | 43 | |
| Mg-CLDH | 20.8 | 4–11 | 43 | |
| Co–Fe LDH before irradiation | 38.04 | 4–11 | This work |
3.5. Antibacterial assay
Nowadays, antibiotics are widely used for the treatment of multiple infectious diseases in both animal and human, which has resulted in the emergence of new antimicrobial-resistant strains. These antimicrobial-resistant strains have led to a worldwide problem in the medical field, and thus the search for methods to solve this problem is an important issue. One of these methods is the use of nanotechnology, which relies on the penetration power of nanoparticles in the bacterial cell wall.44
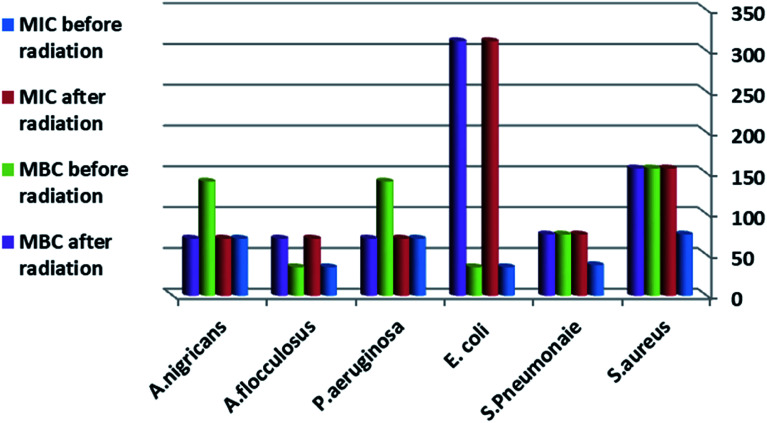
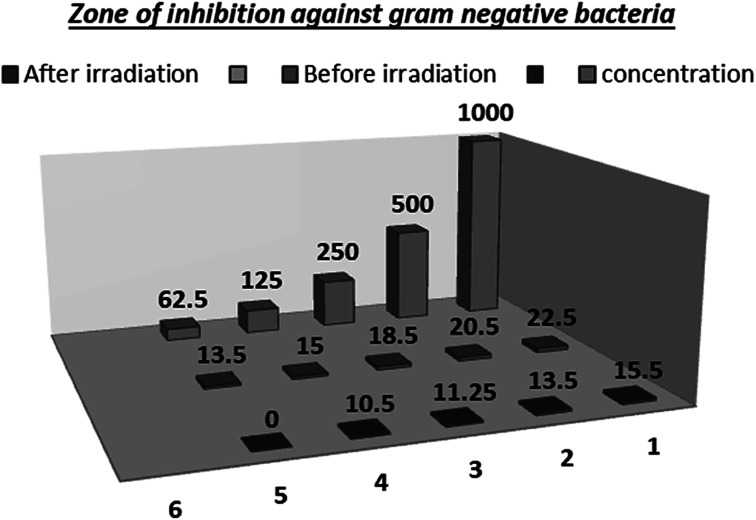
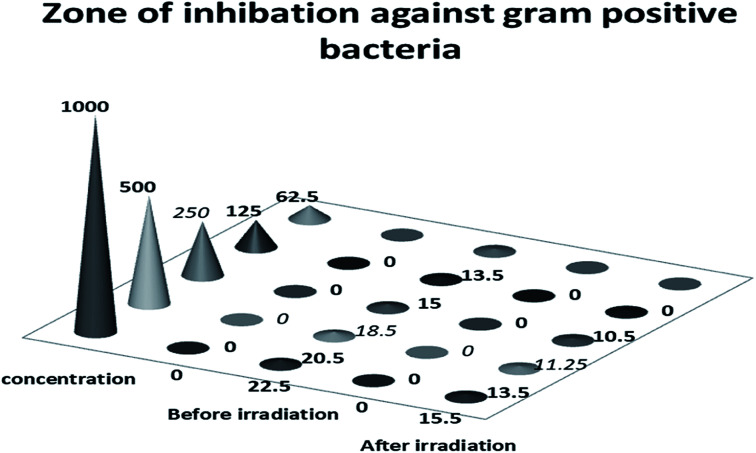
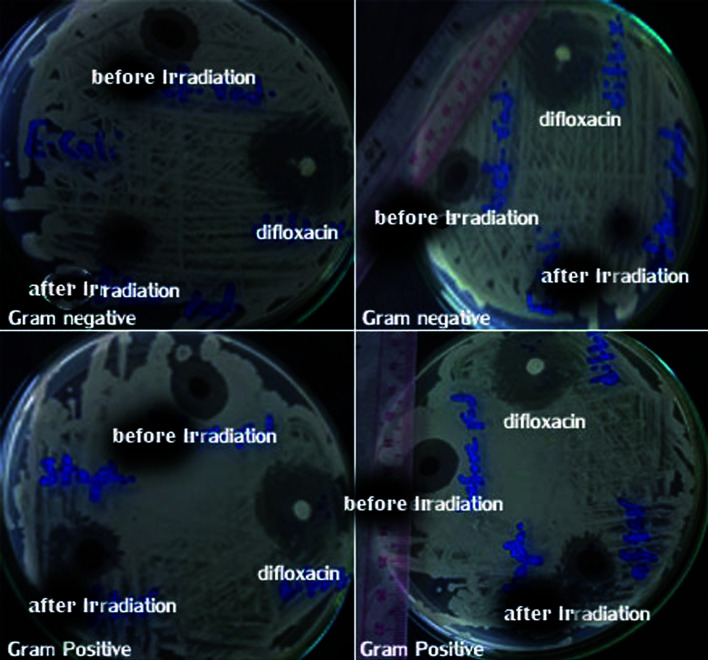
In this study, it is important that the G +ve bacterial isolates were more sensitive to the antimicrobial activity of Co–Fe LDH, although, it showed activity against the Gram-negative bacteria, as shown in Fig. 17, which illustrates the difference in the MIC value. Fig. 18–20 illustrating the differences between the zones and the difference in bacterial sensitivity.
Fig. 17. MIC and MBC of the Co–Fe LDH by micro broth dilution technique. The values reported in the table represent the average values obtained from triplicate measurements.
Fig. 18. Zone of inhibition of Co–Fe LDH before and after irradiation against Gram negative bacteria.
Fig. 19. Zone of inhibition of Co–Fe LDH before and after irradiation against Gram positive bacteria.
Fig. 20. Zone of inhibition of Co–Fe LDH against Gram positive and Gram negative bacteria before and after irradiation.
The bactericidal activity of cobalt and iron may be attributed to their interaction with the cell membrane, and then their diffusion inside the bacterial cell membrane, resulting in oxidative cell and DNA damage.44 In addition, the polyatomic-cationic character present on the surface of the LDH attracts the negative charge of the bacterial cell membrane, which explains the higher antibacterial activity against the Gram positive bacteria than the Gram negative bacteria.45 Also the mechanism of metallic nanoparticles with regard to their antimicrobial activity depends on the formation of free radicals, which induce bacterial cell damage.44 The irradiated Co–Fe LDH exhibited decreased antimicrobial activity in comparison to that before irradiation, which may be attributed to the agglomeration that occurred after irradiation. This led to an increase in the particle size and decrease in the penetration power of the NPs, and consequently, the antimicrobial activity had decreased after irradiation, as shown in the HRTEM in Fig. 3e.
4. Conclusion
In the current study, gamma irradiation was investigated as a promising green technique for the purpose of enhancing the properties of Co–Fe LDH as a model 2D nanomaterial. The results indicated that after irradiation, the surface area of the LDH increased from 83 to 89 m2 g−1, and as a result of the irradiation process, the magnetic and electrical properties of the material were enhanced. In addition, the irradiation process caused an increase in its conductivity. This increase was explained based on the hopping mechanism between ferric ions from the A sites as ferrous ions to the B sites, which increases the probability of electron exchange between the different oxidation states of Fe ions in the Co–Fe LDH sample. As the number of ferrous ions available for the electron exchange interaction increases, it results in an increase in polarization, which, in turn, leads to an increase in the dielectric constant with γ-radiation intensity.
The adsorption capacity of MG and MB by the Co–Fe LDH before and after irradiation was determined. The irradiated LDH sample showed good removal efficiency and showed 54.43 mg g−1 capacity for MG. Electrostatic attractions and H-bonding were the main factors influencing the adsorption process. Based on molecular dynamics simulation, the interactions between MB/MG with the studied LDH in dry and aqueous solution, were mainly through conventional H-bonds and (OHLDH/πcent) H-bonds. The π–π stacking interactions among the adsorbates play an important role in the adsorption mechanism. The antibacterial activity of Co–Fe LDH on E Coli, S. aureus, St. coccus, and P. aeruginosa besides two different strains of fungi (Aspergillus flocculosus and Aspergillus nigricans) was investigated. The experimental results indicated that Co–Fe LDH has a significant antibacterial effect against different microorganisms that cause serious infectious diseases in both humans and animals.
The results indicate that gamma irradiation is indeed a promising green technique for enhancing the properties of nanomaterials. The irradiated sample showed better performances in different applications, and thereby improved multi-functionality.
Conflicts of interest
There are no conflict to declare.
Supplementary Material
References
- Altaher H. ElQada E. Investigation of the treatment of colored water using efficient locally available adsorbent. Int. J. Energy Environ. 2011;2(6):1113–1124. [Google Scholar]
- Lin K.-Y. A. Chang H.-A. Ultra-high adsorption capacity of zeolitic imidazole framework-67 (ZIF-67) for removal of malachite green from water. Chemosphere. 2015;139:624–631. doi: 10.1016/j.chemosphere.2015.01.041. [DOI] [PubMed] [Google Scholar]
- Zheng Y. Zhu Y. Wang A. Highly efficient and selective adsorption of malachite green onto granular composite hydrogel. Chem. Eng. J. 2014;257:66–73. doi: 10.1016/j.cej.2014.07.032. [DOI] [Google Scholar]
- Tareev B. and Tareev B., Physics of Dielectric Materials, Mir Publ., Moscow, 1979, vol. 90 [Google Scholar]
- Hemeda O. Electrical properties of the Co-Zn ferrites irradiated with γ-rays. Phase Transitions A Multinatl. J. 1994;51(1–2):87–95. doi: 10.1080/01411599408201182. [DOI] [Google Scholar]
- Jurkin T. et al., Gamma-irradiation synthesis of iron oxide nanoparticles in the presence of PEO, PVP or CTAB. Radiat. Phys. Chem. 2016;124:75–83. doi: 10.1016/j.radphyschem.2015.11.019. [DOI] [Google Scholar]
- Panda R., Routray K. and Behera D., Effect of Gamma Irradiation on Structural and Magnetic Properties of Bi Substituted Cobalt Ferrite Nanoparticles, 2016 [Google Scholar]
- Xia W. et al., Anchoring ceria nanoparticles on graphene oxide and their radical scavenge properties under gamma irradiation environment. Phys. Chem. Chem. Phys. 2017;19(25):16785–16794. doi: 10.1039/C7CP02559A. [DOI] [PubMed] [Google Scholar]
- Moaty S. A. et al., Remediation of waste water by Co–Fe layered double hydroxide and its catalytic activity. J. Taiwan Inst. Chem. Eng. 2017;71:441–453. doi: 10.1016/j.jtice.2016.12.001. [DOI] [Google Scholar]
- Yu S. et al., Constructing sphere-like cobalt-molybdenum-nickel ternary hydroxide and calcined ternary oxide nanocomposites for efficient removal of U (VI) from aqueous solutions. Chem. Eng. J. 2018;352:360–370. doi: 10.1016/j.cej.2018.07.033. [DOI] [Google Scholar]
- Yu S. et al., Rational design of carbonaceous nanofiber/Ni-Al layered double hydroxide nanocomposites for high-efficiency removal of heavy metals from aqueous solutions. Environ. Pollut. 2018;242:1–11. doi: 10.1016/j.envpol.2018.06.031. [DOI] [PubMed] [Google Scholar]
- Fan G. et al., Catalytic applications of layered double hydroxides: recent advances and perspectives. Chem. Soc. Rev. 2014;43(20):7040–7066. doi: 10.1039/C4CS00160E. [DOI] [PubMed] [Google Scholar]
- Hammer B. Hansen L. B. Nørskov J. K. Improved adsorption energetics within density-functional theory using revised Perdew–Burke–Ernzerhof functionals. Phys. Rev. B. 1999;59(11):7413. doi: 10.1103/PhysRevB.59.7413. [DOI] [Google Scholar]
- Delley B. An all-electron numerical method for solving the local density functional for polyatomic molecules. J. Chem. Phys. 1990;92(1):508–517. doi: 10.1063/1.458452. [DOI] [Google Scholar]
- Zhao L. Liu L. Sun H. Semi-ionic model for metal oxides and their interfaces with organic molecules. J. Phys. Chem. C. 2007;111(28):10610–10617. doi: 10.1021/jp071775y. [DOI] [Google Scholar]
- Mackie T. J., Mackie & McCartney practical medical microbiology, 1996, Harcourt Health Sciences [Google Scholar]
- Wikler M. A., Methods for dilution antimicrobial susceptibility tests for bacteria that grow aerobically: approved standard, CLSI (NCCLS), 2006, vol. 26, pp. M7–A7 [Google Scholar]
- Tarek N. et al., Comparative chemical and antimicrobial study of nine essential oils obtained from medicinal plants growing in Egypt. Beni-Suef univ. J. basic appl. sci. 2014;3(2):149–156. doi: 10.1016/j.bjbas.2014.05.009. [DOI] [Google Scholar]
- Kim S. J. et al., Efficient Co–Fe layered double hydroxide photocatalysts for water oxidation under visible light. J. Mater. Chem. A. 2014;2(12):4136–4139. doi: 10.1039/C3TA14933A. [DOI] [Google Scholar]
- Ahmed A. A. A. et al., Zn–Al layered double hydroxide prepared at different molar ratios: preparation, characterization, optical and dielectric properties. J. Solid State Chem. 2012;191:271–278. doi: 10.1016/j.jssc.2012.03.013. [DOI] [Google Scholar]
- Yan Z. et al., Effect of calcination on adsorption performance of Mg–Al layered double hydroxide prepared by a water-in-oil microemulsion method. RSC Adv. 2016;6(55):50128–50137. doi: 10.1039/C6RA05253C. [DOI] [Google Scholar]
- Ravinder D. Reddy A. C. Dielectric properties of Li–Ge ferrites. Mater. Lett. 2003;57(19):2855–2860. doi: 10.1016/S0167-577X(02)01387-3. [DOI] [Google Scholar]
- Ahmed M. Ateia E. Salem F. The effect of Ti 4+ ions and gamma radiation on the structure and electrical properties of Mg ferrite. J. Mater. Sci. 2007;42(10):3651–3660. doi: 10.1007/s10853-006-1349-0. [DOI] [Google Scholar]
- Jonker G. Analysis of the semiconducting properties of cobalt ferrite. J. Phys. Chem. Solids. 1959;9(2):165–175. doi: 10.1016/0022-3697(59)90206-9. [DOI] [Google Scholar]
- Eltabey M. et al., Effect of γ-rays irradiation on the structure and magnetic properties of Mg–Cu–Zn ferrites. J. Mater. Sci. 2011;46(7):2294–2299. doi: 10.1007/s10853-010-5071-6. [DOI] [Google Scholar]
- Hemeda O. El-Saadawy M. Effect of gamma irradiation on the structural properties and diffusion coefficient in Co–Zn ferrite. J. Magn. Magn. Mater. 2003;256(1–3):63–68. doi: 10.1016/S0304-8853(02)00373-6. [DOI] [Google Scholar]
- Karim A. et al., Gamma irradiation induced damage creation on the cation distribution, structural and magnetic properties in Ni–Zn ferrite. Nucl. Instrum. Methods Phys. Res., Sect. B. 2010;268(17–18):2706–2711. doi: 10.1016/j.nimb.2010.05.058. [DOI] [Google Scholar]
- Chen X. et al., Facile synthesis of a novel magnetic core-shell hierarchical composite submicrospheres Fe3O4@ CuNiAl-LDH under ambient conditions. Mater. Lett. 2012;69:48–51. doi: 10.1016/j.matlet.2011.11.052. [DOI] [Google Scholar]
- Li X. et al., Novel N-doped CNTs stabilized Cu2O nanoparticles as adsorbent for enhancing removal of Malachite Green and tetrabromobisphenol A. Chem. Eng. J. 2016;292:326–339. doi: 10.1016/j.cej.2016.02.043. [DOI] [Google Scholar]
- Demirbas E. et al., Adsorption kinetics and equilibrium of copper from aqueous solutions using hazelnut shell activated carbon. Chem. Eng. J. 2009;148(2–3):480–487. doi: 10.1016/j.cej.2008.09.027. [DOI] [Google Scholar]
- Weber W. J. Morris J. C. Kinetics of adsorption on carbon from solution. J. Sanit. Eng. Div. 1963;89(2):31–60. [Google Scholar]
- Takahashi H. Suzuoka D. Morita A. Why is benzene soluble in water? Role of oh/π interaction in solvation. J. Chem. Theory Comput. 2015;11(3):1181–1194. doi: 10.1021/ct501133u. [DOI] [PubMed] [Google Scholar]
- Jin L. Bai R. Mechanisms of lead adsorption on chitosan/PVA hydrogel beads. Langmuir. 2002;18(25):9765–9770. doi: 10.1021/la025917l. [DOI] [Google Scholar]
- Li N. Bai R. Copper adsorption on chitosan–cellulose hydrogel beads: behaviors and mechanisms. Sep. Purif. Technol. 2005;42(3):237–247. doi: 10.1016/j.seppur.2004.08.002. [DOI] [Google Scholar]
- Shirmardi M. et al., The adsorption of malachite green (MG) as a cationic dye onto functionalized multi walled carbon nanotubes. Korean J. Chem. Eng. 2013;30(8):1603–1608. doi: 10.1007/s11814-013-0080-1. [DOI] [Google Scholar]
- Nodeh H. R. Sereshti H. Synthesis of magnetic graphene oxide doped with strontium titanium trioxide nanoparticles as a nanocomposite for the removal of antibiotics from aqueous media. RSC Adv. 2016;6(92):89953–89965. doi: 10.1039/C6RA18341G. [DOI] [Google Scholar]
- Ghaedi M. Mosallanejad N. Study of competitive adsorption of malachite green and sunset yellow dyes on cadmium hydroxide nanowires loaded on activated carbon. J. Ind. Eng. Chem. 2014;20(3):1085–1096. doi: 10.1016/j.jiec.2013.06.046. [DOI] [Google Scholar]
- Nekouei F. et al., Preparation of Nickel hydroxide nanoplates modified activated carbon for Malachite Green removal from solutions: kinetic, thermodynamic, isotherm and antibacterial studies. Process Saf. Environ. Prot. 2016;102:85–97. doi: 10.1016/j.psep.2016.02.011. [DOI] [Google Scholar]
- Amiri M. et al., Removal of malachite green (a toxic dye) from water by cobalt ferrite silica magnetic nanocomposite: herbal and green sol-gel autocombustion synthesis. Int. J. Hydrogen Energy. 2017;42(39):24846–24860. doi: 10.1016/j.ijhydene.2017.08.077. [DOI] [Google Scholar]
- George G. Saravanakumar M. P. Facile synthesis of carbon-coated layered double hydroxide and its comparative characterisation with Zn–Al LDH: application on crystal violet and malachite green dye adsorption—isotherm, kinetics and Box-Behnken design. Environ. Sci. Pollut. Res. 2018;25(30):30236–30254. doi: 10.1007/s11356-018-3001-3. [DOI] [PubMed] [Google Scholar]
- Aguiar J. E. et al., Adsorption of anionic and cationic dyes from aqueous solution on non-calcined Mg-Al layered double hydroxide: experimental and theoretical study. Sep. Sci. Technol. 2013;48(15):2307–2316. doi: 10.1080/01496395.2013.804837. [DOI] [Google Scholar]
- Starukh G. Rozovik O. Oranska O. Organo/Zn-Al LDH nanocomposites for cationic dye removal from aqueous media. Nanoscale Res. Lett. 2016;11(1):228. doi: 10.1186/s11671-016-1402-0. [DOI] [PMC free article] [PubMed] [Google Scholar]
- Elmoubarki R. et al., Ni/Fe and Mg/Fe layered double hydroxides and their calcined derivatives: preparation, characterization and application on textile dyes removal. J. Mater. Res. Technol. 2017;6(3):271–283. doi: 10.1016/j.jmrt.2016.09.007. [DOI] [Google Scholar]
- El-Shahawy A. A. et al., Synthesis and evaluation of layered double hydroxide/doxycycline and cobalt ferrite/chitosan nanohybrid efficacy on Gram positive and Gram negative bacteria. Mater. Sci. Eng. C. 2018;91:361–371. doi: 10.1016/j.msec.2018.05.042. [DOI] [PubMed] [Google Scholar]
- Lok C.-N. et al., Proteomic analysis of the mode of antibacterial action of silver nanoparticles. J. Proteome Res. 2006;5(4):916–924. doi: 10.1021/pr0504079. [DOI] [PubMed] [Google Scholar]


