Abstract
In this study, vascular endothelial growth factor (VEGF) loaded poly(d,l-lactide-co-glycolide) (PLGA) – carbon quantum dot microspheres were produced using microfluidic platforms. The microcapsules were fabricated in flow-focusing geometry with a biphasic flow to generate solid/oil/water (s–o–w) droplets. To avoid any damage to protein functional and structural stability during the encapsulation process, the VEGF was PEGylated. The produced microspheres were intact and highly monodisperse in size (CV < 5%). Furthermore, microspheres in a size range of 16–36 µm were achieved by adjusting the flow ratio parameter. The encapsulation efficiency, release profile, and bioactivity of the produced microparticles were also studied. The loading efficiency of PEGylated VEGF in the microparticles was varied from 51–69% and more than 90% of PEGylated VEGF was released within 28 days. Furthermore, the release of VEGF was indirectly monitored by carbon quantum dots. The present monodisperse and controllable VEGF loaded microspheres with reproducible manner could be widely used in tissue engineering and therapeutic applications.
In this study, vascular endothelial growth factor (VEGF) loaded poly(d,l-lactide-co-glycolide) (PLGA) – carbon quantum dot microspheres were produced using microfluidic platforms.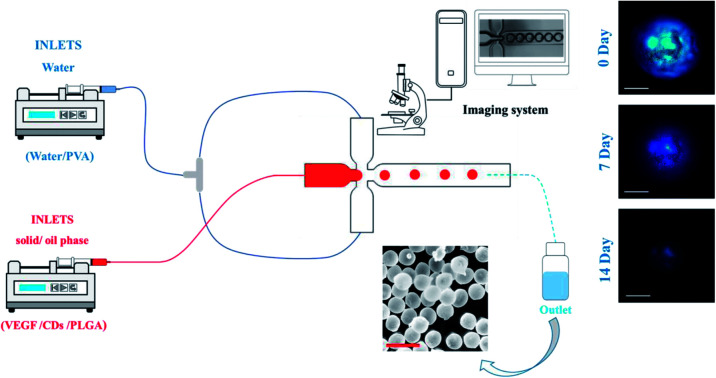
1. Introduction
Vascularization is a complex and multi-step physiological process that plays an essential role in tissue engineering.1 There are various clinical problems associated with poor vascularity in craniomaxillofacial tissue repair and regeneration. Some examples include treatment of critically sized oral and craniomaxillofacial defects in which the size of the defect hinders vascularity of a non-vascularized bone graft,2–4 or even small defects that have to be treated in particular conditions, such as after radiation therapy which creates poor vascularity.4–8 Moreover, some methods to seed stem cells into the graft materials have been reported, but in these techniques, the cell viability in the deep portion of large scaffolds is compromised as a result of poor vascularization and following hypoxia and inadequate nutrient transport.9–11 In general, problems in functional vascularization lead to a lack of graft integration and the ultimate failure of craniomaxillofacial tissue-engineered products.
Delivery of VEGF is highly challenging as its bolus injection, or the long/excessive amounts of exposure can cause improper neovascularization and carry the risk of tumorigenesis.12 On the other hand, and due to its short half-life, slow and short-lived exposure to VEGF produces transient and often short-lived neoangiogenesis. Thus, both localized and controlled sustained release of VEGF is extremely important. Administration of polydisperse VEGF-loaded particles into the body, and in turn, having different release rates in different local areas of the target tissue is not safe in VEGF delivery. There are different types of carriers that have been designed and offered for growth factor deliveries, but a vigorous predictive technique for the production of these carriers is yet to be accomplished.14–20 Poly(d,l-lactide-co-glycolide), (PLGA) is known as an attractive delivery vehicle due to its excellent biocompatibility, high safety profile, and FDA approval for use in drug.21 The biomolecules can be sustainably released by hydrolytically degradation of PLGA over time in vivo or in vitro.22 Besides, the release kinetics of this system can be easily adjusted by altering the molecular weight and lactide/glycolide ratio. Thus PLGA can be known as an appropriate candidate for control delivery of VEGF.
The microfluidic method is known as the appropriate approach for the production of microparticles with precise control over the characteristics. Although the on-chip approach was successfully applied for encapsulating small molecule drugs,23–26 using this technique for loading proteins is remains a challenging issue.26,27 Generally, proteins such as growth factor have sensitive structures, and their functionality can be affected by chemical degradation and physical denaturation during the encapsulation process.28 To overcome these issues, several approaches such as ion-pairing proteins, using human serum albumin or surfactants, and protein PEGylation have been proposed by literature in recent years.29–31 Despite these extensive efforts, fabrication of protein-loaded particle still known as a daunting task.
Carbon quantum dots (CQDs) are the new carbon derivative nanomaterials with the tiny size of 2–10 nm. At such a size scale, CQDs experience the domination of quantum confinement effect, which leads to the formation of electron–hole pairs with the dimensions smaller than the exciton Bohr radius.32–34 CQDs with outstanding features such as excellent optical properties, biocompatibility, and facile surface modification, have drawn attention.35
In this study, solid/oil/water (s–o–w), microfluidic platform was developed for encapsulation of PEGylated VEGF in PLGA – CQDs microspheres. Finely tune the microparticles' characteristics such as size, microstructure, loading efficiency, and release profiles can be achieved by using the present microfluidic approach. The fabrication process, characterization, release profile, and bioactivity of the VEGF-loaded microparticles was described.
2. Material and methods
2.1. Materials
Poly(d,l-lactide-co-glycolide), PLGA (75 : 25, Mw 76 000–115 000, viscosity of 0.7 dL g−1), Mg(OH)2, ammonium hydrogensulfate, dichloromethane (DCM), human VEGF ELISA assay kit, endothelial cell growth supplement (ECGS), and cell proliferation reagent WST kit were obtained from Sigma-Aldrich (USA). Vascular endothelial growth factor-A(165) (VEGF) was obtained from Cell Applications (USA). Polyvinyl alcohol, (Mw 500–5000) was purchased from VWR (USA), and acid-PEG9-NHS ester (Mw 5000) was obtained from BroadPharm (USA). West pico plus chemiluminescent substrate, live/dead kit for mammalian cells and F-12K cell culture media were purchased from Thermo Fisher (USA).
2.2. PEGylation of VEGF
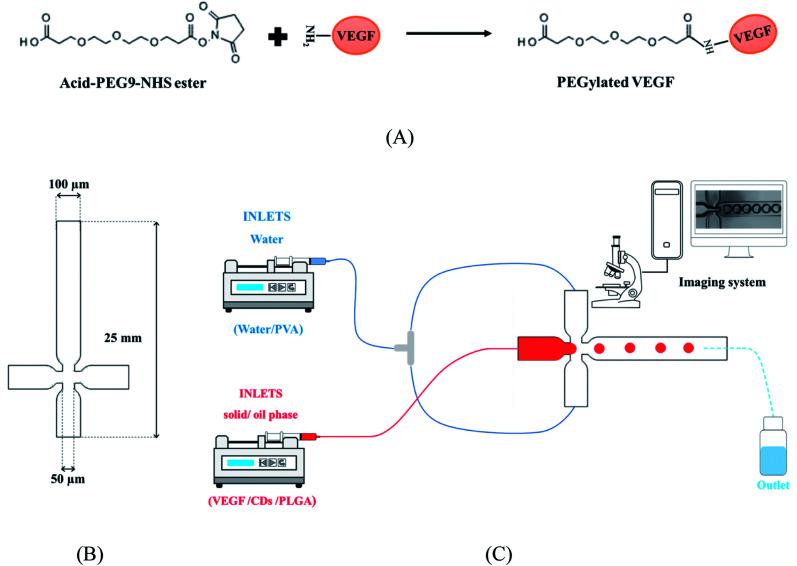
Poly(ethylene glycol) (PEG) was covalently conjugated to the VEGF through amine–hydroxysuccinimide (NHS) reaction (Fig. 1A).36 The typical procedure was as follows, 0.1 mg of VEGF was dissolved in 0.5 mL of PBS (0.1 M, pH 7.2, 4 °C). Also, 6 mg of acid-PEG9-NHS ester was dissolved 1 mL of DMSO. Subsequently, the acid-PEG9-NHS ester solution was added to the protein solution, in a 150 : 1 molar ratio. This solution was incubated for two hours at 4 °C; then, the unreacted acid-PEG9-NHS ester was removed from the obtained solution by using a dialysis bag (12 000 Da). Finally, PEGylated VEGF was lyophilized and stored at −20 °C.
Fig. 1. (A) Illustration of VEGF PEGylation. (B) X-junction microfluidic chip designed, and (C) microfluidic set up for VEGF-loaded MPs production.
2.3. Characterization of PEGylated VEGF
Western blot assay, Size-exclusion HPLC (SE-HPLC) and MALDI-TOF mass spectroscopy were used for characterization of PEGylated VEGF. PEGylation of VEGF was examined by using Western blot assay. Briefly anti-VEGF rabbit polyclonal antibody (1 : 500 dilution), and goat anti-rabbit antibody conjugated to horseradish peroxidase (HRP) (1 : 5000 dilution) were used as primary and secondary antibody respectively. Also, west pico chemiluminescent substrate was applied for signal generation.
SE-HPLC was performed to identify the different fraction of PEGylated VEGF using BIOshell A400 Protein C4, 2.1 mm × 15 cm column. The diluted sample in PBS buffer (1X, pH 7.4) was injected to the column with a flow rate of 0.5 mL min−1; 280 nm UV detector was used to monitor the elution peaks.
MALDI-TOF mass spectroscopy was performed in linear acquisition operation mode using MALDI TOF Mass Spectrometer (Shimadzu-7090). Briefly, MALDI-target was coated with a saturated solution of sinapinic acid in ethanol. Subsequently, the purified sample (10 µL) was mixed with 10 µL of sinapinic acid (1% in 40% acetonitrile), and 1 µL of the resulting mixture was loaded onto the target.
2.4. Synthesis of carbon quantum dots
CQDs was synthesized and characterized as same as the procedure described in our previous report.32 Briefly, ammonium hydrogen citrate (1 g) was added to 30 mL of DI water under vigorous stirring for 15 minutes. The resulting solution was transferred to a 100 mL hydrothermal autoclave reactor and heated up to 180 °C for 12 h. Subsequently, the reactor was cooled down to room temperature. The large particles were removed from the resulting solution by filtration (0.2 µm) and sedimentation (10 000 rpm for 20 min). Also, CQDs was purified using dialysis bag (1000 Da). The CQDs were PEGylated by combining CQDs with acid-PEG9-NHS at a 1 : 150 molar ratio, at room temperature for 2 h. After the reaction was complete, the unreacted chemical reagent was removed from the obtained solution by dialysis the components (3400 Da) overnight.
2.5. Fabrication of microfluidic platform
A microfluidic platform including an X-junction chip (Fig. 1B) with three inlets and one outlet was used in this study. The chips were fabricated using conventional photolithographic techniques. Briefly, the chips were designed using Solidworks CAD software with a channel diameter of 100 µm and then a mask was made by the optical pattern generator. Photoresist Shipley 1813 was spin-coated on a 50 mm diameter silicon wafer, and the pattern from the mask was exposed using a contact aligner. The pattern was etched by inductively coupled plasma ion etcher. Soft lithography technique was applied to transfer the mold's patterns on PDMS and to bind them to the glass slides after surface activation using plasma cleaner. The range of flow stability was regulated by using rhodamine B and fluorescein flows.
2.6. Production of the VEGF-loaded microparticles
VEGF-loaded PLGA microparticles (MPs) were fabricated by the microfluidic droplet approach. In this method, the MPs were achieved in two steps include in chip droplets formation and solvent extraction. The droplets fluid or solid/oil phase (growth factor and polymer solution) was prepared as the following procedure. 100 mg of PLGA (75 : 25, Mw 76 000–115 000) and 5 mg Mg(OH)2 was dissolved in 5 mL dichloromethane (DCM). Subsequently, 50 µL CQD and 0.1 mg of VEGF was added to PLGA solution and vortexed for 30 s. The continuous or carrier fluid phase was formed by aqueous surfactant blend (water/PVA). Briefly, 500 mg poly(vinyl alcohol) (PVA) were added to 25 mL water. In order to remove large particles, the solutions were filtered by 0.2 µm filtrate. The droplets and carrier fluid were transferred under control condition to the microfluidic chip inlet by two syringe pump through FEP tubes (Fig. 1C). The microfluidic chip outlet was collected in a glass beaker containing 100 mL of PBS solution of 2% PVA and continuously stirred at 200 rpm. The resulting MPs were lyophilized after centrifuged and washed with DI water.
2.7. Encapsulation efficiency
The amount of proteins encapsulated within PLGA microspheres was measured by full degradation of 5 mg of the microspheres in 5 mL of 0.1 N NaOH. After 24 hours, the solution was centrifuged at 5000 rpm for 5 min and the protein content in the supernatant was measured by ELISA assay kite. Results were expressed as actual loading and the loading efficiency, is defined by the ratio of actual to theoretical loading × 100 ± standard deviations (S.D.). Standard deviation (S.D.) was calculated by repeating this test for three different samples.
2.8. In vitro release studies
5 mg of VEGF-loaded MPs was dissolved in 1 mL sterile PBS (pH 7.4) and incubated at 37 °C. At scheduled time intervals, at predefined time intervals, the samples were centrifuged at 5000 rpm for 5 min and supernatants replaced with the same volume of fresh PBS. The protein and CQDs content of each sample were measured by ELISA assay kits and photoluminescence (PL) analysis. The release profile was expressed as terms of cumulative release from 1 mg of microspheres of three replicates.
2.9. VEGF bioactivity assay
The proliferative capacity of human umbilical vein endothelial cell (HUVEC) was used for in vitro bioactivity assay of the VEGF released from the MPs. HUVEC cell was cultured in 24 well plates at a density of 4000 cells per well in F-12K medium supplemented with 1% sodium heparin, 1% penicillin/streptomycin, 10% fetal bovine serum (FBS) and 20 µg mL−1 ECGS. After 12 hours cells were treated by VEGF-loaded MPs. Cell proliferation of each sample was determined after 5 days using WST and live/dead assay.32,37
2.10. Characterization
The size and microstructure of PLGA MPs were investigated 3D laser measuring microscope (LEXT OLS4000), scanning electron microscope (SEM) with energy dispersive X-ray detector (EDS) (JEOL JSM6510LV/LGS) and confocal microscope (Prairie Technologies, Inc). The PLGA MPs size was determined using an image analysis method as described previously.13 Five different microscopy images were prepared for each sample, and the average diameters and size distributions were determined by ImageJ software (ImageJ freeware, NIH, USA).
The hydrodynamic diameter size distribution of CQDs sample was measured by Dynamic Light Scattering (DLS, Malvern ZEN 3600 zetasizer) analysis. 100 µL of CQDs was diluted in 2.5 mL of PBS buffer (1X, pH 7.4), and the diluted sample was transferred to disposable cuvet for DLS analysis. The measurement was done at room temperature, and it was repeated five times.
Ultraviolet-visible (UV/VIS) and photoluminescence (PL) analysis were carried out by Shimadzu Biospec and Avaspec 2048 TEC respectively. Nikon D5300 was used to taking digital photos. Cells were visualized under inverted microscopy using EVOSfl fluorescence microscope (Euroclone, Italy).
3. Results and discussion
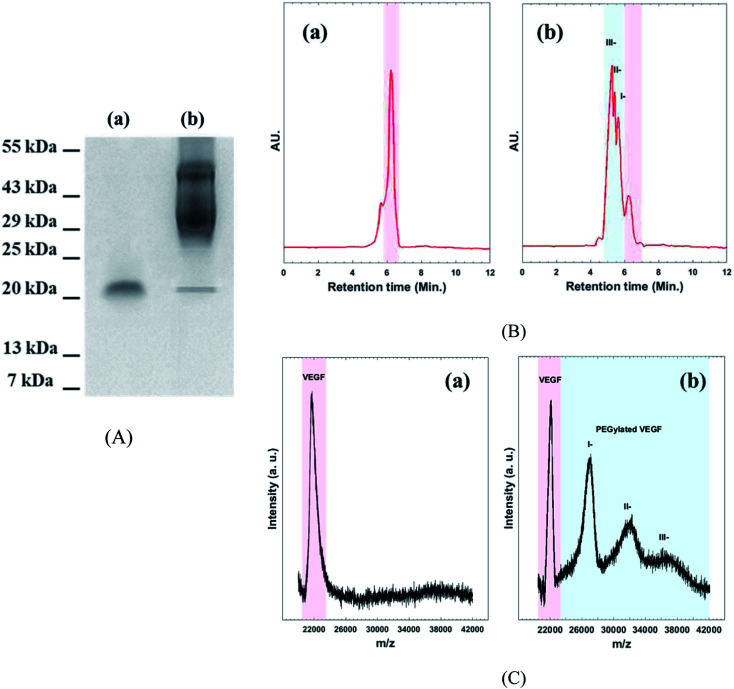
Western blot assay, SE-HPLC, and MALDI-TOF mass spectroscopy were performed to confirm the existence of different PEGylated VEGF moiety (Fig. 2). As shown in Fig. 2A(a) two bands, around 22 kDa appears for native VEGF. These bands are related to dimer fraction of native VEGF. As expected, the molecular mass of VEGF notably increased by conjugation of the acid-PEG9-NHS ester to VEGF (Fig. 2A(b)). HPLC chromatogram of native VEGF shows a single individual peak corresponding to free VEGF (Fig. 2B(a)). The chromatogram of PEGylated VEGF depicts the presence of different PEGylated derivatives of VEGF (I-, II-, and III-peaks) along with a small amount of unconjugated VEGF (Fig. 2B(b)). MALDI-TOF mass analyses used to determine the amount of free VEGF in the sample (Fig. 2C). The MALDI-TOF mass spectrum of PEGylated VEGF shows that the sample consisted of I-(∼45%), II-(∼35%), III-(∼15%) and less than 5% of free VEGF. These result indicated that more than ∼95% VEGF was successful PEGylated.29
Fig. 2. (A) Western blot assay, (B) analytical HPLC chromatogram, and (C) MALDI-TOF mass spectroscopy of (a): native VEGF (b): PEGylated VEGF.
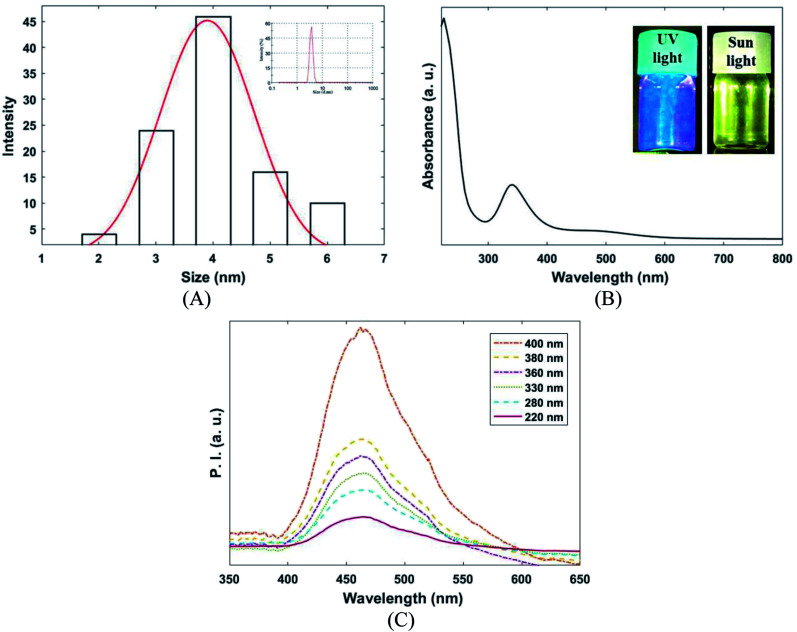
Dynamic light scattering (DLS), UV/VIS, and PL spectroscopy were applied for characterization of the synthesized CQDs (Fig. 3A–C). According to DLS, results depicted in Fig. 2A, the average hydrodynamic diameter of CQDs in PBS (pH 7.4) was 4 ± 1 nm. The UV/VIS and PL spectrum of CQDs presented in Fig. 2B and C. As shown in Fig. 2B, CQDs had two absorption peaks at 240 and 350 nm. The absorption peak at 230 nm is corresponding to π–π* transition of C O bond and the absorption peak at 330 is related to the n–π* transition of C O bond.32 Photoluminescence spectroscopy analysis was used to evaluate excitation dependency of CQDs. As presented in Fig. 2C, the emission wavelength at 460 ± 5 nm was revealed by CQDs for various excitation wavelengths (220 to 400 nm). The uniform size distribution and excitation independent behavior of as-prepared CQDs can be proven by PL characterization.
Fig. 3. (A) Hydrodynamic diameter size distribution of CQDs. The insets: DLS results (B) UV/VIS absorption spectrum of CQDs. The insets: CQDs image (1 mg mL−1) under the sun and UV light (366 nm), and (C) photoluminescence response of CQDs by varying the excitation wavelength from 246 to 396 nm.
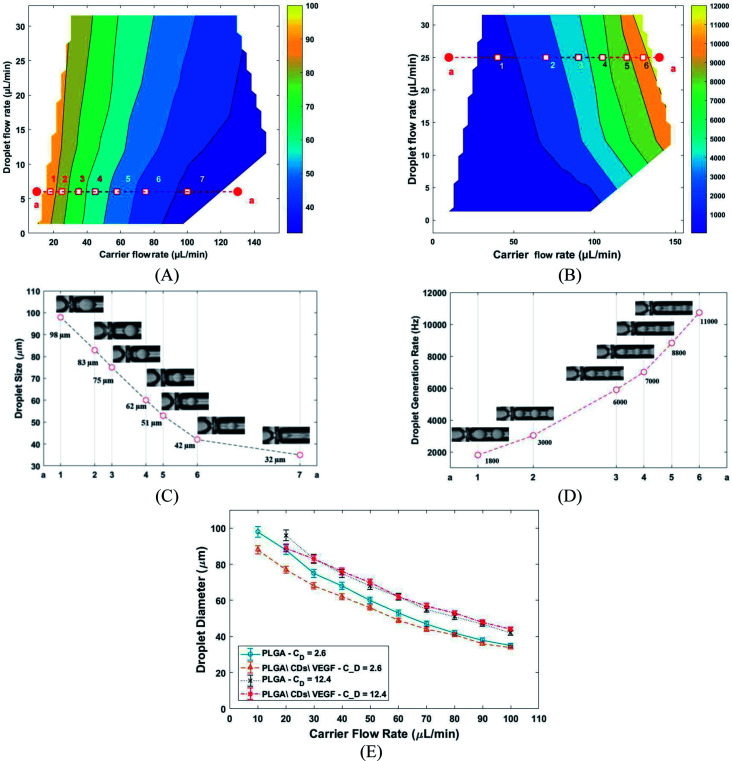
Herein, the PLGA MPs were achieved in two steps, including in chip droplets formation and solvent extraction. Generally, the droplet formation in the microfluidic chip depends on several physical parameters such as viscosities, interfacial surface tension, and flow ratio (carrier to droplet flow rate). The effect of carrier (Cf) and droplet flow (Cd) rate on droplet sizes and generation frequency rate presents in Fig. 4A and B. The generation frequency rate was defined by the ratio of Cd to the volume of the droplet. Different combination of carrier and droplet flow rate led to generate at least seven noticeable areas of droplet size and frequency. The typical droplet size and frequency related to the selected pointe depict in Fig. 4C and D. In the constant value of Cd droplet size was decreased, and generation frequency rate was increased with Cf increasing respectively. The effect of different droplet flow in droplet size was also investigated (Fig. 4E) by using PLGA (2% w/v) as control. The results show that the droplet size affected by changing droplet flow. Droplet size variation against carrier flow tow different droplet flow includes PLGA\CDs\VEGF and PLGA as control. The results show that the droplets with a size range of 30–100 µm and the generation frequency rate range of 1–13 kHz can be produced with this platform.
Fig. 4. (A) Droplet size, and (B) droplet generation rate for different values of carrier and droplet flow rate. (C) Droplet size formation in chip at Cd = 6.2 µL min−1 with different values of carrier flow rate, and (D) droplet generation rate at Cd = 25.2 µL min−1 with different values of carrier flow rate. (E) Droplet size variation against carrier flow for two different droplet flow includes PLGA\CDs\VEGF and PLGA as control.
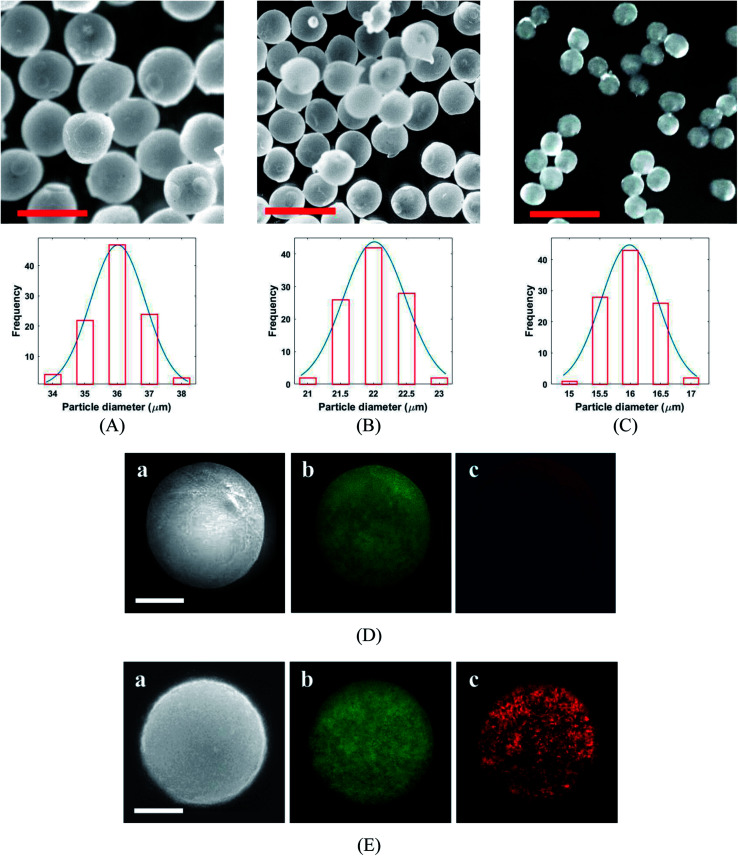
The PLGA MPs are formed by the residue of polymer and protein content after solvent (DCM) extraction from the synthesis droplet. So, the final MPs always have a smaller size in comparison to the initial droplet. The morphology and size distribution of PLGA MPs were investigated by 3D laser measuring microscope (Fig. 5A–C). Fig. 5A–C shown that the PLGA microsphere was intact and highly monodisperse in size (coefficient of variation <5%). Additionally, PLGA MPs appeared to have dense and nonporous structure. The burst release of the drug from the MPs can be inhibited through a non-porous structure.29 Distribution of CQDs in PLGA MPs was investigated with the SEM and EDS elemental mapping analysis (Fig. 5D and E). EDS mapping also confirms that CQDs was uniformly distributed in PLGA MPs.
Fig. 5. Micrographs and size distribution of VEGF-loaded PLGA MPs (A) Cf = 10 µL min−1, Cd = 2.5 µL min−1, (B) Cf = 70 µL min−1, Cd = 2.5 µL min−1, and (C) Cf = 100 µL min−1, Cd = 2.5 µL min−1, (scale bar = 50 µm). SEM micrograph image of (a) Cf = 10 µL min−1, Cd = 2.5 µL min−1 (scale bar = 15 µm), EDS elemental mapping of (b) carbon and (c) nitrogen. (D) PLGA MPs, (E) PLGA-CQDs MPs.
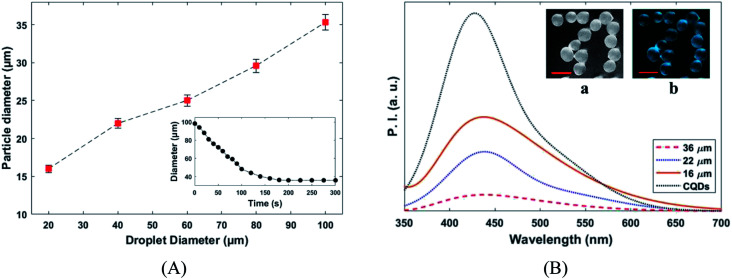
The variation of the MPs sizes as a function of droplet size and variation of the droplet size as a function of time for a tracked droplet is shown in Fig. 6A. Generally, DCM is removed from the droplet to the carrier/droplet fluid interface through the diffusion phenomena immediately after droplet formation in a microfluidic chip. As shown in Fig. 6A, DCM was continuously extracted from droplet, and it was fully removed after 200 seconds. Based on the initial droplet size, the particle size of the produced MPs was varied from 16–36 µm. The current technique for production of microparticles as growth factor carriers is the bulk mixing method. This approach is limited as it results in polydisperse particles with numerous physicochemical characteristics that are difficult to control. Thus, to have the microparticle of interest, many complicated, costly and often not precise post-processing steps are required. Moreover, the bulk method involves harsh mixing steps, which may cause denaturation and reduced bioactivity of the growth factor.36 Size polydispersity in bulk methods causes the formation of particles with various release profiles as the size and microstructure directly affect the evaporation rate of the solvent in the course of the drying step in the production process. Hence, current methods fail to fulfill the precise temporal and spatial delivery of the VEGF to the microenvironment.37,38
Fig. 6. (A) VEGF-loaded PLGA MPs sizes as a function of droplet size. The insets: size reduction profile of a tracked droplet as a function of time (Cf = 10 µL min−1, Cd = 2.5 µL min−1). (B) Photoluminescence response of VEGF-loaded PLGA MPs with different size (excitation wavelength 400 nm). The insets: fluorescence microscope image of VEGF-loaded PLGA MPs (22 µm) (a): bright field and, (b): fluorescence (400 nm), (scale bar = 50 µm).
Photoluminescence responses and fluorescence the image of the produced MPs and are depicted in Fig. 6B. The fluorescence emission intensity of the produced MPs increased by particle size reduction. Furthermore, slightly redshift (∼8 nm) in fluorescence emission peak was observed for CQDs in PLGA MPs. The successful incorporation of CQDs into the PLGA MPs can be confirmed by the photoluminescence spectra of samples (Fig. 5E and 6B).38
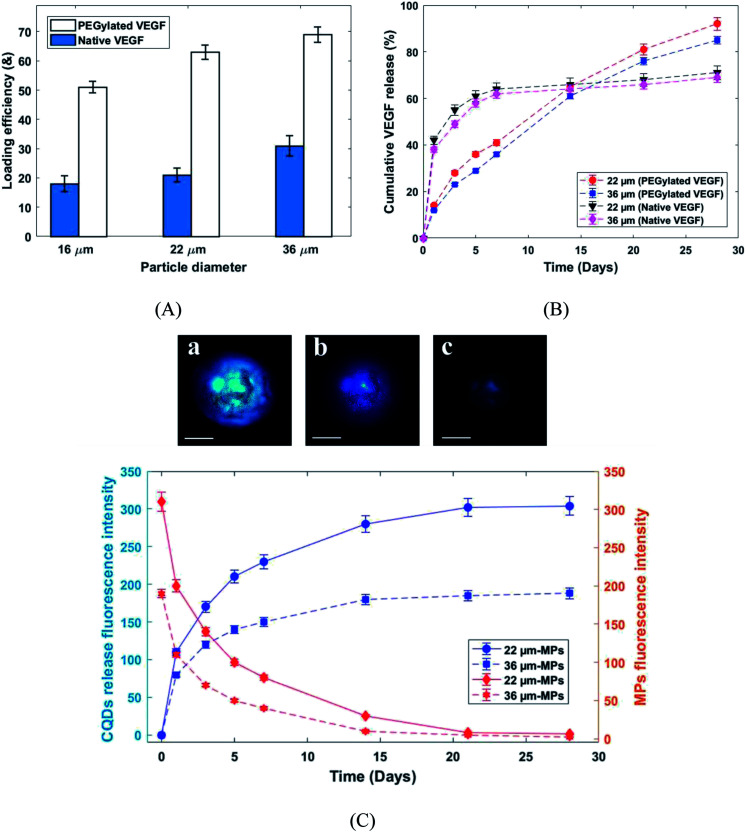
Fig. 7A shows the loading efficiency of PEGylated and native VEGF loaded in PLGA MPs. According to the MPs size, the loading efficiency of the produced MPs was varied from 51–69% and 18–31% for PEGylated and native VEGF, respectively (Fig. 7A). Frequently, the loading efficiency is known as a function of the particle size and for the presented MPs size range, the loading efficiency of 70% is difficult to achieve. Approximately 60% is the highest loading efficiency reported in the literature for similar particle size.22,26,27,29 The very high loading efficiency was presented by PEGylated VEGF in comparison with native VEGF. Solubility is known as a critical parameter in the proteins encapsulation.29 Generally, the VEGF can be loaded in PLGA MPs by incorporation with the matrix of MPs during fabrication or adsorption on the surface of the produced MPs. Due to more solubility, VEGF was better incorporated by the polymeric matrix and it was uniformly distributed in the microspheres.22,29
Fig. 7. (A) The loading efficiency of VEGF-loaded PLGA MPs. (B) Release profiles of native VEGF and PEGylated VEGF released from PLGA MPs in PBS (pH 7.4). (C) Confocal fluorescence microscope images of one PLGA MPs at (a): 0, (b): 7 and (c): 14 days (scale bar = 10 µm) and fluorescence intensity profiles of PLGA MPs and released CQDs from PLGA MPs.
The release profiles of PEGylated and native VEGF from the PLGA microcapsules are shown in Fig. 7B. The biphasic release profiles, burst initial release (38–42% in day 1) followed by a moderate release (29–31% released from day 1 to 28) was observed for native VEGF. In contrast, the continuous and approximately complete release in 28 days was seen for PEGylated VEGF (85–90% release in 28 days). The aggregated unreleasable proteins in MPs containing native VEGF was the main reason of incomplete release of proteins. According to the low solubility of proteins in an organic solvent, the greater amount of native VEGF was aggregated during the homogenization process. This issue can be solved by PEGylation of VEGF.26,27,29 Furthermore, the burst initial release of VEGF was highly reduced for PEGylated VEGF. The control of burst initial release is known as an important safety feature. Reduced VEGF aggregation during the mixing process, the uniform distribution of VEGF in the microspheres and larger hydrodynamic volume are known as the main reason for the reduction in burst initial release of PEGylated VEGF.29 The release behavior of CQDs from PLGA MPs was studied by photoluminescence spectroscopy and the confocal fluorescence microscope image (Fig. 7C). As shown in Fig. 7C, at same condition by increasing fluorescence emission intensity of the released CQDs in medium, the fluorescence emission intensity of the produced MPs decreased. These results show that release profiles of CQDs are dependent on the PLGA MPs degradation. Consequently, the released VEGF from the PLGA MPs can be traced indirectly by CQDs.
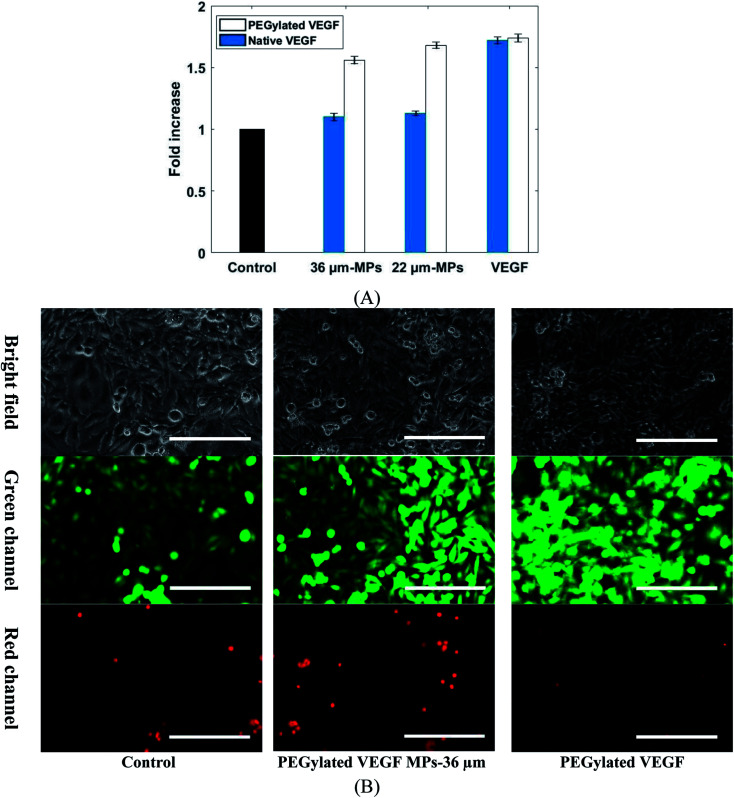
The biological activity of VEGF-loaded MPs was confirmed by human umbilical vein endothelial cells (HUVEC) proliferation assay. It was shown in the literature that HUVEC cells proliferation can be promoted by VEGF.10 The effect of a different group of VEGF-loaded MPs and VEGF on HUVECs cells viability shows in Fig. 8. Considering the same condition, the VEGF dose for each sample was calculated bead on load and release profile. The cell proliferation was statistically increased in those samples treated with PEGylated VEGF-loaded MPs and both PEGylated and native VEGF after 5 days when compared to the control group. In contrast, cell proliferation in both samples exposed to native VEGF-loaded MPs was not notably changed in comparison with the control group. Due to chemical degradation and physical denaturation, the functionality of native proteins like VEGF can be affected when it exposed to an organic solvent such as DMF. The results show that native VEGF during the encapsulation process mostly lost their biological activity. Also, these results confirm that PEGylation of VEGF not only improve the loading and release properties of VEGF but also keep their biological activity.
Fig. 8. (A) Proliferation of HUVECs cells treated with 22 and 36 µm PEGylated VEGF MPs, 22 and 36 µm native VEGF MPs, PEGylated and native VEGF at the same concentration (25 ng mL−1 for VEGF MPs and 10 ng mL−1 for free VEGF) in comparison with control groups. (B) Live/death assay of 36 µm PEGylated VEGF MPs and PEGylated VEGF treated HUVECs cells at the same concentration (25 ng mL−1) in comparison with control groups observed with fluorescent microscopy (scale bar = 100 µm).
4. Conclusion
In this study, VEGF-loaded PLGA – carbon dots microspheres were successfully produced through solid/oil/water (s–o–w), microfluidic platforms. In order to improve the protein functional and structural stability during the encapsulation process poly(ethylene glycol) was conjugated to the VEGF. The loading and release properties of PEGylated VEGF was significantly improved, and the biological properties of VEGF were fully preserved. VEGF-loaded PLGA MPs with high encapsulation efficiency, monodispersity, and appropriate release profiles were achieved by using the microfluidic platforms. Furthermore, it was shown that CQDs can be indirectly used to monitor the release of VEGF. In conclusion, the present monodisperse and controllable VEGF loaded microspheres with reproducible manner can be used for proteins-delivery in therapeutic and tissue engineering applications.
Conflicts of interest
There are no conflicts to declare.
Supplementary Material
Acknowledgments
The research reported in this paper was supported by Osteo Science Foundation through Peter Geistlich Award. The authors would like to thank the financial support from this foundation.
References
- Fu J. Wang D.-A. In Situ Organ-Specific Vascularization in Tissue Engineering. Trends Biotechnol. 2018;36(Issue 8):834–849. doi: 10.1016/j.tibtech.2018.02.012. [DOI] [PubMed] [Google Scholar]
- Yu H. et al., Improved tissue-engineered bone regeneration by endothelial cell mediated vascularization. Biomaterials. 2009;30:508–517. doi: 10.1016/j.biomaterials.2008.09.047. [DOI] [PubMed] [Google Scholar]
- Schmidmaier G. Capanna R. Wildemann B. Beque T. Lowenberg D. Bone morphogenetic proteins in critical-size bone defects: what are the options? Injury. 2009;40:S39–S43. doi: 10.1016/S0020-1383(09)70010-5. [DOI] [PubMed] [Google Scholar]
- Dimitriou R. Jones E. McGonagle D. Giannoudis P. V. Bone regeneration: current concepts and future directions. BMC Med. 2011;9:66. doi: 10.1186/1741-7015-9-66. [DOI] [PMC free article] [PubMed] [Google Scholar]
- Khan W. S. Rayan F. Dhinsa B. S. Marsh D. An osteoconductive, osteoinductive, and osteogenic tissue-engineered product for trauma and orthopaedic surgery: how far are we? Stem Cells Int. 2011:2012. doi: 10.1155/2012/236231. [DOI] [PMC free article] [PubMed] [Google Scholar]
- Hernigou P. Bone transplantation and tissue engineering, part III: allografts, bone grafting and bone banking in the twentieth century. Int. Orthop. 2015:1–11. doi: 10.1007/s00264-015-2669-y. [DOI] [PubMed] [Google Scholar]
- Aponte-Tinao L. A. Ayerza M. A. Muscolo D. L. Farfalli G. L. What Are the Risk Factors and Management Options for Infection After Reconstruction With Massive Bone Allografts? Clin. Orthop. Relat. Res. 2015:1–5. doi: 10.1007/s11999-015-4353-3. [DOI] [PMC free article] [PubMed] [Google Scholar]
- Vormoor B. et al., Development of a preclinical orthotopic xenograft model of ewing sarcoma and other human malignant bone disease using advanced in vivo imaging. PLoS One. 2014;9:e85128. doi: 10.1371/journal.pone.0085128. [DOI] [PMC free article] [PubMed] [Google Scholar]
- Ardakani A. G. Cheema U. Brown R. A. Shipley R. J. Quantifying the correlation between spatially defined oxygen gradients and cell fate in an engineered three-dimensional culture model. J. R. Soc., Interface. 2014;11:20140501. doi: 10.1098/rsif.2014.0501. [DOI] [PMC free article] [PubMed] [Google Scholar]
- Lenze U. et al., Influence of osteogenic stimulation and VEGF treatment on in vivo bone formation in hMSC-seeded cancellous bone scaffolds. BMC Musculoskeletal Disord. 2014;15:350. doi: 10.1186/1471-2474-15-350. [DOI] [PMC free article] [PubMed] [Google Scholar]
- Volkmer E. et al., Hypoxia in static and dynamic 3D culture systems for tissue engineering of bone. Tissue Eng., Part A. 2008;14:1331–1340. doi: 10.1089/ten.tea.2007.0231. [DOI] [PubMed] [Google Scholar]
- Tomanek R. J. Lotun K. Clark E. B. Suvarna P. R. Hu N. VEGF and bFGF stimulate myocardial vascularization in embryonic chick. Am. J. Physiol.: Heart Circ. Physiol. 1998;274:H1620–H1626. doi: 10.1152/ajpheart.1998.274.5.H1620. [DOI] [PubMed] [Google Scholar]
- Omidi M. Amoabediny G. Yazdian F. Habibi-Rezaei M. Protein-based nanobiosensor for direct detection of hydrogen sulfide. EPL. 2015;109:18005. doi: 10.1209/0295-5075/109/18005. [DOI] [Google Scholar]
- Chen R. R. Mooney D. J. Polymeric growth factor delivery strategies for tissue engineering. Pharm. Res. 2003;20:1103–1112. doi: 10.1023/A:1025034925152. [DOI] [PubMed] [Google Scholar]
- Lee J.-Y. et al., Enhanced bone formation by controlled growth factor delivery from chitosan-based biomaterials. J. Controlled Release. 2002;78:187–197. doi: 10.1016/S0168-3659(01)00498-9. [DOI] [PubMed] [Google Scholar]
- Simmons C. A. Alsberg E. Hsiong S. Kim W. J. Mooney D. J. Dual growth factor delivery and controlled scaffold degradation enhance in vivo bone formation by transplanted bone marrow stromal cells. Bone. 2004;35:562–569. doi: 10.1016/j.bone.2004.02.027. [DOI] [PubMed] [Google Scholar]
- Lee K. Silva E. A. Mooney D. J. Growth factor delivery-based tissue engineering: general approaches and a review of recent developments. J. R. Soc., Interface. 2011;8:153–170. doi: 10.1098/rsif.2010.0223. [DOI] [PMC free article] [PubMed] [Google Scholar]
- Holland T. A. Tabata Y. Mikos A. G. Dual growth factor delivery from degradable oligo (poly(ethylene glycol) fumarate) hydrogel scaffolds for cartilage tissue engineering. J. Controlled Release. 2005;101:111–125. doi: 10.1016/j.jconrel.2004.07.004. [DOI] [PubMed] [Google Scholar]
- Babensee J. E. McIntire L. V. Mikos A. G. Growth factor delivery for tissue engineering. Pharm. Res. 2000;17:497–504. doi: 10.1023/A:1007502828372. [DOI] [PubMed] [Google Scholar]
- Yu X. Khalil A. Dang P. N. Alsberg E. Murphy W. L. Multilayered inorganic microparticles for tunable dual growth factor delivery. Adv. Funct. Mater. 2014;24:3082–3093. doi: 10.1002/adfm.201302859. [DOI] [PMC free article] [PubMed] [Google Scholar]
- Mir M. Ahmed N. Rehman A. Recent applications of PLGA based nanostructures in drug delivery. Colloids Surf., B. 2017;159:217–231. doi: 10.1016/j.colsurfb.2017.07.038. [DOI] [PubMed] [Google Scholar]
- King T. W. Patrick Jr C. W. Development and in vitro characterization of vascular endothelial growth factor (VEGF)-loaded poly(d,l-lactic-co-glycolic acid)/poly(ethylene glycol) microspheres using a solid encapsulation/single emulsion/solvent extraction technique. J. Biomed. Mater. Res. 2000;51(3):383–390. doi: 10.1002/1097-4636(20000905)51:3<383::AID-JBM12>3.0.CO;2-D. [DOI] [PubMed] [Google Scholar]
- Sá C. M. G. Briuglia M. L. Niosi F. Lamprou D. A. Microfluidic manufacturing of phospholipid nanoparticles: stability, encapsulation efficacy, and drug release. Int. J. Pharm. 2017;516(1–2):91–99. doi: 10.1016/j.ijpharm.2016.11.025. [DOI] [PubMed] [Google Scholar]
- Maeki M. Kimura N. Sato Y. Harashima H. Tokeshi M. Advances in microfluidics for lipid nanoparticles and extracellular vesicles and applications in drug delivery systems. Adv. Drug Delivery Rev. 2018;128:84–100. doi: 10.1016/j.addr.2018.03.008. [DOI] [PubMed] [Google Scholar]
- Li W. Liu D. Zhang H. Correia A. Mäkilä E. Salonen J. Hirvonen J. Santos H. A. Microfluidic assembly of a nano-in-micro dual drug delivery platform composed of halloysite nanotubes and a pH-responsive polymer for colon cancer therapy. Acta Biomater. 2017;48:238–246. doi: 10.1016/j.actbio.2016.10.042. [DOI] [PubMed] [Google Scholar]
- Sanjay S. T. Zhou W. Dou M. Tavakoli H. Ma L. Xu F. Li X. J. Recent advances of controlled drug delivery using microfluidic platforms. Adv. Drug Delivery Rev. 2018;128:3–28. doi: 10.1016/j.addr.2017.09.013. [DOI] [PMC free article] [PubMed] [Google Scholar]
- Pessi J. Santos H. A. Miroshnyk I. Weitz D. A. Mirza S. Microfluidics-assisted engineering of polymeric microcapsules with high encapsulation efficiency for protein drug delivery. Int. J. Pharm. 2014;472(1–2):82–87. doi: 10.1016/j.ijpharm.2014.06.012. [DOI] [PubMed] [Google Scholar]
- Fix J. A. Oral controlled release technology for peptides: status and future prospects. Pharm. Res. 1996;13(12):1760–1764. doi: 10.1023/A:1016008419367. [DOI] [PubMed] [Google Scholar]
- Taluja A. Youn Y. S. Bae Y. H. Novel approaches in microparticulate PLGA delivery systems encapsulating proteins. J. Mater. Chem. 2007;17(38):4002–4014. doi: 10.1039/B706939A. [DOI] [Google Scholar]
- Grigoletto A. Anna M. Yoshioka H. Schiavon O. Pasut G. Covalent immobilisation of transglutaminase: stability and applications in protein PEGylation. J. Drug Targeting. 2017;25(9–10):856–864. doi: 10.1080/1061186X.2017.1363211. [DOI] [PubMed] [Google Scholar]
- Okur H. I. Jana H. Rembert K. B. Cho Y. Jan H. Dzubiella J. Cremer P. S. Jungwirth P. Beyond the Hofmeister series: Ion-specific effects on proteins and their biological functions. J. Phys. Chem. B. 2017;121(9):1997–2014. doi: 10.1021/acs.jpcb.6b10797. [DOI] [PubMed] [Google Scholar]
- Omidi M. Yadegari A. Tayebi L. Wound dressing application of pH-sensitive carbon dots/chitosan hydrogel. RSC Adv. 2017;7(18):10638–10649. doi: 10.1039/C6RA25340G. [DOI] [Google Scholar]
- Hassan M. Gomes V. G. Dehghani A. Ardekani S. M. Engineering carbon quantum dots for photomediated theranostics. Nano Res. 2018;11(1):1–41. doi: 10.1007/s12274-017-1616-1. [DOI] [Google Scholar]
- Wang Y. Hu A. Carbon quantum dots: synthesis, properties and applications. J. Mater. Chem. C. 2014;2(34):6921–6939. doi: 10.1039/C4TC00988F. [DOI] [Google Scholar]
- Nanobiotechnology: concepts, applications and perspectives, ed. Christof M. Niemeyer, and Chad A. Mirkin, John Wiley & Sons, vol. 1, 2004 [Google Scholar]
- Leslie-Barbick J. E. Moon J. J. West J. L. Covalently-immobilized vascular endothelial growth factor promotes endothelial cell tubulogenesis in poly(ethylene glycol) diacrylate hydrogels. J. Biomater. Sci., Polym. Ed. 2009;20(12):1763–1779. doi: 10.1163/156856208X386381. [DOI] [PubMed] [Google Scholar]
- Hashemi M. Yadegari A. Yazdanpanah G. Jabbehdari S. Omidi M. Tayebi L. Functionalized R9-reduced graphene oxide as an efficient nano-carrier for hydrophobic drug delivery. RSC Adv. 2016;6(78):74072–74084. doi: 10.1039/C6RA13822E. [DOI] [Google Scholar]
- Shen X. Li T. Chen Z. Geng Y. Xie X. Li S. Yang H. Wu C. Liu Y. Luminescent/magnetic PLGA-based hybrid nanocomposites: a smart nanocarrier system for targeted codelivery and dual-modality imaging in cancer theranostics. Int. J. Nanomed. 2017;12:4299. doi: 10.2147/IJN.S136766. [DOI] [PMC free article] [PubMed] [Google Scholar]


