Abstract
To study the effects of polyethylene glycol (PEG) content on the mechanical properties and degradation of silk fibroin, nano-hydroxyapatite, and PEG (SF/nHAP/PEG) electrospun scaffolds, and according to the PEG ratio in the scaffold (SF : nHAP : PEG), test groups were divided as follows: PEG-0 (10 : 2), PEG-0.5 (10 : 2 : 0.5), PEG-1 (10 : 2 : 1), and PEG-2 (10 : 2 : 2). A series of tests to determine the mechanical properties, degradation rates, and osteogenic characteristics was undertaken. PEG facilitated SF degradation (PEG-1 > PEG-0.5 > PEG-0 > PEG-2), and the mass loss of the scaffolds in PEG-1 was more than 30%, while in PEG-2 it was less than 20% after 8 days (P < 0.05). The addition of PEG strengthened the mechanical properties of the scaffold (PEG-1 > PEG-2 > PEG-0.5 > PEG-0), as the Young's modulus increased from 41.72 ± 3.40 MPa for PEG-0 to 76.12 ± 3.73 MPa for PEG-1 (P < 0.05). PEG was favorable for the osteogenic differentiation of BMSCs (PEG-0.5 > PEG-1 > PEG-2 > PEG-0). The enhancements were attributable to the increased hydrophilicity and nHAP dispersion, as well as to the secondary structure transformation of SF. The PEG content was deemed to be optimal when the SF/nHAP/PEG ratio was equal to 10 : 2 : 1.
The modification of the mechanical and degradation properties of a SF scaffold combined with PEG and nHAP is demonstrated.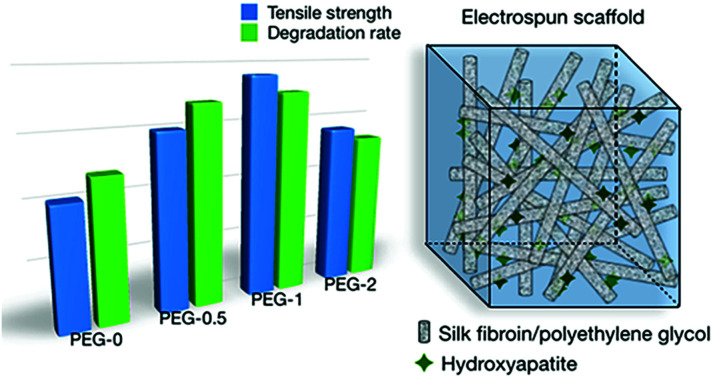
Introduction
Bone is a frequently transplanted tissue due to its high rates of trauma, tumors and malformations, and it is quite difficult to regenerate spontaneously if the defect exceeds a certain range.1 Bone tissue engineering (BTE) has become common in bone regeneration research due to its controllable and stable performance.2 BTE scaffolds require sufficient mechanical strength, good biocompatibility, and a proper degradation rate.3
Silk fibroin (SF) has been widely used in BTE research,4,5 but its lack of mechanical strength and long period of degradation limit its clinical applications in bone regeneration.6 Promoting the protein's secondary structure transformation, especially an increase in the β-sheet structure of SF, will improve its mechanical strength,7,8 but inhibits its degradation at the same time.9,10 Adding 20 wt% nano-hydroxyapatite (nHAP) into SF scaffolds results in better mechanical properties and even osteoconduction.5,11,12 A study has shown that the combination of SF and nHAP facilitates the osteogenic differentiation of human mesenchymal stem cells in vitro and repairs bone defects in vivo.13 Yet, the nHAP also delays the degradation of the blended scaffold and tends to aggregate in SF solution.14 Thus, the question arises as to how the SF scaffold can be strengthened, but not at the cost of prolonging its degradation rate. It seems that modifying the content of SF/nHAP scaffolds with certain chemical agents might be a possible way to effectively adjust their degradation rate, while maintaining the mechanical properties of the whole structure.
Polyethylene glycol (PEG), a hydrophilic, non-toxic, and degradable polymer, has been widely used as a dispersant and drug delivery material.15 It has been suggested that PEG improves the degradation rate of PCL and gelatin scaffolds and facilitates cell adhesion by improving the hydrophilicity of the blend scaffolds.16,17 PEG is also able to disperse nHAP and prevent it from aggregating,18,19 and alter the fiber structure and the tensile distribution as well.15 Previous studies have suggested that adding PEG into SF scaffolds will result in better hydrophilicity and cell activity.20,21
Here we report on our study into SF scaffold preparation combined with the use of PEG and nHAP, which sheds light on the modification of the scaffold material in BTE with improved mechanical properties, biocompatibility, and degradation properties.
Materials and methods
Preparation of regenerated silk fibroin
The SF extraction was carried out according to a procedure described in a previous study.22Bombyx mori silkworm cocoons (Chuang-sai Biotech, Guangzhou, China) were boiled in an aqueous solution of 0.02 M Na2CO3 for 30 min and rinsed to remove sericin. This step was repeated three times, followed by dissolution of the degummed silk in 9.3 M LiBr at 60 °C, yielding a 20% (w/v) solution. The solution was dialyzed (Sigma-Aldrich, St. Louis, MO, USA) for 3 days and then lyophilized in readiness for use.
Electrospinning
SF was dissolved in hexafluoroisopropanol (HFIP, Aladdin, Shanghai, China) and stirred for 2 h to obtain solution A of 7 wt%. By the addition of PEG (MW = 20 000, Aladdin, Shanghai, China) and nHAP (average size of 20–100 nm, Hualan, Shanghai, China) to the HFIP, which was then dispersed by sonication and stirring, solution B was prepared. Solutions A and B were mixed (A : B = 5 : 2) to obtain the final electrospinning solution. SF/nHAP/PEG blended electrospinning solutions were grouped according to their PEG contents: PEG-0 (SF : nHAP = 10 : 2), PEG-0.5 (SF : nHAP : PEG = 10 : 2 : 0.5), PEG-1 (SF : nHAP : PEG = 10 : 2 : 1), and PEG-2 (SF : nHAP : PEG = 10 : 2 : 2). Electrospinning was performed by means of a syringe with an inner diameter of 0.86 mm at the tip and a constant flow rate of 2.5 mL h−1. The voltage was kept at 22 kV, and the distance between the capillary tube and the collection roller was set at 15 cm. After electrospinning, all scaffolds were treated with 100% ethanol for 30 min to render the SF undissolved.
Characterization of the hybrid scaffolds
The surface morphology of the electrospun scaffolds was analyzed with a Nova NanoSEM 430 system (FEI, Eindhoven, The Netherlands) at an accelerating voltage of 10 kV. Twenty fibers of each scaffold were selected randomly, and their diameters were measured with Image J software (NIH, Bethesda, MD, USA). The data from attenuated total reflectance-Fourier transform infrared spectroscopy (ATR-FTIR; Vertex 70, Bruker, Ettlingen, Germany) were gathered in absorbance mode within the spectral range from 4000 cm−1 to 400 cm−1, and processed with Omnic software (Thermo, Madison, WI, USA). The secondary structure of SF was analyzed by Fourier self-deconvolution (FSD),23 which was performed in the amide I region (1595–1705 cm−1) with a half-bandwidth of 28 cm−1 and a noise reduction factor of 3. The fitting results were identified by spectral band, and the relative contents of random coils, α-helixes, β-turns, and β-sheets were calculated.24 The hydrophilicity of the scaffolds was analyzed by contact angle measurements in contact angle apparatus (Dataphysics, Filderstadt, Germany).
Mechanical properties of the hybrid scaffolds
The scaffolds were tested according to ASTM D882 (ref. 23) by means of a CMT5504 universal testing machine (SANS, Guangdong, China). Each sample was 10 mm in width and 50 mm in length. The test was performed at a speed of 50 mm min−1 at room temperature with a load cell capacity of 50 N. The Young's modulus, tensile strength, and maximum strain were measured.
Degradation of the hybrid scaffolds
Protease XIV from Streptomyces griseus (Sigma) was dissolved in PBS (pH 7.4) to prepare an enzyme solution (0.1 U mL−1).25 The electrospun scaffolds were cut into squares (2.5 cm × 2.5 cm) and immersed in the enzyme solution at 37 °C. The enzyme solution was changed daily, and after 2, 4, 6, and 8 days, 3 specimens in each group were removed and lyophilized. Each specimen was weighed before (W0) and after (Wt) degradation and investigated by macro-observations, SEM, and FTIR.
Mesenchymal stem cell isolation and expansion
Bone marrow mesenchymal stem cells (BMSCs) were obtained from the femurs and tibias of 4 week-old male Sprague-Dawley (SD) rats.26 Bone marrow was flushed out and suspended in DMEM/F12 supplemented with 10% FBS and 1% Pen-Strep. The cells were incubated at 37 °C in a 95% humidified atmosphere with 5% CO2. After 24 h, the BMSCs adhered to the flask, while hemopoietic cells remaining in suspension were removed. The cells from passage 4 were used in the study. Cell-culture-related reagents used were obtained from Gibco (Carlsbad, CA, USA).
Cell adhesion and proliferation assays
The scaffolds were cut into ϕ10 mm disks and sterilized under ultraviolet light for 30 min. After being rinsed three times with sterile PBS, the scaffolds were transferred to cell culture plates (Corning, NY, USA). BMSCs were seeded at a density of 2 × 10⁴ cells per mL on pre-wetted electrospun scaffolds. The activity of the adherent cells was assessed by means of a CCK-8 kit (Beyotime, Shanghai, China) after 2, 4, and 6 h for the cell attachment assay and after 1, 4, and 7 days for the proliferation assays. After 3 days of culture, the morphology of the BMSCs on the scaffolds was observed by confocal laser scanning microscopy (LSM800, Zeiss, Jena, Germany). The samples were routinely washed and fixed, then permeabilized with 0.5% Triton X-100 for 10 min at room temperature and stained with DAPI and Actin-Tracker Green (Beyotime).
Alkaline phosphatase (ALP) activity of the BMSCs
After 7 and 14 days, BMSCs on all scaffolds were assayed for ALP activity. The samples were washed three times with PBS, permeabilized with 1% Triton X-100 for 10 min on ice, and centrifuged to obtain the supernatant. The total amount of intracellular protein was measured by means of a BCA Protein Assay Kit (Beyotime), and the ALP activity by an ALP Assay Kit (Beyotime). The results were expressed as p-nitrophenol (μmol) produced per min per mg of total protein.
Real-time quantitative PCR
After 7 and 14 days of culture, an RNeasy Mini kit (Qiagen, Hilden, Germany) was used to extract mRNA from the cells. The mRNA was reverse-transcribed by means of a PrimeScript RT reagent kit (TaKaRa, Japan) to obtain cDNA, which was detected with FS Essential DNA Green Master (Roche, Mannheim, Germany) in a Roche L96 system. The relative expression levels of ALP, Runx-2, and Col-1 were calculated and quantified with the 2−ΔΔCt method. The primers used in the experiment are shown in Table 1.
Primer sequences used for real-time PCR.
| Gene | Primer sequence |
|---|---|
| ALP | F: 5′-TGCAGGATCGGAACGTCAAT-3′ |
| R: 5′-GAGTTGGTAAGGCAGGGTCC-3′ | |
| Runx-2 | F: 5′-AGTGCGGTGCAAACTTTCTC-3′ |
| R: 5′-TTTGACGCCATAGTCCCTCC-3′ | |
| Col-1 | F: 5′-GATGGACTCAACGGTCTCCC-3′ |
| R: 5′-CGGCCACCATCTTGAGACTT-3′ | |
| GAPDH | F: 5′-AGTGCCAGCCTCGTCTCATA-3′ |
| R: 5′-GATGGTGATGGGTTTCCCGT-3′ |
Statistics
Differences between groups and the control were analyzed with one-way ANOVA (except for the degradation test, where repeated-measures ANOVA was used), followed by the Bonferroni post hoc test. Statistical analyses were performed with SPSS 22.0 (IBM, NY, USA) and GraphPad Prism. Differences and parameters were considered statistically significant at the level of 0.05.
Results
Surface morphology of the scaffolds
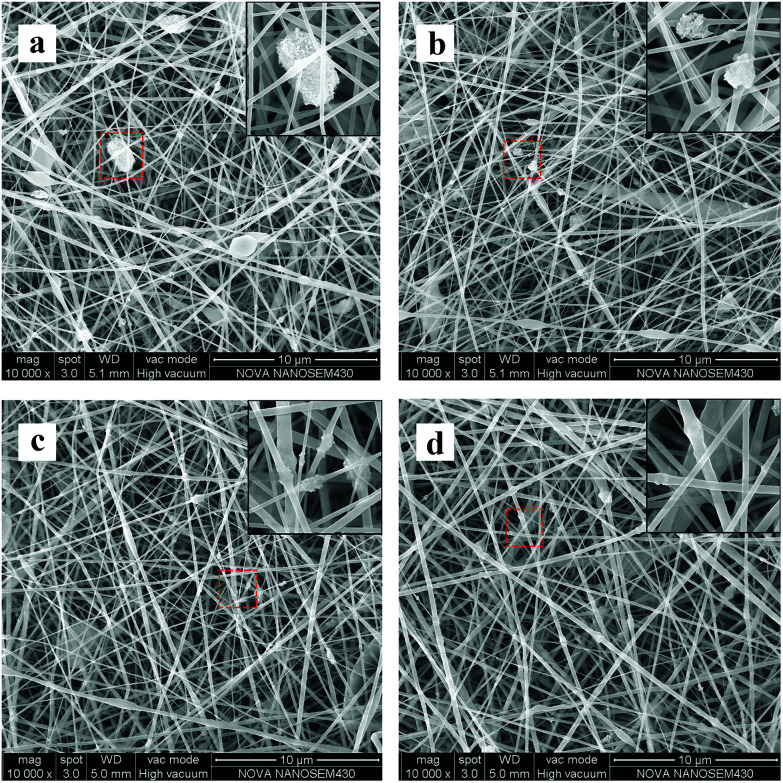
The nanofibrous and porous structures, observed in all four groups, were composed of uniform and dense fibers with HAP particles embedded, and the diameter of the fibers in the PEG-0.5, PEG-1, and PEG-2 scaffolds was close to that of the fibers in the PEG-0 scaffold (Fig. 1 and Table 2). The extent of nHAP aggregation decreased with increasing PEG content: the HAP particles were generally small and embedded in PEG-2, but were larger with more exposure in PEG-1 and PEG-0.5, while most of the particles hung onto the superficial surfaces of the fibers and were distributed unequally in the PEG-0 group.
Fig. 1. SEM images of the scaffold surface morphology with different PEG ratios: (a) PEG-0, (b) PEG-0.5, (c) PEG-1, and (d) PEG-2.
Sizes of the scaffold fibers (nm).
| PEG-0 | PEG-0.5 | PEG-1 | PEG-2 | |
|---|---|---|---|---|
| ϕ ± SD | 258.69 ± 44.31 | 231.24 ± 50.14 | 261.20 ± 58.11 | 288.39 ± 68.82 |
Composition analysis of the scaffolds
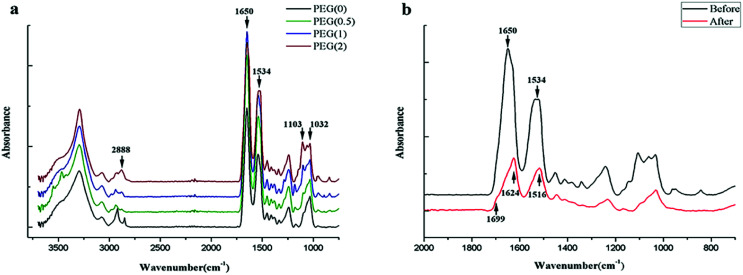
The absorption peaks of the FTIR spectra at 1032 cm−1 of PO43− showed the presence of nHAP, and the peak heights at 1103 cm−1 and 2888 cm−1 indicated the different contents of PEG in the blended scaffolds (Fig. 2a). The absorption peaks at 1534 cm−1 (amide II) and 1650 cm−1 (amide I) indicated that SF in all scaffolds was composed mainly of random coil structures before ethanol treatment. The secondary conformational transition of SF after ethanol treatment was indicated by the characteristic absorption peaks at 1516 cm−1, 1624 cm−1, and 1699 cm−1 (Fig. 2b). The content of β-sheets in SF increased gradually as the amount of PEG increased in the sequence PEG-0 < PEG-0.5 < PEG-1 < PEG-2 (Table 3).
Fig. 2. Composition analysis of the scaffolds: (a) electrospun scaffolds with different PEG content before ethanol treatment; and (b) the absorbance peak changes of PEG-1 after ethanol treatment.
Conformation analysis of SF in various groups after ethanol treatment, using the amide I band (1595–1705 cm−1)a.
| Conformation (%) | PEG-0 | PEG-0.5 | PEG-1 | PEG-2 |
|---|---|---|---|---|
| β-Sheet | 31.01 ± 0.31 | 37.68 ± 0.56* | 44.45 ± 1.13* | 50.71 ± 0.26* |
| Random coil | 22.53 ± 1.08 | 16.92 ± 2.40 | 20.14 ± 2.39 | 16.52 ± 1.49* |
| α-Helix | 14.96 ± 1.37 | 15.73 ± 1.96 | 11.23 ± 2.26 | 8.35 ± 1.60* |
| β-Turn | 31.50 ± 1.97 | 29.67 ± 4.80 | 24.17 ± 5.76 | 24.41 ± 3.31 |
*P < 0.05 (n = 3).
Mechanical strength of the scaffolds
The Young's modulus increased from 41.72 ± 3.40 MPa for PEG-0 to 76.12 ± 3.73 MPa for PEG-1, and decreased to 56.47 ± 1.42 MPa for PEG-2, while the tensile strength increased from 0.67 ± 0.12 MPa for PEG-0 to 1.71 ± 0.70 MPa for PEG-1, and also decreased to 1.57 ± 0.11 MPa for PEG-2 (Fig. 3). In comparison, the maximum strain showed a monotonically increasing trend with increasing PEG content, corresponding to the degree of scaffold deformation under tension.
Fig. 3. Mechanical strength of the electrospun scaffolds: (a) Young's modulus, (b) tensile strength, and (c) maximum strain. *P < 0.05 (n = 3).
Morphology examination after degradation of the electrospun scaffolds
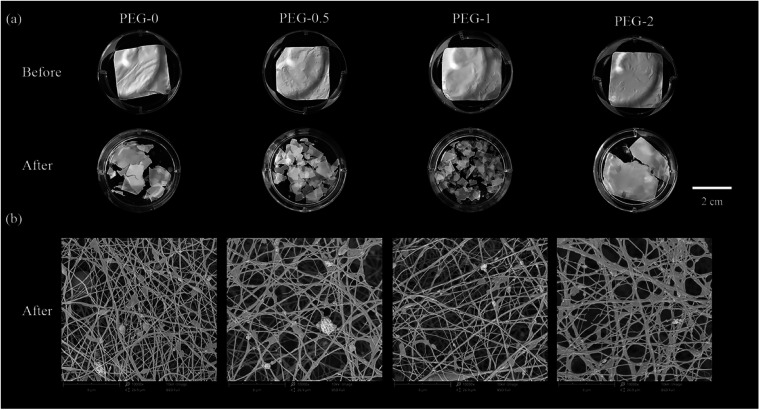
After 8 days, the scaffolds in all groups broke apart to various degrees from mild to severe in the order of PEG-2 < PEG-0 < PEG-0.5 < PEG-1 (Fig. 4a). Accordingly, the fibers in the scaffolds became more sparse after degradation, and PEG-1 lost the most fibers (Fig. 4b). The degradation of the scaffolds increased not totally parallel to the PEG concentration in them, as the maximum occurred in group PEG-1 and then the degradation fell even though the PEG concentration further rose.
Fig. 4. Morphology before and after 8 days of degradation: (a) macro-observations of the scaffolds; and (b) SEM images of the scaffolds after 8 days of degradation.
Mass test and composition analysis after degradation of the scaffolds
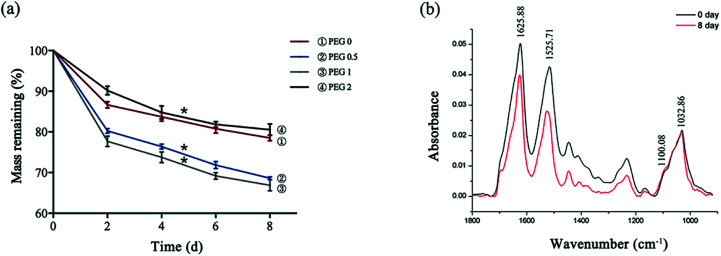
The scaffolds lost weight during degradation, the mass loss of PEG-0 to PEG-1 was proportional to the PEG content, and the loss of PEG-1 was calculated to be more than 30%. PEG-2, however, showed much lower degradation (Fig. 5a). With the nearly non-degradable nHAP as the control, the change in the SF peak height of the FTIR spectrum of PEG-1 showed that the scaffold degradation was mostly mediated by damage to SF (Fig. 5b).
Fig. 5. Scaffold degradation: (a) mass loss of the scaffolds after 2, 4, 6, and 8 days of degradation (*P < 0.05, n = 3); and (b) FTIR spectra of PEG-1 before and after degradation.
Hydrophilic properties
All scaffolds had good hydrophilic properties, with the contact angle less than 90°. The angle decreased with increasing PEG content (Fig. 6).
Fig. 6. Contact angle of the electrospun scaffolds: (a) PEG-0, (b) PEG-0.5, (c) PEG-1, and (d) PEG-2.
Cell adhesion and proliferation
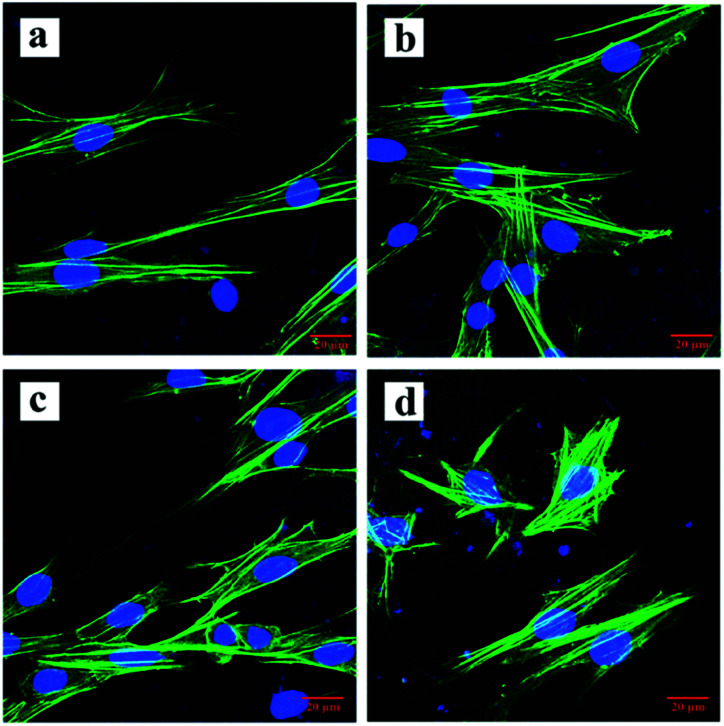
After 2, 4, and 6 h of cell culture, no differences in cell activity among the groups were found (P > 0.05, Fig. 7a). After 3 days of culture, the cells in each group adhered to the scaffolds and were spindle-shaped with extending pseudopods (Fig. 8). Cell proliferation in all groups increased over time, but the increasing rate in the PEG-2 group was lower than that in the other groups (Fig. 7b).
Fig. 7. Cell adhesion and proliferation: (a) cell adhesion shortly after seeding; and (b) cell proliferation during culturing (*P < 0.05, n = 4).
Fig. 8. CLSM images of cells on each scaffold: (a) PEG-0, (b) PEG-0.5, (c) PEG-1, and (d) PEG-2.
Cell differentiation
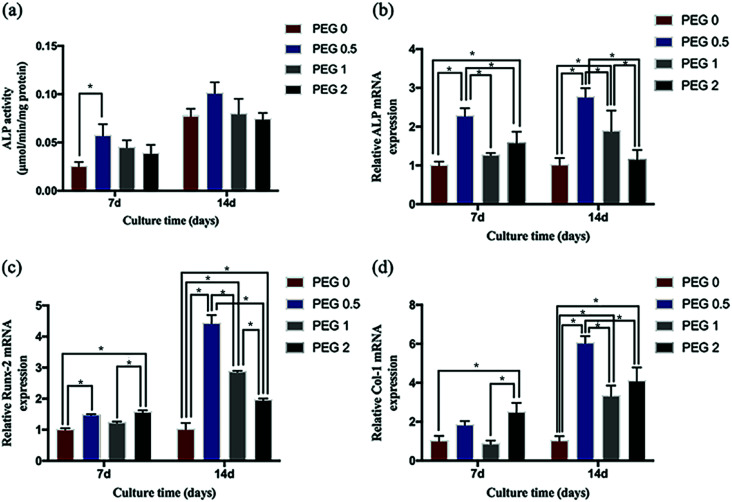
In general, the cells' ALP activity increased over time during culture, but only in the PEG-0.5 group at 7 days of culture was it more evident than in the control (Fig. 9a). The expression of ALP, Col-1, and Runx-2 also increased over time during culture, and the highest differentiation activity was observed in the PEG-0.5 group (Fig. 9b–d).
Fig. 9. Cell differentiation testing: (a) ALP activity after 7 and 14 days of culturing (*P < 0.05, n = 4); and the relative expression of (b) ALP, (c) Col-1, and (d) Runx-2 after 7 and 14 days of culturing (*P < 0.05, n = 3).
Discussion
Silk fibroin has been widely used in BTE research, and adding nHAP into SF enhances the mechanical properties of the scaffold and facilitates the osteogenic differentiation of BMSCs. Yet, the nHAP itself also delays the degradation of the blend scaffold and tends to aggregate. It is quite difficult to adjust the strength and biodegradability of the SF scaffold with nanoparticles of HA at the same time.
Since PEG could improve the degradation rate of PCL and gelatin scaffolds16,17 and is able to disperse nHAP and prevent it from aggregating,18,19 altering the fiber structure and the tensile distribution as well,15 it is plausible to introduce both PEG and nHAP into SF scaffolds to compensate and improve the blend scaffold's properties.
In our results, the content of β-sheets in SF increased as the amount of PEG increased. Studies have found that the recrystallization of PEG in SF/PEG scaffolds promotes the secondary structure transformation of SF from random coils and α-helixes to β-sheets.27 It has been suggested that when the protein secondary structure transformation is increased, especially the β-sheet structure of SF, the mechanical strength will be improved.28,29 The enhancement of the scaffold's mechanical strength was also deemed to be attributable to the dispersion capability of PEG to nHAP. nHAP could improve the compressive strength of the scaffolds. However, if the nanoparticles aggregate to a certain dimension relative to the diameter of the fibers, they might function as discontinuities among the fibers during stretching. Since PEG is a good dispersant, it was hypothesized that the nHAP could be coated with PEG due to the low friction coefficient and good hydrophilicity of PEG.30 In the present results, adding PEG into the scaffold reduced the contact angle and rendered the scaffold hydrophilic. By microscopy, we also found that the extent of nHAP aggregation decreased with increasing PEG content in the scaffolds. PEG might thus act as an encapsulating agent to inhibit nHAP aggregation. It was suggested that PEG alone could largely, if not entirely, improve the scaffold in the presence of nHAP with respect to mechanical properties.
In the present results, we also found that neither the Young's modulus nor tensile strength was a monotonically increasing function of PEG content, and their inflection points occurred as the PEG content changed from PEG-1 to PEG-2. Since PEG is able to prevent HAP from aggregating, adding too much PEG allowed the nHAP to disperse homogenously in the SF fibers, and nHAP acted as a fiber filler, which might essentially alter the fiber structure as well as the tensile distribution.15,31 The space around the nHAP particles could expand easily, thus weakening the tensile strength of the fibers. Our results suggest that the proportion of SF : nHAP : PEG should be 10 : 2 : 1.
Not only the mechanical properties, but also the degradation rate of the SF scaffold was a major concern in the present study. In our results, the SF scaffold lost mass, primarily in the PEG-1 group, and broke into pieces macroscopically. FTIR showed that the degradation was mostly mediated by damage to the SF. The degradation of SF is mainly mediated by hydrolysis and our results suggested that the hydrophilicity of the scaffolds increased with the addition of PEG due to its super hydrophilicity, which confirms that hydrophilicity should be one of the basic properties of the scaffolds.6 On the contrary, since the addition of PEG gives rise to increased β-sheet content, and dense and stable β-sheet structures can inhibit hydrolysis, the PEG-2 group, with the most PEG content in this study, showed the least loss of mass. In comparison, PEG-1 was the study group with the most random coils, and proteins with random coils are looser and allow water molecules to enter more easily for the initiation of hydrolysis.32,33 The results suggested, again, that appropriate PEG content, SF : nHAP : PEG at 10 : 2 : 1 in our study, would improve the degradation of the SF scaffold.
Under SEM, the scaffolds after degradation became cracked and less dense, and the pores of the scaffold became larger and more numerous. This change could be beneficial for initial cell adhesion and proliferation and for cell ingrowth into the scaffold, as shown in the results. Again, cell adhesion and proliferation were found to fit into the scaffold of PEG-1, but not that of PEG-2. It has been suggested that scaffolds are conducive to cell adhesion when the contact angle ranges from 40° to 60°,34,35 and the water contact angle of the PEG-2 group was outside that range.
In the present study design, nHAP should not only strengthen the mechanical structure of the SF scaffolds but also facilitate their osteogenic properties. The results of cell differentiation showed that the PEG-0.5 group seemed to be favorable to osteogenic differentiation. It is well-known that HAP facilitates the osteogenic differentiation of surrounding stem cells, yet it depends on the exposure amount of HAP.36,37 In our test group results, the dispersion of nHAP was closely related to the PEG content in the scaffolds. The nHAP particles dispersed homogenously into the SF fibers and embedded in them like a filler, corresponding to the increasing content of PEG. The nHAP particles seemed very likely to aggregate, and formed bigger ‘crumbs’ protruding from the surfaces of the SF fibers, since the PEG content was not sufficient to disperse nHAP in the PEG-0.5 test group. In that case, the PEG-0.5 group provided much more HAP contact size exposure for the surrounding adhering cells, and thus positively affected the osteogenic differentiation of the cells.
In terms of mechanical and degradation advantages, as well as the cost of osteogenic differentiation, it is suggested that the PEG content in the PEG-1 group was deemed optimal in the presence of nHAP in the SF scaffolds.
Conclusions
The combination of both nHAP and PEG in SF scaffolds can form a stable hybrid system. The addition of an appropriate amount of PEG alters the SF structure and disperses nHAP homogenously into the SF fibers, strengthening the mechanical properties in the presence of nHAP, and facilitating degradation. The presence of PEG is also beneficial for cell adhesion, proliferation and ingrowth into the scaffolds. However, too much PEG prevents nHAP from aggregating and protruding from the fiber surface, which is disadvantageous for the osteogenic differentiation of HAP. The PEG content is deemed to be optimal at an SF/nHAP/PEG ratio equal to 10 : 2 : 1.
Conflicts of interest
There are no conflicts to declare.
Supplementary Material
Acknowledgments
This work was supported by the National Natural Science Foundation of China under Grant No. 81771110, 51673131, and 51573215.
Notes and references
- Liu Y. Lim J. Teoh S. H. Biotechnol. Adv. 2013;31:688–705. doi: 10.1016/j.biotechadv.2012.10.003. [DOI] [PubMed] [Google Scholar]
- Amini A. R. Laurencin C. T. Nukavarapu S. P. Crit. Rev. Bioeng. 2012;40:363–408. doi: 10.1615/critrevbiomedeng.v40.i5.10. [DOI] [PMC free article] [PubMed] [Google Scholar]
- Bose S. Roy M. Bandyopadhyay A. Trends Biotechnol. 2012;30:546–554. doi: 10.1016/j.tibtech.2012.07.005. [DOI] [PMC free article] [PubMed] [Google Scholar]
- Melke J. Midha S. Ghosh S. Ito K. Hofmann S. Acta Biomater. 2016;31:1–16. doi: 10.1016/j.actbio.2015.09.005. [DOI] [PubMed] [Google Scholar]
- Farokhi M. Mottaghitalab F. Samani S. Shokrgozar M. A. Kundu S. C. Reis R. L. Fatahi Y. Kaplan D. L. Biotechnol. Adv. 2018;36:68–91. doi: 10.1016/j.biotechadv.2017.10.001. [DOI] [PubMed] [Google Scholar]
- Wang Y. Rudym D. D. Walsh A. Abrahamsen L. Kim H. J. Kim H. S. Kirker-Head C. Kaplan D. L. Biomaterials. 2008;29:3415–3428. doi: 10.1016/j.biomaterials.2008.05.002. [DOI] [PMC free article] [PubMed] [Google Scholar]
- Ha S. W. Tonelli A. E. Hudson S. M. Biomacromolecules. 2005;6:1722–1731. doi: 10.1021/bm050010y. [DOI] [PubMed] [Google Scholar]
- Paşcu E. I. Cahill P. A. Stokes J. McGuinness G. B. J. Biomater. Appl. 2016;30:1334–1349. doi: 10.1177/0885328215626047. [DOI] [PubMed] [Google Scholar]
- Shang K. Rnjak-Kovacina J. Lin Y. Hayden R. S. Tao H. Kaplan D. L. JAMA Ophthalmol. 2013;131(5):676. doi: 10.1001/jamaophthalmol.2013.4319. [DOI] [PMC free article] [PubMed] [Google Scholar]
- Lu Q. Hu X. Wang X. Kluge J. A. Lu S. Cebe P. Kaplan D. L. Acta Biomater. 2010;6:1380–1387. doi: 10.1016/j.actbio.2009.10.041. [DOI] [PMC free article] [PubMed] [Google Scholar]
- Kim H. Che L. Ha Y. Ryu W. Mater. Sci. Eng., C. 2014;40:324–335. doi: 10.1016/j.msec.2014.04.012. [DOI] [PubMed] [Google Scholar]
- Niu B. Li B. Gu Y. Shen X. Liu Y. Chen L. J. Biomater. Sci., Polym. Ed. 2017;28:257–270. doi: 10.1080/09205063.2016.1262163. [DOI] [PubMed] [Google Scholar]
- Ko E. Lee J. S. Kim H. Yang S. Y. Yang D. Yang K. Lee J. Shin J. Yang H. S. Ryu W. Cho S. W. ACS Appl. Mater. Interfaces. 2018;10:7614–7625. doi: 10.1021/acsami.7b03328. [DOI] [PubMed] [Google Scholar]
- Wang Q. Zhang Y. Li B. Chen L. J. Mater. Chem. B. 2017;5:6963–6972. doi: 10.1039/C7TB00949F. [DOI] [PubMed] [Google Scholar]
- Knop K. Hoogenboom R. Fischer D. Schubert U. S. Angew. Chem., Int. Ed. Engl. 2010;49:6288–6308. doi: 10.1002/anie.200902672. [DOI] [PubMed] [Google Scholar]
- Koupaei N. Karkhaneh A. Daliri Joupari M. J. Biomed. Mater. Res., Part A. 2015;103:3919–3926. doi: 10.1002/jbm.a.35513. [DOI] [PubMed] [Google Scholar]
- Zhou N. Liu C. Lv S. Sun D. Qiao Q. Zhang R. Liu Y. Xiao J. Sun G. J. Biomed. Mater. Res., Part A. 2016;104:3149–3156. doi: 10.1002/jbm.a.35847. [DOI] [PubMed] [Google Scholar]
- Tseng Y.-H. Kuo C.-S. Li Y.-Y. Huang C.-P. Mater. Sci. Eng., C. 2009;29:819–822. doi: 10.1016/j.msec.2008.07.028. [DOI] [Google Scholar]
- Jegatheeswaran S. Sundrarajan M. Mater. Sci. Eng., C. 2015;51:174–181. doi: 10.1016/j.msec.2015.02.012. [DOI] [PubMed] [Google Scholar]
- Kweon H. Yeo J.-h. Lee K.-g. Lee H. C. Na H. S. Won Y. H. Cho C. S. Biomed. Mater. 2008;3:034115. doi: 10.1088/1748-6041/3/3/034115. [DOI] [PubMed] [Google Scholar]
- Acharya C. Kumary T. V. Ghosh S. K. Kundu S. C. J. Biomater. Sci., Polym. Ed. 2009;20:543–565. doi: 10.1163/156856209X426385. [DOI] [PubMed] [Google Scholar]
- Rockwood D. N. Preda R. C. Yucel T. Wang X. Lovett M. L. Kaplan D. L. Nat. Protoc. 2011;6:1612–1631. doi: 10.1038/nprot.2011.379. [DOI] [PMC free article] [PubMed] [Google Scholar]
- Kim H. H. Park J. B. Kang M. J. Park Y. H. Int. J. Biol. Macromol. 2014;70:516–522. doi: 10.1016/j.ijbiomac.2014.06.052. [DOI] [PubMed] [Google Scholar]
- Nisal A. Sayyad R. Dhavale P. Khude B. Deshpande R. Mapare V. Shukla S. Venugopalan P. Sci. Rep. 2018;8:7235. doi: 10.1038/s41598-018-25643-x. [DOI] [PMC free article] [PubMed] [Google Scholar]
- Li M. Ogiso M. Minoura N. Biomaterials. 2003;24:357–365. doi: 10.1016/S0142-9612(02)00326-5. [DOI] [PubMed] [Google Scholar]
- Yoshimura H. Muneta T. Nimura A. Yokoyama A. Koga H. Sekiya I. Cell Tissue Res. 2006;327:449–462. doi: 10.1007/s00441-006-0308-z. [DOI] [PubMed] [Google Scholar]
- Chen C. Yao T. Tu S. Xu W. Han Y. Zhou P. Phys. Chem. Chem. Phys. 2016;18:16353–16360. doi: 10.1039/C6CP03314H. [DOI] [PubMed] [Google Scholar]
- Keten S. Xu Z. Ihle B. Buehler M. J. Nat. Mater. 2010;9:359–367. doi: 10.1038/nmat2704. [DOI] [PubMed] [Google Scholar]
- Gosline J. M. Guerette P. A. Ortlepp C. S. Savage K. N. J. Exp. Biol. 1999;202:3295–3303. doi: 10.1242/jeb.202.23.3295. [DOI] [PubMed] [Google Scholar]
- Palanivelu R. Mary Saral A. Ruban Kumar A. Spectrochim. Acta, Part A. 2014;131:37–41. doi: 10.1016/j.saa.2014.04.014. [DOI] [PubMed] [Google Scholar]
- Wang M. Bonfield W. Biomaterials. 2001;22:1311–1320. doi: 10.1016/S0142-9612(00)00283-0. [DOI] [PubMed] [Google Scholar]
- Numata K. Cebe P. Kaplan D. L. Biomaterials. 2010;31:2926–2933. doi: 10.1016/j.biomaterials.2009.12.026. [DOI] [PMC free article] [PubMed] [Google Scholar]
- Brown J. Lu C. L. Coburn J. Kaplan D. L. Acta Biomater. 2015;11:212–221. doi: 10.1016/j.actbio.2014.09.013. [DOI] [PMC free article] [PubMed] [Google Scholar]
- Yang Y. Qiu X. Sun Y. Wang Y. Wang J. Li Y. Liu C. R. Soc. Open Sci. 2018;5:170868. doi: 10.1098/rsos.170868. [DOI] [PMC free article] [PubMed] [Google Scholar]
- Arima Y. Iwata H. Biomaterials. 2007;28:3074–3082. doi: 10.1016/j.biomaterials.2007.03.013. [DOI] [PubMed] [Google Scholar]
- Scheinpflug J. Pfeiffenberger M. Damerau A. Schwarz F. Textor M. Lang A. Schulze F. Genes. 2018;9:247. doi: 10.3390/genes9050247. [DOI] [PMC free article] [PubMed] [Google Scholar]
- Wu X. Miao L. Yao Y. Sun W. Wu W. Liu Y. Chen X. Int. J. Nanomed. 2014;9:4135–4143. doi: 10.2147/IJN.S65272. [DOI] [PMC free article] [PubMed] [Google Scholar]


