Abstract
A lipid bilayer containing a ternary mixture of low- and high-melting lipids and cholesterol (Chol) can give rise to domain formation, referred to as lipid rafts. Low-frequency Raman spectroscopy at reduced temperatures allows detection of normal membrane mechanical vibrations. In this work, Raman spectra were obtained in the spectral range between 5 and 90 cm−1 for bilayers prepared from dioleoyl-glycero-phosphocholine (DOPC), dipalmitoyl-glycero-phosphocholine (DPPC) and Chol. A narrow peak detected between 13 and 16 cm−1 was attributed to the vibrational eigenmode of a lipid monolayer (a leaflet). For the equimolar DOPC/DPPC ratio, the Chol concentration dependence for the peak position, width and amplitude may be divided into three distinct ranges: below 9 mol%, the intermediate range between 9 mol% and 38 mol%, and above 38 mol%. In the intermediate range the peak position attains its minimum, and the peak width drops approximately by a factor of two as compared with the Chol-free bilayers. Meanwhile, this range is known for raft formation in a fluid state. The obtained results may be interpreted as evidence that bilayer structures in the raft-containing fluid state may be frozen at low temperatures. The drop of peak width indicates that at the spatial scale of the experiment (∼2.5 nm) the intermolecular bilayer structure with raft formation becomes more homogeneous and more cohesive.
Upon lipid raft formation, the Raman peak corresponding to monolayer normal mechanical vibrations drops remarkably in position and width.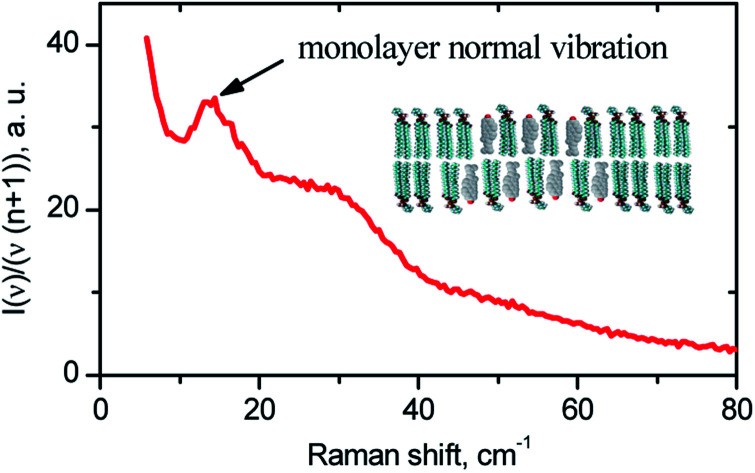
Introduction
Plasma membranes are composed of lipids of different types varying in their head groups, length of the acyl chains, and number of unsaturated carbon–carbon bonds; cholesterol (Chol) is also an important membrane constituent. Membranes are assumed to have compositionally heterogeneous structures resulting in ordered-disordered phase lipid segregation.1–4 This inhomogeneity gives rise to the concept of lipid rafts which are assumed to be nanoscale domains of lipids and proteins in the membrane.1–6 Lipid raft formation is thought to be important for various cellular processes.5,6 To explore membrane properties, bilayers made from synthetic lipids are often used.1–4,7 The heterogeneity of model membranes was studied with NMR and EPR,1,2,8–10 small-angle neutron scattering,11,12 fluorescence microscopy,13,14 Raman scattering,15–20 computer simulation,21,22 and other techniques.
Vibrational frequencies of specific functional groups obtained in Raman scattering experiment15–20 are sensitive to the local environment of lipids and proteins, providing so information on the lipid order. Recently, low-frequency Raman scattering spectra23,24 were found to be capable for detection of THz acoustic vibrations of the bilayer as a whole. The narrow peak between 9 and 18 cm−1 detected below 250 K was attributed to the eigenmode of normal mechanical vibrations of a lipid monolayer (a leaflet). This peak cannot be observed above 250 K because of mode overdamping by fast relaxation motions. The peak position and width were found to depend on the lipid content; the width decrease with increase of the Chol content observed in binary lipid/Chol bilayers was attributed to increase of the bilayer homogeneity in the spatial scale of the sound wave half-length (that is the monolayer thickness, i.e. ∼2.5 nm).24
So low-frequency Raman scattering provides principally new information on the bilayer normal mechanical vibrations, which may appear useful for the elucidation of the bilayer nanoscale structure. Although these vibrations can be detected only at reduced temperatures, one may suppose that the bilayer nanoscale structure may be frozen with temperature decrease, – like it is assumed in different experimental approaches employing structure cryogenic trapping.
Note that the in-plane mechanical vibrations of the membranes were studied employing inelastic X-ray scattering,25 inelastic neutron scattering26 and molecular dynamics (MD) simulations.27,28 The data obtained have demonstrated that lipid bilayers exhibit collective short-wavelength dynamics showing correlated density fluctuations on the sub-ps time scale; in the presence of Chol these motions are stiffening.
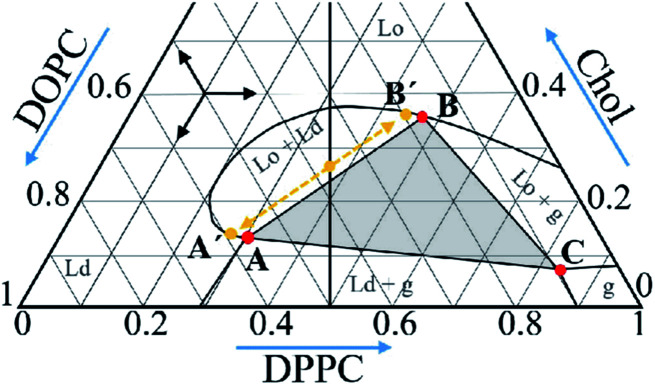
Here, we apply low-frequency Raman scattering to the ternary lipid mixture of 1,2-dioleoyl-sn-glycero-3-phosphocholine (DOPC), 1,2-dipoleoyl-sn-glycero-3-phosphocholine (DPPC) and Chol. This system is known for coexistence of liquid disordered (Ld) and gel (g) phases, liquid ordered (Lo), Ld and g phases, Lo and Ld phases,1–4,10,14 which takes place for certain lipid and Chol compositions, – see Fig. 1 where phase diagram retrieved from the literature data2 is presented. These phases are characterized by different molecular ordering and form domain structure with lipid composition differed from the mean composition; the Lo domains coexisting with other phases are lipid rafts. As formation of these domains may influence the lipid layer vibrational eigenmodes, the goal of this work is measurement of low-frequency Raman spectra of the bilayers of different lipid/Chol composition.
Fig. 1. Phase diagram of the DOPC/DPPC/Chol ternary system at 18 °C retrieved from literature data.2 The vertical line corresponds to the compositions studied in this work. The grey triangle with vertexes A, B and C corresponds to the compositions where the Ld, Lo and g phases are present; see text for meaning of the A′ and B′ points.
Experimental
Sample preparation
The DOPC and DPPC lipids were purchased from Avanti Polar Lipids (Alabaster, AL, USA), Chol was purchased from Sigma-Aldrich (St. Louis, MO, USA). The three-component mixtures were prepared from equimolar ratio of DOPC and DPPC with Chol taken at different concentration varied from 0 mol% to 50 mol%. Also, compositions corresponding to the A, B and C points in the phase diagram of Fig. 1 were prepared. The mixtures were dissolved in chloroform with subsequent solvent evaporation in a vacuum chamber for 6 h. Then water was added, with following vortex mixing. The resulted suspension was kept above the gel-to-fluid phase transition temperature for 6 h with further 10-times freezing-thawing circles. This procedure resulted in formation of multilamellar vesicles (MLV). Note that for our measurements the MLV are more appropriate than unilamellar vesicles, because of the higher signal to noise ratio in the former case. The samples were centrifuged and excess water was removed. The final lipids/water ratio was approximately 1 : 1.5 w/w. The samples were cooled to the temperature of the experiment, with the rate of 3 K min−1.
Raman experiment
Raman spectra were recorded with a triple-grating Raman spectrometer (Tri Vista 777) and a 532 nm laser (Millenia, Spectra Physics, average power ∼50 mW) in a right angle scattering geometry. Lenses of 60 mm focal length were used to focus the laser beam and to collect the scattering light. A neon discharge lamp was used for the wavelength spectrometer calibration. Raman spectra from 5 to 800 cm−1 were measured as described in details previously.23,24 The obtained spectra were scaled by the Raman intensity of temperature-independent C–N vibrational modes located near 720 cm−1.23 The photoluminescence contribution was subtracted using cubic polynomial approximation of the spectrum background in the range from 5 cm−1 to 800 cm−1. Measurements were carried out at two temperatures, 100 K and 170 K, using an optical closed-circle helium cryostat (Advanced Research Systems).
Results
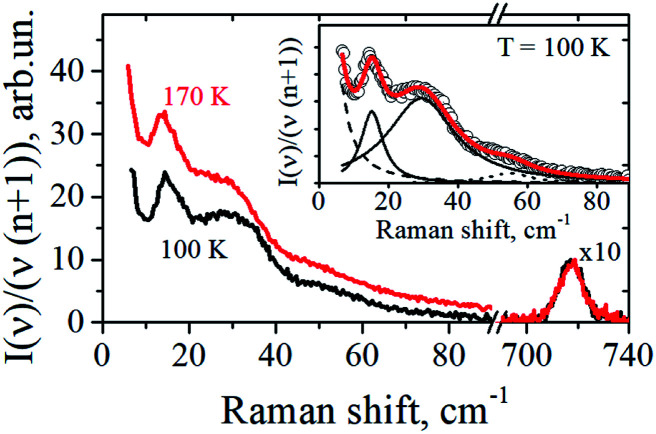
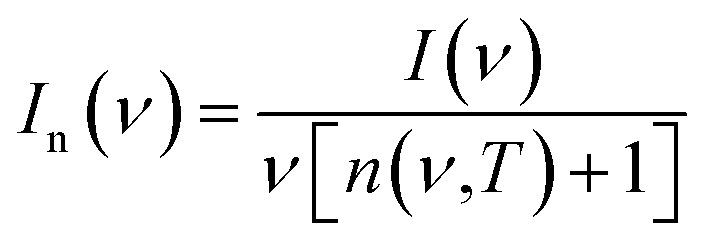
The representative low-frequency Raman spectra obtained at 100 K and 170 K in the spectral range between 5 and 90 cm−1 are shown in Fig. 2. The spectra were analyzed in the reduced representation:29
 |
1 |
where n(ν,T) is the Bose factor. This representation eliminates in harmonic approximation the temperature increase of the vibrational Raman spectra.
Fig. 2. Low-frequency Raman spectra of cholesterol-free DOPC/DPPC bilayers obtained at 100 K and 170 K. In the inset the experimental spectrum at T = 100 K (circles) is approximated by four Lorentzians shown by dashed, dotted and two solid lines, with their sum presented by the solid line drawn through the circles.
Spectra in Fig. 2 contain several peaks, which correspond to vibrational eigenmodes of the lipid bilayer.23,24 Except of the intensive central peak which can be tentatively ascribed to the relaxation contribution, one can see three resolved peaks: near 14–17 cm−1, near 30 cm−1, and near 50–60 cm−1.
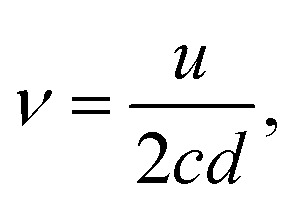
The well-defined peak between 13 cm−1 and 16 cm−1 corresponds to the first vibrational eigenmode of the lipid monolayer.23,24 In the continuum description of the elastic response of the layer, its frequency is described by the relation:
 |
2 |
where ν is the Raman peak frequency taken in wavenumbers, c is the light velocity, u is the longitudinal acoustic velocity across the layer (may be estimated as ∼2.4 km s−1, that is the longitudinal sound velocity in the dense polyethylene30), and d is the monolayer thickness (∼2.5 nm). In this work we discuss only this well-resolved peak between 13 cm−1 and 16 cm−1. The broad 30 cm−1 peak in Fig. 2 may be induced by the bilayer inhomogeneity across the membrane (because lipid polar groups and acyl chain possess different elasticity), and the broad peak near 50–60 cm−1 may appear because of acoustic-like excitations.23
The insert to Fig. 2 shows that the experimental Raman spectra can be decomposed onto the sum of four Lorentzians, taking also into account the contribution from the central peak. The dashed line here corresponds to the central peak; the dotted line reflects contribution from acoustic-like excitations. From this decomposition the position and width of the 13–16 cm−1 peak were evaluated with the precision of ±0.2 cm−1.
Note that one may suppose that upon freezing the macroscopic phase separation may occur, with DOPC, DPPC and Chol ingredients forming distinct different phases. This possibility however may be certainly ruled out by comparison with low-frequency Raman spectra for bilayers of pure DPPC lipids:23 the latter contains below 120 K a well-distinguished peak at 9.3 cm−1 (see Fig. 1 therein), which is not observed in our case of the DOPC/DPPC/Chol mixtures – see Fig. 2. (This peak was ascribed in ref. 23 to normal vibrations of the DPPC bilayer as a whole). So the absence of 9.3 cm−1 peak in Fig. 2 unambiguously evidences that under our experimental conditions phase separation into macroscopic pure DOPC, DPPC and Chol phases does not take place. Also, one more argument for the absence of phase separation is worth to be added: the Raman spectra obtained for ratio of the peaks corresponding to C–H2 symmetric and antisymmetric vibrations in DPPC lipids show that in pure DPPC and in DPPC/Chol bilayers this ratio is remarkably different31 (see Fig. 6a therein) which would not occur if DPPC and Chol are separated into different phases.
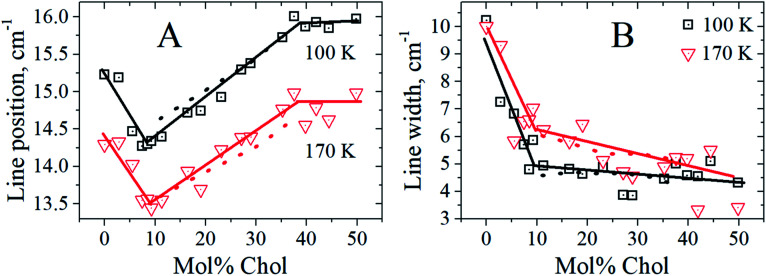
In this work, we explore Chol concentration dependence for the compositions with equimolar DPPC and DOPC quantities. The found Raman peak positions and widths at different Chol concentrations are shown in Fig. 3. The data were obtained at two temperatures, 100 K and 170 K. One can see that for both temperatures the Chol concentration dependences are non-monotonic. For the peak position the dependences contain two kinks separating three ranges: below 9 mol%, between 9 mol% and 38 mol%, and above 38 mol%. The concentration dependence of the peak width contains only one kink near ∼ 9–10 mol% Chol, which separates two scenarios for this dependence: sharp decrease from 10 cm−1 to 5 cm−1 and much slower decrease at higher Chol concentration.
Fig. 3. The peak position (A) and the peak width (B) versus Chol concentration at 100 K (black squares) and 170 K (red triangles). The solid straight-line segments are drawn to guide the eye, and the dotted lines are predictions of eqn (3) (see text).
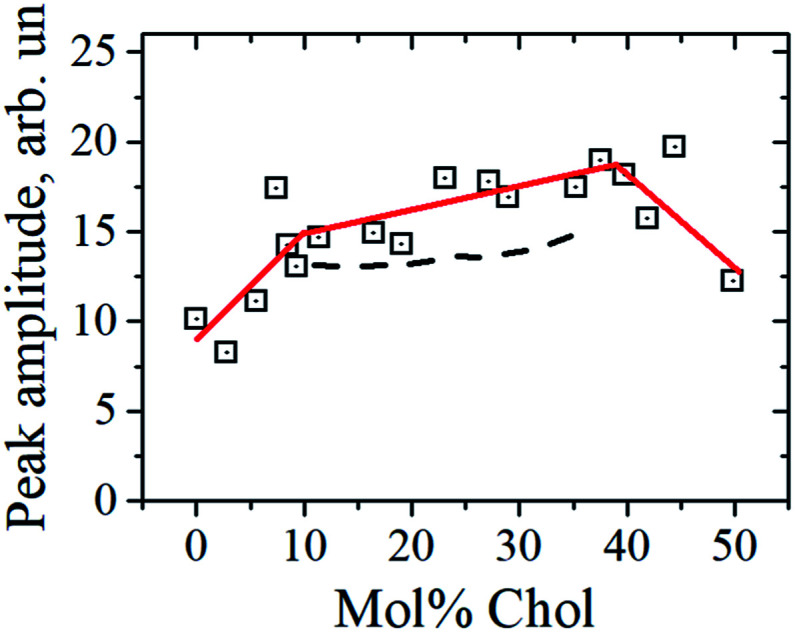
Chol dependence of the peak amplitude at 100 K is shown in Fig. 4. (Data at 170 K displayed high scattering due to the higher contribution of the central peak). From Fig. 4 one can see an indication to two kinks near 10 mol% and near 40 mol% Chol concentration.
Fig. 4. The peak amplitude versus Chol concentration at 100 K. Three solid straight-line segments are drawn to guide the eye, and the dashed lines are predictions of eqn (3) (see text).
Discussion
We found that low-temperature Raman spectra of the ternary DOPC/DPPC/Chol bilayer system contain the narrow peak positioned between 13 cm−1 and 16 cm−1. In line with previous studies of mono- and binary lipid compositions,23,24 this peak is attributed to the vibrational eigenmode of a lipid monolayer. The Chol concentration dependence of the peak position (Fig. 3 A) may be divided into three distinct ranges: below 9 mol%, between 9 mol% and 38 mol%, and above 38 mol%. The most interesting point here is that the borders between these three ranges approximately correspond to the Chol concentration borders encompassing the Lo + Ld + g and Lo + Ld phase coexistence at room temperature – see phase diagram in Fig. 1, in which the vertical line crosses these borders at Chol concentration of 12 mol% and 38 mol%. The bilayer structure between these two borders implies coexisting domains of different lipid composition, the lipid rafts. One may suggest that the similarity between our Raman data and data in Fig. 1 means correlation between bilayer structures in the deeply frozen gel state and in the raft-containing fluid state. Probably this correlation allows to suggest that heterogeneous structure of the local lipid composition in fluid state is fixed at low temperatures in the frozen bilayers. Similar conclusions was also outlined from the spin-label EPR data.32
The concentration dependence of the peak width (Fig. 3B) demonstrates a sharp decrease with the Chol concentration increase – almost by a factor of 2 – when approaching the Chol concentration of 9 mol%. Since the peak narrowing implies lower matter defectiveness for the sound propagation, this observation indicates on higher homogeneity of the bilayer above Chol concentration of 9 mol%. And this increase of homogeneity occurs just for the Chol concentration range where rafts are formed at 18 °C – see Fig. 1.
At first look, the conclusion about the increasing membrane homogeneity is paradoxical. Indeed, coexistence of different phases (Lo, Ld, g) just implies system heterogeneity. However the heterogeneity-homogeneity concept depends on the spatial scale in which the system is considered. The spatial scale of the described low-frequency Raman experiment corresponds to the half of the wavelength that is the monolayer thickness, d ∼2.5 nm. So we may admit that for Chol concentrations larger than 9 mol%, the bilayer becomes more homogeneous in the nanometer spatial scale. This increased homogeneity implies more compact intermolecular packing and mechanically more cohesive intermolecular structures. So, lipid rafts may homogenize bilayer structure at the nanoscale distance range.32
Data in Fig. 4 show that the peak amplitude becomes somewhat larger for the Chol concentration range between ∼10 mol% and 40 mol%. As this range is similar to that for the raft formation at 18 °C (see Fig. 1), this coincidence again shows correlation between mechanical vibrations of frozen bilayers and the raft formation in the fluid state. According to the previously suggested interpretation,23,24 the peak increase reflects a reduction of the interleaflet coupling in the bilayers. So the peak increase in Fig. 4 may imply that raft formation reduces this coupling.
One may describe properties of the compositions inside the coexisting range employing those for the individual domains. For this purpose, the composition may be considered as a sum of the constituting domains those weights can be found from the tie lines in the phase diagram and the lever rule.1,2,33–35 For the linear borders encompassing the Lo + Lo + g phase coexistence triangle (see Fig. 1), the Raman spectrum f(ν) at any point inside the coexisting range may be presented as a linear superposition of the spectra for the A, B and C compositions corresponding to the three vertexes in Fig. 1:
| f(ν) = afA(ν) + bfB(ν) + cfC(ν), | 3 |
where a, b, and c are the corresponding weights (a + b + c = 1).
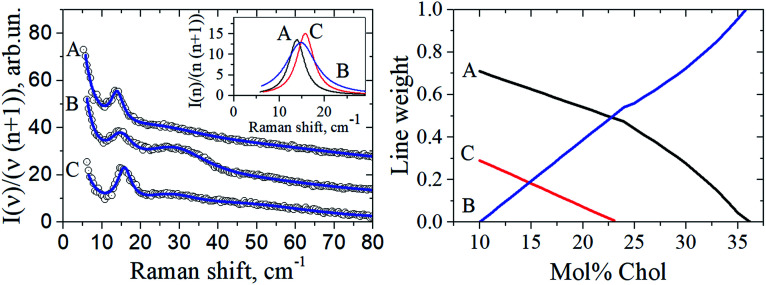
The fA(ν), fB(ν) and fC(ν) spectra were obtained as Lorentzian approximation of the monolayer eigenmodes for the corresponding bilayer composition – see Fig. 5 (left). Then, denoting the DOPC/DPPC/Chol composition for any point O within the triangle as xO, yO, zO in the phase diagram depicted in Fig. 1 (xO + yO + zO = 1), we write
 |
4 |
(the numerical values here were extracted from Fig. 1, see also original data2).
Fig. 5. Left: The circles show experimental Raman spectra for the DOPC/DPPC/Chol bilayers taken at 100 K for the compositions A, B, and C of the triangle vertexes shown in Fig. 1. Data are shifted upwards for convenience. The solid lines drawn through the experimental points are fits by a sum of Loretzians (cf.Fig. 2). The insert shows the Lorentzians describing the peak between 13 and 16 cm−1, for the A, B and C compositions. Right: the peak weights a, b and c found from eqn (4), as a function of Chol concentration.
For the Chol concentration above 23 mol% and below 38 mol% only two phases, Lo and Ld, are present (see Fig. 1). The tie-line analysis performed for the DOPC/DPPC/Chol bilayers34,35 has shown that the tie-line endpoints A′ and B′ for the Lo + Ld phase coexistence are located like it is shown in Fig. 1. In our consideration we neglected the difference between the points A′ and A and between the points B′ and B in the phase diagram in Fig. 1, and took c = 0 in eqn (4).
The peak weights a, b and c obtained using eqn (4) in the case of the compositions studied here, xO = yO = (1 − zO)/2, are shown in Fig. 5 (right) as a function of Chol concentration (zO). Then for any point O position the Raman spectra were simulated using eqn (3). The resulting f(ν)Raman line was found to be fitted fairly well by a single Lorentzian (data not shown), and for this Lorentzian the peak position, width, and amplitude were determined. These predictions for the peak position and width are given in Fig. 3 by dotted lines as a function of Chol content. Also, in Fig. 4 the predicted peak amplitudes are also shown by the dashed line. One can see in Fig. 3 and 4 a good agreement with the experiment.
Conclusions
Low-frequency Raman scattering was studied here for investigation of the layer normal vibrational modes of the ternary DOPC/DPPC/Chol bilayers. To avoid overlapping with the large central peak, these modes were studied at low temperatures, 100 K and 170 K. The peak observed between 13 cm−1 and 16 cm−1 corresponds to the first eigenmode of the normal vibrations of a lipid monolayer. The peak position reflects elastic properties of the monolayers, the peak width characterizes the lipid lateral homogeneity, at the spatial scale of ∼2.5 nm, and the peak amplitude reflects the strength of interleaflet coupling. The Raman spectra unambiguously show that upon the bilayer freezing a possible separation of the bilayer into distinct DOPC, DPPC and Chol phases does not occur.
Raman spectra were studied for the compositions with the equimolar DOPC/DPPC ratio and Chol concentration varied. The found peak position possessed two kinks at the Chol concentration dependence, located at 9 mol% and 38 mol% Chol concentrations. These values are close to the borders encompassing at fluid state the Lo + Ld + g and Lo + Ld phase coexistence (the raft formation). This similarity allows to suggest that peculiarities of the bilayer structure at fluid state become frozen when temperature decreases below 170 K.
The found peak width decreases with Chol concentration increase and attains a plateau-like behavior above 9 mol% of Chol concentration, with the magnitude approximately twice smaller than that for the Chol-free bilayer. This evidences a more homogeneous (in the spatial scale of the experiment, ∼2.5 nm) and more cohesive intermolecular bilayer structure in the Chol concentration range in which rafts are formed at fluid state.
The peak amplitude was found to increase between 9 mol% and 38 mol% Chol concentration borders, which implies that in this concentration range the interleaflet coupling in the bilayer becomes smaller.
Conflicts of interest
There are no conflicts to declare.
Supplementary Material
Acknowledgments
This work was supported by the RF State assignment No AAAA-A17-117052410033-9. DVL and SAD acknowledges support from RSF, Grant No. 15-15-00021. Some part of the experiments was performed in the multiple-access center “High-Resolution Spectroscopy of Gases and Condensed Matters” in IA&E SBRAS (Novosibirsk, Russia).
References
- Marsh D. Cholesterol-induced fluid membrane domains: a compendium of lipid-raft ternary phase diagrams. Biochim. Biophys. Acta. 2009;1788:2114–2123. doi: 10.1016/j.bbamem.2009.08.004. [DOI] [PubMed] [Google Scholar]
- Davis J. H. Clair J. J. Juhasz J. Phase equilibria in DOPC/DPPC-d62/cholesterol mixtures. Biophys. J. 2009;96:521–539. doi: 10.1016/j.bpj.2008.09.042. [DOI] [PMC free article] [PubMed] [Google Scholar]
- Juhasz J. Sharom F. J. Davis J. H. Quantitative characterization of coexisting phases in DOPC/DPPC/cholesterol mixtures: comparing confocal fluorescence microscopy and deuterium nuclear magnetic resonance. Biochim. Biophys. Acta. 2009;1788:2541–2552. doi: 10.1016/j.bbamem.2009.10.006. [DOI] [PubMed] [Google Scholar]
- Heftberger P. Kollmitzer B. Rieder A. A. Amenitsch H. Pabst J. In situ determination of structure and fluctuations of coexisting fluid membrane domains. Biophys. J. 2015;108:854–862. doi: 10.1016/j.bpj.2014.11.3488. [DOI] [PMC free article] [PubMed] [Google Scholar]
- Fischer T. Vink R. L. C. Domain formation in membranes with quenched protein obstacles: Lateral heterogeneity and the connection to universality classes. J. Chem. Phys. 2011;134:055106. doi: 10.1063/1.3530587. [DOI] [PubMed] [Google Scholar]
- Winkler P. M. Regmi R. Flauraud V. Brugger J. Rigneault H. Wenger J. Garcia-Parajo M. F. Optical Antenna-Based Fluorescence Correlation Spectroscopy to Probe the Nanoscale Dynamics of Biological Membranes. J. Phys. Chem. Lett. 2018;9:110–119. doi: 10.1021/acs.jpclett.7b02818. [DOI] [PubMed] [Google Scholar]
- Chan Y. H. Boxer S. G. Model Membrane Systems and Their Applications. Curr. Opin. Chem. Biol. 2007;11:581–587. doi: 10.1016/j.cbpa.2007.09.020. [DOI] [PMC free article] [PubMed] [Google Scholar]
- Yasuda T. Tsuchikawa H. Murata M. Matsumori N. Deuterium NMR of Raft Model Membranes Reveals Domain-Specific Order Profiles and Compositional Distribution. Biophys. J. 2015;108:2502–2506. doi: 10.1016/j.bpj.2015.04.008. [DOI] [PMC free article] [PubMed] [Google Scholar]
- Thewalt J. L. Bloom M. Phosphatidylcholine: cholesterol phase diagrams. Biophys. J. 1992;63:1176–1181. doi: 10.1016/S0006-3495(92)81681-8. [DOI] [PMC free article] [PubMed] [Google Scholar]
- Ionova I. V. Livshits V. A. Marsh D. Phase Diagram of Ternary Cholesterol/Palmitoylsphingomyelin/Palmitoyloleoyl-phosphatidylcholine Mixtures: Spin-Label EPR Study of Lipid-Raft Formation. Biophys. J. 2012;102:1856–1865. doi: 10.1016/j.bpj.2012.03.043. [DOI] [PMC free article] [PubMed] [Google Scholar]
- Vogtt K. Jeworrek C. Garamus V. M. Winter R. Microdomains in Lipid Vesicles: Structure and Distribution Assessed by Small-Angle Neutron Scattering. J. Phys. Chem. B. 2010;114:5643–5648. doi: 10.1021/jp101167n. [DOI] [PubMed] [Google Scholar]
- Qian S. Heller W. T. Melittin-Induced Cholesterol Reorganization in Lipid Bilayer Membranes. Biochim. Biophys. Acta. 2015;1848:2253–2260. doi: 10.1016/j.bbamem.2015.06.012. [DOI] [PubMed] [Google Scholar]
- Klymchenko A. S. Kreder R. Fluorescent Probes for Lipid Rafts: From Model Membranes to Living Cells. Chem. Biol. 2014;21:97–113. doi: 10.1016/j.chembiol.2013.11.009. [DOI] [PubMed] [Google Scholar]
- Castro B. M. Silva L. C. Fedorov A. de Almeida R. F. Prieto M. Cholesterol-rich fluid membranes solubilize ceramide domains: Implications for the structure and dynamics of mammalian intracellular and plasma membranes. J. Biol. Chem. 2009;284:22978–22987. doi: 10.1074/jbc.M109.026567. [DOI] [PMC free article] [PubMed] [Google Scholar]
- de Lange M. J. L. Bonn M. Muller M. Direct measurement of phase coexistence in DPPC/cholesterol vesicles using Raman spectroscopy. Chem. Phys. Lipids. 2007;146:76–84. doi: 10.1016/j.chemphyslip.2006.12.007. [DOI] [PubMed] [Google Scholar]
- Opilik L. Bauer T. Schmid T. Stadler J. Zenobi R. Nanoscale chemical imaging of segregated lipid domains using tip-enhanced Raman spectroscopy. Phys. Chem. Chem. Phys. 2011;13:9978–9981. doi: 10.1039/C0CP02832K. [DOI] [PubMed] [Google Scholar]
- Potma E. O. Xie X. S. Direct visualization of lipid phase segregation in single lipid bilayers with coherent anti-stokes Raman scattering microscopy. ChemPhysChem. 2005;6:77–79. doi: 10.1002/cphc.200400390. [DOI] [PubMed] [Google Scholar]
- Delgado-Coello B. Montalvan-Sorrosa D. Cruz-Rangel A. Sosa-Garrocho M. Hernández-Téllez B. Macías-Silva M. Castillo R. Mas-Oliva J. Label-free surface-enhanced Raman spectroscopy of lipid-rafts from hepatocyte plasma membranes. J. Raman Spectrosc. 2017;48:659–667. doi: 10.1002/jrs.5101. [DOI] [Google Scholar]
- Ando J. Kinoshita M. Cui J. Yamakoshi H. Dodo K. Fujita K. Murata M. Sodeoka M. Sphingomyelin distribution in lipid rafts of artificial monolayer membranes visualized by Raman microscopy. Proc. Natl. Acad. Sci. U.S.A. 2015;112:4558–4563. doi: 10.1073/pnas.1418088112. [DOI] [PMC free article] [PubMed] [Google Scholar]
- Wang Y. Yan B. Chen L. SERS tags: novel optical nanoprobes for bioanalysis. Chem. Rev. 2013;113:1391–1428. doi: 10.1021/cr300120g. [DOI] [PubMed] [Google Scholar]
- Bennett W. D. Tieleman D. P. Computer simulations of lipid membrane domains. Biochim. Biophys. Acta. 2013;1828:1765–1776. doi: 10.1016/j.bbamem.2013.03.004. [DOI] [PubMed] [Google Scholar]
- Sodt A. J. Head-Gordon T. An implicit solvent coarse-grained lipid model with correct stress profile. J. Chem. Phys. 2010;132:205103. doi: 10.1063/1.3408285. [DOI] [PMC free article] [PubMed] [Google Scholar]
- Surovtsev N. V. Dmitriev A. A. Dzuba S. A. Normal vibrational modes of phospholipid bilayers observed by low-frequency Raman scattering. Phys. Rev. E. 2017;95:032412. doi: 10.1103/PhysRevE.95.032412. [DOI] [PubMed] [Google Scholar]
- Leonov D. V. Adichtchev S. V. Dzuba S. A. Surovtsev N. V. The Vibrational Eigenmodes of Phospholipid-Cholesterol Bilayers. Phys. Rev. E. 2019;99:022417. doi: 10.1103/PhysRevE.99.022417. [DOI] [PubMed] [Google Scholar]
- Chen S. H. Liao C. Y. Huang H. W. Weiss T. M. Bellisent-Funel M. C. Sette F. Collective Dynamics in Fully Hydrated Phospholipid Bilayers Studied by Inelastic X-Ray Scattering. Phys. Rev. Lett. 2001;86:740–743. doi: 10.1103/PhysRevLett.86.740. [DOI] [PubMed] [Google Scholar]
- Rheinstädter M. Ollinger C. Fragneto G. Demmel F. Salditt T. Collective dynamics of lipid membranes studied by inelastic neutron scattering. Phys. Rev. Lett. 2004;93:108107. doi: 10.1103/PhysRevLett.93.108107. [DOI] [PubMed] [Google Scholar]
- Tarek M. Tobias D. J. Chen S.-H. Klein M. L. Short wavelength collective dynamics in phospholipid bilayers: a molecular dynamics study. Phys. Rev. Lett. 2001;87:238101. doi: 10.1103/PhysRevLett.87.238101. [DOI] [PubMed] [Google Scholar]
- Päslack C. Smith J. C. Heyden M. Schäfer L. V. Hydration-mediated stiffening of collective membrane dynamics by cholesterol. Phys. Chem. Chem. Phys. 2019;21:10370–10376. doi: 10.1039/C9CP01431D. [DOI] [PubMed] [Google Scholar]
- Jäckle J., in Amorphous Solids: Low-Temperature Properties, ed. W. A. Phillips, Springer, Berlin, 1981, p. 135 [Google Scholar]
- Liu Q.-L. Wang C. H. Study of the low-frequency acoustic modes of oriented poly(ethylene) with a multipass Fabry-Perot interferometer. Macromolecules. 1983;16:1900–1906. doi: 10.1021/ma00246a018. [DOI] [Google Scholar]
- Surovtsev N. V. Dzuba S. A. Flexibility of lipids with saturated and unsaturated chains studied by Raman scattering: the effect of cholesterol on dynamical and phase transitions. J. Chem. Phys. 2014;140:235103. doi: 10.1063/1.4883237. [DOI] [PubMed] [Google Scholar]
- Kardash M. E. Dzuba S. A. Lipid-Mediated Clusters of Guest Molecules in Model Membranes and Their Dissolving in the Presence of Lipid Rafts. J. Phys. Chem. B. 2017;121:5209–5217. doi: 10.1021/acs.jpcb.7b01561. [DOI] [PubMed] [Google Scholar]
- Veatch S. L. Keller S. L. Seeing spots: Complex phase behavior in simple membranes. Biochim. Biophys. Acta. 2005;1746:172–185. doi: 10.1016/j.bbamcr.2005.06.010. [DOI] [PubMed] [Google Scholar]
- Veatch S. L. Soubias O. Keller S. L. Gawrisch K. Critical fluctuations in domain-forming lipid mixtures. Proc. Natl. Acad. Sci. U.S.A. 2007;104:17650–17655. doi: 10.1073/pnas.0703513104. [DOI] [PMC free article] [PubMed] [Google Scholar]
- Uppamoochikkal P. Tristram-Nagle S. Nagle J. F. Orientation of tie-lines in the phase diagram of DOPC/DPPC/cholesterol model biomembranes. Langmuir. 2010;26:17363–17368. doi: 10.1021/la103024f. [DOI] [PMC free article] [PubMed] [Google Scholar]


