Abstract
Additive manufacturing technology, referred as 3D printing technology, is a growing research field with broad applications from nanosensors fabrication to 3D printing of buildings. Nowadays, the world is dealing with a pandemic and requires the use of simple sensing systems. Here, the strengths of fast screening by a lab‐on‐a‐chip device through electrochemical detection using 3D printing technology for SARS‐CoV‐2 sensing are combined. This system comprises a PDMS microfluidic channel integrated with an electrochemical cell fully 3D‐printed by a 3D printing pen (3D‐PP). The 3D‐PP genosensor is modified with an ssDNA probe that targeted the N gene sequence of SARS‐CoV‐2. The sensing mechanism relies on the electro‐oxidation of adenines present in ssDNA when in contact with SARS‐CoV‐2 RNA. The hybridization between ssDNA and target RNA takes a place and ssDNA is desorbed from the genosensor surface, causing a decrease of the sensor signal. The developed SARS‐CoV‐2/3D‐PP genosensor shows high sensitivity and fast response.
Keywords: additive manufacturing, lab on chip, nucleic acid, electroanalysis
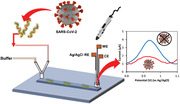
The strengths of a lab‐on‐a‐chip device and 3D printing technology to fabricate a point‐of‐care to detect SARS‐CoV‐2RNA are combined. The sensing mechanism relies on the electro‐oxidation of adenines present in ssDNA immobilized on 3D printing pen genosensor. In presence of SARS‐CoV‐2 RNA, ssDNA hybridizes and desorbs from the genosensor surface, causing a decrease of the sensor signal.
1. Introduction
3D printing technology, also called additive manufacturing, allows for the fabrication of three dimensional objects based on the digitally controlled deposition of successive layers of material that can be applied in aeronautics, energy devices, pharmaceuticals, medical devices, and diagnostics.[ 1 , 2 , 3 , 4 , 5 , 6 ] 3D printing is highly useful for decentralized on‐demand production of customized sensing devices.[ 7 , 8 , 9 , 10 , 11 , 12 ] The 3D printing pen, as opposed to the 3D printer, offers an ultra‐low cost and easy‐to‐use option.[ 13 , 14 , 15 ]
The outbreak of COVID‐19 due to the SARS‐CoV‐2 virus is currently a major worldwide emergency.[ 16 ] As evidenced by previous virus epidemics, highly sensitive and specific laboratory diagnostics for COVID‐19 are essential for case identification, contact tracing, and making timely decisions for risk management.[ 17 , 18 , 19 ] Although RT‐PCR is the “gold standard” technique for SARS‐CoV‐2 detection due to its high selectivity and sensitivity,[ 18 , 20 ] it is time‐consuming and requires highly qualified personnel operating in central laboratories. As a result, the development of a rapid, affordable, and reliable molecular diagnostic test for point‐of‐care (POC) applications is an urgent need to fight this pandemic.[ 17 , 21 , 22 ] In this race, lab‐on‐a‐chip or microfluidic chips have many opportunities for success due to their interesting features such as the ability to integrate sample preparation, reactions, and detection on a small device, and using low sample and reagent volumes with a high degree of automation, disposability, and portability.[ 23 , 24 , 25 ] Among them, electrochemical microfluidic devices play an important role because electrochemical detection is easy to miniaturize without losing analytical performance.[ 26 ] In addition, the usefulness of this approach for SARS‐CoV detection has been previously demonstrated.[ 27 , 28 ]
In this work, a needle‐like SARS‐CoV‐2 genosensor fabricated by a 3D printing pen (3D‐PP) was developed. For this aim, ssDNA probe targeted N gene sequence of SARS‐CoV‐2 was adsorbed on the previously chemically and electrochemically activated 3D‐PP electrode. Then, this SARS‐CoV‐2 genosensor was incubated with SARS‐CoV‐2 target RNA to hybridize with ssDNA probe, leading to desorption by its adduction from the surface of the 3D‐PP electrode. This desorption was followed by the electrochemical oxidation of adenine present in the ssDNA probe by differential pulse voltammetry (DPV). Finally, this system was implemented in a microfluidic chip composed of a single PDMS channel and a three‐electrode system inserted in the outlet side (see Figure 1 ). Three‐electrode system was fully 3D‐printed. This microfluidic genosensor was able to detect SARS‐CoV‐2 target RNA in On/Off mode in 7 min.
Figure 1.
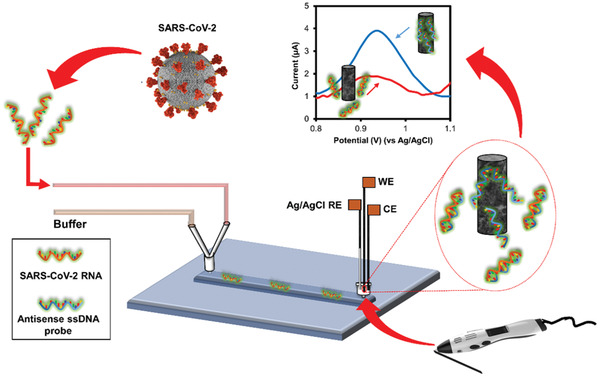
Scheme of the lab‐on‐a‐chip genosensor for SARS‐CoV‐2 virus detection. 3D‐printed electrodes were fabricated using a 3D printing pen (3D‐PP) and a conductive graphene/polylactic acid (PLA) filament. The antisense ssDNA probe was adsorbed on the 3D‐PP surface. SARS‐CoV‐2 RNA is monitored by decreasing of adenine oxidation signal when SARS‐CoV‐2 RNA adducts antisense ssDNA probe from 3D‐PP surface.
2. Results and Discussion
We have implemented a microfluidic system that uses an electrochemical cell composed of a three‐electrode system fabricated with a 3D printing pen: counter electrode (CE), working electrode (WE), and Ag/AgCl reference electrode (RE). The working electrode was characterized by scanning electron microscopy (SEM), BET analysis, and electrochemical impedance spectroscopy (EIS) (see Figure S1, Supporting Information).
The electrochemical performance of 3D‐PP electrodes was studied by electrochemical impedance spectroscopy (EIS) using [Fe(CN)6]−3/–4 redox probe to obtain Nyquist plots that is represented in Figure S1D (Supporting Information). To obtain the electron transfer resistance (R ct), Nyquist plots were fitted with Randles model modified with Warburg impedance (see model in the inset of Figure S1D, Supporting Information). High R ct (861 KΩ) that correspond to poor electrons transfer was observed for the as‐printed 3D‐PP electrode (huge semicircle radius in, black dots); however, after chemical activation, an extraordinary increase of electron transfer occurred by decrease in semicircle radius, (inset of Figure S1D, red dots, Supporting Information) with a R ct of (575 Ω). Furthermore, additional electrochemical activation yielded a further increase in electron transfer of about one order of magnitude with a very low R ct of 56 Ω (see inset of Figure S1D, blue dots, Supporting Information).
The microfluidic genosensor was fabricated by modifying a 3D‐PP electrode with an ssDNA antisense oligonucleotide of SARS‐CoV‐2 (probe: 5′‐CCAATGTGATCTTTTGGTGT), targeted N gene sequence of SARS‐CoV‐2 and its efficacy in biosensing was previously demonstrated.[ 29 ] This ssDNA probe was physically adsorbed onto the activated 3D‐PP electrode surface, taking advantage of π–π stacking between ssDNA and carbon nanomaterials.[ 30 ] Always a new 3D‐PP electrode was used to prepare the genosensor.
The genosensor mechanism is based on the signal generated by the oxidation of adenines present in ssDNA using DPV and in consequence bigger peak area was obtained. By the contrary, in the presence of SARS‐CoV‐2 RNA (target: 5′‐ACACCAAAAGAUCACAUUGG), the ssDNA antisense oligonucleotide of SARS‐CoV‐2 (probe) hybridizes with SARS‐CoV‐2 RNA (target) and it is desorbed from the 3D‐PP electrode and causes a decrease in the oxidation signal of adenines and oxidation peak decreased.
The genosensor performance was first evaluated off‐chip in a conventional electrochemical cell (Ag/AgCl reference electrode and platinum counter electrode). Figure 2 shows the DPV signal of activated 3D‐PP electrode (black line), ssDNA antisense oligonucleotide of SARS‐COV‐2 adsorbed on 3D‐PP genosensor in PBS pH 7.4 (blue line) and 3D‐PP genosensor after incubation with 500 × 10−9 m SARS‐COV‐2 RNA solution (red line). Clearly, after 3D‐PP electrode was modified with ssDNA probe, a DPV signal arose at +0.9 V, corresponding to the oxidation signal of adenines (higher peak area). When the 3D‐PP genosensor was put in contact with SARS‐COV‐2 RNA solution, the DPV signal decreased drastically and low peak area was observed, demonstrating the high sensitivity of this genosensor.
Figure 2.
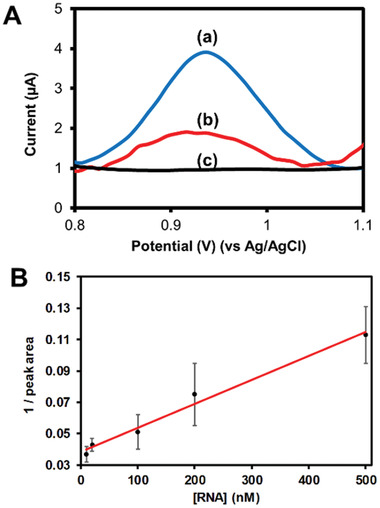
A) DPV curves corresponding to (c) activated 3D‐PP, (a) ssDNA antisense oligonucleotide of SARS‐COV‐2 absorbed on 3D‐PP genosensor and (b) 3D‐PP genosensor incubated with 500 × 10−9 m SARS‐COV‐2 RNA solution. DPV conditions: Pulse amplitude 50 mV, step potential 10 mV, scan rate 20 mV s–1 PBS pH 7.4. B) Calibration curve: Inverse peak area versus SARS‐CoV‐2 RNA concentration.
After the efficient performance of SARS‐CoV‐2 RNA genosensor was demonstrated, a calibration curve was established. As mentioned, higher concentration of SARS‐CoV‐2 RNA decreased the DPV signal of the genosensor. The sensor showed a linear response from 10 to 500 × 10−9 m RNA concentration (see Figure 2B) with an excellent correlation coefficient (r = 0.992). LOD and LOQ were 15 and 50 × 10−9 m, respectively, using the standard deviation of the blank. Furthermore, the repeatability of the genosensors was evaluated by analyzing a 20 × 10−9 m SARS‐CoV‐2 RNA solution using four different electrodes (n = 4). Good repeatability was obtained with an RSD value of 8%, taking into account that a different electrode was employed for each analysis.
The selectivity of the SARS‐CoV‐2 3D‐PP genosensor was subsequently studied (see Figure 3 ). Two control experiments were performed: (i) Sensing in presence of a non‐complementary target strand (sequence 5′‐GCAGTTGATCCTTTGGATACCCTGG, orange column), as expected any significant change in the signal was observed and the obtained values were similar to 3D‐PP genosensor in absence of SARS‐COV‐2 RNA (blue column), and (ii) in presence of one mismatch in the SARS‐COV‐2 RNA sequence (5′‐ACACCAAACGAUCACAUUGG), the resulted signal (gray column) was close to the (iii) SARS‐COV‐2 RNA complementary target (yellow column).[ 29 ]
Figure 3.
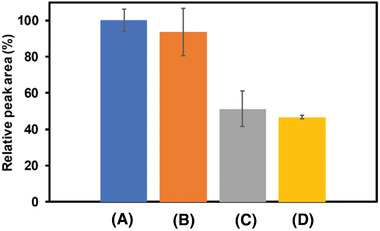
Interference study of 3D‐PP SARS‐COV‐2 genosensor: (A) in absence of SARS‐COV‐2 RNA, (B) in presence of a non‐complementary target (200 × 10−9 m), (C) in presence of SARS‐COV‐2 RNA with one‐base mismatch (200 × 10−9 m), and (D) in presence of 200 × 10−9 m SARS‐COV‐2 RNA (complementary target). Relative peak area % = (nucleic acid peak area/blank peak area) × 100. Analyses were performed in triplicate (n = 3).
Once the efficacy of 3D‐PP genosensor for SARS‐CoV‐2 RNA detection was demonstrated, we explored the integration of this genosensor in a microfluidic system (see Figure 4A) with all electrodes used in the electrochemical detection system 3D‐printed. The 3D‐PP Ag/AgCl pseudo reference electrode was fabricated according to a previous reported protocol.[ 31 ] The home‐made microfluidic chip, comprising a PDMS microchannel (50 × 50 µm section and 1 cm length) and two reservoirs (2 mm diameter), was attached to a glass substrate to enclose the channel. An electrochemical cell composed of 3D‐PP genosensor (working electrode), Ag/AgCl 3D‐PP pseudo reference electrode, and 3D‐PP counter electrode was placed inside the outlet reservoir. The working electrode (genosensor) is inserted into the microchip reservoir (volume of 8 µL) just at the end of the microchannel. This fact facilitates the interaction between SARS‐COV‐2 RNA and the complementary DNA probe adsorbed on the electrode. Moreover, the other two electrodes (reference and auxiliary) are placed in the electrochemical cell (volume 200 µL), outside the microchip reservoir (see Scheme in Figure 4A). In addition, two syringes were connected to the inlet reservoir by a Y‐connector. One syringe contained PBS pH 7.4 solution and the other was infused with COVID‐SARS‐2 RNA solution.
Figure 4.
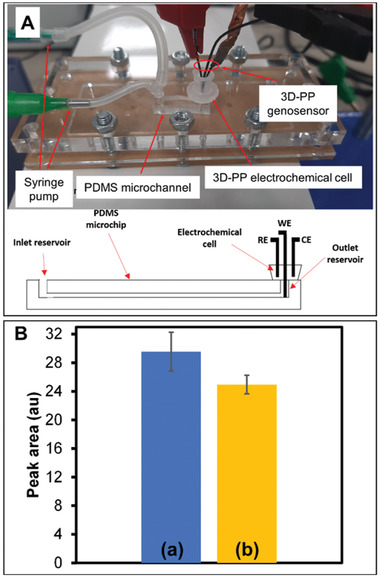
A) Digital photograph of lab on a chip system composed by PDMS microchannel and electrochemical cell composed of three electrodes fabricated by 3D‐PP. Electrodes were placed in the outlet reservoir as well as the schematic representation of the PDMS channel. This scheme shows 3D‐printed electrodes position in the microfluidic device. Working electrode (WE) was set inside the microchip reservoir, just at the outlet of the microchannel. Reference (RE) and counter (CE) electrodes were placed in the electrochemical cell. B) Peak area obtained for a) 3D‐PP modified with antisense ssDNA probe of SARS‐CoV‐2 and b) in presence of 200 × 10−9 m SARS‐CoV‐2 RNA.
The role of microchannel is for improving the manipulation of small volumes, decreasing the sample and reagent solutions. In addition, due to the high surface‐to‐volume ratio of microfluidic channel and the generated flow, the interaction between SARS‐COV‐2 RNA and the complementary DNA probe (adsorbed on the working electrode) is enhanced.
The goal was to produce an On/Off sensing device to identify the presence of SARS‐CoV‐2 RNA. This approach provides a low‐cost and disposable device with high automation and throughput, besides low waste generation and sample consumption. We prioritized the analysis time over other parameters so that the method was able to discriminate the signal of SARS‐CoV‐2 RNA from the blank in the shortest analysis time. In 7 min (5 min incubation time plus 2 min cleaning step), the microfluidic electrochemical genosensor detected a significant signal difference with p = 0.0394 between the blank and the 200 × 10−9 m SARS‐CoV‐2 RNA (α = 0.05, n = 4) using two side test‐t (see Figure 4B). In addition, all analyses were carried out consecutively, with a simple replacement of the content of the sample syringe (blank or RNA sample) and the 3D‐PP working electrode, showing good repeatability (RSD ≤ 9%).
Typically, nasal mucosa from COVID‐19 patients has a maximal concentration of 106 to 107 SARS‐CoV‐2 RNA copies per mL.[ 32 ] This means a concentration of target RNA nucleotide ranging from 1 × 10–15 to 1 × 10–14 m. Our LOD is 1.5 × 10⁻⁸ m, so it is not possible to use our approach directly on saliva samples without an amplification step (PCR assay). However, our 3D‐printed microfluidic genosensor could be used as a rapid SARS‐CoV‐2 RNA amplification reader, with minimal sample consumption and at an extremely low‐cost.
3. Conclusions
A low‐cost and disposable genosensor for SARS‐CoV‐2 detection was fabricated using 3D pen‐printed electrodes (3D‐PP). The sensing mechanism relies on desorbing the ssDNA probe after interaction with SARS‐CoV‐2 RNA target and monitoring of non‐desorbed ssDNA (oxidation signal of adenines by DPV). The integration of this genosensor into a lab‐on‐a‐chip system gave rise an On/Off sensing device that allowed for the detection of SARS‐CoV‐2 RNA in 7 min with minimal sample and reagent consumption. In addition, this work is a promising example of how the combination of microfluidics and 3D printing technology (especially, the 3D printing pen) can provide easy‐to‐use, disposable and low‐cost sensing devices for point‐of‐care testing with broad applicability.
4. Experimental Section
Reagents
RNA fragment of SARS‐CoV‐2 sequence (target, 5′‐ACACCAAAAGAUCACAUUGG), antisense oligonucleotide (single‐strand DNA probe, 5′‐CCAATGTGATCTTTTGGTGT), single base‐mismatched RNA (5′‐ACACCAAACGAUCACAUUGG), total mismatched ssDNA (5′‐GCAGTTGATCCTTTGGATACCCTGG), phosphate buffered saline (PBS) tablets, tri‐sodium citrate dehydrate (purity >99%), K4Fe(CN)6 (purity >98.5%), K3Fe(CN)6 (purity >99%), and sodium hypochlorite solution were purchased in Sigma‐Aldrich (Darmstadt, Germany).
Sodium hydroxide (purity >98%), potassium chloride (purity >99.5%), and sodium chloride (purity >99.9%) were acquired from Penta (Prague, Czech Republic). Ag plating solution was purchased from Technic Inc. (Rhode Island, USA). Bleach was acquired from GB chemicals (Singapore).
All solutions were prepared in ultrapure water (18.2 MΩ, IWA 5, Watek, Prague, Czech Republic).
Equipment
Autolab PGSTAT 204 (Metrohm, Utrecht, The Netherlands), controlled by NOVA software version 1.10, was used for electrochemical measurements and fitting the equivalent electrical circuit of electrochemical impedance spectroscopy measurements.
In the off‐chip approach, an activated 3D‐PP electrode was used as a working electrode, Ag/AgCl electrode as a reference, and platinum electrode as a counter.
In the PDMS chip, an activated 3D‐PP electrode was employed as a working electrode, Ag/AgCl 3D‐PP as pseudo‐reference electrode and as‐printed 3D‐PP electrode as a counter electrode.
A dual syringe pump from Harvard apparatus (model Pump 11 Elite, Holliston, MA, USA) was employed for infusing liquids inside the microchip channel.
Differential pulse voltammetry (DPV) analysis was carried out in PBS pH 7.4 from 0 to +1.4 V, using 50 ms modulation time, 0.5 s interval time, 10 mV step potential, 50 mV modulation amplitude, and 20 mV s−1 scan rate. Electrochemical impedance spectroscopy (EIS) was performed from 100 000 to 0.01 Hz using the following parameters: potential 0.02 V, amplitude 0.01 V, using 10 × 10−3 m K4Fe(CN)6/K3Fe(CN)6 in 0.1 m KCl electrolyte as redox probe.
Scanning electron microscopy (SEM) images were taken using a JEOL 7600F microscope (Japan) with an accelerating voltage of 5 kV.
Nitrogen adsorption/desorption isotherms were obtained in the relative pressure range of 0.05 < P/P0 < 1.00 with a NOVAtouch LX2 (Anton Paar, Germany).
3D pen‐printed electrode fabrication and activation. 3D pen‐printed electrodes (3D‐PP) were printed by using a 3D printing pen (fusing temperature 200 °C) from Polaroid (Minnesota, USA), and a conductive graphene/polylactic acid filament from BlackMagic 3D (New York, USA). The printed wire was of 0.8 mm diameter and cut into 3 cm length pieces.
3D‐PP electrodes were activated by immersing for 30 min in 1 m NaOH solution. Then they were washed with water for 1 min and dried at 50 °C for 40 min in an oven. Finally, they were electroactivated by cyclic voltammetry (50 cycles from 0 to +2.0 V, scan rate 1 V s−1) in PBS pH 7.4 solution (10 × 10−3 m phosphate, 2.7 × 10⁻³ m KCl, 137 × 10−3 m NaCl).
The 3D‐PP Ag/AgCl pseudo reference electrode was fabricated according to a previous reported protocol.[ 31 ] Briefly, a 3D‐PP electrode was immersed in 1 m NaOH solution for 30 min. Afterward, it was introduced in an Ag plating solution and a constant reduction voltage (−0.9 V vs Ag/AgCl) was applied for 10 min. Finally, it was treated with bleach for 60 s. The 3D‐PP Ag/AgCl pseudo reference electrode was compared with a commercial Ag/AgCl reference electrode, obtaining a voltage difference of 33 mV.
Genosensor Fabrication and Label‐Free Sensing Procedure
Electrochemical genosensor was produced as follows: activated 3D‐PP electrodes were introduced in microtubes containing 100 µL of 2 × 10⁻⁶ m ssDNA probe (antisense oligonucleotide) solution prepared in PBS pH 7.4. The microtubes were stirred (600 rpm) for 1 h at 42 °C, using a thermo‐shaker (Grant Bio, Cambridge, UK). Then, each electrode was washed twice with PBS pH 7.4.
The standard SARS‐CoV‐2 RNA solutions were prepared in 0.75 m NaCl, 75 × 10−3 m trisodium citrate pH 7.0 (TSC I buffer).[ 33 ]
The off‐chip label‐free genosensing procedure was as follows (using an electrochemical cell): (i) The genosensor was immersed in 100 µL of sample solution and stirred at 600 rpm and 42 °C for 30 min (incubation step). (ii) The genosensor was washed in 100 µL TSC II buffer (0.30 m NaCl, 30 × 10−3 m trisodium citrate pH 7.0) under stirring at 600 rpm and 42 °C for 5 min (cleaning step). (iii) The genosensor was introduced in the electrochemical cell (10 mL PBS pH 7.4) for DPV analysis (detection step).
Microfluidic Electrochemical Genosensor Setup
PDMS chip was fabricated following the previous reported protocol.[ 34 ] This chip consisted of a PDMS layer containing a single open channel (50 × 50 µm section and 1 cm length), two reservoirs (2 mm diameter), and glass substrate to enclose the channel.
This chip was integrated in a chip holder to facilitate the connection of tubing for pumping and the electrochemical cell. Two syringes were connected to the microchip inlet using a Y‐connector. One syringe contained PBS pH 7.4 solution and the other COVID‐SARS‐2 RNA solution. A dual syringe pump was used to infuse liquid at 10 µL min−1. In addition, a plastic electrochemical cell (volume 200 µL) was inserted into the microchip outlet and the three 3D‐PP electrodes were immersed in the cell. The working electrode (genosensor) was placed right at the exit of the microchip channel (inside outlet reservoir, total volume 8 µL).
The microfluidic genosensing protocol was as follows: (i) The sample was pumped from the inlet for 5 min (incubation step); (ii) PBS solution was pumped from the inlet for 2 min (cleaning step); and (iii) DPV analysis was performed (detection step).
Conflict of Interest
The authors declare no conflict of interest.
Author Contributions
A.G.C., C.C.M.‐M., and M.P.: conceptualization the project; A.G.C.: experimental assays; J.V.V.: electrode characterization; C.C.M.‐M. and M.P.: oversaw and supervised the project. All authors contributed to writing.
Supporting information
Supporting Information
Acknowledgements
This work was supported by the project Advanced Functional Nanorobots (reg. No. CZ.02.1.01/0.0/0.0/15_003/0000444 financed by the EFRR), by Ministry of Education, Youth and Sports (Czech Republic) grant LL2002 under ERC CZ program and the Ministry of Health of the Czech Republic (NU21‐08‐00407). A.G.C. acknowledges the fellowship from Jose Castillejo program (Spain).
Crevillen A. G., Mayorga‐Martinez C. C., Vaghasiya J. V., Pumera M., 3D‐Printed SARS‐CoV‐2 RNA Genosensing Microfluidic System. Adv. Mater. Technol. 2022, 7, 2101121. 10.1002/admt.202101121
Data Availability Statement
The data that support the findings of this study are available from the corresponding author upon reasonable request.
References
- 1. Chen G., Xu Y., Kwok P. C. L., Kang L., Addit. Manuf. 2020, 34, 101209. [Google Scholar]
- 2. Liu F., Wang X., Polymers 2020, 12, 1765. [Google Scholar]
- 3. Godoi F. C., Prakash S., Bhandari B. R., J. Food Eng. 2016, 179, 44. [Google Scholar]
- 4. MacDonald E., Wicker R., Science 2016, 353, aaf2093. [DOI] [PubMed] [Google Scholar]
- 5. Palenzuela C. L. M., Pumera M., Trends Anal. Chem. 2018, 103, 110. [Google Scholar]
- 6. Browne M. P., Redondo E., Pumera M., Chem. Rev. 2020, 120, 2783. [DOI] [PubMed] [Google Scholar]
- 7. Rymansaib Z., Iravani P., Emslie E., Medvidovic‐Kosanovic M., Sak‐Bosnar M., Verdejo R., Marken F., Electroanalysis 2016, 28, 1517. [Google Scholar]
- 8. Richter E. M., Rocha D. P., Cardoso R. M., Keefe E. M., Foster C. W., Munoz R. A. A., Banks C. E., Anal. Chem. 2019, 91, 12844. [DOI] [PubMed] [Google Scholar]
- 9. Ambrosi A., Pumera M., Chem. Soc. Rev. 2016, 45, 2740. [DOI] [PubMed] [Google Scholar]
- 10. Palenzuela C. L. M., Novotny F., Krupicka P., Sofer Z., Pumera M., Anal. Chem. 2018, 90, 5753. [DOI] [PubMed] [Google Scholar]
- 11.a) Munoz J., Pumera M., Trends Anal. Chem. 2020, 128, 115933; [Google Scholar]; b) Li J., Pumera M., Chem. Soc. Rev. 2021, 50, 2794. [DOI] [PubMed] [Google Scholar]
- 12. Munoz J., Redondo E., Pumera M., Adv. Funct. Mater. 2021, 31, 2010608. [Google Scholar]
- 13. de Oliveira F. M., de Melo E. I., da Silva R. A. B., Sens. Actuators, B 2020, 321, 128528. [Google Scholar]
- 14. Cardoso R. M., Castro S. V. F., Stefano J. S., Munoz R. A. A., J. Braz. Chem. Soc. 2020, 31, 1764. [Google Scholar]
- 15. Kumar K. P. A., Pumera M., Adv. Funct. Mater. 2021, 31, 2100450. [DOI] [PMC free article] [PubMed] [Google Scholar]
- 16. Zhai P., Ding Y., Wu X., Long J., Zhong Y., Li Y., Int. J. Antimicrob. Agents 2020, 55, 105955. [DOI] [PMC free article] [PubMed] [Google Scholar]
- 17. Udugama B., Kadhiresan P., Kozlowski H. N., Malekjahani A., Osborne M., Li V. Y. C., Chen H., Mubareka S., Gubbay J. B., Chan W. C. W., ACS Nano 2020, 14, 3822. [DOI] [PubMed] [Google Scholar]
- 18. Chan J. F.‐W., Yip C. C.‐Y., To K. K.‐W., Tang T. H.‐C., Wong S. C.‐Y., Leung K.‐H., Fung A. Y.‐F., Ng A. C.‐K., Zou Z., Tsoi H.‐W., Choi G. K.‐Y., Tam A. R., Cheng V. C.‐C., Chan K.‐H., Tsang O. T.‐Y., Yuen K.‐Y., J. Clin. Microbiol. 2020, 58, e00310. [DOI] [PMC free article] [PubMed] [Google Scholar]
- 19. Ambrosi A., Pumera M., Phys. Chem. Chem. Phys. 2010, 12, 8944. [DOI] [PubMed] [Google Scholar]
- 20. Corman V. M., Landt O., Kaiser M., Molenkamp R., Meijer A., Chu D. K. W., Bleicker T., Bruenink S., Schneider J., Schmidt M. L., Mulders D. G. J. C., Haagmans B. L., van der Veer B., van den Brink S., Wijsman L., Goderski G., Romette J.‐L., Ellis J., Zambon M., Peiris M., Goossens H., Reusken C., Koopmans M. P. G., Drosten C., Eurosurveillance 2020, 25, 23. [Google Scholar]
- 21. Morales‐Narvaez E., Dincer C., Biosens. Bioelectron. 2020, 163, 112274. [DOI] [PMC free article] [PubMed] [Google Scholar]
- 22. Moulahoum H., Ghorbanizamani F., Zihnioglu F., Turhan K., Timur S., Talanta 2021, 222, 121534. [DOI] [PMC free article] [PubMed] [Google Scholar]
- 23. Zhuang J., Yin J., Lv S., Wang B., Mu Y., Biosens. Bioelectron. 2020, 163, 112291. [DOI] [PMC free article] [PubMed] [Google Scholar]
- 24. Dincer C., Bruch R., Costa‐Rama E., Teresa Fernandez‐Abedu M., Merkoci A., Manz A., Urban G. A., Gueder F., Adv. Mater. 2019, 31, 1806739. [DOI] [PubMed] [Google Scholar]
- 25. Wang L., Pumera M., Trends Anal. Chem. 2021, 135, 116151. [Google Scholar]
- 26. Fernandez‐la‐Villa A., Pozo‐Ayuso D. F., Castano‐Alvarez M., Curr. Opin. Electrochem. 2019, 15, 175. [Google Scholar]
- 27. Alafeef M., Dighe K., Moitra P., Pan D., ACS Nano 2020, 14, 17028. [DOI] [PMC free article] [PubMed] [Google Scholar]
- 28. Huh Y. S., Park T. J., Lee E. Z., Hong W. H., Lee S. Y., Electrophoresis 2008, 29, 2927. [DOI] [PMC free article] [PubMed] [Google Scholar]
- 29. Moitra P., Alafeef M., Dighe K., Frieman M. B., Pan D., ACS Nano 2020, 14, 7617. [DOI] [PMC free article] [PubMed] [Google Scholar]
- 30. Zheng M., Jagota A., Semke E. D., Diner B. A., McLean R. S., Lustig S. R., Richardson R. E., Tassi N. G., Nat. Mater. 2003, 2, 338. [DOI] [PubMed] [Google Scholar]
- 31. Rohaizad N., Mayorga‐Martinez C. C., Novotny F., Webster R. D., Pumera M., Electrochem. Commun. 2019, 103, 104. [Google Scholar]
- 32. Sender R., Bar‐On Y. M., Gleizer S., Bernshtein B., Flamholz A., Phillips R., Milo R., Proc. Natl. Acad. Sci. USA 2021, 118, e2024815118. [DOI] [PMC free article] [PubMed] [Google Scholar]
- 33. Loo A. H., Bonanni A., Ambrosi A., Pumera M., Nanoscale 2014, 6, 11971. [DOI] [PubMed] [Google Scholar]
- 34. Toh R. J., Mayorga‐Martinez C. C., Han J., Sofer Z., Pumera M., Anal. Chem. 2017, 89, 4978. [DOI] [PubMed] [Google Scholar]
Associated Data
This section collects any data citations, data availability statements, or supplementary materials included in this article.
Supplementary Materials
Supporting Information
Data Availability Statement
The data that support the findings of this study are available from the corresponding author upon reasonable request.


