Abstract
The brain consists of thousands of neuronal types that are generated by stem cells producing different neuronal types as they age. In Drosophila, this temporal patterning is driven by the successive expression of temporal transcription factors (tTFs)1-3 We used single-cell mRNA sequencing to identify the complete series of tTFs that specify most Drosophila optic lobe neurons. We verify that tTFs regulate the progression of the series by activating the next tTF(s) and repressing the previous one(s), and also identify more complex regulations. Moreover, we establish the temporal window of origin and birth order of each neuronal type in the medulla and provide evidence that these tTFs are sufficient to explain the generation of all the neuronal diversity in this brain region. Finally, we describe the first steps of neuronal differentiation. We find that terminal differentiation genes, such as neurotransmitter-related genes, are present as transcripts, but not as proteins, in immature larval neurons; we show that these steps are conserved in humans. This comprehensive analysis of a temporal series of tTFs in the optic lobe offers mechanistic insights into how tTF series are regulated, and how they can lead to the generation of a complete set of neurons.
The brain is the most complex organ of the animal body: the human brain consists of over 80 billion neurons4 that belong to thousands of neuronal types. As neural stem cells age, temporal patterning allows them to generate different neuronal types in the correct order and stoichiometry1-3,5-7. Temporal patterning in neuronal systems was first described in the Drosophila ventral nerve cord (VNC), where a cascade of temporal transcription factors (tTFs) is expressed in embryonic neural stem cells (neuroblasts) as they divide and age8-10. This concept was later expanded to the Drosophila optic lobe, with a different tTF series. It was later suggested that tTFs also contribute to the generation of neuronal diversity in different mammalian neuronal tissues, such as the retina11-14 and the cortex15. However, series of tTFs are incomplete, as they were discovered by relying on existing antibodies. To generate a comprehensive description of the tTFs patterning a neural structure we have used single-cell mRNA sequencing (scRNASeq) of the larval fly optic lobe.
The Drosophila optic lobe is an ideal system to address how neuronal diversity is generated and how neurons proceed to differentiate. It is an experimentally manageable, albeit complex structure, for which we have a very comprehensive catalogue of neuronal cell types. Meticulous work from the last decades has identified multiple cell types in the optic lobes based solely on morphological characters16. Recent work took advantage of elaborate molecular genetic tools, as well as scRNASeq, to expand the number of neuronal cell types to ~200, based on both morphology and molecular identity17-19. Importantly, the neuroblasts that generate the medulla, which is the largest optic lobe neuropil containing ~100 neuronal types, are formed by a wave of neurogenesis over a period of days20,21 and progress through the same tTF temporal series22,23. This means that at any given developmental stage from mid third larval stage (L3) to early pupal stages (P15) the neurogenic region contains neuroblasts at all developmental stages (Figure 1a).
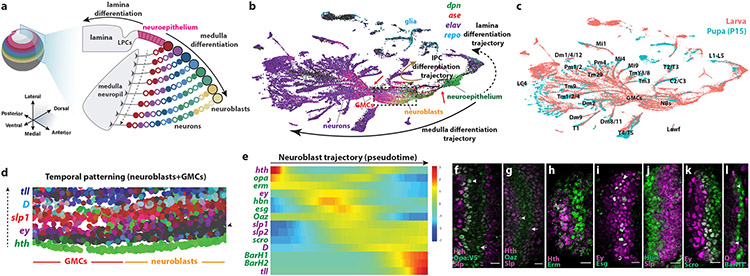
Figure 1. Single-cell sequencing of the developing Drosophila larval optic lobe.
(a) Schematic of the Drosophila L3 brain. The neuroepithelium is converted to lamina precursor cells (LPCs) laterally, and into medulla neuroblasts medially, in a wave of neurogenesis (youngest neuroblasts are closer to the neuroepithelium). As neuroblasts age, they produce different neuronal types (filled circles: NotchON, outlined circles: NotchOFF neurons). The dashed arrow points from young to old neurons.
(b) UMAP plot of ~70,000 single-cell transcriptomes from the integrated L3 and P15 optic lobe dataset. The arrows depict differentiation trajectories (medulla: black solid arrow, lamina: dashed arrow, lobula plate: brown arrow). GMCs form an hourglass (left red arrow) with reduced transcriptomic diversity. A similar hourglass is observed in the transition from neuroepithelium to neuroblasts (right red arrow). The dashed box contains neuroblasts and GMCs shown in d.
(c) Same UMAP plot as in b with L3 (pink) and P15 datasets (cyan) labeled.
(d) Close-up of the UMAP plot showing neuroblasts and GMCs. The previously described temporal factors are expressed in partially overlapping sets of neuroblasts organized in the plot from bottom to top (dashed arrow). A row of neuroblasts that do not express a known tTF (arrowhead), succeeds the hth-positive neuroblasts.
(e) Temporal expression of previously known (purple) and candidate (green) tTFs along the neuroblast developmental trajectory. Heatmap colors represent scaled expression along the trajectory.
(f-l) Immunostainings of newly identified (green) and previously known (purple) tTFs. (f) Opa:V537 is expressed in two waves, one after Hth (arrowhead) and one before Slp (arrow). (g) Oaz is expressed after Hth (arrowhead) and until Slp (arrow). (h) Erm is expressed after Hth. (i) Esg is expressed in a salt-and-pepper manner within the Ey window. (j) Hbn is expressed before Slp. (k) Scro is expressed after Ey (arrowhead). (l) BarH1 is expressed after D (arrowheads). Arrows and arrowheads point to overlapping expression. Scale bars:10 μm
Medulla neuroblast temporal series
To study neuroblast and neuronal trajectories, we performed scRNASeq on the optic lobes. We obtained 49,893 single-cell transcriptomes from 40 L3 optic lobes (Extended Data Figure 1). The Outer Proliferation Center (OPC) neuroepithelium generates two optic lobe neuropils: the medulla from the medial side and the lamina from the lateral side20 (Figure 1a). Medulla neuroepithelium, neuroblasts, intermediate precursors (called GMCs) and neurons were arranged in the UMAP24 following a progression that resembled their differentiation in vivo (Figure 1b - Extended Data Figure 2a). Similarly, lamina neuroepithelium, precursor cells, and neurons were also arranged following a similar differentiation trajectory but in the opposite orientation of that of the medulla. The neuroblasts and the neurons that are generated from the Inner Proliferation Center (IPC) followed a different trajectory in the UMAP plot (Figure 1b).
We then merged the larval single-cell dataset with the annotated early pupal stage 15 (P15) single-cell dataset18. The P15 neurons mapped at the tip of each of the neuronal trajectories (Figure 1c), which allowed us to identify the corresponding neuronal types. We identified neurons from all the neuropils of the optic lobe (lamina, medulla, lobula, and lobula plate), as well as a small number of neuroblasts and neurons from the central brain that were likely retained when microdissecting the optic lobe (Extended Data Figure 2b-c).
We then looked at the expression of the known spatial TFs in the OPC neuroepithelium and tTFs in the neuroblasts:
The spatial TFs Vsx1, Optix, and Rx25, were expressed in largely non-overlapping subsets of neuroepithelial cells (Extended Data Figure 2d-e).
The tTFs Homothorax (Hth), Eyeless (Ey), Sloppy-paired (Slp), D, and Tll22 were expressed in neuroblast subsets that were temporally organized in the UMAP plot (Figure 1d).
Thus, the UMAP plot recapitulated both proliferation and differentiation axes in the developing tissue: the UMAP horizontal axis represents differentiation status, while the vertical axis represents neuroblasts progressing through their tTF series.
The larval scRNASeq dataset gave us the opportunity to look for all potential tTFs in an unbiased way. We isolated the medulla neuroblast cluster from the scRNASeq data and used Monocle26 to reconstruct their developmental trajectory. Hth, Ey, Slp1/2, D and Tll were expressed in the previously described temporal order along the trajectory (Figure 1e). We therefore examined the expression dynamics of all TFs and identified 14 candidate tTFs whose expression was restricted to a specific pseudotime window, including the 6 previously known tTFs (Extended Data Figure 3). Using antibodies or in situ hybridization for the eight newly discovered candidate tTFs and those already known in medulla neuroblasts, we showed that their expression was indeed limited to restricted temporal windows (Figure 1f-l and Extended Data Figure 4), thus defining new temporal windows as the neuroblasts progress through divisions (Figure 1e).
tTFs assume different roles in the series
The previously known tTFs (except Hth) contribute to the progression of the series by activating the next tTF in the cascade and repressing the previous one22. To test which of the newly identified tTFs were involved in the progression of the temporal series (Figure 2a), we generated tTF mutant neuroblast MARCM clones27 or tTF RNAi knockdowns using the MZVUM-Gal4 line that is expressed in the Vsx1 domain28 of the OPC (Figure 2, Extended Data Figures 5-6).
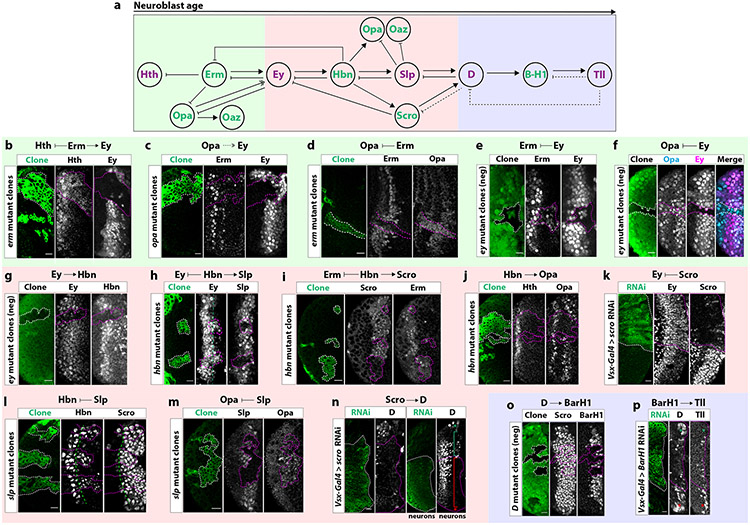
Figure 2. Complex genetic interactions between tTFs control the progression of the temporal series.
(a) The temporal series is subdivided into three units (early: green, middle: red and late: blue) by previously identified (purple) and new (green) tTFs.
(b) In erm MARCM mutant clones (GFP: green), Hth is extended and Ey is lost.
(c) In opa MARCM mutant clones (GFP: green), Erm is unaffected and Ey expression is delayed.
(d) In erm MARCM mutant clones (GFP: green), Opa is extended.
(e) Negatively labeled ey MARCM mutant clones (GFP-negative) express Erm beyond its temporal window.
(f) ey MARCM mutant clones (GFP-negative) express Opa beyond its temporal window. (g) In ey MARCM mutant clones (GFP-negative), Hbn expression is lost.
(h) In hbn MARCM mutant clones (GFP: green), Ey expression is extended, while Slp expression is lost.
(i) In hbn MARCM mutant clones (GFP: green), Erm is expanded and Scro expression is lost.
(j) The second Opa expression window is lost in hbn mutant clones (GFP: green).
(k) Cells expressing scro RNAi (GFP+: green; scro−) continue to express Ey into later temporal windows.
(l) In slp MARCM mutant clones (GFP: green) Hbn expression is extended without affecting Scro,.
(m) In slp MARCM mutant clones (GFP: green), Opa extends to later temporal windows.
(n) Left: In neuroblasts expressing scro RNAi (GFP+: green), D expression is lost. Right: Neurons coming from the D temporal window express D (green bracket). In the absence of Scro, D is no longer expressed (red bracket). Wild-type (green asterisk) and scro-RNAi expressing neuroblasts (D-, red asterisk) can be found in the surface.
(o) In negatively marked D mutant clones (GFP-negative), BarH1 expression is lost and Scro expression is unaffected.
(p) In comparison to wild-type NBs (red asterisk), NBs expressing BarH1 RNAi (GFP: green) (green asterisk) do not express Tll.
Genetic interactions uncovered in each experiment are shown for each panel. Scale bars: 10 μm
Early unit (Hth, Erm, Opa, Oaz):
Hth is expressed in the neuroepithelium and young neuroblasts, and is not required for Ey activation22. We identified two factors that regulate the expression of Ey in different manners: Erm is required to activate Ey and to inhibit Hth (Figure 2b), while Opa is required for the correct timing of Ey activation (Figure 2c). Opa also activates the expression of Oaz (Extended Data Figure 6b), which does not regulate the expression of any of the tTFs (Extended Data Figure 5f-j). Opa expression is repressed by Erm (Figure 2d). Once Ey expression is initiated at the correct time by the combined action of Erm and Opa, Ey represses the expression of its activators (Figure 2e-f). Therefore, Erm is essential for the progression of the cascade, while Opa contributes to the correct timing of expression of the next tTFs.
Middle unit (Ey, Hbn, Slp, Scro, Opa)
We had previously shown that Ey activates Slp, which in turn inhibits Ey22. However, the developmental trajectory of neuroblasts uncovered a more complex situation. First, Ey activates Hbn (Figure 2g). Hbn then represses Ey and activates Slp (Figure 2h). Hbn also activates Scro and a second wave of Opa expression (Figure 2i-j). Hbn then inhibits the expression of Erm (Figure 2i) and Scro inhibits the expression of Ey (Figure 2k). Finally, Slp inhibits Hbn, Opa, and Oaz (Figure 2l-m, Extended Data Figure 6c).
Late unit: (D, BarH1,Tll)
D expression requires both Slp and Scro. We had previously shown that in slp mutant clones, D is not expressed22. Similarly, when Scro was knocked down by RNAi, D was not activated (Figure 2n). Scro is therefore important for the progression of the series, as it inhibits Ey and activates the expression of D. It remains expressed until the end of the neuroblast life. Once D is activated, it inhibits Slp22 and activates BarH1 (Figure 2o), which in turn activates Tll (Figure 2p). Finally, similar to the inhibitory interaction between Tll and D previously described22, Tll is sufficient but not necessary to inhibit BarH1 (Extended Data Figure 5n, Extended Data Figure 6j).
We have thus identified most, if not all, temporally expressed TFs in a developing neuronal system and show that these tTFs participate in the progression of the temporal series. We also confirmed many of these interactions by analyzing the effect of tTF mis-expression on the temporal cascade (Extended Data Figure 6d-j).
Besides their participation in the progression of the temporal series, tTFs regulate neuronal identity. Some tTFs are maintained in the neuronal subsets that are generated during their temporal window (Extended Data Figure 7a-a'), while others are only maintained in newly born neurons (Extended Data Figure 7a’’-a’’’-b). tTFs activate the expression of downstream neuronal transcription factors22,23 that regulate effector genes in the absence of the tTF. To test how tTFs regulate neuronal identity, we asked whether knocking down the expression of the tTFs in neuroblasts affects the expression of neuronal transcription factors. The loss of hth, ey, and slp in neuroblasts leads to the loss of Bsh-, Vvl-, and Toy-positive neurons, respectively22. We show that Hbn is required for the specification of Toy, Traffic-jam (Tj) and Orthodenticle (Otd)-positive neurons (Extended Data Figure 7c-c’) and Opa is required for the generation of TfAP-2-positive neurons (Extended Data Figure 7d). Therefore, Hbn and Opa, as well as Hth, Ey, and Slp22, regulate neuronal diversity not only by allowing the temporal series to progress, but also by regulating neuronal transcription factor expression.
Temporal window of origin of medulla neurons
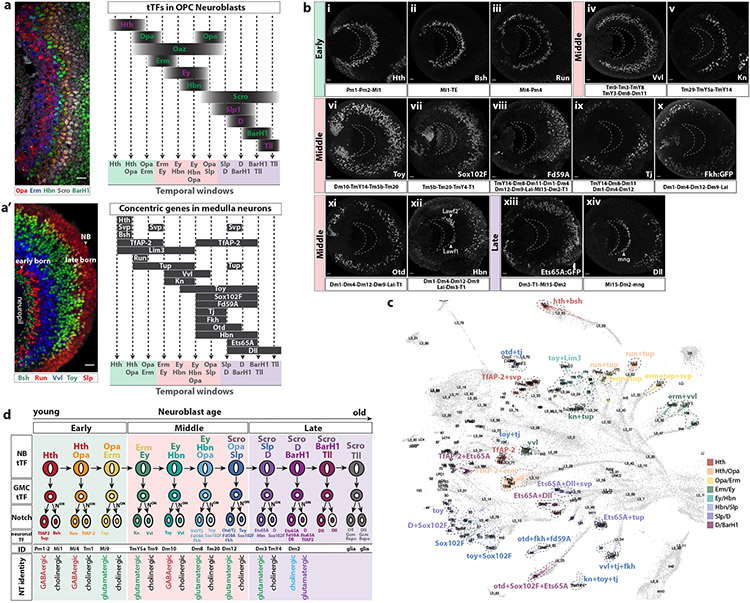
The identified tTFs define at least 11 temporal windows, in which different neurons (and glia) are generated (Figure 3a). As they are generated, newly born neurons displace earlier born neurons away from the parent neuroblast29, creating a columnar arrangement of neuronal cell bodies in the medulla cortex that represent birth order: Early born neurons are located close to the emerging medulla neuropil, while late born neurons are closer to the surface of the brain ( Figure 3a’ )29,30. Neurons born in each temporal window express downstream effectors of tTFs (e.g., Bsh, Runt (Run) and Vvl) that were termed “concentric genes” due to their pattern of expression22,29 ( Figure 3a’ ). We used the expression of tTFs in GMCs, and previously described22,29 and new concentric genes (this work) in scRNASeq neuronal clusters, together with their relative proximity in the UMAP plot (Figure 3b, Extended Data Figure 8), to assign the 105 neuronal clusters that comprise the medulla dataset (Extended Data Figure 8d) to their predicted temporal window of origin (Figure 3c and Supplementary Table 1). Proximal medulla (Pm) neurons are generated in the Hth and Hth/Opa temporal windows, while distal medulla (Dm) neurons are generated starting from the Ey temporal window. On the other hand, transmedullary (Tm) neurons are generated throughout most of the neuroblast life (Opa, Ey/Hbn and Slp temporal windows) (Figure 3c and Supplementary Table 1). Importantly, co-expression of some concentric genes is restricted to subregions of the medulla cortex, which allowed us to assign the spatial origin to several medulla neuron clusters (e.g. Extended Data Figure 8a arrowheads and Supplementary Table 1).
Figure 3. Temporal window of origin and birth order of medulla neurons.
(a) Left: Frontal view of L3 medulla NBs sequentially expressing the indicated tTFs. Right: Schematic of tTF expression as medulla neuroblasts age, based on immunostaining. Dashed lines represent predicted temporal windows.
(a’) Left: Sagittal section of L3 medulla cortex showing the expression of the concentric genes Bsh, Run, Vvl and Toy, and the tTF Slp. Early born neurons are located closer to the medulla neuropil, while later born neurons are farther. Right: Schematic of concentric gene expression in medulla neurons activated and maintained through different temporal windows.
(b) Sagittal sections of optic lobes showing the expression of concentric genes at L3 stage. Anterior is to the right and posterior to the left. Earlier born neurons are located closer to the medulla neuropil (dashed crescent). Early, middle and late subdivisions are based on the predicted temporal windows when a given concentric gene starts to be expressed. Medulla neurons that express the corresponding concentric gene are indicated below each panel. Tj (ix) and Fork head (Fkh:GFP) (x) expression is restricted to specific regions of the medulla cortex. Hbn (xii) is also expressed in lamina wide-field neurons (Lawf1-2, arrowheads) that originate from the Dpp regions of the lamina neuroepithelium and migrate along the medulla neuropil38. Dll (xiv) is also expressed in medulla neuropil glia (mng, arrowhead)22.
(c) UMAP plot showing differently colored medulla clusters from the P15 dataset indicating groups that share concentric gene expression within a given temporal window. Cluster identity is indicated when known.
(d) Schematic representing tTF expression in medulla NBs and GMCs and downstream concentric gene expression in neurons. Neurons and glia predicted to be generated in each temporal window are indicated. Neurons sharing the same Notch status generated in the same temporal window express the same neurotransmitter (NT).
Scale bar: 10 μm
To assess the Notch status of all neuronal types, we also looked at the expression of Apterous (Ap), which is expressed in the NotchON progeny of each GMC22. Among the 105 neuronal types, 64 were NotchOFF and 41 NotchON (Extended Data Figure 8c and Supplementary Table 1). Since a given GMC division generates one NotchON and one NotchOFF neuron, Ap+ and Ap− neurons are intermingled in the medulla cortex22. Therefore, the position in the medulla cortex of concentric TFs expressed in NotchON and NotchOFF neurons allows us to infer sister neurons, for instance Run neurons are likely sisters of TfAP-2 neurons, while early born Vvl neurons are likely sisters of Knot (Kn) neurons (Extended Data Figure 8a vii,xi).
Finally, we assigned neurotransmitter identity to all the medulla clusters at L3 and P15 stages (Supplementary Table 1). Ap expression is highly correlated with cholinergic identity17, as nearly all Ap+, i.e. NotchON, clusters in our dataset express ChAT and thus have cholinergic identity, while most of the NotchOFF clusters are either GABAergic (most of them express Lim3)17 or glutamatergic (most of them express Tj or Fd59A)17. Interestingly, all the NotchOFF neurons from the same temporal window express the same neurotransmitter, independently of their spatial origin (Figure 3d and Supplementary Table 1). This suggests that the temporal origin of medulla neurons and their Notch status instructs shared TF expression and neurotransmitter identity, and hence function. In summary, we defined the temporal (and spatial) origin, birth order, and Notch identity of all medulla cell types and highlight the role of tTFs in regulating the generation of neural diversity.
Early commitment to neuronal identity
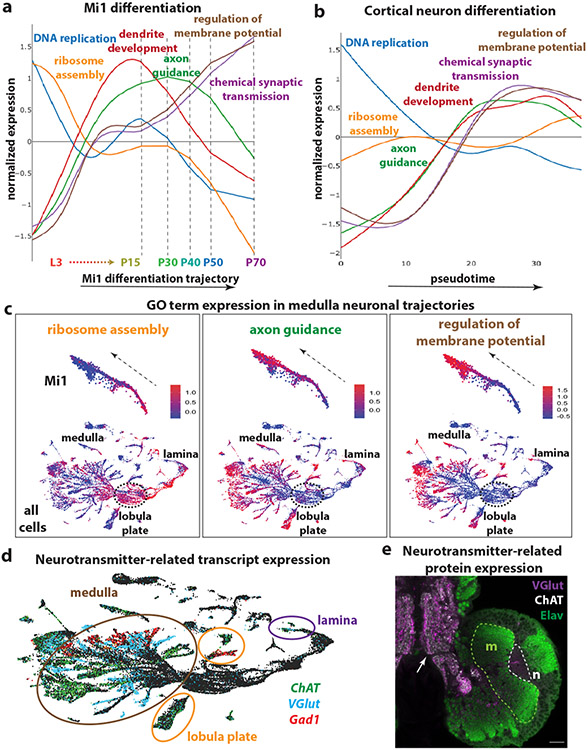
To study the first steps of neuronal differentiation after specification, we merged the clusters from pupal stages (P15, P30, P40, P50, and P70) corresponding to the Mi1 cells with the L3 scRNASeq cluster and the GMCs most closely linked to them in the UMAP plot (Extended Data Figure 9a). We reconstructed their differentiation trajectory (Extended Data Figure 9b-c), identified groups of genes (modules) that co-vary along the entire trajectory from L3 to P70 and searched for the Gene Ontology (GO) terms enriched in each gene module (Figure 4a). The timing of differentiation appears to follow a specific path: At L3, cell cycle genes and DNA replication genes are first expressed, as expected from the division of GMCs. This is closely followed by genes involved in translation. Then, genes related to dendrite development and axon-guidance are upregulated from late L3 until P30, stages when the neurons direct their neurites to the appropriate neuropils. Genes important for neuronal function, such as neurotransmitter-related genes, synaptic transmission proteins, as well as ion channels start to be expressed as early as L3, reaching a plateau that is maintained until P15. Their expression then increases again until adulthood, when their products support neuronal function (Figure 4a). This timing of differentiation was observed not only for Mi1 but could be generalized to all optic lobe neurons (Figure 4c). These results indicate that not only is neuronal identity specified during the first hours of neuronal development, but their neuronal function (as indicated by the upregulation of chemical synaptic transmission terms) is implemented very early, although it will only be required much later. As this was unexpected, we asked whether neurotransmitter mRNA expression observed as early as late L3 was also translated into protein. Neurotransmitter-related genes, ChAT, VGlut, and Gad1 mRNA are all expressed in the scRNASeq data in non-overlapping neuronal sets (Figure 4d) and are maintained in the adult18 (Supplementary Table 1). However, we did not observe protein expression at L3 (Figure 4e). This suggests that their transcription represents a commitment to a specific neurotransmitter identity early, but that other factors prevent premature translation of these mRNAs until they are needed at later stages of development.
Figure 4. Neuronal differentiation in flies and humans.
(a) Average expression of genes belonging to different Gene Ontology (GO) terms during the differentiation trajectory of Mi1 neurons. DNA replication is enriched at the beginning of the trajectory, followed by ribosome assembly and translation-related terms. Then, terms involved in neurite development and neuropil targeting, such as dendrite development and axon guidance, are enriched and peak around P15 and P30. Neuronal function terms, such as regulation of membrane potential and neurotransmission start to be upregulated as early as L3, reach a plateau around P15, and increase drastically from P30.
(b) Average expression of genes belonging to the Drosophila GO terms that were described in “a”, over pseudotime in human cortical neurons. The differentiation path is similar to Drosophila neurons, with the exception of ribosome assembly terms, which are not enriched in human cortical neurons.
(c) UMAP plots containing L3 and P15 single cells showing the developmental progression in Mi1s neurons (top – dashed arrows), which is similar for all optic lobe neurons (bottom), including lamina and lobula plate neurons. Ribosome assembly, axon guidance and regulation of membrane potential terms are sequentially upregulated.
(d) UMAP plot showing the expression of ChAT (green), VGlut (blue), and Gad1 (red), as markers for cholinergic, glutamatergic, and GABAergic cells, respectively, in medulla (brown), lamina (purple) and lobula plate (orange) neurons. These transcripts are already detected in cells at L3 stage.
(e) Immunostaining of VGlut (purple), ChAT (white) and Elav (green), in the developing Drosophila central nervous system at L3 stage. Neurons in the medulla (dashed line, m) express Elav (green) but do not express VGluT or ChAT protein in the neuropil (n), although the transcripts are present at this stage. However, VGlut and ChAT are expressed in the projections of mature larval neurons (also marked by Elav) of the ventral nerve cord (arrow). Scale bar:20 μm.
Common trajectory of Drosophila and human neurons
We then asked whether the Drosophila optic lobe neuronal differentiation trajectory was similar to human neuronal differentiation. We generated single-nuclear RNAseq data from the human fetal cortical plate at gestational week 19. We used Monocle3 to reconstruct their developmental trajectory (Extended Data Figure 9d-e) from apical progenitors to intermediate progenitors and postmitotic neurons (Extended Data Figure 9f) and identified gene modules that were co-regulated along the trajectory. GO analysis uncovered a remarkable similarity to Drosophila (Extended Data Figure 9g). We then plotted the expression of the GO terms that were expressed at different stages of the differentiation trajectory in Drosophila on the human cortical differentiation trajectory (Figure 4b). We observed very similar dynamics; the main difference was the absence of enrichment for ribosome assembly and translation-related GO terms at early stages. This could potentially be explained by the slower development of human neurons compared to Drosophila, which leads to a slower increase in size and the fact that the divisions of the radial glia are more symmetric31 than those of optic lobe neuroblasts. Despite this difference, these results show that neurons follow a similar differentiation trajectory in Drosophila and humans.
Drosophila tTFs in mouse progenitors
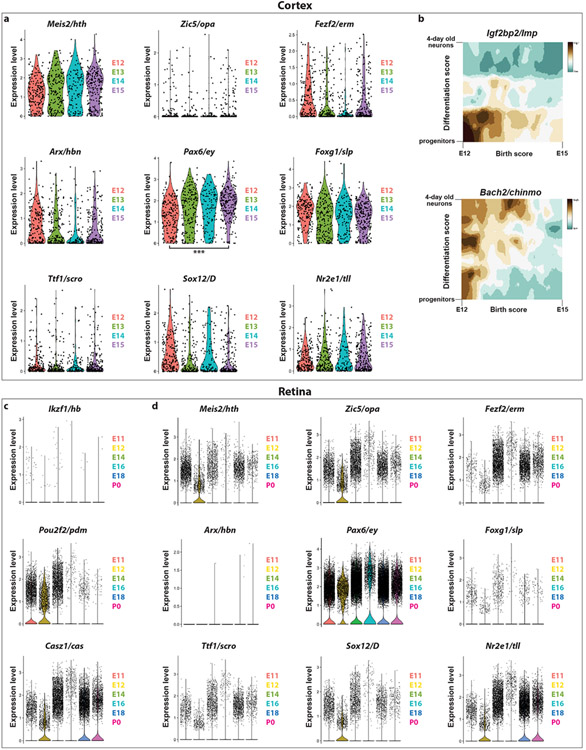
Although temporal patterning is a universal neuronal specification mechanism32,33, it is unclear how it has evolved6,7. We asked whether the medulla tTFs were conserved in mouse cortical radial glia using a published scRNASeq dataset34. None of the medulla neuroblast tTFs were expressed in strict temporal windows in ageing radial glia, with the exception of Pax6, which was enriched in older progenitors (Extended Data Figure 10a). Reciprocally, the Drosophila orthologs of the mouse temporally expressed TFs33 were not expressed temporally in the developing optic lobe.
The mouse orthologs of Drosophila VNC tTFs Ikzf1, Pou2f1/Pou2f2, and Casz1 are expressed temporally in mouse retinal progenitors11,12,14. We looked at the expression of the optic lobe tTFs in the mouse retina in a published scRNASeq dataset35. Pax6/Ey was constitutively expressed, Meis2/Hth, Zic5/Opa, and Sox12/D were expressed at embryonic stage 12, while Nr2e1, the ortholog of Tll (which is expressed when neuroblasts become gliogenic), was expressed late, when retinal progenitors become gliogenic and start generating Müller glia36 (Extended Data Figure 10d). The lack of a strict conservation of tTFs between flies and mice indicates that the acquisition of the specific temporal series occurred independently in each phylum.
Conclusions
The comprehensive series of transcription factors described in this work and their regulatory interactions temporally pattern a developing neural structure. We show that most tTFs are expressed in overlapping windows, creating combinatorial codes that differentiate neural stem cells of different ages and therefore provide them with the ability to generate diverse neurons after every division. We conservatively assigned them into 11 distinct temporal windows (10 of which generate neurons), which, when integrated with spatial patterning (6 spatial domains) and the Notch binary cell fate decision, can explain the generation of ~120 cell types, which is close to the entire neuronal type diversity of the Drosophila medulla. Moreover, we determined the downstream TFs that were expressed in neurons produced temporally, which allowed us to establish the birth order of all medulla neurons. Additionally, we provide a detailed transcriptomic description of the first steps in the differentiation trajectory of a neuron. Terminal differentiation genes are expressed within the first 20 hours of neuronal life, approximately 2-4 days before their protein products can fulfil their function. Why these genes are expressed so early remains unknown, but we hypothesize that this reflects the commitment of neurons to a specific function. We also show that all neurons follow the same route for differentiation and that this is similar to the differentiation process in developing human cortical neurons. Hence, understanding the mechanisms of neuronal differentiation in flies can generate insight for the equivalent process in humans (see also Supplementary Discussion).
Methods
Genetics
To generate MARCM clones, crosses were kept at 25 °C and were heat-shocked for one hour at 37 °C four days before dissecting wandering L3 larvae. For RNAi experiments, MzVUM-Gal4 (Vsx-Gal4) flies were crossed to flies carrying the RNAi construct; the crosses were kept at 25 °C before dissecting wandering L3 larvae. The crosses are indicated below:
hth RNAi: MzVUM-Gal4; UAS-CD8.GFP; flies were crossed with ;hth-RNAi; flies
Oaz RNAi: MzVUM-Gal4; UAS-CD8.GFP; flies were crossed with yscvsev;; Oaz-RNAi flies
scro RNAi: MzVUM-Gal4; UAS-CD8.GFP; flies were crossed with yv;; scro-RNAi flies
BarH1 RNAi: MzVUM-Gal4; UAS-CD8.GFP; flies were crossed with ;BarH1-RNAi; flies
erm- MARCM clones: ;erm1, FRT40A/CyO,act-GFP; flies were crossed with UAS-CD8GFP, hs-flp; FRT40A, tub-Gal80; tub-Gal4/TM6B flies.
opa- MARCM clones: ;;FRT82B - opa(null)/TM6B flies were crossed with yw, hs-flp, UAS-GFP;; tub-Gal4, FRT82B, tub-Gal80/TM6C flies.
ey- MARCM clones: yw, hs-flp122; +/(Cyo); FRT80B/TM6B; ey[j5.71]/In(4) flies were crossed with yw, hs-flp122; +/cyo; FRT80B ey-rescue (y+) ubiGFP/TM6B; ey [J5.71]/In(4) flies.
D- MARCM clones: yw; If/Cyo; D[87],FRT2A/TM6B flies were crossed with yw, hs-flp; if/cyo; FRT2A, ubi-nlsGFP/TM6B flies.
hbn- MARCM clones: FRT42B(G13), hbn15227 flies were crossed with yw, hs-flp; FRT42B(G13), tub-Gal80/CyO, act-GFP; tub-Gal4, UAS-CD8GFP/TM6,Tb,Hu flies.
slp- MARCM clones: yw, hs-flp122; slp[s37a],FRT40A/SM6~TM6B flies were crossed with UAS-CD8GFP, hs-flp; FRT40A, tub-Gal80; tub-Gal4/TM6B flies.
tll- MARCM clones: w;; FRT82B, tll[I49]/TM3,GFP,Ser flies were crossed with yw, hs-flp, UAS-GFP;; tub-Gal4, FRT82B, tub-Gal80/TM6C flies.
Origin of all individual stocks is detailed in Supplementary Table 2.
Antibody generation
Polyclonal antibodies were generated by Genscript (https://www.genscript.com/). The epitopes used for each immunization are listed below.
Erm
KTFSCLECGKVFNAHYNLTRHMPVHTGARPFVCKVCGKGFRQASTLCRHKIIHTSEKPHKCQTCGKAFNRSSTLNTHSRIHAGYKPFVCEYCGKGFHQKGNYKNHKLTHSGEKAYKCNICNKAFHQVYNLTFHMHTHNDKKPYTCRVCAKGFCRNFDLKKHMRKLHEIGGDLDDLDMPPTYDRRREYTRREPLASGYGQASGQLTPDSSSGSMSPPINVTTPPLSSGETSNPAWPRSAVSQYPPGGFHHQLGVAPPHDYPSGSAFLQLQPQQPHPQSQQHHQQQQRLSETFIAKVF
Ey
MFTLQPTPTAIGTVVPPWSAGTLIERLPSLEDMAHKDNVIAMRNLPCLGTAGGSGLGGIAGKPSPTMEAVEASTASHPHSTSSYFATTYYHLTDDECHSGVNQLGGVFVGGRPLPDSTRQKIVELAHSGARPCDISRILQVSNGCVSKILGRYYETGSIRPRAIGGSKPRVATAEVVSKISQYKRECPSIFAWEIRDRLLQENVCTNDNIPSVSSINRVLRNLAAQKEQQSTGSGSSSTSAGNSISAKVSVSIGGNVSNVASGSRGTLSSSTDLMQTATPLNSSESGGASNSGEGSEQEAIYEKLRLLNTQHAAGPGPLEPARAAPLVGQSPNHLGTRSSHPQLVHGNHQALQQHQQQSWPPRHYSGSWYPTSLSEIPISSAPNIASVTAYASGPSLAHSLSPPNDIESLASIGHQRNCPVATEDIHLKKELDGHQSDETGSGEGENSNGGASNIGNTEDDQARLILKRKLQRNRTSFTNDQIDSLEKEFERTHYPDVFA
Esg
MHTVEDMLVEKNYSKCPLKKRPVNYQFEAPQNHSNTPNEPQDLCVKKMEILEENPSEELINVSDCCEDEGVDVDHTDDEHIEEEDEDVDVDVDSDPNQTQAAALAAAAAVAAAAAASVVVPTPTYPKYPWNNFHMSPYTAEFYRTINQQGHQILPLRGDLIAPSSPSDSLGSLSPPPHHYLHGRASSVSPPMRSEIIHRPIGVRQHRFLPYPQMPGYPSLGGYTHTHHHH
Hbn
MMTTTTSQHHQHHPIMPPAMRPAPVQESPVSRPRAVYSIDQILGNQHQIKRSDTPSEVLITHPHHGHPHHIHHLHSSNSNGSNHLSHQQQQQHSQQQHHSQQQQQQQQLQVQAKREDSPTNTDGGLDVDNDDELSSSLNNGHDLSDMERPRKVRRSRTTFTTFQLHQLERAFEKTQYPDVFTREDLAMRLDLSEARVQVWFQNRRAKWRKREKFMNQDKAGYLLPEQGLPEFPLGIPLPPHGLPGHPGSMQSEFWPPHFALHQHFNPAAAAAAGLLPQHLMAPHYKLPNFHTLLSQYMGLSNLNGIFGAGAAAAAAAASAGYPQNLSLHAGLSAMSQVSPPCSNSSPRESPKLVPHPTPPHATPPAGGNGGGGLLTGGLISTAAQSPNSAAGASSNASTPVSVVTKGED
Scro
MSSHGLAYTTRIERKSYRELQINRDQYFVTAPNEEDLVMSLSPKDTLIHTAISQHHQVDTSTKLNTNETSTQNTVSTAAAAAVAHHHHNLSSIHHLQNLHSQHQSTLFNSNH
Slp2
MVKIEEGLPSSEISAHSLHFQHHHHPLPPTTHHSALQSPHPVGLNLTNLMKMARTPHLKSSFSINSILPETVEHHDEDEEEDVEKKSPAKFPPNHNNNNLNTTNWGSPEDHEAESDPESDLDVTSMSPAPVANPNESDPDEVDEEFVEEDIECDGETTDGDAENKSNDGKPVKDKKGNE
Vvl (rat)
EEDTPTSDDLEAFAKQFKQRRIKLGFTQADVGLALGTLYGNVFSQTTICRFEALQLSFKNMCKLKPLLQKWLEEADSTTGSPTSIDKIAAQGRKRKKRTSIEVSVKGALEQHFHKQPKPSAQEITSLADSLQLEKEVVRVWFCNRRQKEKRMTPPNTLGG
Tll
MQSSEGSPDMMDQKYNSVRLSPAASSRILYHVPCKVCRDHSSGKHYGIYACDGCAGFFKRSIRRSRQYVCKSQKQGLCVVDKTHRNQCRACRLRKCFEVGMNKDAVQHERGPRNSTLRRHMAMYKDAMMGAGEMPQIPAEILMNTAALTGFPGVPMPMPGLPQRAGHHPAHMAAFQPPPSAAAVLDLSVPRVPHHPVHQGHHGFFSPTAAYMNALATRALPPTPPLMAAEHIKETAAEHLFKNVNWIKSVRAFTELPMPDQLLLLEESWKEFFILAMAQYLMPMNFAQLLFVYESENANREIMGMVTREVHAFQEVLNQLCHLNIDSTEYECLRAISLFRKSPPSASSTEDLANSSILTGSGSPNSSASAESRGLLESGKVAAMHNDARSALHNYIQRTHPSQPMRFQTLLGVVQLMHKVSSFTIEELFFRKTIGDITIVRLISDMYSQRKI
Otd
MAAGFLKSGDLGPHPHSYGGPHPHHSVPHGPLPPGMPMPSLGPFGLPHGLEAVGFSQGMWGVNTRKQRRERTTFTRAQLDVLEALFGKTRYPDIFMREEVALKINLPESRVQVWFKNRRAKCRQQLQQQQQSNSLSSSKNASGGGSGNSCSSSSANSRSNSNNNGSSSNNNTQSSGGNNSNKSSQKQGNSQSSQQGGGSSGGNNSNNNSAAAAASAAAAVAAAQSIKTHHSSFLSAAAAAASGGTNQSANNNSNNNNQGNSTPNSSSSGGGGGSQAGGHLSAAAAAAALNVTAAHQNSSPLLPTPATSVSPVSIVCKKEHLSGGYGSSVGGGGGGGGASSGGLNLGVGVGVGVGVGVGVSQDLLRSPYDQLKDAGGDIGAGVHHHHSIYGSAAGSNPRLLQPGGNITPMDSSSSITTPSPPITPMSPQSAAAAAHAAQSAQSAHHSAAHSAAYMSNHDSYNFWHNQYQQYPNNYAQAPSYYSQMEYFSNQNQVNYNMGHSGYTASNFGLSPSPSFTGTVSAQAFSQNSLDYMSPQDKYANMV
Run
MHLPAGPTMVANNTQVLAAAAAAAAAAAAAVAQGPGPQQSSNATTASAIAINPAQSLANTSTHSASSTGSSTPDLSTNNTSSSSNATTSPQNSAKMPSSMTDMFASLHEMLQEYHGELAQTGSPSILCSALPNHWRSNKSLPGAFKVIALDDVPDGTLVSIKCGNDENYCGELRNCTTTMKNQVAKFNDLRFVGRSGRGKSFTLTITIATYPVQIASYSKAIKVTVDGPREPRSKQSYGYPHPGAFNPFMLNPAWLDAAYMTYGYADYFRHQAAAQAAQVHHPALAKSSASSVSPNPNPSVATSSSSAVQPSEYPHPAAAVAAAAGQPAAMMPSPPGAAPATPYAIPQFPFNHVAAAAAAKAATPHAFHPYNFAAAAGLRARNAALHHQSEPVHVSPASSRPSSSSPTQQHVLLKLNTSIETSSIHEQSASDGDSDDEQIDVVKSEFDLDKSLDVAPLRMRCDLKAPSAMKPLYHESGPGAVANSRQPSPETTTKIKSAAVQQKTVWRPY
Kn
TGNTSLSISGHPLAPDSTYDGLYPPLPVATPCIKAISPSEGWTTGGATVIIVGDNFFDGLQVVFGTMLVWSELITSHAIRVQTPPRHIPGVVEVTLSYKSKQFCKGSPGRFVYVSALNEPTIDYGFQRLQKLIPRHPGDPEKLQKEIILKRAADLVEALYSMPRSPGGSTGFNSYAGQLAVSVQDGSGQWTEDDYQRAQSSSVSPRGGYCSSASTPHSSGGSYGATAASAAVAATANGYAPAPNMGTLSSSPGSVFNSTSRVSSLSFNPFALPTCNTQGYSTQLVTSTK
Toy
MRTQRRSADTVDGSGRTSTANNPSGTTASSSVATSNNSTPGIVNSAINVAERTSSALVSNSLPEASNGPTVLGGEANTTHTSSESPPLQPAAPRLPLNSGFNTMYSSIPQPIATMAENYNSSLGSMTPSCLQQRDAYPYMFHDPLSLGSPYVSAHHRNTACNPSAAHQQPPQHGVYTNSSPMPSSNTGVISAGVSVPVQISTQNVSDLTGSNYWPRLQ
Sox102F
MKPPGEDQTNEKEHSDLGMIKQLQLIRNRILSQAHYDSMTDIDASAQQQQQLQNVQRLQHESCLQELHNHLSSQYGAVRFTAANPQHQNQQAVSVSSGNLMPFLPAFLQPPMPNAQQLLQLIPGHENAQSVPTHHHSHPQSEAFSTHKMALAPMWSTAAVAAAHIQAALAAAAVAAANNNKNSSHFSNNTNIVGL
Dll
MDAPDAPHTPKYMDGGNTAASVTPGINIPGKSAFVELQQHAAAGYGGIRSTYQHFGPQGGQDSGFPSPRSALGYPFPPMHQNSYSGYHLGSYAPPCASPPKDDFSISDKCEDSGLRVNGKGKKMRKPRTIYSSLQLQQLNRRFQRTQYLALPERAELAASLGLTQTQVKIWFQNRRSKYKKMMKAAQGPGTNSGMPLGGGGPNPGQHSPNQMHSGELANGRFLWAALETNGTLALVHSTGGNNGGGSNSGSPSHYLPPGHSPTPSSTPVSELSPEFPPTGLSPPTQAPWDQKPHWIDHKPPPQMTPQPPHPAATLHPQTHHHNPPPQMGGYVPQYWYQPETNPSLVT
Oaz
MRTQRRSADTVDGSGRTSTANNPSGTTASSSVATSNNSTPGIVNSAINVAERTSSALVSNSLPEASNGPTVLGGEANTTHTSSESPPLQPAAPRLPLNSGFNTMYSSIPQPIATMAENYNSSLGSMTPSCLQQRDAYPYMFHDPLSLGSPYVSAHHRNTACNPSAAHQQPPQHGVYTNSSPMPSSNTGVISAGVSVPVQISTQNVSDLTGSNYWPRLQ
Ap
MRARNLVFHVNCFCCTVCHTPLTKGDQYGIIDALIYCRTHYSIAREGDTASSSMSATYPYSAQFGSPHNDSSSPHSDPSRSIVPTGIFVPASHVINGLPQPARQKGRPRKRKPKDIEAFTANIDLNTEYVDFGRGSHLSSSSRTKRMRTSFKHHQLRTMKSYFAINHNPDAKDLKQLSQKTGLPKRVLQVWFQNARAKWRRMMMKQDGSGLLEKGEGALDLDSISVHSPTSFILGGPNSTPPLNLD
TfAP-2
CLDKSKIDNEKK
Dpn
HTKLEKADILEMTVKHLQSVQRQQLNMAIQSDPSVVQKFKTGFVECAEEVNRYVSQMDGIDTGVRQRLSAHLNQCANSLEQIGSMSNFSNGYRGGLFPATAVTAAPTPLFPSLPQDLNNNSRTESSAPAIQMGGLQLIPSRLPSGEFALIMPNTGSAAPPPGPFAWPGSAAGVAAGTASAALASIANPTHLNDYTQSFRMSAFSKPVNTSVPANLPENLIHTLPGQTQLPVKNSTSPPLSPISSISSHCEESRAASPTVDVMSKHSFAGVFSTPPPTSAETSFNTSGSLNLSAGSHDSSGCSRPLAHLQQQQVSSTSGIAKRDREAEAESSDCSLDEPSSKKFLAGAIEKSSS
Immunohistochemistry
Wandering third instar larval Drosophila optic lobes were fixed in 4% formaldehyde for 15-20 minutes at room temperature (with the exception of immunostainings using mouse anti-eyeless, rat anti-Oaz and rabbit anti-Opa antibodies, for which fixation was on ice for 30 minutes). After washing, they were incubated for 2 days with primary antibodies at 4 °C. After washing the primary antibody, the brains were incubated with the secondary antibodies overnight at 4 °C. The secondary antibodies were washed, and the brains were mounted in Slowfade and imaged at a confocal microscope (Leica SP8) using a 63x glycerol objective. Images were processed in Fiji and Illustrator.
Origin of all individual antibodies is detailed in Supplementary Table 2.
Statistics and reproducibility
Male and female larvae (stage L3) were selected randomly from the fly vials for all experiments. Blinding across different genotypes was not performed, as the genotype can be distinguished by the experimenter. All immunohistochemistry experiments were performed in at least 3 different biological replicates (brains of different animals) for each genotype, which is sufficient as it is well-established that the structure and composition of the Drosophila brain is very stereotypical. Moreover, all mutant phenotypes were very penetrant. In particular, n = :
Figure 1: (f) 4, (g) 4, (h) 4, (i) 4, (j) 3, (k) 4, (l) 4
Figure 2: (b) 7, (c) 6, (d) 5, (e) 7, (f) 4, (g) 4, (h) 6, (i) 5, (j) 3, (k) 6, (l) 3, (m) 5, (n) 7, (o) 5, (p) 5
Figure 3b: (i) 4, (ii) 7, (iii) 7, (iv) 4, (v) 6, (vi) 24, (vii) 3, (viii) 10, (ix) 3, (x) 4, (xi) 4, (xii) 9, (xiii) 11, (xiv) 6
Figure 4e: 3
Extended Data Figure 3: (c) 5, (d) 2
Extended Data Figure 4: (a) 8, (b) 3, (c) 4, (d) 6, (e) 4, (f) 4, (g) 3, (h) 4, (i) 3
Extended Data Figure 5: (b) 5, (c) 3, (d) 6, (e) 6, (f) 4, (g) 4, (h) 4, (i) 3, (j) 4, (k) 10, (l) 3, (m) 3, (n) 4, (o) 4, (p) 4, (q) 3
Extended Data Figure 6: (b) 6, (c) 7, (d) 7, (e) 4, (f) 4, (g) 4, (h) 4, (i) 4, (j) 6
Extended Data Figure 7: (b) 4, (c) 4, (c’) 4, (d) 6
Extended Data Figure 8a: (i) 4, (ii) 3, (iii) 3, (iv) 6, (v) 4, (vi) 7, (vii) 7, (viii) 4, (ix) 4, (x) 4, (xi) 5, (xii) 3, (xiii) 3, (xiv) 6
Extended Data Figure 8b: (i) 6, (ii) 11, (iii) 11
Extended Data Figure 8c: (i) 5, (ii) 5, (ii’) 3, (ii’’) 3, (ii’’’) 3, (iii) 4, (iii’) 4, (iii’’) 4, (iii’’’) 4, (iii’’’’) 4
Hybridization Chain Reaction-RNA FISH
To perform HCR-RNA FISH, custom probes were designed for BarH1, BarH2, Oaz and dpn coding sequences and sourced from Molecular Instruments. Wash, amplification and hybridization buffers, and fluorophore-labelled amplification hairpins, were obtained from Molecular Instruments. The HCR protocol for Drosophila larval brains used was as specified in: dx.doi.org/10.17504/protocols.io.bzh5p386. Amplification hairpins used were labelled with Alexa Fluor 488, 546, 594 and 647.
Birth order of medulla neurons and temporal window assignment
The current L3-P15 scRNASeq dataset contains some neurons that do not originate from the main OPC neuroepithelium that generates medulla neurons. We removed from the analysis Low Quality (LQ) clusters, clusters containing more than one cell type, glial clusters, clusters with a different origin from the medulla and clusters that were transcriptionally more similar to these than to medulla neurons (see Extended Data Figure 8). Additionally, clusters that express a combination of concentric genes that we do not observe in the medulla cortex by immunostaining were removed, such as 13 (Run+TfAP-2) (Extended Data Figure 8a vii), 114 (Hbn+Ap) (Extended Data Figure 8c ii’’’), and clusters 51 and 169b (Toy+Hbn) (Extended Data Figure 8a xiv). To establish the birth order of all the clusters in the medulla dataset and its predicted temporal window of origin (Figure 3c and Supplementary Table 1), we used the mRNA expression of tTFs in GMCs, and tTFs and concentric genes in medulla neuronal clusters at L3 and P15, together with their relative position in UMAP plot (Extended Data Figure 7a-a’’’’’’ and 3c). To identify medulla clusters expressing a given concentric gene and/or tTF (Supplementary Table 1), we used Mixture Modelling39 at P15 stage from Ozel et al., 202018, and confirmed the results using violin plots for each concentric gene. To define the relative order of concentric gene expression in medulla neurons, we immunostained late L3 brains with these TFs (see Figure 3b) and analyzed the most medial part of the medulla cortex, where neurons are more mature and hence more similar to the P15 dataset. Several criteria were considered to assign a cluster to a given temporal window: tTF expression in GMCs and neuronal clusters, concentric gene expression in neuronal clusters, UMAP position, transcriptional similarity based on hierarchical cluster tree (Extended Data Figure 8) and experimental data from MARCM mutant clones in NB tTFs where a given concentric gene is lost in neurons (Extended Data Figure 7c-d and 22,23,29,40).
Single-cell RNA seq
Drosophila optic lobes sample preparation
The developing central nervous system from male and female flies was dissected from Canton-S wandering third instar larvae in PBS. The optic lobes were separated from the central brain using Vannas Spring Scissors with a 2mm cutting edge (Fine Science Tools Cat no. 15000-04). The optic lobes were dissociated into single cell suspension by incubating in 2mg/mL collagenase and 2mg/mL dispase in PBS for 15 minutes at 25 °C. The enzymes were then carefully removed and replaced with PBS + 0.1% BSA. The brains are soft but remain intact if pipetted slowly. The brains were pipetted up and down many times (> 100) until most large chunks of tissue were dissociated. The cells/tissue were kept cold by putting the tubes on ice. The cells were then filtered using 20 μm cell strainers. The concentration of the cell suspension was then measured staining the cells with 1/2000 Hoechst, using an epifluorescent microscope and a 0.02-mm deep cytometer.
Library preparation and sequencing
Droplet-based purification, amplification and barcoding of single-cell transcriptomes were performed using Chromium Single Cell 3′Reagent Kit v2 (10x Genomics) as described in the manufacturer’s manual (Chromium Single Cell 3′Reagent Kits v2 User Guide – Rev D), with a target recovery of 7,000 cells per experiment. We prepared 10 libraries (biological replicates), which were subjected to paired-end sequencing (26 × 8 × 98) with NovaSeq 6000 (Genome Technology Center at NYU Langone Health) to an average 50,000 reads per cell sequenced (that is, 350,000,000 reads for an experiment with 7,000 cells).
Single-nucleus RNA seq
Human cortical plate sample preparation
Tissue was collected from de-identified prenatal autopsy specimens without neuropathological abnormalities. All autopsies were done with written consent from the legal next-of-kin. The Icahn School of Medicine Institution Review Board considers autopsies as non-human subjects. Utilization of fetal specimens was determined as non-human research by the Icahn School of Medicine Institution Review Board and exemption was provided to Dr. Nadejda Tsankova (HS#: 14-01007). The cortical plate was dissected fresh from the anterior frontal lobe of anatomically intact brain specimens with postmortem time interval less than 24 hours, and immediately fresh-frozen on dry ice.
Isolation and fluorescence-activated nuclear sorting (FANS) with hashing.
All buffers were supplemented with RNAse inhibitors (Takara). 25mg of frozen postmortem human brain tissue was homogenized in cold lysis buffer (0.32M Sucrose, 5 mM CaCl2, 3 mM Magnesium acetate, 0.1 mM EDTA, 10mM Tris-HCl, pH8, 1 mM DTT, 0.1% Triton X-100) and filtered through a 40 μm cell strainer. The flow-through was underlaid with sucrose solution (1.8 M Sucrose, 3 mM Magnesium acetate, 1 mM DTT, 10 mM Tris-HCl, pH8) and centrifuged at 107,000 g for 1 hour at 4 °C. Pellets were re-suspended in PBS supplemented with 0.5% bovine serum albumin (BSA).
Four samples were processed in parallel. 2 million nuclei from each sample were pelleted at 500 g for 5 minutes at 4 °C. Following centrifugation, nuclei were re-suspended in 100 μl staining buffer (2% BSA, 0.02% Tween-20 in PBS) and incubated with 1 μg of a unique TotalSeq-A nuclear hashing antibody (Biolegend) for 30 min at 4 °C. Prior to FANS, volumes were brought up to 250 μl with PBS and DAPI (Thermoscientific) added to a final concentration of 1 μg/ml. DAPI positive nuclei were sorted into tubes pre-coated with 5% BSA using a FACSAria flow cytometer (BD Biosciences).
snRNAseq and library preparation.
Following FANS, nuclei were subjected to 2 washes in 200 μl staining buffer, after which they were re-suspended in 15 μl PBS and quantified (Countess II, Life Technologies). Concentrations were normalized and equal amounts of differentially hash-tagged nuclei were pooled. A total of 40,000 (10,000 each) pooled nuclei were processed using 10x Genomics single cell 3’ v3 reagents. At the cDNA amplification step (step 2.2), 1 μl of 2 μm HTO cDNA PCR “additive” primer was added41. After cDNA amplification, supernatant from 0.6x SPRI selection was retained for HTO library generation. cDNA library was prepared according to 10x Genomics protocol. HTO libraries were prepared as previously described41. cDNA and HTO libraries were sequenced at NYGC using the Novaseq platform (Illumina).
Bioinformatic analyses
Detailed scripts and related R objects can be found here: https://drive.google.com/open?id=12260_PQkmEplL1hNBFbQX9eEpzC4pySy&authuser=nk1845%40nyu.edu&usp=drive_fs
Mapping and integration of larval (L3) and pupal (P15) datasets
We mapped the sequenced libraries to the D. melanogaster genome assembly BDGP6.88 using CellRanger 3.0.1. We kept only genes that were expressed in at least 3 cells across all cells and cells with counts with at least 200 genes for further analysis. After processing, the dataset comprised 49,893 cells passing quality filters, with a median of 3,635 UMIs and 1,343 genes per cell.
We used the procedure implemented in Seurat v.3 to remove batch effects from our sequenced libraries. We used default parameters except for the dimensionality for which we tried the values 100, 150 and 200. We compared the results using the Seurat function LocalStruct with default parameters. The results obtained were 83.7%, 84.9% and 83.6%, respectively. We therefore chose a dimensionality of 150 for the larval dataset.
The dataset was then clustered with a resolution of 2. Notably, in this developing structure, cells are clustered both by identity and by differentiation stage. For example, Mi1 cells fall into 2 clusters, an immature (cluster 23) and a mature cluster (cluster 53).
Larval and pupal datasets were merged using default parameters.150 PCs were used subsequently for generating the UMAP to remain consistent with the integration of the different larval libraries.
Spatial patterning analysis
To focus on the heterogeneity within the neuroepithelial cells, the larval dataset was further subsetted using marker expression with Seurat v3. Expression of neuroepithelial markers shg, tom, and brd were examined for each cluster42. Clusters with average expression higher than 95th percentile of normalized expression of tom and brd were selected as neuroepithelial clusters. DE-Cadherin (Shg) is known to be enriched in neuroepithelial cells43 and is enriched in the selected clusters (logFC = 0.75, adjusted p value = 0).
Principal components were calculated using variable features found in the subsetted neuroepithelial cells. Examination of PC1 revealed that tll, an early marker of lamina precursor cells44, is expressed in a near-mutually exclusive fashion with hth (enriched in neuroepithelium and young medulla neuroblasts), suggesting the subset contained both OPC neuroepithelium and lamina precursor cells. To keep only OPC neuroepithelial cells, we sub-clustered the cells and examined the average expression of hth and tll for each cluster. This process is performed iteratively to keep only hth+/tll− clusters. The remaining cells were assigned as OPC neuroepithelium for further analysis of spatial temporal factors.
Trajectory analysis: identification of candidate tTFs
To study temporal patterning in neuroblasts, we first identified the cluster that corresponded to the medulla neuroblasts (cluster 9) based on the expression of Dpn and Ase, as well as the expression of the known temporal factors. We extracted the counts from these cells and inputted them into Monocle. We used default parameters to order the cells in pseudotime. We used the DDRTree method for dimensionality reduction. The cells were then ordered in pseudotime and the beginning and end of the trajectory were defined based on the expression of the known tTFs (i.e. Hth marked the beginning of the trajectory and Tll marked the end). We then looked at the expression along the pseudotime of 629 genes annotated as transcription factors in FlyBase to identify the candidate tTFs. identified 39 candidate that exhibited temporally restricted expression. These fell into two distinct categories: 14 of them were expressed at relatively high levels and included the 6 known tTFs (Extended Data Figure 3a), while 25 of them were expressed at lower levels along the trajectory (Extended Data Figure 3b). We tested the expression pattern of 4 of the 25 lowly expressed candidates, apterous (ap), cut, gcm, and gemini (gem) in the developing optic lobes. Ap is expressed in neurons22, gem was not expressed in the optic lobe, gcm is expressed in glial cells coming from the Tll temporal window45, and cut was not expressed in a temporal manner (Extended Data Figure 3c-d). We therefore decided not to pursue these candidates further as their fluctuations likely represent noise.
Merging of larval and pupal Mi1 and DE analysis over pseudotime
Larval and pupal (P15, P30, P40, P50, and P70) datasets were merged after cells were batch effect corrected for each stage separately. The standard Monocle workflow was followed to generate trajectories. The L3 and P15 trajectories were ordered manually.
Based on the way the optic lobe develops, there are cells at the same differentiation stage in the L3 and P15 datasets. We therefore decided to align these two datasets in order to get a continuum of expression. We tested different genes and ended up using “Ggamma30A” as a reference gene. Ggamma30A starts increasing in the middle of the L3 trajectory and continues all the way to P15 in a linear manner. We adjusted the expression of Ggamma30A in P15 using linear regression, which was then applied to all genes of P15. This does not change the dynamics of expression, just the relative levels, and serves the purpose of aligning the trajectories over pseudotime of L3 and P15.
To identity differentially expressed genes along the differentiation trajectory from L3 to P70, we used two methods: “principal graph” and “knn”. We selected genes that were identified as differentially expressed with at least one of the two methods. We then used the find_gene_modules function to group the differentially expressed genes into modules of genes that co-vary. These genes were then used for GO analysis.
GO enrichment analysis
We performed GO enrichment analysis and calculated enrichment for ‘Biological Process’ using The Gene Ontology Resource (http://geneontology.org/) using a Fisher's exact test to calculate p-value. Multiple testing correction was performed by calculating the False Discovery Rate.
To find the expression of GO terms over time, we added and normalized the expression of all genes that belong to a specific GO term and plotted it over pseudotime or on the UMAP.
Analysis of human data
We mapped the sequenced libraries to the H. sapiens genome assembly GRCh38 (hg38) using CellRanger 3.1.0. For the hashtag oligos (HTO), we used the CITE-seq-Count 1.4.2 version to align HTO to 10x barcodes using the following command:
CITE-seq-Count -R1 reas1 -R2 read2 -T 1 -t tag -cbf 1 -cbl 16 -umif 17 -umil 26 -cells 40000 -o output --sliding-window # --dense
After processing, the dataset comprised 3,363 cells passing quality filters, with a median of 4,736 UMIs and 2,414 genes per cell.
We selected the radial glia (expressing Pax6), intermediate progenitors (expressing Eomes), and neurons (expressing NeuroD2) that were forming a trajectory in UMAP and imported the data into Monocle and used default parameters to calculate the trajectories. We used the find_gene_modules function to group genes into 6 modules of genes that co-vary. These modules were then used for GO analysis.
Analysis of mouse cortical data
The dataset that was generated by Telley et al.34 was downloaded from GEO (GSE118953). The raw counts were inputted into Seurat and the standard workflow was followed (log-normalization, followed by clustering and UMAP using 25 PCs, and clustering was done with a resolution of 2). The radial glia clusters (clusters 2 and 3) were identified based on the expression of known radial glia markers, such as SOX2 and PAX6. Radial glia from different embryonic days 12, 13, 14, and 15 were used to generate the violin plots of Extended Data Figure 10a.
Analysis of mouse retina data
We downloaded the dataset that was generated by Clark et al.35. We inputted the raw counts into Seurat and the standard workflow was followed (log-normalization, followed by clustering and UMAP using 50 PCs, and clustering was done with a resolution of 0.5). We used the annotation provided by the authors35 to select early and late retinal progenitor cells (RPCs). RPCs from embryonic days 11, 12, 14, 16, and 18 and postnatal day 0 were used to generate the violin plots of Extended Data Figure 10c-d.
Extended Data
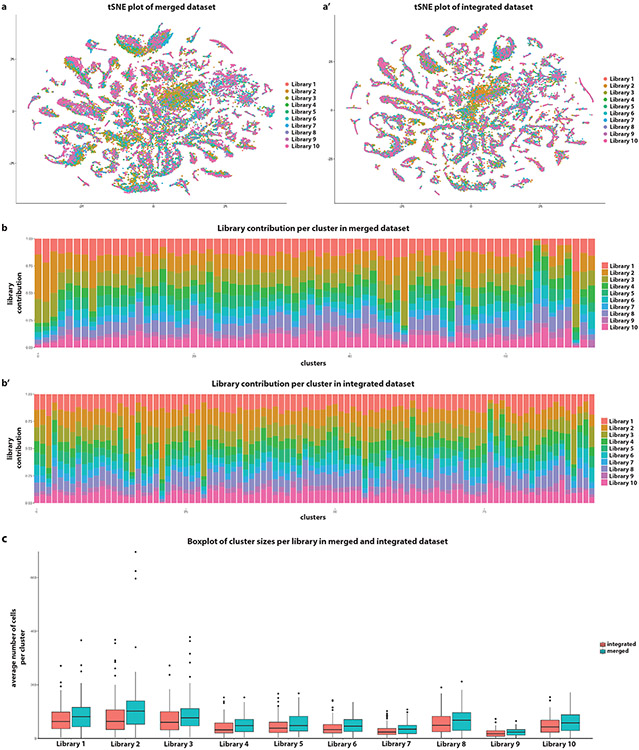
Extended Data figure 1: Integration of libraries.
(a-a’) Comparison of library distribution on a tSNE plot of datasets before (merged) and after library integration (batch effect correction). Before integration, there is a clear bias in the distribution of the libraries within clusters. After integration, this bias is largely eliminated.
(b-b’) Comparison of the library contribution in each cluster before (merged) and after library integration (batch effect correction). With the exception of few clusters in each case, all clusters have a similar percentage of cells coming from each library.
(c) Comparison of cluster sizes per library before (merged - n = 71 clusters) and after library integration (batch effect correction - n = 93 clusters). The variance in the merged dataset is larger than the one in the integrated one, indicating noise that was potentially alleviated by the batch correction. Boxplots display the first, second and third quartiles. Whiskers extend from the box to the highest or lowest values in the 1.5 inter-quartile range, and outlying datapoints are represented by a dot.
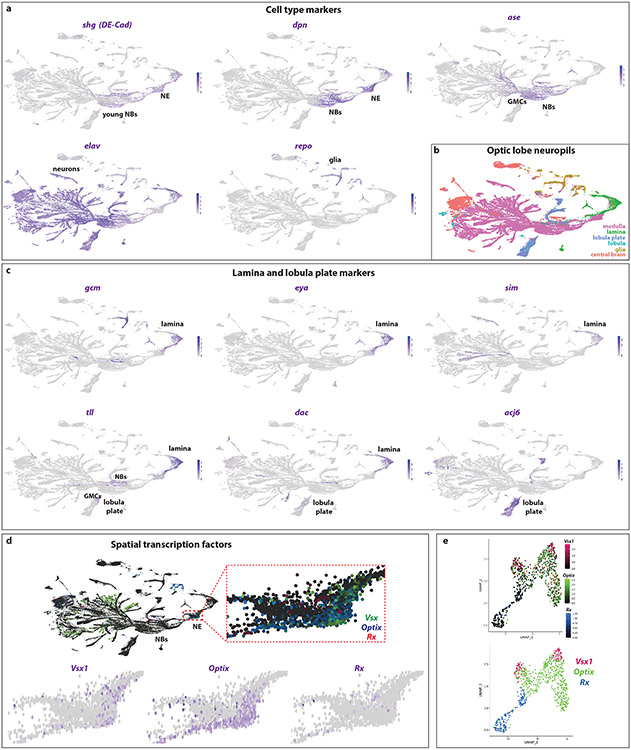
Extended Data figure 2: Annotation of the developing optic lobe UMAP plot.
(a) UMAP plots showing the expression of different cell type markers that allows for the annotation of the different clusters. Shotgun/DE-Cad (shg) is expressed in the neuroepithelium (NE) and young neuroblasts (NBs). Deadpan (dpn) is expressed in neuroepithelium and neuroblasts. Asense (ase) is expressed in the neuroblasts and GMCs. Elav is mostly expressed in the neurons, although the transcript can already be seen in the GMCs. Finally, repo is expressed in glial cells.
(b) UMAP plot of single-cells coming from larval (L3) and pupal (P15) developing optic lobes. Using cell type annotation, we identify cell types that belong to the four optic lobe neuropils (lamina, medulla, lobula, and lobula plate), as well as central brain cells that were not removed during the dissections, and glial cells.
(c) Expression of markers for the lamina and the lobula plate. Lamina is marked by the expression of gcm, eya, sim, tll, and dac, while lobula plate expresses strongly acj6, faintly dac, and the progenitors (neuroblasts and GMCs) express tll.
(d) (Top) UMAP: Spatial transcription factors (Vsx, Optix, and Rx) are not expressed in medulla neuroblasts (NBs), while only Vsx is expressed in some neuronal types (it is unknown whether this expression reflects their origin from the Vsx spatial domain). (Inset) sTFs are only expressed in the neuroepithelium (NE) in largely non-overlapping domains. (Bottom). UMAP plots with the expression of individual sTFs in the neuroepithelium.
(e) UMAP plot of the neuroepithelial cells. Top: Expression of the spatial transcription factors (Vsx1, Optix, and Rx) can be seen in largely non-overlapping clusters. Bottom: Semi-supervised clustering of the neuroepithelial cells and identification of the three spatial clusters (Vsx, Optix, and Rx).
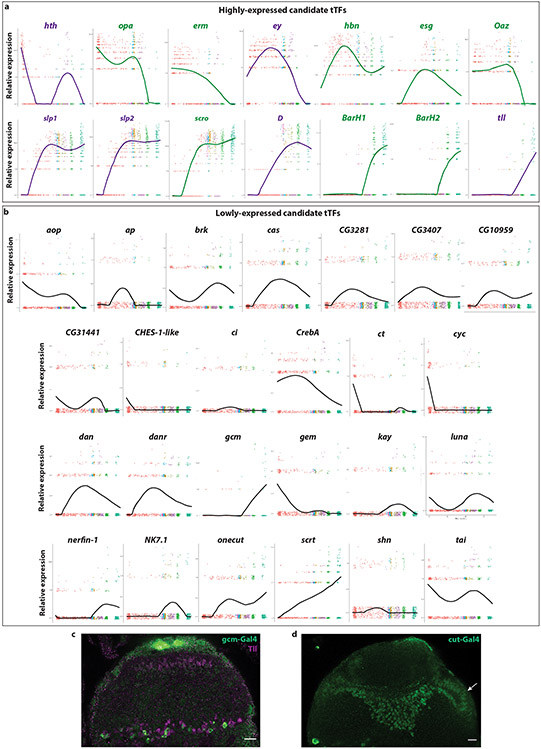
Extended Data figure 3: Candidate tTF expression in neuroblast trajectory.
Expression pattern over pseudotime of all TFs that were found to be expressed in a temporal manner along the medulla neuroblast trajectory.
(a) 14 transcription factors were found to be expressed temporally in high relative expression levels. These include the already known tTFs (hth, ey, slp1, slp2, D, and tll in purple), as well as eight new candidate tTFs (in green).
(b) Another 25 transcription factors were found to be expressed temporally in lower relative expression levels. Ap, ct, gcm, and gem expression were tested in developing optic lobes and they were not expressed temporally. Hence, these 25 transcription factors were excluded from downstream analysis.
(c) Gcm-Gal4 (green) is expressed in glial cells coming from the Tll temporal window (magenta)45. Scale bar: 10 μm.
(d) Cut-Gal4 (green) is expressed in neuroblasts of all ages found in the surface of the optic lobe (arrow). Scale bar: 10 μm.
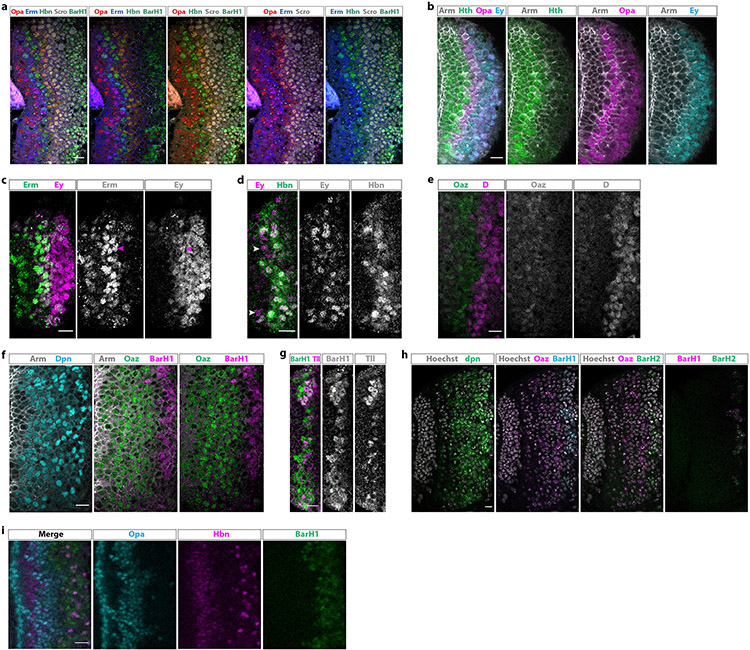
Extended Data figure 4: Newly identified tTFs are expressed temporally.
(a) Antibody staining (frontal view) against five of the eight new temporal transcription factors, Opa (red), Erm (blue), Hbn (green), Scro (white), and BarH1 (green), shown in different combinations.
(b) Antibody staining against Opa, Hth, Ey, and Arm (which marks all cells). Opa is expressed in two waves, one succeeding and partially overlapping with the Hth window and one later partially overlapping with Ey. The expression of Opa covers the previous “gap” between Hth- and Ey-expressing neuroblasts.
(c) Antibody staining against Erm and Ey. Erm starts being expressed before Ey, partially overlapping with it (magenta arrowheads).
(d) Antibody staining against Hbn and Ey. Hbn expression begins slightly after Ey and overlaps almost completely with it. Ey-positive, Hbn-negative neuroblasts are indicated with arrowheads.
(e) Antibody staining against Oaz and D. Oaz expression precedes the expression of D.
(f) Antibody staining against Dpn, Oaz, BarH1, and Arm (which marks all cells). BarH1 is expressed after Oaz.
(g) Antibody staining against BarH1 and Tll. BarH1 is expressed before and overlaps with Tll.
(h) Fluorescent in situ hybridization against dpn, Oaz, BarH1 and BarH2. BarH2 is expressed in the same neuroblasts as BarH1, after Oaz has stopped being expressed. Hoechst marks all cells.
(i) Hbn is expressed between the two Opa temporal windows in neurons, while BarH1 is expressed after the second Opa temporal window. Hbn is also expressed in later born neurons, after the second Opa wave, and is lost from the first lamina (in between Opa) as neurons mature.
Scale bars: 10 μm
Extended Data figure 5: Negative genetic interactions between tTFs.
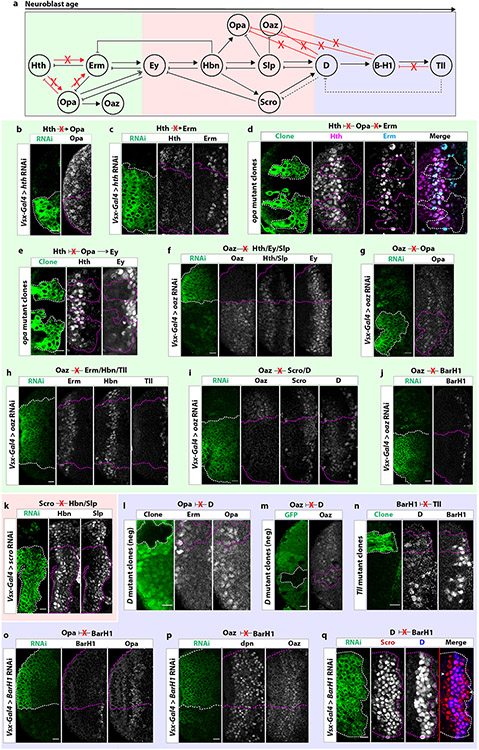
(a) Diagram of genetic interactions between tTFs in medulla neuroblasts. Red “X”‘s within the diagram indicate no genetic interaction. Within the early unit (green box), we identified three new tTFs: Opa, Erm and Oaz. Hth does not activate Erm or Opa. Furthermore, Opa does not repress Hth or activate Erm. Within the middle unit (red box), we identified three new temporal factors: Homeobrain (Hbn), Scarecrow (Scro) and Opa. Opa is not inhibited by D or BarH1. Oaz is also not inhibited by D or BarH1. Within the late unit (blue box) we identified one new temporal factor: BarH1. Tailless (Tll) is not necessary to inhibit BarH1.
(b) In cells expressing hth RNAi driven by Vsx-Gal4 (GFP: green), Opa expression is not affected, indicating that Hth does not activate Opa.
(c) Erm is unaffected in cells expressing hth RNAi driven by Vsx-Gal4 (GFP: green). Hence, Hth does not activate Erm.
(d) In opa mutant clones (GFP: green), Hth and Erm expression are unaffected, indicating that Opa does not inhibit Hth and does not activate Erm.
(e) In opa mutant clones (GFP: green), Ey expression is delayed, indicating that Opa helps to time the expression of Ey.
(f-j) In cells expressing Oaz RNAi driven by Vsx-Gal4 (GFP: green), (f) Hth, Ey, Slp, (g) Opa, (h) Erm, Hbn, Tll, (i) Scro, D, and (j) BarH1 are unaffected, indicating that Oaz does not regulate their expression.
(k) Scro knock-down upon expression of scro RNAi (GFP: green) does not affect the expression of Hbn or Slp, as was expected given that Scro is coexpressed with both (see Figure 2).
(l) In negatively marked D mutant clones, the expression of Opa is unaffected, indicating that D does not inhibit Opa.
(m) Similarly, in negatively marked D mutant clones, the expression of Oaz is unaffected, indicating that D does not inhibit of Oaz.
(n) In Tll mutant clones (GFP: green), neither D nor BarH1 expression are affected, indicating that Tll is not necessary to inhibit either factor.
(o-q) In cells expressing RNAi against BarH1, (o) Opa, (p) Oaz, and (q) D are unaffected, indicating that BarH1 does not regulate their expression.
Scale bars: 10 μm
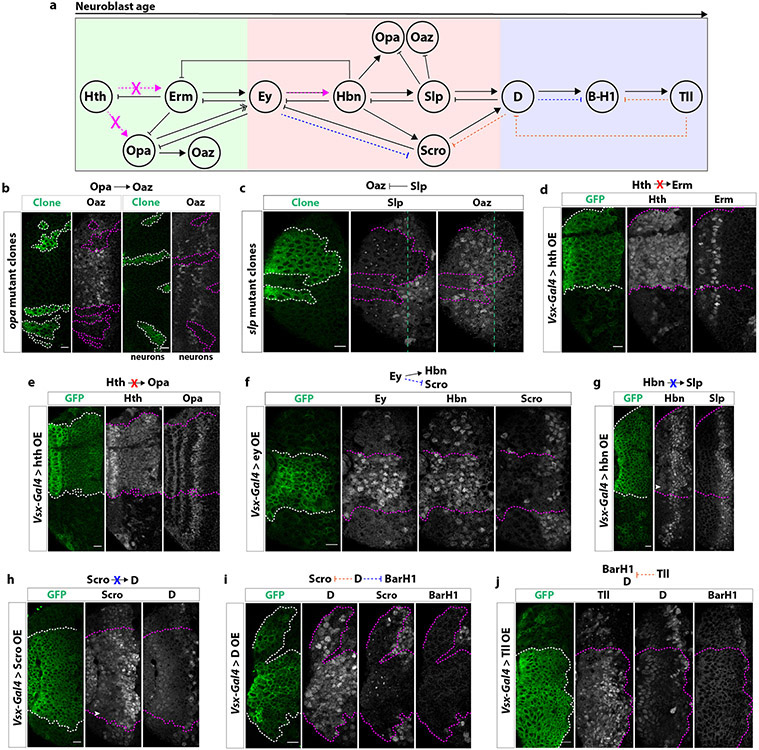
Extended Data figure 6: Additional genetic interactions between tTFs.
(a) Diagram of genetic interactions between tTFs in medulla neuroblasts. Magenta dashed arrows within the diagram indicate genetic interactions determined with misexpression of tTFs that confirm previous results from MARCM and knock-down experiments. Orange dashed arrows indicate genetic interactions uncovered with misexpression experiments. Blue dashed arrows indicate genetic interactions determined with misexpression experiments that are opposite to previous MARCM or knock-down experiments.
(b) Left: In opa mutant clones (GFP: green), Oaz is not expressed, suggesting that Opa is necessary for the activation of Oaz. Right: Accordingly, oaz neurons are lost in opa mutant clones.
(c) Slp inhibits the expression of Oaz. In slp mutant clones (GFP: green), Oaz remains expressed in older neuroblasts.
(d) In cells misexpressing Hth driven by Vsx-Gal4 (GFP: green), Erm expression is not affected, indicating that Hth does not activate Erm.
(e) In cells misexpressing Hth driven by Vsx-Gal4 (GFP: green), Opa expression is not affected, indicating that Hth does not activate Opa.
(f) In cells misexpressing Ey driven by Vsx-Gal4 (GFP: green), Hbn expression is activated and Scro expression repressed.
(g) In cells misexpressing Hbn driven by Vsx-Gal4 (GFP: green), Slp expression is not activated earlier. White arrowhead indicates low levels of Hbn protein being misexpressed early compared to adjacent wildtype tissue.
(h) In cells misexpressing Scro driven by Vsx-Gal4 (GFP: green), D expression is not activated earlier. White arrowhead indicates low levels of Scro protein being misexpressed early compared to adjacent wildtype tissue.
(i) In cells misexpressing D driven by Vsx-Gal4 (GFP: green), both Scro and BarH1 expression are repressed.
(j) In cells misexpressing Tll driven by Vsx-Gal4 (GFP: green), both D and BarH1 expression are repressed.
Scale bars: 10 μm
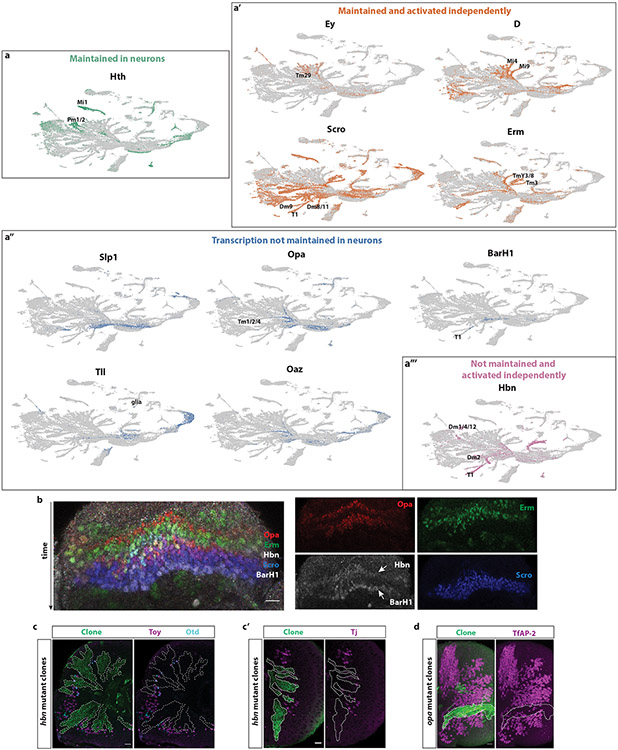
Extended Data figure 7: Temporal transcriptions factors are inherited in neurons and regulate neuronal diversity.
(a) UMAP plots showing the expression of all temporal transcription factors in the developing Drosophila optic lobe. (a) Hth maintains its expression in some of their neuronal progeny, such as Mi1, Pm1, and Pm2. (a’) On the other hand, ey, D, erm and Scro not only maintain their expression in some neuronal progeny, but they are also activated independently in neuronal types that come from different temporal windows. Hence, most of them are expressed in both early- and late-born neuronal types (see also Supplementary Table 1). (a’’) Slp1, opa, BarH1, Oaz, and tll do not maintain their transcription in neurons. However, using their expression in GMCs at the root of neuronal branches, we can predict neuronal types that come from these temporal windows (such Tm1, Tm2, and Tm4 for Opa). (a’’’) Finally, hbn is not maintained in neuronal progeny of the Hbn+ neuroblasts, but it is activated independently in later-born neurons (such as T1). Neuronal types that come from the relevant temporal windows are indicated.
(b) Expression of temporal transcription factors in neuronal progeny shows that the tTFs are expressed in the newly born progeny of their respective neuroblast temporal window. Time is depicted by the arrow; neurons born from young neuroblasts are on the top of the Figure. Opa-positive neurons are born from young neuroblasts (red), followed by Erm neurons (green). Then, neurons expressing Hbn and Opa can be detected. (red-white). Finally, Scro-positive (blue) and Scro and BarH1-positive neurons (blue-white) are born from older neuroblasts. Single-channel images can be seen in the right panels.
(c) Hbn is involved in the generation of neuronal diversity by regulating the expression of downstream transcription factors. In Hbn-mutant MARCM clones (green) neurons expressing Toy, Otd (c) and Tj (c’) are not found.
(d) Opa is also involved in the generation of neuronal diversity by regulating the expression of the downstream transcription factor TfAP-2 in some neurons. Opa-mutant MARCM clones (green) have fewer TfAP-2 positive cells (magenta) compared to the adjacent wild-type tissue.
Scale bars: 10 μm
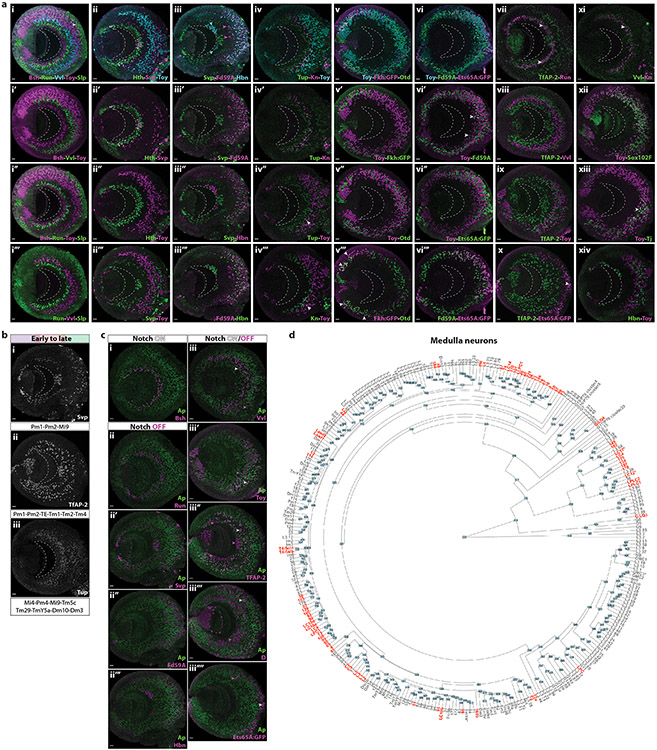
Extended Data figure 8: Temporal expression of concentric genes in medulla neurons.
(a) Temporal expression of concentric genes in the medulla cortex.
(i-i’’’) Expression (from early to late born) of Bsh, Run, Vvl, Toy and Slp in medulla neurons at L3 stage. Bsh neurons are closer to the medulla neuropil (indicated with dashed line), while Slp neurons (arrowhead) are closer to the surface of the brain (NB layer). Anterior is shown to the right and posterior to the left throughout the Figure.
(ii-ii’’’) Expression of Hth, Svp and Toy in medulla neurons at L3 stage. Hth is expressed in the first-born neurons, located closer to the medulla neuropil. Svp is expressed in several laminae along the medulla cortex. Toy is expressed in mid-late born neurons.
(iii-iii’’’) Expression of Svp, Forkhead domain 59A (Fd59A) and Hbn in medulla neurons at L3 stage. Svp is expressed in several laminae along the medulla cortex. Fd59A is expressed in mid-late born neurons, some of them (magenta arrowheads) generated before Hbn neurons. Cyan arrowheads denote Lawf1-2 neurons, which have a different origin38.
(iv-iv’’’) Expression of Tup, Knot (Kn), and Toy in medulla neurons at L3 stage. Tup is expressed in several laminae of early and late born neurons along the medulla cortex, some of them being born before Kn neurons (iv’). Tup+Toy neurons are the first-born Toy neurons in the ventral side of the medulla (iv’’, arrowhead). Kn neurons are generated before Kn+Toy neurons (iv’’’, arrowhead).
(v-v’’’) Expression of Toy, Fkh:GFP and Otd in medulla neurons at L3 stage. Some Toy neurons are generated before Fkh and Otd neurons (E’-E’’). Fkh+Otd neurons (arrowhead) are only found in the posterior tips of the main OPC (E’’’), mainly in the Dpp region, as previously described40.
(vi-vi’’’) Expression of Toy, Fd59A and Ets65A:GFP in medulla neurons at L3 stage. Toy and Fd59A expressing neurons are intermingled in the medulla cortex, being coexpressed in specific subregions of the medulla cortex (vi’, arrowheads). Many Toy and Fd59A neurons are generated before Ets65A-expressing neurons (vi’’-vi’’’).
(vii) Expression of TfAP-2 and Run in medulla neurons at L3 stage. The first laminae of TfAP-2+Ap+ neurons (NotchON) are intermingled with Run neurons (NotchOFF) (arrowheads), suggesting that they could be sister neurons.
(viii) Expression of TfAP-2 and Vvl in medulla neurons at L3 stage. The first laminae of TfAP-2 neurons are generated before Vvl neurons. The second laminae of TfAP-2 neurons are generated after some Vvl neurons.
(ix) Expression of TfAP-2 and Toy in medulla neurons at L3 stage. The first laminae of TfAP-2 neurons are generated before Toy neurons. The second laminae of TfAP-2 neurons are intermingled with some Toy neurons.
(x) Expression of TfAP-2 and Ets65A:GFP in medulla neurons at L3 stage. All TfAP-2 neurons are born before Ets65A-expressing neurons, except in the cases where both TFs are coexpressed (arrowhead). These neurons are very late born and are the only NotchON medulla neurons that are glutamatergic.
(xi) Expression of Vvl and Kn in medulla neurons at L3 stage. Vvl+Ap+ (NotchON) and Kn neurons (NotchOFF) start to be generated at similar times, suggesting that they could be sister neurons.
(xii) Expression of Toy and Sox102F in medulla neurons at L3 stage. Toy and Sox102F neurons are mid-late born neurons intermingled in the medulla cortex. Toy and Sox102F are expressed individually or coexpressed in medulla neurons.
(xiii) Expression of Toy and Tj in medulla neurons at L3 stage. Toy and Tj neurons are expressed in mid-late born neurons intermingled in the medulla cortex. They are coexpressed in specific subregions of the medulla cortex (arrowhead).
(xiv) Expression of Toy and Hbn in medulla neurons at L3 stage. Hbn neurons are generated after some Toy neurons.
Scale bars: 10 μm
(b) Concentric genes expressed both early and late in medulla neurons.
(i) TFs Seven-Up (Svp), (ii) TfAP-2 and (iii) Tailup (Tup) are expressed in several laminae along the medulla cortex and are expressed in neurons generated in several temporal windows.
(c) Notch status of medulla neurons and concentric gene expression.
(i) Expression of Bsh and Ap in medulla neurons. All Bsh neurons express Ap. Anterior is to the right and posterior to the left in this and subsequent panels.
(ii) Expression of Run and Ap in medulla neurons at L3 stage. None of the Run positive neurons express Ap.
(ii’) Expression of Ap and Svp in medulla neurons at L3 stage. None of the Svp positive neurons express Ap.
(ii’’) Expression of Ap and Fd59A in medulla neurons at L3 stage. None of the Fd59A positive neurons express Ap.
(ii’’’) Expression of Ap and Hbn in medulla neurons at L3 stage. None of the Hbn positive neurons express Ap.
(iii) Expression of Ap and Vvl in medulla neurons at L3 stage. Vvl neurons that are earlier born, such as Tm9, express Ap (white arrowhead), while later born Vvl neurons, such as Dm8 and Dm11, do not (magenta arrowhead).
(iii’) Expression of Ap and Toy in medulla neurons at L3 stage. Earlier born Toy neurons, such as Dm10, do not express Ap (magenta arrowhead), while later born Toy neurons, such as Tm20, express Ap (white arrowhead).
(iii’’) Expression of Ap and TfAP-2 in medulla neurons at L3 stage. First born TfAP-2 neurons, such as Pm1, Pm2 and Pm3, do not express Ap (magenta arrowheads), while later born TfAP-2-expressing neurons, such as Tm1, express Ap (white arrowhead).
(iii’’’) Expression of Ap and D in medulla neurons at L3 stage. Earlier born D neurons do not express Ap (magenta arrowhead) and express D in the absence of this tTF in their NBs of origin, while later born D neurons express Ap (white arrowhead) and are generated in the D temporal window.
(iii’’’’) Expression of Ap and Ets65A:GFP in medulla neurons at L3 stage. Earlier born Ets65A neurons do not express Ap (magenta arrowhead), while later born Ets65A neurons express Ap (white arrowhead).
Scale bars: 10 μm
(d) Medulla clusters. Hierarchical tree relating the average variable gene expression from each cluster of the L3-P15 dataset. Low quality (LQ) clusters or clusters that have a different origin from the medulla side of the OPC neuroepithelium, such as PRs, L neurons, Lawf1-2, LCNs and LPLCs neurons are shown in red.
Extended Data figure 9: Neuronal differentiation in flies and humans.
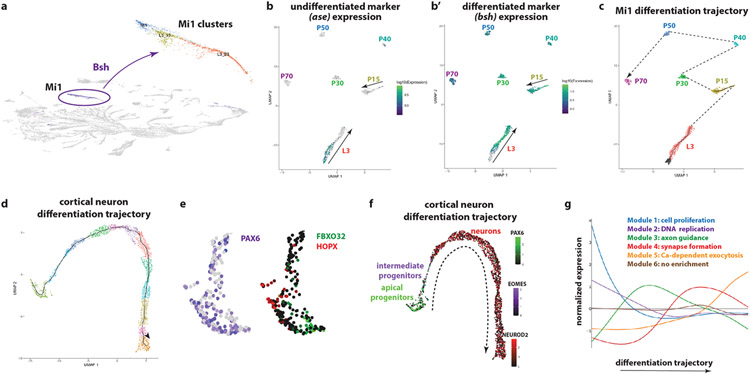
(a) Bsh is expressed almost exclusively in Mi1s and was used to identify the Mi1 clusters. Cluster Mi1 represents the pupal annotated cluster. Cluster L3_23 consists of GMCs that give rise to Mi1s and newly born Mi1s, while cluster L3_53 corresponds to more mature Mi1 cells, as assessed by their proximity to the P15 Mi1 cells.
(b) UMAP plot of Mi1 cells at different stages of differentiation from L3 to P70. The expression of ase (b) and bsh (b’) were used to find the beginning and end, respectively, of the L3 trajectory.
(c) UMAP plot of Mi1 cells at different stages of differentiation from L3 to P70. L3 and P15 trajectories are elongated, depicting Mi1 cells of different ages. Transcriptomes are then synchronized (compact group of clusters) around P30.
(d) UMAP plot showing the trajectory of 3,363 single cell transcriptomes of the developing human cortex (gestational week 19), as generated by Monocle3. The orientation of the trajectory was identified by looking at the expression of marker genes for progenitors, intermediate progenitors and neurons (see panel f). Colors indicate different clusters along the trajectory.
(e) UMAP plot focusing on the PAX6-positive single-cell transcriptomes of the developing human cortex (gestational week 19). The radial glia population contains both ventricular radial glia (FBXO32-positive cells) and outer radial glia (HOPX-positive cells).
(f) UMAP plot of 3,363 single-cell transcriptomes of the developing human cortex (gestational week 19). The trajectory from progenitors to neurons can be observed by the expression of Pax6 (apical progenitors), Eomes (intermediate progenitors), and NeuroD2 (neurons). The dashed arrow depicts the differentiation trajectory.
(g) Differential expression analysis along the trajectory of the cortical neurons identified six modules of genes. Gene Ontology enrichment analysis found the first two modules to be enriched in terms such as cell proliferation (FDR=10−3) and DNA replication (FDR=10−44); they likely correspond to the progenitor cells. Then, the third module is enriched in neurite development terms, such as axon guidance (FDR=10−7), while the fourth one is enriched in terms related with synapse organization (FDR=10−11). The fifth one contains “functional genes”, such as calcium-dependent exocytosis (FDR=10−2). The sixth module does not show a clear peak of expression and no GO terms were found to be enriched.
Extended Data Figure 10: Expression of Drosophila tTFs in mouse neural progenitors.
(a) The mouse orthologs of the Drosophila optic lobe temporal transcription factors are not expressed in specific temporal windows in mouse cortical radial glia during embryonic stages E12-E15, which span their neurogenic period, except for Pax6, which is enriched in young progenitors (two-sided Wilcoxon rank sum test, adjusted p-value = 1.969240e-08).
(b) Heatmap of expression of Igf2bp1 and Bach2 (orthologs of Drosophila Imp and chinmo, respectively) in radial glia and neuronal progeny. Igf2bp1 is expressed in young apical progenitors, while Bach2 is expressed in young apical progenitors and neurons that are born by these young progenitors. Source: http://genebrowser.unige.ch/telagirdon/
(c) Violin plots showing the expression of the known temporal factors of the mouse retinal progenitor cells, Ikzf1, Pou2f2 and Casz1, orthologs of the Drosophila VNC temporal transcription factors, hb, pdm and cas, respectively. Pou2f2 is expressed in younger progenitors and Casz1 in older progenitors. We do not see expression of Ikzf1 at these stages, as has been reported before46.
(d) Violin plots showing the expression of the orthologs of the Drosophila optic lobe tTFs in the mouse retinal progenitor cells. The expression of the orthologs of hth (Meis2), opa (Zic5), and D (Sox12) seem to be restricted to embryonic stage 12, while the ortholog of ey (Pax6) is expressed constitutively, as expected. Interestingly, Nr2e1 is expressed just before birth, which is when the retinal progenitor cells start generating Müller glia ortholog; similarly, its ortholog tll also starts to be expressed when the Drosophila medulla neuroblasts become gliogenic.
Supplementary Material
Acknowledgements
We are indebted to the fly community; Cheng-Yu Lee, Deborah Hursh, John Nambu, Andrew Tomlinson, and Mitshuhiko Kurusu for fly lines, Peter Gergen, Kwangwook Choi, Hermann Aberle, Dorothea Godt, James Skeath, Richard Mann, and Tiffany Cook for antibodies. We thank members of the Desplan lab, and Stein Aerts for constructive feedback on the manuscript, as well as Rosa Mirayes, Tzumin Lee, and three anonymous reviewers for a fruitful reviewing process. Finally, we thank Sergio Córdoba for the optic lobe illustrations and Kazi Hossain and Albert Tadros for help with preliminary experiments. This work was supported by NIH grant EY019716 and EY10312 to C.D. N.K. was supported by the National Eye Institute (K99 EY029356-01). I.H. was supported by an HFSP postdoctoral fellowship (LT000757/2017-L) and by the Kimmel Center for Stem Cell Biology Senior Postdoctoral Fellowship. A.M.R was supported by funding from NIH (T32 HD007520), and by NYU’s Dean’s Dissertation Fellowship. A.M.J. was supported by the NYU SURP program. M.N.O is a Leon Levy Neuroscience Fellow.
Footnotes
Declaration of Interests
Authors declare no conflicts of interest.
Code availability
All related code that was used in this manuscript can be found on Github: https://github.com/NikosKonst/larva_scSeq2022
Data Availability
All Drosophila raw and processed data referenced were uploaded to GEO: accession number GSE167266.
The human source data described in this manuscript are available via the PsychENCODE Knowledge Portal (https://psychencode.synapse.org/). The PsychENCODE Knowledge Portal is a platform for accessing data, analyses, and tools generated through grants funded by the National Institute of Mental Health (NIMH) PsychENCODE program. Data is available for general research use according to the following requirements for data access and data attribution: (https://psychencode.synapse.org/DataAccess). For access to content described in this manuscript see: www.doi.org/10.7303/syn24975927
The publicly available single-cell sequencing datasets that were used can be found in GEO: accession numbers GSE142787 (Drosophila pupal development), GSE118953 (mouse cortical radial glia), and GSE118614 (mouse retinal progenitors).
References
- 1.Pearson BJ & Doe CQ Specification of temporal identity in the developing nervous system. Annual review of cell and developmental biology 20, 619–647 (2004). [DOI] [PubMed] [Google Scholar]
- 2.Sato M, Yasugi T & Trush O Temporal patterning of neurogenesis and neural wiring in the fly visual system. Neuroscience Research 138, 49–58 (2019). [DOI] [PubMed] [Google Scholar]
- 3.Doe CQ Temporal Patterning in the Drosophila CNS. Annual review of cell and developmental biology 33, 219–240 (2017). [DOI] [PubMed] [Google Scholar]
- 4.Azevedo FAC et al. Equal numbers of neuronal and nonneuronal cells make the human brain an isometrically scaled-up primate brain. The Journal of comparative neurology 513, 532–41 (2009). [DOI] [PubMed] [Google Scholar]
- 5.Rossi AM, Fernandes VM & Desplan C Timing temporal transitions during brain development. Curr Opin Neurobiol 42, 84–92 (2017). [DOI] [PMC free article] [PubMed] [Google Scholar]
- 6.Holguera I & Desplan C Neuronal specification in space and time. Science (New York, N.Y.) 362, 176–180 (2018). [DOI] [PMC free article] [PubMed] [Google Scholar]
- 7.Oberst P, Agirman G & Jabaudon D Principles of progenitor temporal patterning in the developing invertebrate and vertebrate nervous system. Current Opinion in Neurobiology 56, 185–193 (2019). [DOI] [PubMed] [Google Scholar]
- 8.Brody T & Odenwald WF Programmed transformations in neuroblast gene expression during Drosophila CNS lineage development. Dev Biol 226, 34–44 (2000). [DOI] [PubMed] [Google Scholar]
- 9.Pearson BJ & Doe CQ Regulation of neuroblast competence in Drosophila. 425, 624–628 (2003). [DOI] [PubMed] [Google Scholar]
- 10.Isshiki T, Pearson B, Holbrook S & Doe CQ Drosophila neuroblasts sequentially express transcription factors which specify the temporal identity of their neuronal progeny. Cell 106, 511–521 (2001). [DOI] [PubMed] [Google Scholar]
- 11.Elliott J, Jolicoeur C, Ramamurthy V & Cayouette M Ikaros confers early temporal competence to mouse retinal progenitor cells. Neuron 60, 26–39 (2008). [DOI] [PubMed] [Google Scholar]
- 12.Mattar P, Ericson J, Blackshaw S & Cayouette M A conserved regulatory logic controls temporal identity in mouse neural progenitors. Neuron 85, 497–504 (2015). [DOI] [PMC free article] [PubMed] [Google Scholar]
- 13.Konstantinides N, Rossi AM & Desplan C Common temporal identity factors regulate neuronal diversity in fly ventral nerve cord and mouse retina. Neuron 85, 447–449 (2015). [DOI] [PMC free article] [PubMed] [Google Scholar]
- 14.Javed A et al. Pou2f1 and Pou2f2 cooperate to control the timing of cone photoreceptor production in the developing mouse retina. Development (Cambridge, England) 147, (2020). [DOI] [PubMed] [Google Scholar]
- 15.Alsiö JM et al. Ikaros promotes early-born neuronal fates in the cerebral cortex. Proc Natl Acad Sci U S A 110, E716–25 (2013). [DOI] [PMC free article] [PubMed] [Google Scholar]
- 16.Fischbach KF & Dittrich AP The optic lobe of Drosophila melanogaster. I. A Golgi analysis of wild-type structure. Cell Tissue Res 258, 441–445 (1989). [Google Scholar]
- 17.Konstantinides N et al. Phenotypic Convergence: Distinct Transcription Factors Regulate Common Terminal Features. Cell 174, 622–635 e13 (2018). [DOI] [PMC free article] [PubMed] [Google Scholar]
- 18.Özel MN et al. Neuronal diversity and convergence in a visual system developmental atlas. Nature (2020) doi: 10.1038/s41586-020-2879-3. [DOI] [PMC free article] [PubMed] [Google Scholar]
- 19.Kurmangaliyev YZ, Yoo J, Valdes-Aleman J, Sanfilippo P & Zipursky SL Transcriptional Programs of Circuit Assembly in the Drosophila Visual System. Neuron (2020) doi: 10.1016/j.neuron.2020.10.006. [DOI] [PubMed] [Google Scholar]
- 20.Nériec N, Desplan C, Neriec N & Desplan C From the Eye to the Brain: Development of the Drosophila Visual System. Current Topics in Developmental Biology 116, 247–271 (2016). [DOI] [PMC free article] [PubMed] [Google Scholar]
- 21.Ngo KT, Andrade I & Hartenstein V Spatio-temporal pattern of neuronal differentiation in the Drosophila visual system: A user’s guide to the dynamic morphology of the developing optic lobe. Developmental biology 428, 1–24 (2017). [DOI] [PMC free article] [PubMed] [Google Scholar]
- 22.Li X et al. Temporal patterning of Drosophila medulla neuroblasts controls neural fates. Nature 498, 456–462 (2013). [DOI] [PMC free article] [PubMed] [Google Scholar]
- 23.Suzuki T, Kaido M, Takayama R & Sato M A temporal mechanism that produces neuronal diversity in the Drosophila visual center. Dev Biol 380, 12–24 (2013). [DOI] [PubMed] [Google Scholar]
- 24.McInnes L, Healy J & Melville J UMAP: Uniform Manifold Approximation and Projection for Dimension Reduction. (2018). [Google Scholar]
- 25.Erclik T et al. Integration of temporal and spatial patterning generates neural diversity. Nature 541, 365–370 (2017). [DOI] [PMC free article] [PubMed] [Google Scholar]
- 26.Qiu X et al. Reversed graph embedding resolves complex single-cell trajectories. Nat Methods 14, 979–982 (2017). [DOI] [PMC free article] [PubMed] [Google Scholar]
- 27.Lee T & Luo L Mosaic analysis with a repressible cell marker for studies of gene function in neuronal morphogenesis. Neuron 22, 451–461 (1999). [DOI] [PubMed] [Google Scholar]
- 28.Erclik T, Hartenstein V, McInnes RR & Lipshitz HD Eye evolution at high resolution: The neuron as a unit of homology. Developmental Biology 332, 70–79 (2009). [DOI] [PubMed] [Google Scholar]
- 29.Hasegawa E et al. Concentric zones, cell migration and neuronal circuits in the Drosophila visual center. Development (Cambridge, England) 138, 983–993 (2011). [DOI] [PubMed] [Google Scholar]
- 30.Mark B et al. A developmental framework linking neurogenesis and circuit formation in the Drosophila CNS. eLife 10, (2021). [DOI] [PMC free article] [PubMed] [Google Scholar]
- 31.Noctor SC, Martínez-Cerdeño V, Ivic L & Kriegstein AR Cortical neurons arise in symmetric and asymmetric division zones and migrate through specific phases. Nature Neuroscience 7, 136–144 (2004). [DOI] [PubMed] [Google Scholar]
- 32.Sagner A & Briscoe J Establishing neuronal diversity in the spinal cord: a time and a place. Development (Cambridge, England) 146, (2019). [DOI] [PubMed] [Google Scholar]
- 33.Sagner A et al. Temporal patterning of the central nervous system by a shared transcription factor code. bioRxiv 2020.11.10.376491 (2020) doi: 10.1101/2020.11.10.376491. [DOI] [Google Scholar]
- 34.Telley L et al. Temporal patterning of apical progenitors and their daughter neurons in the developing neocortex. Science (New York, N.Y.) 364, (2019). [DOI] [PubMed] [Google Scholar]
- 35.Clark BS et al. Single-Cell RNA-Seq Analysis of Retinal Development Identifies NFI Factors as Regulating Mitotic Exit and Late-Born Cell Specification. Neuron 102, 1111–1126.e5 (2019). [DOI] [PMC free article] [PubMed] [Google Scholar]
- 36.Cepko C Intrinsically different retinal progenitor cells produce specific types of progeny. Nat Rev Neurosci 15, 615–627 (2014). [DOI] [PubMed] [Google Scholar]
- 37.Abdusselamoglu MD, Eroglu E, Burkard TR & Knoblich JA The transcription factor odd-paired regulates temporal identity in transit-amplifying neural progenitors via an incoherent feed-forward loop. eLife 8, (2019). [DOI] [PMC free article] [PubMed] [Google Scholar]
- 38.Chen Z et al. A Unique Class of Neural Progenitors in the Drosophila Optic Lobe Generates Both Migrating Neurons and Glia. Cell reports (2016) doi: 10.1016/j.celrep.2016.03.061. [DOI] [PMC free article] [PubMed] [Google Scholar]
Online references
- 39.Davis FP et al. A genetic, genomic, and computational resource for exploring neural circuit function. eLife 9, (2020). [DOI] [PMC free article] [PubMed] [Google Scholar]
- 40.Naidu VG et al. Temporal progression of Drosophila medulla neuroblasts generates the transcription factor combination to control T1 neuron morphogenesis. Developmental biology 464, 35–44 (2020). [DOI] [PMC free article] [PubMed] [Google Scholar]
- 41.Stoeckius M et al. Cell Hashing with barcoded antibodies enables multiplexing and doublet detection for single cell genomics. Genome biology 19, 224 (2018). [DOI] [PMC free article] [PubMed] [Google Scholar]
- 42.Southall T et al. Cell-type-specific profiling of gene expression and chromatin binding without cell isolation: Assaying RNA pol II occupancy in neural stem cells. Developmental Cell 26, 101–112 (2013). [DOI] [PMC free article] [PubMed] [Google Scholar]
- 43.Gold KS & Brand AH Optix defines a neuroepithelial compartment in the optic lobe of the Drosophila brain. Neural development 9, 18 (2014). [DOI] [PMC free article] [PubMed] [Google Scholar]
- 44.Guillermin O, Perruchoud B, Sprecher SG & Egger B Characterization of tailless functions during Drosophila optic lobe formation. Developmental biology 405, 202–13 (2015). [DOI] [PubMed] [Google Scholar]
- 45.Chotard C, Leung W & Salecker I glial cells missing and gcm2 cell autonomously regulate both glial and neuronal development in the visual system of Drosophila. Neuron 48, 237–251 (2005). [DOI] [PubMed] [Google Scholar]
- 46.Shiau F, Ruzycki PA & Clark BS A single-cell guide to retinal development: Cell fate decisions of multipotent retinal progenitors in scRNA-seq. Developmental Biology 478, 41–58 (2021). [DOI] [PMC free article] [PubMed] [Google Scholar]
- 47.Poulin JF, Tasic B, Hjerling-Leffler J, Trimarchi JM & Awatramani R Disentangling neural cell diversity using single-cell transcriptomics. Nat Neurosci 19, 1131–1141 (2016). [DOI] [PubMed] [Google Scholar]
- 48.Zeng H & Sanes JR Neuronal cell-type classification: challenges, opportunities and the path forward. Nature reviews. Neuroscience 18, 530–546 (2017). [DOI] [PubMed] [Google Scholar]
- 49.Gao P et al. Deterministic progenitor behavior and unitary production of neurons in the neocortex. Cell 159, 775–88 (2014). [DOI] [PMC free article] [PubMed] [Google Scholar]
- 50.Kumamoto T & Hanashima C Neuronal subtype specification in establishing mammalian neocortical circuits. Neuroscience research 86, 37–49 (2014). [DOI] [PubMed] [Google Scholar]
- 51.Jabaudon D Fate and freedom in developing neocortical circuits. Nature communications 8, 16042 (2017). [DOI] [PMC free article] [PubMed] [Google Scholar]
- 52.Tang JLY et al. NanoDam identifies novel temporal transcription factors conserved between the Drosophila central brain and visual system. bioRxiv 2021.06.07.447332 (2021) doi: 10.1101/2021.06.07.447332. [DOI] [Google Scholar]
- 53.Marques GS, Teles-Reis J, Konstantinides N, Brito PH & Homem CCF Fate transitions in Drosophila neural lineages: a single cell road map to mature neurons. bioRxiv 2021.06.22.449317 (2021) doi: 10.1101/2021.06.22.449317. [DOI] [Google Scholar]
- 54.Manuel MN et al. The transcription factor Foxg1 regulates telencephalic progenitor proliferation cell autonomously, in part by controlling Pax6 expression levels. Neural Development 6, 9 (2011). [DOI] [PMC free article] [PubMed] [Google Scholar]
- 55.Liu Z et al. Opposing intrinsic temporal gradients guide neural stem cell production of varied neuronal fates. Science (New York, N.Y.) 350, 317–320 (2015). [DOI] [PubMed] [Google Scholar]
- 56.Nwokafor CU, Sellers RS & Singer RH IMP1, an mRNA binding protein that reduces the metastatic potential of breast cancer in a mouse model. Oncotarget 7, 72662–72671 (2016). [DOI] [PMC free article] [PubMed] [Google Scholar]
- 57.Dopie J et al. Genome-wide RNAi screen for nuclear actin reveals a network of cofilin regulators. Journal of cell science 128, 2388–400 (2015). [DOI] [PMC free article] [PubMed] [Google Scholar]
- 58.Rossi AM, Jafari S & Desplan C Integrated Patterning Programs During Drosophila Development Generate the Diversity of Neurons and Control Their Mature Properties. Annual Review of Neuroscience 44, annurev-neuro-102120-014813 (2021). [DOI] [PMC free article] [PubMed] [Google Scholar]
- 59.Arendt D The Evolutionary Assembly of Neuronal Machinery. Current biology : CB 30, R603–R616 (2020). [DOI] [PubMed] [Google Scholar]
- 60.Norimoto H et al. A claustrum in reptiles and its role in slow-wave sleep. Nature 578, 413–418 (2020). [DOI] [PubMed] [Google Scholar]
- 61.Tosches MA et al. Evolution of pallium, hippocampus, and cortical cell types revealed by single-cell transcriptomics in reptiles. Science 360, 881–888 (2018). [DOI] [PubMed] [Google Scholar]
Associated Data
This section collects any data citations, data availability statements, or supplementary materials included in this article.
Supplementary Materials
Data Availability Statement
All Drosophila raw and processed data referenced were uploaded to GEO: accession number GSE167266.
The human source data described in this manuscript are available via the PsychENCODE Knowledge Portal (https://psychencode.synapse.org/). The PsychENCODE Knowledge Portal is a platform for accessing data, analyses, and tools generated through grants funded by the National Institute of Mental Health (NIMH) PsychENCODE program. Data is available for general research use according to the following requirements for data access and data attribution: (https://psychencode.synapse.org/DataAccess). For access to content described in this manuscript see: www.doi.org/10.7303/syn24975927
The publicly available single-cell sequencing datasets that were used can be found in GEO: accession numbers GSE142787 (Drosophila pupal development), GSE118953 (mouse cortical radial glia), and GSE118614 (mouse retinal progenitors).


