

Abstract
Atomic force microscopy (AFM) has emerged as a popular method for determining the mechanical properties of cells, their components, and biomaterials. Here, we describe AFM setup and application to obtain stiffness measurements from single indentations for hydrogels and myofibroblasts.
Keywords: Fibroblast, Atomic force microscopy, Force-curve, Stiffness, Young’s modulus, Hydro-gels, Live-cell measurement
1. Introduction
Cell rheological properties are determined by the combined influence of the extracellular matrix, adhesions, cytoskeleton, membrane proteins and nuclear components. The mechanical properties of each can influence cell function and define whether a cell is normal or diseased. For example, cellular stiffness can influence processes including differentiation [1], aging [2–4], and cancer [5]. Atomic force microscopy (AFM) has emerged as a useful tool to examine cell mechanics, and as a method to characterize mechanical differences in disease states [3].
Standard AFM technique for measuring cell mechanics relies on producing nanometer indentations, via a flexible cantilever with a pyramidal or spherical probe (tip), onto a cell or substrate surface. As force is exerted by the tip onto the cell surface, the deformation of the cantilever is proportional to the deformation of the substrate. To detect the cantilever deformation, a small laser is focused onto the back of the cantilever and the reflection is detected by a photodiode detector (Fig. 1). When the cantilever deforms, the light is deflected away from the point of incidence. As the tip reactively deforms at the surface during indentation and retraction, the deflection is recorded against the distance from the surface to produce a force-indentation curve (which accounts for the deflection against an infinitely rigid substrate, e.g., glass, where deflection is equivalent to indentation; Fig. 2a–c). The force-indentation curves can then be fitted to several proposed models in order to determine the Elastic/Young’s modulus, i.e., elastic/stiffness properties, with the Hertz model being one of the most commonly used [6, 7]. The standard Hertz model assumes that the indenter is spherical and the sample being indented is significantly thicker than the indentation depth, i.e., an infinite half-space. When a pyramidal tip is used, the Sneddon’s cone indenter variation is used [8] (Table 1). However, stiffness measurements have been reported to vary widely depending on the model applied. Therefore, rather than using absolute stiffness values, it is better practice to compare values relatively between samples using the same indenter geometry [9, 10]. More recently, models are emerging to obtain greater information from force-curves, including cell viscoelastic properties [11]. For simplicity, the protocol here specifically reflect data obtained for elastic interactions, though for viscoelastic properties, additional indentation parameters can be added such as dwell time or force clamps such that creep, stress relaxation, etc. can be measured.
Fig. 1. Schematic of atomic force microscopy principle.
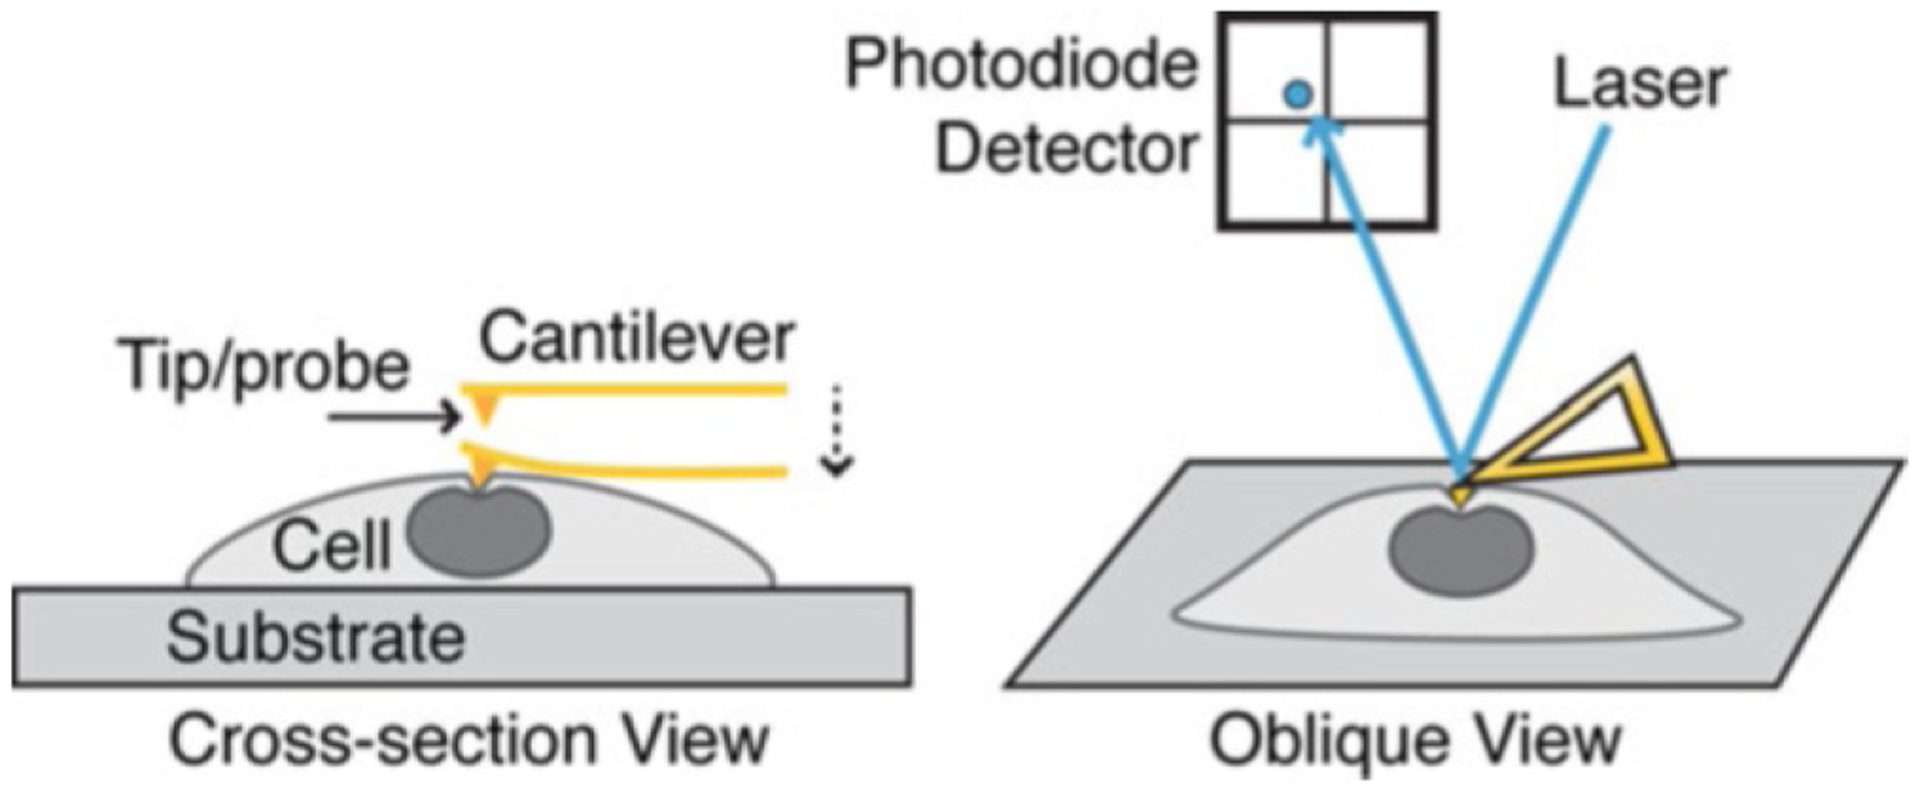
Precise indentation can be made apically on cells or biomaterials. A laser directed onto the cantilever is deflected and detected by a photodiode so that the cantilever deflection at the surface can be measured
Fig. 2. Measurement of surface stiffness.
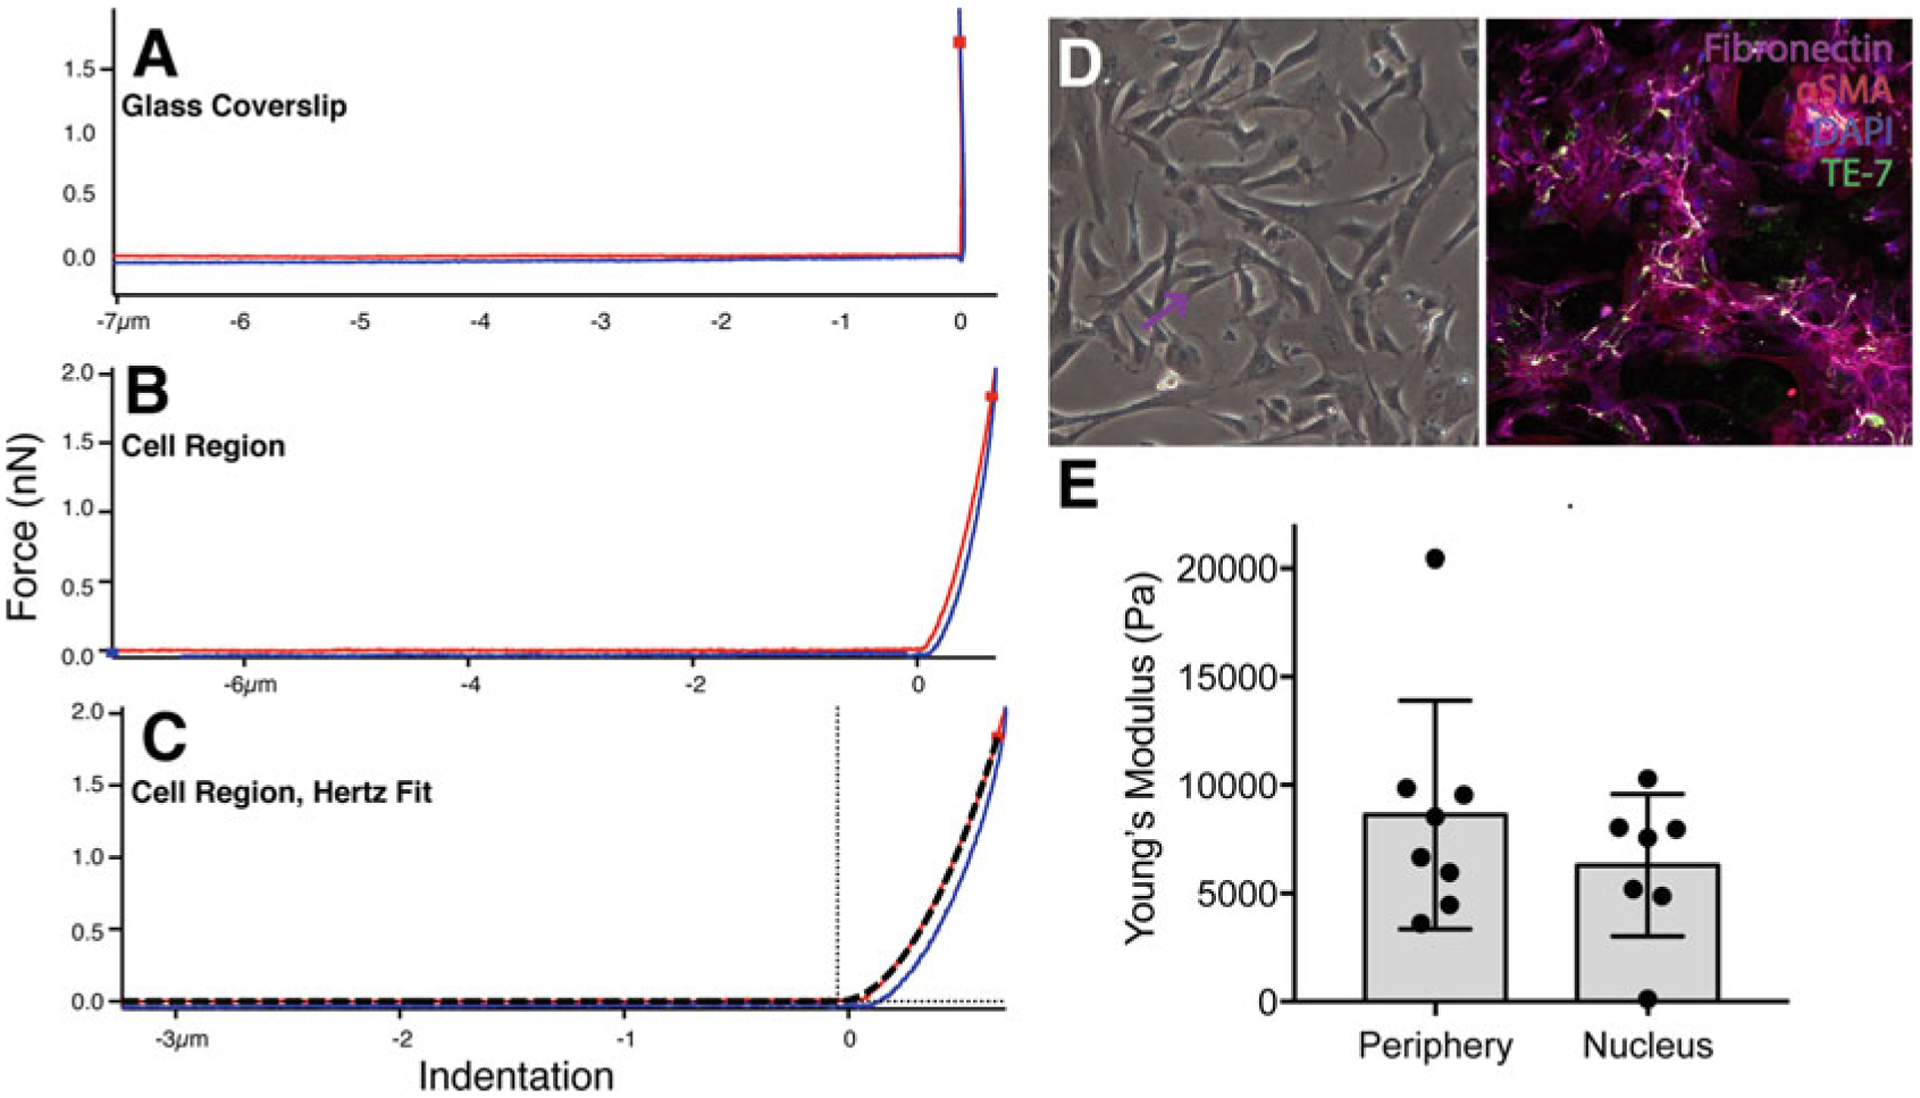
Force-curve generated on (a) glass, (b) cellular region, and (c) Force curve generated Hertz fit for calculating Young’s Modulus. (d) Cardiac fibroblasts cultured on glass coverslips, imaged live with phase contrast (left) and fixed, confocal (right) imaging. Right panel, cells are stained with DAPI (blue), Fibronectin (purple), alpha-SMA (red), TE-7 (green). The purple and blue arrows refer to the cell periphery and above nucleus, respectively, that upon AFM would generate force-curves as shown in panels b–c and cell stiffness measurements as in panel e. The black arrow refers to the glass substrate that when measured with AFM would generate curves as in panel a. (e) Example of cell stiffness measurements for cardiac fibroblast cellular regions. Each point represents average Young’s Modulus for a 5 × 4 force map covering a 3–5 μm2 area. n = 8 (cell periphery) and 7 (above nucleus) cells. For independent t-test, p = 0.3316
Table 1.
Equations used for determining the Young’s modulus
| Determining Force on Cantilever: h = depth of the indentation E* = the effective modulus of a system tip-sample |
|
| Hertz equation (determination of E*): E = Young’s Modulus v = Poisson ratio |
|
| Sneddon’s variation of Hertz: (for cone tip AFM) α = the half-opening angle of the AFM tip |
In addition to variance from indenter geometry and model type, cell stiffness measurements from AFM can vary as a result of position within the cell, as well as cell type; such variation can range from 1 to 100 kPa [10, 12]. As measured herein, we show how these data can vary as the tip interacts with regions of the cell (Fig. 2d, e). Thus, we describe the basic procedure for calibrating the AFM (Subheading 1) and characterizing stiffness of biomaterials (Subheading 2) and myofibroblast cells (Subheading 3). Note that we describe the procedure to obtain classic force curves from single indentations and extract stiffness measurements from the Asylum MFP3D software though we and others typically use more complicated analysis methods for complicated, multilayer materials.
2. Materials
2.1. Hardware
Asylum MFP-3D Atomic Force Microscope.
Epifluorescent Bulb with Blue Filter.
Fluorescent Bulb for Brightfield.
Asylum Live cell chamber.
Flat pointed forceps.
2.2. Disposables for General AFM
Vacuum Grease.
5 mm glass coverslips.
Syringe (18 Gauge, Smaller gauge is better).
Kimwipes.
Plastic 5 mL eye droppers.
1× Phosphate Buffered Saline Solution (PBS).
Clean, non-charged glass slides.
Optional: insect pins.
Optional: 0.1% Neutrad solution in DI Water.
Optional: 1% Bovine Serum Albumin in DI Water.
2.3. Disposables for AFM on Gels
Hydrogels, either bonded to methacrylated coverslips or poly-d-lysine treated coverslips, in 6-well plate and covered in PBS.
2.4. Disposables for AFM with Live Cells
Pre-warmed cell culture media.
25 mm coverslips.
2.5. Software
Asylum Research 13, Igor Pro 6.34A (or above).
3. Methods
3.1. AFM General Setup
Turn on the AFM and brightfield bulb (set to ~25%), and start the Asylum Research software using Standard, Force, Force-ContactMode. Display the Live camera panel, Master panel, and Heater panel (if doing live-cell measurements).
In the Master panel, Main tab, set the integral gain to 0.5–1 and Set Point to 1 V. Set your saving path to automatically save force curves.
Under the Force tab, set the trigger to a force of 2nN (see Note 1). Select to keep the Approach Velocity constant at 2 μm/s and set the Force Distance to 6 μm. Before calibrating a new tip, under the Calibration tab, set the spring constant to 50 pN/nm and the Defl Invols to 50 nm/V.
In the Thermal tab, set the frequency center and width according to the cantilever being used (see Note 2); we will be using Nanoworld PNP-TR tips, which are set to 2 and 10 kHz, respectively.
Invols and spring constant will need to be experimentally determined for each tip being used, as these values should converge when alternating between thermal calibration (determines spring constant) and hitting glass (determines inVols) (see Note 3). Ensure the Spring Constant is “unlocked.”
Set the Cantilever holder into the holder stand on a benchtop. Use forceps to grab the long edges of the tip and place on the Cantilever holder (see Note 4). Use a flat-tipped screwdriver to lift the metal overhang from the side and slide the cantilever underneath. Seat the tip in the center and remove the screwdriver, allowing the overhang to contact the tip. Gently tighten the center screw until the tip is flush against the overhang and Cantilever holder, then tighten each side screw, and finally re-tighten the center screw (see Note 5).
Return the Cantilever holder to the AFM head.
Use a 1.5 mL Pasteur pipette to add PBS (see Note 6) on the cantilever holder to pre-wet the tip. Start on one side of the cantilever and work around it, being careful not to add fluid directly on top of the cantilever or knock the cantilever with the Pasteur pipette (see Note 7). Aspirate PBS before continuing.
Seat a glass slide on the AFM stage, securing with magnets at the edges of the slide. Add PBS, or the solution being used with your samples, onto the glass slide to form a domed droplet with a height of approximately 5 mm (see Note 8).
Flip the AFM head onto the stage and lower the unit using the front dial until the surface tension of the bubble is broken (see Note 9). The cantilever should now be visible on the live video screen (see Note 10). Using the camera adjustment knobs, align the camera with the tip while lowering.
Move the laser onto the tip using the rear and right-facing dials, maximizing the sum value in the Sum and Deflection Meter (see Note 11).
Allow the deflection to stabilize, waiting approximately 5 min.
Lower the tip until just after the appearance of diffraction patterns in the live video, but so that the tip is still above the surface of the glass.
Set the deflection to 0, close the isolation doors, and click “Capture Thermal Data” (Master → Thermal → Capture Thermal Data).
Allow frequency spectrum to stabilize over at least 1 minute, then repetitively click “Fit Thermal Data” until the fitting is constant. Check that the obtained spring constant is consistent with your cantilever lot or literature values (here, we expect a value of 20–50 pN/nm).
Open the isolation doors, set the deflection to less than 0, and click “Engage” in the Sum and Deflection Meter. Ensure that your computer’s sound is turned on and is loud enough to hear the force trigger noise.
Slowly lower the tip until the force trigger is reached (Z voltage 70–100, in Sum and Deflection Meter), and then press “Withdraw” on the Sum and Deflection Meter.
Under the Force tab, click “Single Force.”
On the resulting displacement vs. deflection graph (Fig. 2a), zoom in on the top-most part of the curve (the linear region) by clicking and dragging a box around the region, right-click the end of the curve, and calculate InVols. Check the inVols are consistent with your tip (here, we expect values from 40 to 50 nm/V).
Repeat the thermal calibration and InVols measurement until the values remain relatively constant (see Note 12).
Using the front dial, raise the head to the maximum height before removing the head. The AFM is now calibrated and ready for samples to be mounted.
3.2. Hydrogel Analysis Using AFM
Synthesize gels according to established protocols [13–15] on coverslips. Gels should be in the calibration buffer at room temperature before measurement.
Take a fresh glass slide and add vacuum grease to the center of the slide with a Q-tip, using a small circular motion to spread the grease and cover an area approximately the size of the coverslip.
Use a bent syringe to pry the coverslips (and overlying gels) from the bottom of the well with one hand, grabbing the elevated edge with forceps with the other hand.
Place the gel-laden coverslip into the greased portion of the slide and push down along the edges of the gel to ensure level seating on the slide.
Place the slide on the AFM stage and secure with magnets.
Add buffer solution to the gel, creating a large, domed droplet.
Restore the AFM head on top of the stage and lower until the surface tension is broken.
Allow 5 minutes for the deflection to stabilize, then adjust to below 0 using the left dial.
Engage the tip and lower until the trigger is reached.
Make note of the front dial position at which the trigger is reached, then raise the head by one thumb-stroke to the left, followed by returning it to the original height by aligning the dial with the guide marks on the AFM head (see Note 13).
Press “single force” (see Note 14).
In the Master Force panel, within the Display tab, load the directory in which the curves are saved. Navigate to the Elastic tab and change the Poisson’s Ratio to 0.5, and select the tip geometry and material according to your cantilever (see Note 15).
Due to intra-sample topological variances and biological heterogeneity, it is customary to compile a Force Map of several points in the X–Y plane at each point of measurement. This also rapidly increases the rate of data acquisition versus individual points and allows an average stiffness to be calculated per region. To create a force map, go to the FMap tab on the Master Panel. Input the scan size and the amount of points in the x (points) and y (lines) directions. You can also alter the scan speed. Set an appropriate base name and saving path for the force map.
elect “Do Fmap.”
To review the Force Map, select a single point in the Map view or the Force Plots list (Master Force Panel → Display), then move to the Entire Force Map tab (under the Elastic tab) and click Fit. You will observe a curve fit as shown in Fig. 2b, c.
To output the Young’s Moduli for the entire force map, click the Analyze (A) button in the Map view, then under the histogram tab of the Analyze panel, click “Make New Histogram,” and then edit. Individual values can then be pasted into spreadsheets for downstream analysis (Fig. 2e).
To obtain additional measurements, raise the AFM head using the front dial before moving the stage so the tip does not break by tugging on raised regions, then repeat steps 9–16 in Sub-heading 3.2.
When finished, remove the AFM head from the stage, flip it over, and set on the rest. If planning to use the tip for the next experiment, rinse with DI water. Otherwise, dispose of the tip or replace in the tip box, making note of the date it was used.
3.3. Live Cell Analysis Using AFM
Culture cells of interest on sterilized glass coverslips.
Transfer 50 mL of growth media or calibration buffer to a mL conical tube and heat to 37 °C and remove from the incubator just before mounting cells.
Transfer cell-seeded coverslip into the live-cell chamber, using ample vacuum grease and ensuring a water-tight seal between the glass and chamber.
Add just enough warmed growth media to reach the heater ring on the live-cell chamber and secure the chamber on the AFM stand with the electrical cable resting to the right side of the AFM stand.
Place the AFM head over the live-cell chamber and lower until the silicone forms a seal on the live-cell chamber (see Note 16), and turn on the feedback and Target Temp in the heater panel.
Lower the cantilever until the surface tension is broken (see Note 17).
Wait for the temperature to reach the Target Temp and for the deflection to stabilize, usually a minimum of 5 min.
Conduct force measurements as described in the previous section (see Note 18).
Turn off the heater and set point before removing the AFM head (see Note 19).
4. Notes
Soft gels may require lower indentation forces, gel may get deposited on tip and result in biphasic response. Test tips by indenting glass, and switch as necessary. To clean organic material from a cantilever, submerge in 0.1% Neutrad solution. Several rinses may be required.
The frequency will be significantly less than what is listed on the packaging due to the tip being submerged in liquid [16, 17].
As mentioned above, the spring constant in water-based buffers will also be less than the value printed on the packaging (approximately a third in our experience, but dependent on buffer used).
It may be helpful to check the integrity of the cantilever using a magnifying glass and ensure that tips were not damaged or broken in transit.
Only tighten until finger-tight, over-tightening can result in snapping the cantilever—this renders measured values inaccurate and can destroy the opposite end of the cantilever.
PBS can be replaced with whichever buffer the hydrogel or cells are in.
Dropping fluid directly on the cantilever can result in bent or broken tips—either preventing data collection or providing inaccurate measurements. The entire cantilever should be submerged before proceeding, which may require pipetting off PBS and reapplying until the surface is covered. Adding too much PBS at once may cause it to flow over the side and damage the head of the AFM. If small air bubbles appear under the cantilever, Insect pins can be used to scrape the bubbles toward the edge of the platform where they are easier to burst.
If performing live-cell AFM, calibration should be done on a glass coverslip in the live-cell incubator with the buffer heated to the desired temperature.
This should be readily apparent when looking at the front of the AFM—if you are unsure if you have broken the surface tension, check at the live video feed. The cantilever should be in focus once it is submerged.
The AFM head should be level at the Z-height of the sample. If the head is not level, the angle of approach of the cantilever will not be perpendicular to the surface, resulting in erroneous measurements.
For PNP-TR tips, sum on the long cantilever should be 8+, and 4–5 for the short cantilever.
After identifying standard values for your tips of choice, we typically repeat the thermal and glass force measurement three times before proceeding. For PNP-TR tips, acceptable values are typically k = 20–50 pN/nm and InVols = 40–50 nm/V.
This is important for soft gels and somewhat “stickier” biological materials that cause adhesion with the tip. This will ensure that the tip is no longer in contact with the sample when the force measurement is taken, resulting in a horizontally flat approach curve.
A smaller indentation distance will provide more accurate and quicker measurements, though a larger distance is recommended for force maps to minimize the amount of failed trigger points.
PNP-TR tips are pyramidal silicon nitride, though generally the tip material and half angle minimally affect the calculated Young’s Modulus. Biphasic curves usually indicate that you have indented through the material and are likely hitting the glass. To prevent excessive adhesion, sample can be submerged in a 1% BSA solution for 5 minutes.
The x-y directions of the AFM stage may need to be adjusted to seat the silicone in the live-cell chamber. If the silicone is not sealed well, the media or buffer will evaporate more rapidly and may result in an oblique cantilever approach, providing erroneous results.
This is best visualized using the live video feed, as the silicone ring and chamber will impede direct observation.
Force map areas and lateral movement of the AFM stage should be minimized to preserve the silicone gasket seal. Cells may contract, peel off the substrate, and die after several indentations.
Failure to do this can result in the heating element overheating and burning sugars from the media. When using a single sample for a long time, additional media may be required to compensate for the evaporated volume. If you smell a sweet bread-like aroma, the sample may have run dry, causing remaining media on the heating element to caramelize the sugars.
References
- 1.Engler AJ, Sen S, Sweeney HL, Discher DE (2006) Matrix elasticity directs stem cell line-age specification. Cell 126:677–689 [DOI] [PubMed] [Google Scholar]
- 2.Lieber SC, Aubry N, Pain J, Diaz G, Kim SJ, Vatner SF (2004) Aging increases stiffness of cardiac myocytes measured by atomic force microscopy nanoindentation. Am J Physiol Heart Circ Physiol 287:H645–H651 [DOI] [PubMed] [Google Scholar]
- 3.Jin H, Xing X, Zhao H, Chen Y, Huang X, Ma S, Ye H, Cai J (2010) Detection of erythrocytes influenced by aging and type 2 diabetes using atomic force microscope. Biochem Biophys Res Commun 391:1698–1702 [DOI] [PubMed] [Google Scholar]
- 4.Starodubtseva MN (2011) Mechanical properties of cells and ageing. Ageing Res Rev 10:16–25 [DOI] [PubMed] [Google Scholar]
- 5.Suresh S (2007) Biomechanics and biophysics of cancer cells. Acta Biomater 3:413–438 [DOI] [PMC free article] [PubMed] [Google Scholar]
- 6.Hertz H (1881) Ueber den kontakt elastischer koerper. J fuer die Reine Angewandte Mathematik 92:156 [Google Scholar]
- 7.Johnson KL (1985) Contact mechanics. Cambridge University Press, Cambridge [Google Scholar]
- 8.Laurent VM, Kasas S, Yersin A, Schaffer TE, Catsicas S, Dietler G, Verkhovsky AB, Meister JJ (2005) Gradient of rigidity in the lamellipodia of migrating cells revealed by atomic force microscopy. Biophys J 89:667–675 [DOI] [PMC free article] [PubMed] [Google Scholar]
- 9.Ohashi T, Ishii Y, Ishikawa Y, Matsumoto T, Sato M (2002) Experimental and numerical analyses of local mechanical properties measured by atomic force microscopy for sheared endothelial cells. Biomed Mater Eng 12:319–327 [PubMed] [Google Scholar]
- 10.Kuznetsova TG, Starodubtseva MN, Yegorenkov NI, Chizhik SA, Zhdanov RI (2007) Atomic force microscopy probing of cell elasticity. Micron 38:824–833 [DOI] [PubMed] [Google Scholar]
- 11.Efremov YM, Wang WH, Hardy SD, Geahlen RL, Raman A (2017) Measuring nanoscale viscoelastic parameters of cells directly from AFM force-displacement curves. Sci Rep 7:1541. [DOI] [PMC free article] [PubMed] [Google Scholar]
- 12.Thomas G, Burnham NA, Camesano TA, Wen Q (2013) Measuring the mechanical properties of living cells using atomic force microscopy. J Vis Exp (76):50497. [DOI] [PMC free article] [PubMed] [Google Scholar]
- 13.Ondeck MG, Engler AJ (2016) Mechanical characterization of a dynamic and tunable methacrylated hyaluronic acid hydrogel. J Biomech Eng 138:0210031–0210031 [DOI] [PMC free article] [PubMed] [Google Scholar]
- 14.Tse JR, Engler AJ (2010) Preparation of hydrogel substrates with tunable mechanical properties. Curr Protoc Cell Biol 47:10.16.11–10.16.16. John Wiley & Sons, Ltd. [DOI] [PubMed] [Google Scholar]
- 15.Benton JA, Deforest CA, Vivekanandan V, Anseth KS (2009) Photocrosslinking of gelatin macromers to synthesize porous hydrogels that promote valvular interstitial cell function. Tissue Eng A 15:3221–3230 [DOI] [PMC free article] [PubMed] [Google Scholar]
- 16.Vančura C, Dufour I, Heinrich SM, Josse F, Hierlemann A (2008) Analysis of resonating microcantilevers operating in a viscous liquid environment. Sensors Actuators A Phys 141:43–51 [Google Scholar]
- 17.Habibnejad Korayem M, Jiryaei Sharahi H, Habibnejad Korayem A (2012) Comparison of frequency response of atomic force microscopy cantilevers under tip-sample interaction in air and liquids. Sci Iran 19:106–112 [Google Scholar]