Abstract
The burden of cervical cancer disproportionately falls on low- and middle-income countries (LMICs). Automated visual evaluation (AVE) is a technology being considered as an adjunct tool for the management of HPV-positive women. AVE involves analysis of a white light illuminated cervical image using machine learning classifiers. It is of importance to analyze various impacts of different kinds of image degradations on AVE. In this paper, we report our work regarding the impact of one type of image degradation, Gaussian noise, and one of its remedies we have been exploring. The images, originated from the Natural History Study (NHS) and ASCUS-LSIL Triage Study (ALTS), were modified by the addition of white Gaussian noise at different levels. The AVE pipeline used in the experiments consists of two deep learning components: a cervix locator which uses RetinaNet (an object detection network), and a binary pathology classifier that uses the ResNeSt network. Our findings indicate that Gaussian noise, which frequently appears in low light conditions, is a key factor in degrading the AVE’s performance. A blind image denoising technique which uses Variational Denoising Network (VDNet) was tested on a set of 345 digitized cervigram images (115 positives) and evaluated both visually and quantitatively. AVE performances on both the synthetically generated noisy images and the corresponding denoised images were examined and compared. In addition, the denoising technique was evaluated on several real noisy cervix images captured by a camera-based imaging device used for AVE that have no histology confirmation. The comparison between the AVE performances on images with and without denoising shows that denoising can be effective at mitigating classification performance degradation.
Keywords: Deep learning, automated visual evaluation, cervical cancer, low resource settings, denoising
1. INTRODUCTION
Cervical cancer is one of the most common cancers affecting women’s health worldwide with the greatest impact in low- and middle-income countries (LMICs) where 84% of the new cases and almost 90% of the deaths occur [1]. Early detection and prevention are important for reducing morbidity and mortality rate. In LMICs, “visual inspection with acetic acid” (VIA) is commonly used for cervical cancer screening. The technique uses naked-eye human visual evaluation of the uterine cervix and its changes after the application of weak acetic acid. VIA is simple, inexpensive, and has the merit of providing screening result and possible treatment at the same visit. However, the performance on predicting lesions through VIA has been observed to be inadequate due to high inter- and intra-reader variability [2].
To improve the VIA performance, medical practitioners and field workers in several screening programs have been equipped with relatively inexpensive and easy-to-use mobile colposcope and imaging devices [3,4]. Such programs mainly use digital images for the training of nurses or practitioners in VIA in combination with remote consultation with experienced colposcopists and, minimally, for documentation of clinical examination. More recently, with the advance and promise of deep learning in other applications, we and other researchers have been employing deep learning techniques to automatically analyze the captured cervical images to identify abnormal cases [5,6]. Such approaches are named automated visual evaluation (AVE).
Although AVE has demonstrated its promise in proof-of-concept works [5,6], there are a number of challenges need to be addressed for real-world usage. One of them is image quality control. The aim of image quality control is to acquire standardized “good-quality” images of cervix as well as identifying and filtering out “bad/low quality” images. The variance among appearance of images is usually large due to variations in device, light source, woman age and parity, cervix anatomy and condition, and decision and discretion of users. Image quality can be affected by both non-clinical factors and clinical factors. Non-clinical factors that may cause quality degradation include blur, glare, shadow, noise, zoom, angle, embedded text, low contrast, discolor, occlusion of clinical instruments, among others. Clinical factors contain cervix 4-quadrant visibility, existence of blood or mucus that blocks the cervix region, transformation zone visibility, post-surgery or treatment, or non-precancerous pathology. To improve or control image quality, there are three general approaches: 1) strengthening user training; 2) improving hardware (optics and light source); and 3) developing automatic aided methods. To the end of development of automatic methods, our previous work includes filtering out non-cervix images [7], identifying green-filtered images and iodine-applied images [8], separating sharp images from non-sharp images [9], and deblurring blurry images [10]. We also have been working on analyzing the effects of various image quality degradation factors on the performance of AVE and exploring ways to alleviate the issues. In this paper, we focus and report our work regarding one of the image quality degradation factors, image noise.
It is common to have some degree of noise in digital images. The extent of digital camera introduced noise can be due to several factors such as the amount of scene illumination, camera sensitivity setting, duration of exposure, and color temperature setting. Image noise becomes more significant when the images are taken in low light situations. The cervix is the lowermost portion of uterus and is located at the end of the vaginal canal (with length around 4–10cm and mid-lower average width around 3cm, respectively [11]). Unlike the colposcopes used in clinics for the examination of the cervix, low-cost alternative imaging devices that could be used in LMIC (such as smartphones) often do not have optical zoom capability and may lack sufficient illumination. As a result, images taken with low-cost imaging devices for AVE may have noticeable image noise and the level of image noise may be significant. Some key questions are: whether and how significantly image noise degrades AVE model performance? To answer these questions, we carried out experiments to quantitively examine and evaluate the AVE results on different levels of image noise. We confirmed that noise (and the level at which it) affects AVE results considerably.
Besides the approaches of improving the imaging device and user training so that captured images are as clear as possible in the first place, there are several other ways to deal with image noise, especially for the images that have already been captured. Those approaches include: 1) making the AVE models more robust to noise; 2) using a method to identify noisy images and asking users to retake images if the image is too noisy; and, 3) using a method to denoise the images automatically. We have been exploring and pursuing on all these directions. In this paper, we report our work on the last approach, i.e., reducing the image noise by applying a denoising method. In the following sections, we describe the dataset used, the AVE pipeline and models, the methods for generating synthesized noisy images, the applied denoising network, the metrics used to evaluate the denoising performance, the performance of cervix detection and classification for both noisy and denoised images, and the results on both synthetic and real-world noisy images.
2. METHODOLOGY
2.1. Datasets
The data used for the experiments consists of images collected from two studies that were organized and funded by National Cancer Institute (NCI). One study is the population-based longitudinal natural history study (NHS) that was carried out in Guanacaste, Costa Rica (a rural area with a moderate risk that was poorly screened previously) [12]. The other is the ASCUS-LSIL Triage Study (ALTS) that was conducted in four colposcopic clinical centers in the United States and aimed to compare alternative management plans for women with mild cytological abnormalities [13]. The data in both studies was de-identified and approved for secondary use in subsequent data analytic studies. Both studies were conducted about 20 years ago, and the cervix images collected by both studies were cervigrams that were taken using a film-based imaging device (cerviscope) with a high depth-of-field optics and a ring illumination. Those cervigrams were later scanned and digitized. The images in both datasets are considered to be satisfactory and of good quality based on manual visual review by medical experts. Several examples of images in both datasets are shown in Figure 1. The differences of image characteristics between “controls” (have no lesions of precancer or cancer) and “cases” (have lesions of precancer or cancer) in the ALTS dataset are expected to be more subtle and less differentiable than those in the NHS dataset. Researchers at NCI have labeled a subset of images in both datasets that are clean controls and clean cases based on histopathologic confirmation and other related information. We randomly split this data subset, at the subject level, into training, validation, and test sets, respectively, in order to train and test the AVE classifier. The test set contains 345 images with 115 cases.
Figure 1.
Examples of cervigrams
In addition to this combined data of NHS and ALTS, we also have a few noisy cervix images donated by Liger Medical that were captured using the IRIS imaging device they developed (an older version) [14]. The IRIS images do not have ground truth labels for AVE classification as they do not have histological confirmation information, hence, we used them only for evaluating denoising.
2.2. AVE pipeline and models
The AVE pipeline used in this work consists of two components: cervix detection and cervix classification. As shown in Figure 1, there is a large region outside the cervix in each image. This non-cervix region may contain vaginal walls, parts of clinical instruments (cotton swab, speculum), and clinically non-relevant text. To reduce interference and make AVE classification algorithm focus mainly on the region-of-interest (cervix), we remove the non-cervix region as the first step. We applied the RetinaNet [15] object detection network to locate the cervix region. RetinaNet is a one-stage object detector which achieves state-of-the-art performance by using feature pyramid networks (FPN) (to utilize and combine multiscale features) and focal loss (to deal with class imbalance problem). We trained the RetinaNet cervix detector using images obtained from a different study (Costa Rica Vaccine Trial [16], also organized and funded by the NCI) which have manual cervix markings. Cervix detection results on several NHS and ALTS images are displayed in Figure 2. The cervix region is cropped out after the cervix locator predicts coordinates of the cervix region box in the image, and resized before being passed on to the AVE classifier.
Figure 2.
Examples of cervix detection
For AVE classification, we applied the ResNeSt network [17]. ResNeSt is a recently proposed variant of the well-known classification network ResNet. It incorporates channel-wise attention with multi-path representation and introduces a new block module called the “split attention” block. Specifically, in each “split attention” block, feature maps are first divided into several “cardinal groups”. The feature maps in each cardinal group are then separated channel-wise into subgroups (“splits”). The features across subgroup splits are combined (“attention”) before being concatenated for all the groups. We fine-tuned the ImageNet pretrained ResNeSt model using the cervix images in our dataset. We also applied the following augmentation methods to increase the number of training images: random rotation, color jitter, horizontal flip, and principal component analysis (PCA) color normalization. We did not include random noise as one of augmentation methods for this study. We will consider adding slight noise in augmentation for the approach of improving the robustness of AVE model.
2.3. Analysis of effects of image degradation on AVE
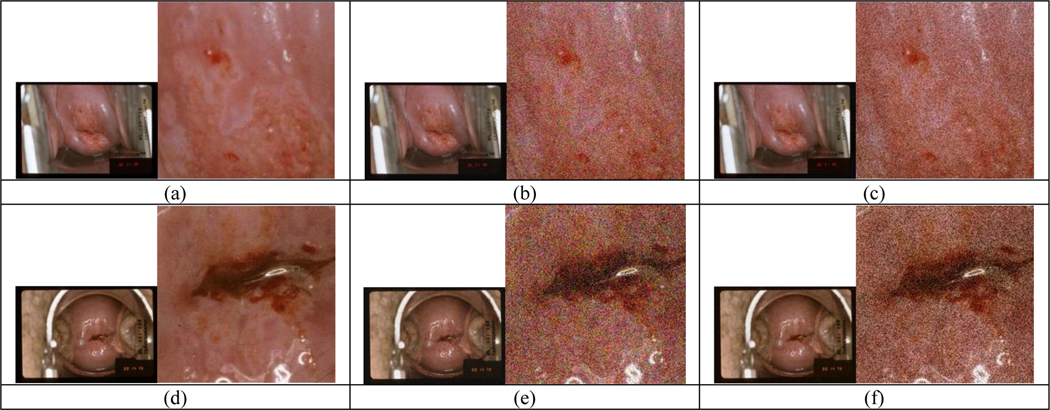
It is of importance to systematically examine the impact of different image degradations on the performance of AVE models and identify the key factors to address and improve. To this end, we have been working on generating synthetically degraded images by adding different types of defects with various degrees to the good quality image set and examining the test performance of the AVE models (trained with good quality images) on those degraded images. Several types of degradations that are less difficult to mimic and generate, such as, blur, recoloring, partial obstruction on cervix, and noise, have been explored. For evaluating noise, we synthesized two types of noisy images using a simple method. White Gaussian noise with zero mean and different levels of local variance were added either to each of the three RGB channels or to the intensity channel only (the V channel after converting images to the Hue-Saturation-Value color space), respectively. Figure 3 shows examples of the generated noisy images (variance = 0.01 for the first-row noisy images or 0.02 for the second-row noisy images). In Figure 3, the first column ((a) and (d)) is the original image with a cropped region (in the original resolution) next to it to show details, the second column ((b) and (e)) has noise added to three channels (RGB), and the third column ((c) and (f)) has noise added to one channel (V) only. We observed that for the same value of variance, especially when it is small, the noise added to three color channels appeared more noticable than that added only to the intensity channel due to greater human-vision sensitivity to color. We sent the original test set images and the corresponding noisy images to the AVE pipeline and examined the outputs of both cervix detector and cervix classifier. Of note, both models were not retrained using noisy images and remained unchanged in the experiments. Retraining models with noisy images will be considered in the effort for making the models more robust. The test results we obtained indicate noise can negatively affect the cervix classification performance significantly although much less on cervix detection performance.
Figure 3.
Examples of synthetic noisy images with Gaussian noise of zero-mean and local variance of 0.01 (for a-c) or 0.02 (for d-f) added: (a)(d) the original image; (b)(e) noise added to RGB channels; (c)(f) noise added to V channel only.
2.4. Denoising network
As our experiments have identified noise as one key issue and challenge for maintaining the high performance of AVE classifier trained with good quality images, we have been exploring different ways to address and alleviate this issue. One of them is applying denoising techniques. Image denoising has been actively studied in the research field. Besides classical approaches, there are deep learning-based approaches developed in recent years. For a good overview and survey of the methods proposed in the literature, please refer to [18]. For our dataset, we applied the Variational Denoising Network (VDNet) [19]. It was proposed for blind image denoising and does both automatic noise estimation and image denoising. The main idea of VDNet is to use a deep neural network to learn an approximate posterior from the latent variables (which represent clean image and noise variances) conditioned on the input noisy image. The network consists of two main sub-networks: D-Net and S-Net, in which D-Net uses an encoder and decoder architecture (U-Net) for the prediction of posterior parameters of latent variable representing clean image while S-Net uses DnCNN [20] for predicting posterior parameters of latent variable representing noise variance. It has demonstrated and achieved state-of-the-art performance on general domain images for reducing both i.i.d. and complicated non-i.i.d. noise. In our application, we did not train the VDNet with our synthetic noisy images but used the model that was trained on a real-world dataset (SIDD medium dataset [21]), since it is more appealing to incorporate real-world noise and we hypothesize that the real-world noise in general domain noisy images have similar characteristics to that in real noisy cervix images. The SIDD medium dataset consists of 320 image pairs of noisy and ground-truth clean images. The images in SIDD were taken using five representative smartphone cameras under different lighting conditions [21]. We tested the VDNet models on our synthetic noisy cervix images as well as several IRIS real noisy cervix images. The denoised cervix images were then input to the AVE pipeline and compared the results with those obtained from noisy images and original images.
2.5. Evaluation methods
To evaluate the performance of image denoising, we used four metrics: Peak Signal-to-Noise Ratio (PSNR), Structural similarity (SSIM) [22], Perception-based Image Quality Evaluator (PIQE) [23], and Naturalness Image Quality Evaluator (NIQE) [24]. PSNR and SSIM require a reference image while PIQE and NIQE are no-reference image quality metrics, respectively. The larger the value of PSNR (SSIM), the better. The smaller the value of PIQE (NIQE), the better. We calculated all four measures for the synthetic noisy images, but only the PIQE and NIQE scores for the real noisy images since they do not have corresponding ground-truth noise-free images. We assessed the cervix detection results qualitatively as there are no expert markings for the cervix in those images. For quantitative evaluation, we calculated the difference between the detection from the noisy and denoised image and that from the original image with respect to the center, width, area, and aspect ratio of the box. We used the area under the curve (AUC) value of ROC plot as the metric to compare the effects of the increase in the amount of image noise as well as that of denoising on AVE classification performance.
3. EXPERIMENTAL RESULTS AND DISCUSSIONS
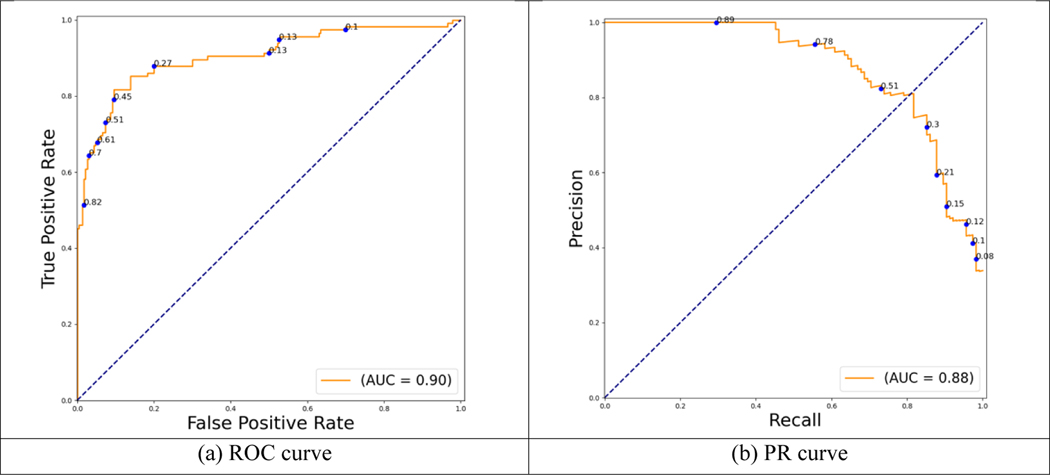
The data consists of 3374 digitized cervigrams from 1143 study subjects that were labeled as either clean controls or clean cases. Subsets of images were randomly grouped, at patient level, into training, validation, and test sets, respectively. The number of images in each class in the training, validation, and test set is provided in Table 1. In our experiments, the images were resized with a longer edge to be 1200 pixels while maintaining the original aspect ratio. This size was empirically determined in prior studies and is maintained here for consistency. First, the cervix regions in these images were extracted by the RetinaNet cervix detector trained on cervix images from a different dataset. Next, the detected cervix regions in the training set were used to train a ResNeSt-based AVE classifier. The classifier used ResNet50 as the base network and the model was initialized with weights from ImageNet pretrained model. The loss function was cross entropy with label smoothing. The Adam optimizer was used with a learning rate of 1e-5. The batch size was 8. The model was trained for 100 epochs and the one with the highest performance on validation set was selected. The ROC curve and precision-recall (PR) curve for the classification results on the 345 original images in the test set (230 controls and 115 cases) are shown in Figure 4. The confusion matrix (at threshold 0.5) is shown in Table 2. The precision, recall (sensitivity), specificity, accuracy, and F-1 score are 0.83, 0.74, 0.87, 0.86, and 0.78, respectively.
Table 1.
Number of images in training/validation/test set
| Controls | Cases | |
|---|---|---|
| Training Set | 1645 | 843 |
| Validation Set | 359 | 182 |
| Test Set | 230 | 115 |
Figure 4.
AVE classification performance on the test set of the original images
Table 2.
Confusion matrix for classification performance on the test set of the original images
| Ground truth | |||
|---|---|---|---|
| Case | Control | ||
| Pred. | Case | 85 | 18 |
| Control | 30 | 212 | |
To create noisy images, additive white Gaussian noise (AWGN) with zero mean and local variance ranging from 0.001 to 0.02 (with step 0.001) was added to the original images in two ways. One was to salt each of the RGB channels and the other was to salt the V channel in HSV color space. We applied the VDNet model trained with SIDD image dataset to denoise both types of synthetic noisy images. Figure 5 shows a couple of noisy images (variance = 0.010 and 0.015 respectively) and their corresponding denoised ones. By comparing the close-ups in Figure 5(a) – (h), we observed that noise can be reduced significantly by the denoising network although denoising may introduce some small degree of blur. We also applied denoising to the original images to check the effect of denoising on clean images. The denoised images may look a little bit blurry compared to the original images, and examples are shown in Figure 5(i)–(l).
Figure 5.
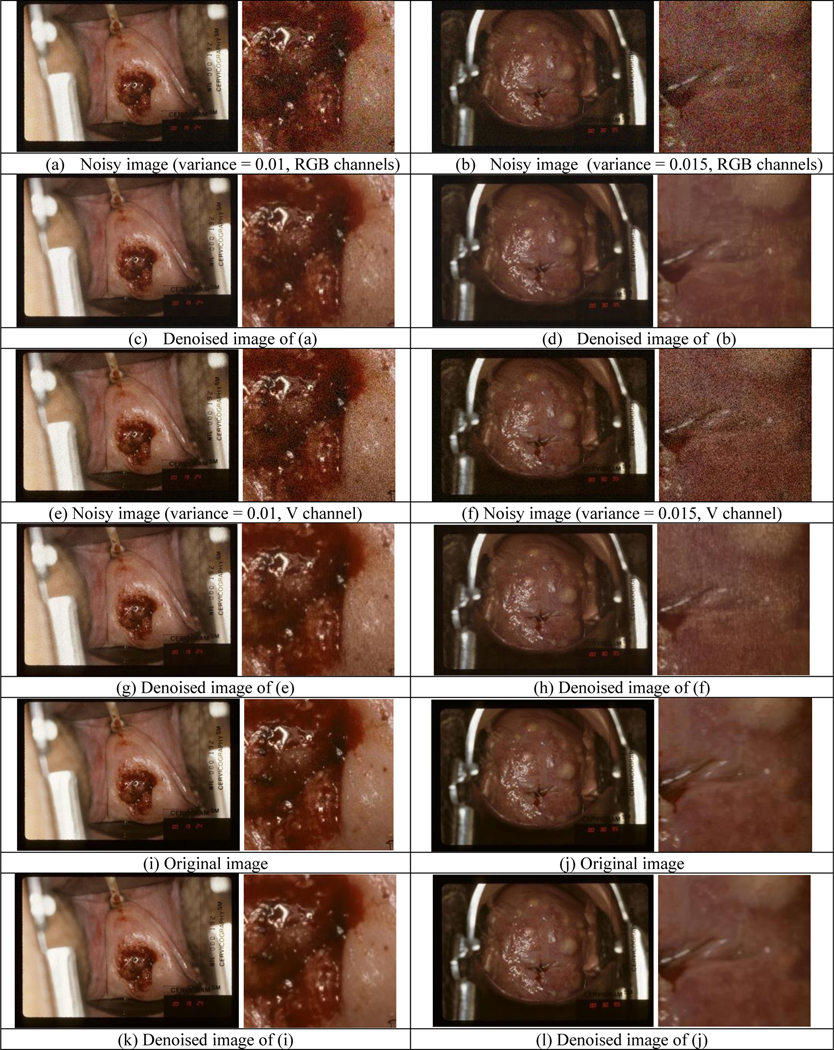
Examples of denoising results for synthetic noisy images
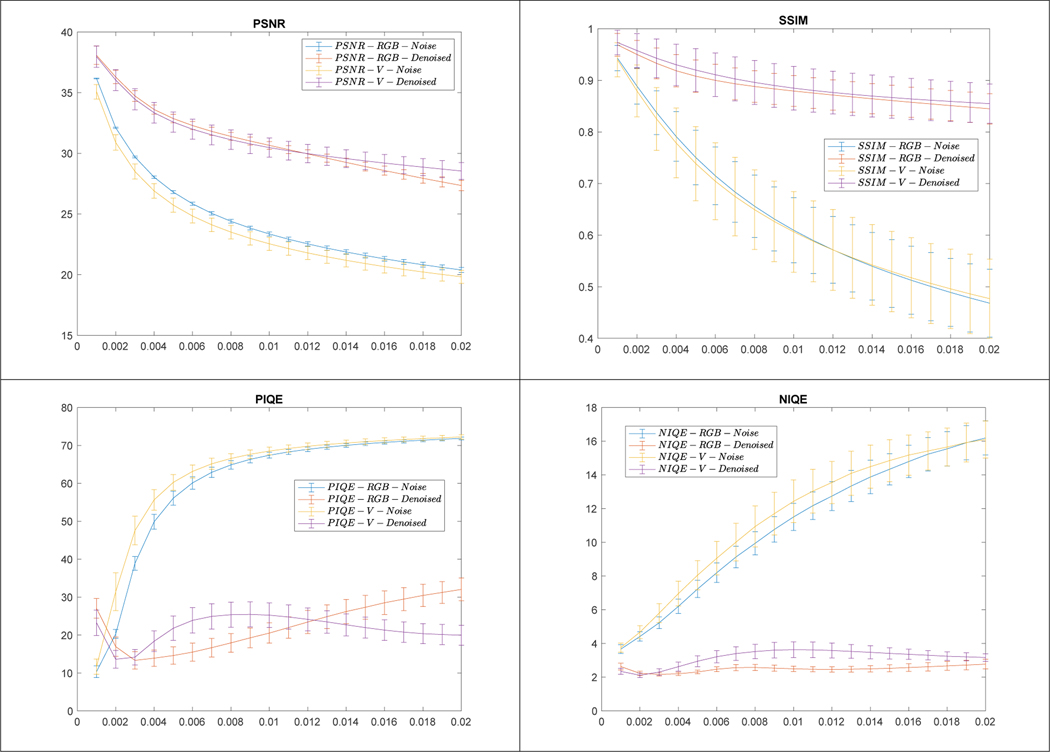
To quantitatively evaluate the denoising performance, we calculated the PSNR, SSIM, PIQE, and NIQE values for all the test set images. For PSNR and SSIM, the original images were used as the reference. Figure 6 shows the mean and std values of all four measures obtained from noisy (in blue or yellow color) and denoised images (in red or purple color) with respect to noise variance, respectively. For PSNR and SSIM, the larger the value is, the better. For PIQE and NIQE, the smaller the value is, the better. The values for denoised images become significantly better than those of the noisy images with the increase of noise variance.
Figure 6.
Results of quantitative evaluation for denoising cervigrams
Besides synthetic noisy images, we also evaluated denoising on the few real noisy images visually as well as quantitatively (using PIQE and NIQE since there are no corresponding reference images). An example of real noisy images and its denoised version are shown in Figure 7. The noise in the IRIS image is not easy to tell and can be observed as weak pixelation in the close-up image (in the original resolution) in Figure 7(a). As shown by Figure 7(b), denoising can reduce the noise to a degree and the denoised image looks smoother. As listed in Table 3, the mean and standard deviation)values of NIQE for denoised images are both better, while PIQE has slightly larger mean value and smaller standard deviation value for denoised images.
Figure 7.
Example of denoising results for IRIS noisy images
Table 3.
Quantitative quality evaluation for IRIS images
| PIQE | NIQE | |
|---|---|---|
| Original | 16.43±4.21 | 6.83±0.60 |
| Denoised | 17.16±1.90 | 4.98±0.31 |
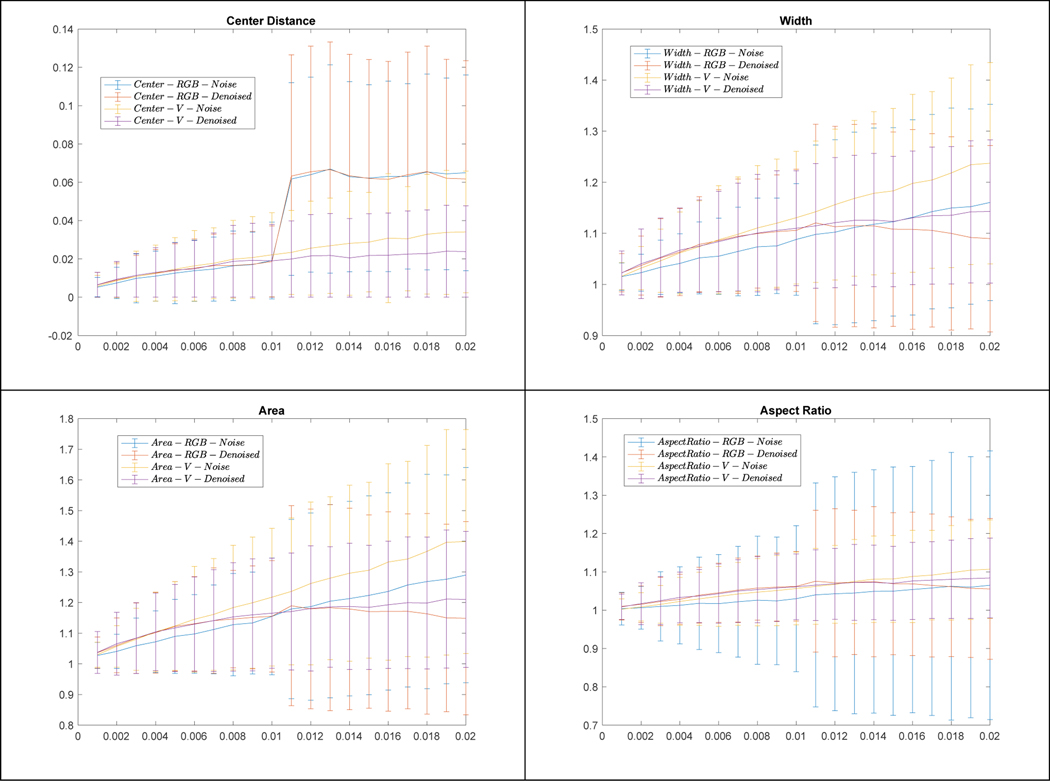
Figure 8 shows examples of cervix detection on the original images, images with noise added to RGB channel (or V channel), and denoised images, respectively. We observed that the detected region boxes may have some changes, but the detection results are satisfactory with respect to containing cervix. To quantitatively compare the detection results, we used the cervix box detected from the original images as reference and computed the following values for noisy or denoised images: distance between box centers (normalized to the sum of cervix width and height in the original image), and the ratios with respect to box width, area, and aspect ratio (width/height), respectively. Figure 9 shows their mean and standard deviation values w.r.t. the increase of noise variance. In general, the change of detection is moderate although it appears to be larger (box may be less tight) when noise variance is larger, and denoising can reduce the changes of detection significantly at large noise variances.
Figure 8.
Examples of cervix detection
Figure 9.
Quantitative comparison of cervix detection performance
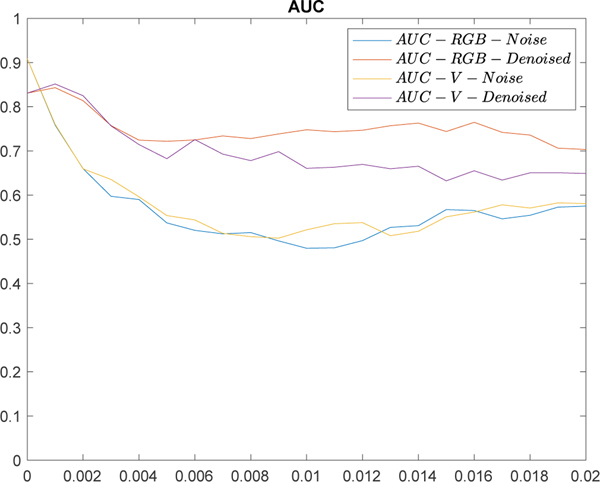
The effects on AVE classification are shown in Figure 10 in which y-axis is the AUC value and x-axis is the variance of noise added to the original images ranging from 0 to 0.02 with step 0.001 (noisy images: blue and yellow curves, denoised images: red and purple curves). The plots indicate both types of noise can reduce the AVE performance significantly and denoising can mitigate the classification degradation to a considerable extent. The AUC values at x = 0 in both blue and yellow curves were calcuated from the original images and they are higher than those at x = 0 for the denoised ones, indicating the blur introduced by denoising the original images can lower the AVE classification performance.
Figure 10.
Comparison of AVE classification performance
4. CONCLUSIONS AND FUTURE WORK
The morbidity and mortality rates of cervix cancer are high in LMIC, and VIA is often used in LMIC as a screening method. AVE, which uses computerized technology such as machine learning and image processing techniques to incorporate with low-cost imaging device, has been proposed as a promising way to improve VIA performance. One key issue and challenge of AVE is image quality control. There are multiple factors that can affect and degrade image quality. In this paper, we report our work on the analysis of the effects of one of the image quality degradation factors, image noise, on AVE performance, as well as the alleviation method we used to reduce it. Specifically, we presented an AVE pipeline that consists of a RetinaNet cervix detector and a ResNeSt cervix classifier, examined the impact of noise on both cervix detection and classification using two types of generated synthetic noisy images, and applied an blind image denoising deep learning network proposed for reducing both i.i.d. and complicated non-i.i.d. noise (VDNet) which was trained with real-world general-domain clean and noisy image pairs. The denoising was evaluated visually and quantitatively on both synthetic and real noisy images of cervix. Based on the comparison of AVE pipeline test performance on the original, noisy and denoised images, we find noise can degrade AVE classification performance considerably (although its impact on cervix detection is moderate) and denoising can be effective at mitigating performance degradation. In the future, we will explore other remedy approaches including improving the robustness of AVE models to image quality degradation and developing an image quality classifier to identify low quality images.
ACKNOWLEDGEMENT
This research was supported by the Intramural Research Program of the National Library of Medicine, a part of the National Institutes of Health (NIH). The authors are grateful to Dr. Mark Schiffman and his team at National Cancer Institute, NIH for image data and valuable advice. The authors also want to thank Lane Brooks and the team of Liger Medical LLC for providing some of their images for this analysis, as well as for insightful conversations.
REFERENCES
- 1.Hull R, Mbele M, Makhafola T, Hicks C, Wang SM, Reis RM, Mehrotra R, Mkhize-Kwitshana Z, Kibiki G, Bates DO, and Dlamini Z, “Cervical cancer in low and middle-income countries”, Oncology letters, 2020, 20(3), 2058–2074. 10.3892/ol.2020.11754 [DOI] [PMC free article] [PubMed] [Google Scholar]
- 2.Jeronimo J, Massad LS, Castle PE, Wacholder S, Schiffman M, “Interobserver agreement in the evaluation of digitized cervical images”, Obstet. Gynecol. 2007, 110, 833–840 [DOI] [PubMed] [Google Scholar]
- 3.Yeates KE, Sleeth J, Hopman W, Ginsburg O, Heus K, Andrews L, et al. “Evaluation of a smartphone-based training strategy among health care workers screening for cervical cancer in northern Tanzania: the Kilimanjaro method”, J Glob Oncol. 2016. May 4;2(6):356–364. [DOI] [PMC free article] [PubMed] [Google Scholar]
- 4.Matti R, Gupta V, D’Sa DK, Sebag C, Peterson CW, Levitz D, “ Introduction of mobile colposcopy as a primary screening tool for different socioeconomic populations in urban India”, Pan Asian J Obs Gyn 2019; 2(1):4–11 [Google Scholar]
- 5.Hu L, Bell D, Antani S, Xue Z, Yu K, Horning MP, et al. “An observational study of deep learning and automated evaluation of cervical images for cancer screening”, J Natl Cancer Inst 2019; 111(9): 923–932. [DOI] [PMC free article] [PubMed] [Google Scholar]
- 6.Xue Z, Novetsky AP, Einstein MH, et al. “A demonstration of automated visual evaluation of cervical images taken with a smartphone camera”, Int J Cancer. 2020; 10.1002/ijc.33029. [DOI] [PMC free article] [PubMed] [Google Scholar]
- 7.Guo P, Xue Z, Mtema Z, Yeates K, Ginsburg O, Demarco M, Long LR, Schiffman M, Antani S. “Ensemble deep learning for cervix image selection toward improving reliability in automated cervical precancer screening”, Diagnostics (Basel) 2020. Jul 3;10(7):451. [DOI] [PMC free article] [PubMed] [Google Scholar]
- 8.Xue Z, Guo P, Angara S, Pal A, Jeronimo J, Desai KT, Ajenifuja KO, Adepiti CA, Sanjose SD, Schiffman M, and Antani S, “Cleaning highly unbalanced multisource image dataset for quality control in cervical precancer screening”, The international conference on Recent Trends in Image Processing and Pattern Recognition (RTIP2R), 2021 [Google Scholar]
- 9.Guo P, Singh S, Xue Z, Long LR, Antani S, “Deep learning for assessing image focus for automated cervical cancer screening”, 2019. IEEE EMBS International Conference on Biomedical & Health Informatics (BHI) DOI: 10.1109/BHI.2019.8834495. [DOI] [Google Scholar]
- 10.Ganesan P, Xue Z, Singh S, Long LR, Ghoraani B, Antani S, “Performance evaluation of a generative adversarial network for deblurring mobile-phone cervical images”, Proc. IEEE Engineering in Medicine and Biology Conference (EMBC), Berlin, Germany, 23 – 27 July 2019. pp. 4487–4490. [DOI] [PubMed] [Google Scholar]
- 11.Barnhart KT, Izquierdo A, Pretorius ES, Shera DM, Shabbout M, Shaunik A, “Baseline dimensions of the human vagina”, Human Reproduction, 21(6), June 2006, pp. 1618–1622, 10.1093/humrep/del022 [DOI] [PubMed] [Google Scholar]
- 12.Herrero R, Schiffman M, Bratti C, Hildesheim A, Balmaceda I, Sherman ME, et al. Design and methods of a population-based natural history study of cervical neoplasia in a rural province of Costa Rica: The Guanacaste Project.Rev. Panam. Salud Publica 1997, 15, 362–375 [DOI] [PubMed] [Google Scholar]
- 13.The Atypical Squamous Cells of Undetermined Significance/Low-Grade Squamous Intraepithelial Lesions Triage Study (ALTS) Group, “Human papillomavirus testing for triage of women with cytologic evidence of low-grade squamous intraepithelial lesions: baseline data from a randomized trial”, J. Nat. Cancer Inst. 2000, 92, 397–402. [DOI] [PubMed] [Google Scholar]
- 14. http://www.ligermedical.com/ [Google Scholar]
- 15.Lin T, Goyal P, Girshick R, He K, Dollár P, “Focal loss for dense object detection”, 2017 IEEE International Conference on Computer Vision (ICCV), Venice, Italy, 2017, pp.2999–3007, doi: 10.1109/ICCV.2017.324 [DOI] [Google Scholar]
- 16.Herrero R, Wacholder S, Rodríguez AC, Solomon D, González P, Kreimer AR, Porras C, Schussler J, Jiménez S, Sherman ME, et al. “Prevention of persistent Human Papillomavirus Infection by an HPV16/18 vaccine: A community-based randomized clinical trial in Guanacaste, Costa Rica”, Cancer Discov. 2011, 1, 408–419. [DOI] [PMC free article] [PubMed] [Google Scholar]
- 17.Zhang H, Wu C, Zhang Z, Zhu Y, Zhang Z, Lin H, Sun Y, He T, Muller J, Manmatha R, Li M, Smola A, “ResNeSt: split-attention networks”, https://arxiv.org/abs/2004.08955 [Google Scholar]
- 18.Tian C, Xu Y, Fei L, Yan K, “Deep learning for image denoising: a survey”, https://arxiv.org/abs/1810.05052 [Google Scholar]
- 19.Yue Z, Yong H, Zhao Q, Zhang L, Meng DK “Variational denoising network: toward blind noise modeling and removal”, NeuIPS 2019. [Google Scholar]
- 20.Zhang K, Zuo W, Chen Y, Meng D, and Zhang L, “Beyond a Gaussian denoiser: Residual learning of deep CNN for image denoising”, IEEE Transactions on Image Processing, 26(7):3142–3155, 2017. [DOI] [PubMed] [Google Scholar]
- 21. https://www.eecs.yorku.ca/~kamel/sidd/dataset.php .
- 22.Zhou W, Bovik AC, Sheikh HR, and Simoncelli EP, “Image quality assessment: from error visibility to structural similarity”, IEEE Transactions on Image Processing. Vol. 13, Issue 4, April 2004, pp. 600–612 [DOI] [PubMed] [Google Scholar]
- 23.Venkatanath N, Praneeth D, Chandrasekhar BM, Channappayya SS, and Medasani SS, “Blind image quality evaluation using perception based features”, In Proceedings of the 21st National Conference on Communications (NCC), Piscataway, NJ: IEEE, 2015. [Google Scholar]
- 24.Mittal A, Soundararajan R, and Bovik AC, “Making a completely blind image quality analyzer”, IEEE Signal Processing Letters, 22(3), March 2013, pp. 209–212. [Google Scholar]


