Abstract
Background
Subclinical atrial fibrillation (SCAF) is often asymptomatic nonetheless harmful. In patients with cardiac implantable electronic devices, we evaluated the combined performance of homocysteine and uric acid (UA) biomarkers to discriminate high‐risk patients for SCAF.
Methods and Results
We enrolled 1224 consecutive patients for evaluation of SCAF in patients with cardiac implantable electronic devices in Dalian, China, between January 2013 and December 2019. Clinical data and blood samples were obtained from patients selected according to the absence or presence of atrial high‐rate episodes >6 minutes. Blood samples were obtained, and homocysteine and UA biomarkers were tested in all patients to distinguish their prognostic performance for SCAF. Homocysteine and UA biomarkers were significantly different in SCAF versus no SCAF. On multivariable Cox regression analysis with potential confounders, elevated homocysteine and UA biomarkers were significantly associated with an increased risk of SCAF. A rise of 1 SD in homocysteine (5.7 μmol/L) was associated with an increased risk of SCAF in men and women regardless of their UA levels. Similarly, a 1‐SD increase in UA (91 μmol/L) was associated with an increased risk of SCAF among the patients with high levels of homocysteine in men (hazard ratio, 1.81; 95% CI, 1.43–2.30) and women (hazard ratio, 2.11; 95% CI, 1.69–2.62). The addition of homocysteine and UA to the atrial fibrillation risk factors recommended by the 2020 European Society of Cardiology Guidelines significantly improved risk discrimination for SCAF.
Conclusions
Homocysteine and UA biomarkers were strongly associated with SCAF. The prediction performance of the European Society of Cardiology model for SCAF was increased by the addition of the selected biomarkers.
Registration
URL: https://www.chictr.org.cn; Unique identifier: Chi‐CTR200003837.
Keywords: continuous monitoring, homocysteine, pacemaker, subclinical atrial fibrillation, uric acid
Subject Categories: Atrial Fibrillation, Biomarkers, Clinical Studies, Risk Factors
Nonstandard Abbreviations and Acronyms
- CIED
cardiac implantable electronic device
- ESC
European Society of Cardiology
- IDI
integrated discrimination improvement
- SCAF
subclinical atrial fibrillation
- UA
uric acid
Clinical Perspective
What Is New?
Elevated plasma homocysteine and uric acid (UA) levels are strongly associated with an increased incidence of subclinical atrial fibrillation (SCAF) in patients with cardiac implantable electronic devices.
A significant interaction effect of homocysteine and UA for increasing the incidence of SCAF.
Application of both homocysteine and UA biomarkers combined with 2020 European Society of Cardiology risk factors improves the prediction of SCAF more accurately in the clinical practice.
What Are the Clinical Implications?
An increase in homocysteine and UA values was markedly associated with an increased risk for SCAF in both men and women, suggesting that a substantial SCAF risk was present among those patients classified at the high homocysteine (>14 µmol/L in men and >12 µmol/L in women) and high UA (>420 µmol/L in men and >320 µmol/L in women) levels.
Therefore, it may be reasonable to interpret in a way that cardiac implantable electronic device–implanted patients with increased homocysteine and UA as candidates for more intensive rhythm monitoring.
Nonvalvular atrial fibrillation (AF) is the most common cardiac arrhythmia in clinical practice, and it is considered to be one of the most important causes of stroke. AF manifests itself with or without clinical manifestations. Subclinical atrial fibrillation (SCAF) refers to individuals without symptoms attributable to AF, in whom AF episodes are detected by insertable cardiac monitor or wearable monitor and confirmed by visually reviewed intracardiac electrograms or ECG‐recorded rhythm. 1 SCAF accounts for at least 1 in 3 patients with AF, 2 and current evidence suggests that the presence of device‐detected SCAF among patients with no history of AF increases the risk of thromboembolism, 3 , 4 heart failure, 5 and cardiovascular mortality. 4 Though cardiac implantable electronic devices (CIEDs), including dual‐chamber permanent pacemakers, implantable cardioverter defibrillators, and cardiac resynchronization therapy devices improved management of multiple types of arrhythmias, it is important to explore early indicators of SCAF in patients with CIEDs.
Several pathophysiological mechanisms have been implicated to contribute to AF, including atrial fibrosis, atrial dilatation, inflammation, and oxidative stress. Plasma biomarkers of AF‐related processes may improve risk prediction in addition to clinical stratification models. Cardiac biomarkers routinely measured in clinical practice, such as homocysteine and uric acid (UA) plasma biomarkers have been found elevated in patients with AF. 6 , 7
Homocysteine, a nonproteinogenic sulfur‐containing amino acid, involves in the metabolism of cysteine and methionine. An increased level of homocysteine is widely considered as a long‐standing biomarker associated with a range of disorders related to oxidative stresses, 8 such as hypertension, heart failure, and stroke. 9 , 10 Also, UA, an end product in the degradation of the purine nucleotides adenine and guanine, is speculated to participate in the pathogenesis of AF. 11 , 12 , 13 Importantly, experimental and clinical data indicate that UA is implicated in the pathophysiology of AF via activation of inflammation, oxidative stress, and fibrosis‐induced atrial remodeling.
Bearing in mind that SCAF compared with sustained AF carries a similar risk for transient ischemic attack/stroke and non–central nervous system embolism, early detection and management are critical to prevent AF‐related complications. Consensus statements are evidence based and derived primarily from multiple sources. In contrast with the current status of evidence, European Society of Cardiology (ESC) recommended/indicated risk factors of AF, we believe these risk factors (the risk factors defined in the 2020 ESC guideline for AF, provided in Table S1) are worth establishing clinical stratification models. Therefore, we evaluated the performance of the risk factors alone and its combined prognostic performance with homocysteine and UA biomarkers for identifying patients at high risk for SCAF. The present study aimed to evaluate the combined performance of homocysteine and UA biomarkers to discriminate the high‐risk population for SCAF in patients with CIEDs. We hypothesized that homocysteine and UA biomarkers are elevated in patients with SCAF as validated by continuous rhythm monitoring. We further hypothesized that homocysteine and UA biomarkers may provide additional discriminative power when compared with the ESC model in identifying patients at high risk for SCAF.
METHODS
Study Design
The data that support the findings of this study are available from the corresponding author upon reasonable request. A prospective cohort study was conducted in patients who underwent a CIED procedure between January 2013 and December 2019. The prospective cohort study was established in January 2013 at First Affiliated Hospital of Dalian Medical University, Dalian, P.R. China to assess the risk factors for AF among the CIED‐implanted population. Briefly, this is an ancillary study conducted to explore the relationship between plasma homocysteine and UA concentration and SCAF occurrence. Our study protocol was registered on the Chinese Clinical Trial Registry on September 21, 2020 (https://www.chictr.org.cn, registration number: Chi‐CTR2000038377).
Study Population
This study recruited 2783 patients with newly implanted CIEDs. Patients who received regular physical examinations for >6 months with complete electrogram recordings were eligible for this study. A total of 2550 patients were screened after satisfying the requirements of a minimum age of 18 years and complete clinical data. To monitor SCAF, implanted CIEDs without algorithms for the detection of atrial tachycardia/AF episodes were excluded (n=279). Patients with rheumatic heart disease were excluded because they were expected to have a higher risk of AF (n=47). Also, patients with a prior diagnosis of AF, atrial flutter, and atrial tachycardia evidenced by ECG or Holter monitoring were excluded (n=981). Additionally, we excluded 19 patients who presented with early SCAF incidence during the first month of CIED implantation. Finally, a total of 1224 patients were included in the study (Figure 1). The research was conducted in accordance with the Declaration of Helsinki guidelines and was approved by the institutional review board of the First Affiliated Hospital of Dalian Medical University. All participants provided informed consent, and all procedures listed here were carried out in compliance with the approved guidelines.
Figure 1. Flow chart of patients included in the analysis.
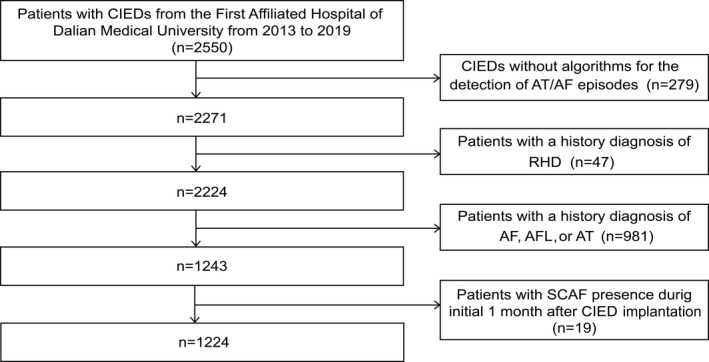
Median duration of atrial arrhythmia monitoring was 643 (319–1277) days. AF indicates atrial fibrillation; AFL, atrial flutter; AT, atrial tachycardia. CIED, cardiac implantable electronic device; RHD, rheumatic heart disease; and SCAF, subclinical atrial fibrillation.
Clinical Measurements and Definition of Explanatory Variables
At baseline, basal data and various clinical details related to pacing indication, type of CIEDs, clinical history, smoking/drinking status, blood pressure, body mass index, medication use, 12‐lead ECG, 24‐hour Holter, transthoracic echocardiography, coronary computed tomography angiography, and components of the CHA2DS2‐VASc score were recorded following a detailed assessment. The estimated glomerular filtration rate was calculated using the creatinine‐based Chronic Kidney Disease Epidemiology Collaboration equation. 14 Diabetes has been defined as fasting 7.0 mmol/L plasma glucose or current use of antidiabetic treatments. Hypertension has been defined as systolic blood pressure ≥140 mm Hg and/or diastolic blood pressure ≥90 mm Hg or active use of antihypertensive drugs. Smoking and drinking status were self‐reported and classified as never smokers/drinkers, past smokers/drinkers, or current smokers/drinkers. Participants were deemed current smokers if reported they are currently smoking or registered smoking at least 100 cigarettes during their lifetime. 15 , 16
Biological Sampling and Biochemical Measurements
A sample of fasting blood from the brachial vein was collected, and it was biochemically examined for lipid panel profiles and plasma concentration of homocysteine and UA levels. The serum UA concentrations were examined with an autoanalyzer using the uricase‐peroxidase process (BECKMAN COULTER AU680 Chemistry Analyzer). Homocysteine levels were determined by using an enzymatic cycling method (Hitechi7600 series automatic analyzer). Blood glucose levels were measured using the standard protocols. The laboratory personnel were not aware of the subjects’ health status, and all samples were treated identically throughout the processing and analysis.
Device Characteristics, Implantation Procedure, and Interpretation of SCAF Episodes
All patients underwent implantation of a dual‐chamber permanent pacemaker, implantable cardioverter defibrillator, or cardiac resynchronization therapy devices, which were programmed to a DDI(R) or a DDD(R) pacing mode at the discretion of the implanting physician. The atrial tachycardia detection feature was programmed “on,” and the AF suppression algorithm was programmed “off” in all patients. The device was programmed so that atrial tachycardia was detected when the heart rate reached 190 beats per minute, and electrogram storage was activated. SCAF was defined as the presence of at least 1 episode of atrial tachyarrhythmia episodes lasting >6 minutes. The stored atrial and ventricular electrograms were reviewed and adjudicated by 2 experienced electrophysiologists, who were blinded for other study data. All inappropriately detected SCAF episodes were excluded. Finally, SCAF was confirmed as AF, atrial flutter, or atrial tachycardia episodes.
Follow‐Up and Outcome Assessment
Follow‐up visits, including physical examination, assessment of potential AF symptoms, 12‐lead ECG, and routine device checkups were performed at 1, 3, and 6 months, and then every 6 months regularly since CIED implantation. The primary outcome of this study was an occurrence of an SCAF event. All SCAF events were confirmed using intracardiac electrograms. Patients with <6 minutes of atrial tachyarrhythmia episodes were considered “no SCAF.” During follow‐up, SCAF episodes occurring within 1 month of device implantation were excluded because of a concern that the arrhythmia could be related to atrial lead implantation. All patients were followed up until the occurrence of SCAF or December 31, 2019, whichever came first.
Statistical Analysis
The statistical analyses were performed using SPSS software (version 22, IBM) and R software (version 3.3.0). Because of sex‐specific differences in metabolism of homocysteine and UA, 17 , 18 all analyses were stratified by gender. Categorical data were presented as count and percentage and checked for differences using the chi‐square test. For continuous data, normality was assessed by both the D’Agostino and Pearson’s test and the Shapiro‐Wilk test. The Mann‐Whitney U test was used to analyze the nonnormally distributed continuous variables, and data were expressed as the median and interquartile range.
We first calculated the hazard ratios (HRs) for SCAF associated with homocysteine and UA to establish the association between these biomarkers and SCAF. The pattern of quantitatively assessed homocysteine or UA linking SCAF occurrence was analyzed by restricted cubic splines that display the HR on the y axis versus the metric used to quantify homocysteine or UA level on the x axis. To balance best fit and overfitting in the splines for SCAF, the number of knots, between 3 and 7, was chosen as the lowest value for the Akaike information criterion. Finally, we chose 4 knots located at the 5th, 35th, 65th, and 95th percentiles of homocysteine/UA. A HR of 1 indicates reference value (cut point), HR >1 represents a higher risk of SCAF, and HR <1 indicates a lower risk of SCAF.
We further calculated HR and corresponding 95% CIs for the occurrence of SCAF associated with 1 SD increase in homocysteine and UA. To investigate the potential interaction effect between homocysteine and UA on incident SCAF risk, the likelihood ratio tests in subgroups were performed using the cut point of homocysteine/UA to classify the population into 2 groups. On subgroup analyses, 2 distinct Cox models were employed independently. The first Cox proportional hazard model was employed to investigate the association of homocysteine with an increase in 1 SD in UA, modeled as a continuous variable, for the occurrence of SCAF. Whereas the second Cox model was established to explore the relationship of UA with an increase in 1 SD in homocysteine, modeled as a continuous variable, for the occurrence of SCAF. To account for potential confounding effects, we adjusted these risk factors for incident AF defined in the 2020 ESC guideline, including age, smoking, drinking, body mass index, systolic blood pressure, diastolic blood pressure, estimated glomerular filtration rate, coronary heart disease, diabetes, congestive heart failure, chronic obstructive pulmonary disease, and left ventricular ejection fraction. Left atrial dimension was also included as an indicator of atrial fibrotic remodeling. We used 3 different models: a crude model, an age‐adjusted model, and a fully adjusted model (adjusted for all the aforementioned variables). The log‐rank test for trend and Kaplan‐Meier methods were used to compare the freedom (from SCAF) distributions and study the differences in SCAF freedom as stratified by homocysteine and UA status, respectively. The proportional hazards assumption was tested and satisfied in all cases using Schoenfeld residuals.
To evaluate the discriminatory power of SCAF incidence at 5 years among ESC model, ESC model+UA, ESC model+homocysteine, and ESC model+UA+homocysteine, we executed time‐dependent receiver operating characteristics, Harrell’s concordance statistics, and integrated discrimination improvement (IDI). 19
To evaluate the performance of the final combined model (ESC model+UA+ homocysteine), we used the calibration plot. Also, we determined the bootstrap method (with 1000 bootstrap samples) to decrease the overfit bias and variance errors for the observed calibration of SCAF against the predicted probability of SCAF to improve consistency and reduce bias. In addition, we performed a decision curve analysis to evaluate the clinical benefit of our final model. Statistical tests were 2‐sided, and P<0.05 was considered statistically significant.
RESULTS
Baseline Characteristics
A total of 1224 patients were included in the study, 225 patients with detected SCAF and 999 patients without SCAF. The median age was 69 years with a median time of rhythm monitoring of 642 days. Sixty‐nine percent of the patients were monitored for at least 1 year, with a maximum monitoring time of 2684 days. The proportion of women (50.6%) and men (49.4%) was similar. The clinical and demographic characteristics of the patients are shown in Table. Indications for permanent pacemaker implantation in the no SCAF group and the SCAF group were sinus‐node disease, (40% versus 34% in men and 55% versus 57% in women), atrioventricular node disease (45% versus 41% in men and 34% versus 37% in women), both sinus and atrioventricular node disease (5% versus 7% in men and 2% versus 1% in women), and other indication (11% versus 19% in men and 9% versus 5% in women). Compared with patients who were free of SCAF, patients with SCAF received more statin and angiotensin‐converting enzyme inhibitor/angiotensin receptor blocker medication in both men and women (all P<0.05). Patients who experience SCAF had larger left atrial diameter compared with the no SCAF group. In both men and women, there were no significant differences in terms of age, body mass index, hypertension, diabetes, coronary artery disease, chronic heart failure and previous stroke/transient ischemic attack, estimated glomerular filtration rate, CHA2DS2‐VASc score between the SCAF and no SCAF groups.
Table 1.
Baseline Characteristics of Entire Patient Group
| Variable | Male | Female | ||||||
|---|---|---|---|---|---|---|---|---|
| Total (n=605) | Non‐SCAF (n=482) | SCAF (n=123) | P value | Total (n=619) | Non‐SCAF (n=517) | SCAF (n=102) | P value | |
| Age, y | 70 (62–79) | 70 (62–78) | 71 (63–79) | 0.749 | 69 (62–77) | 69 (61–77) | 70 (63–76) | 0.704 |
| History | ||||||||
| Hypertension | 341 (56) | 269 (56) | 72 (59) | 0.586 | 370 (60) | 309 (60) | 61 (60) | 0.995 |
| Systolic blood pressure, mm Hg | 140 (120–152) | 140 (120–150) | 141 (120–159) | 0.114 | 140 (126–154) | 140 (125–153) | 140 (126–156) | 0.592 |
| Diastolic blood pressure, mm Hg | 76 (68–81) | 76 (67–80) | 78 (70–85) | 0.194 | 73 (64–80) | 73 (64–80) | 72 (61–80) | 0.517 |
| Congestive heart failure | 123 (20) | 91 (19) | 32 (26) | 0.079 | 112 (18) | 95 (18) | 17 (17) | 0.682 |
| Diabetes | 134 (22) | 113 (23) | 21 (17) | 0.129 | 124 (20) | 105 (20) | 19 (19) | 0.698 |
| Stroke/TIA | 52 (9) | 45 (9) | 7 (6) | 0.198 | 47 (8) | 36 (7) | 11 (11) | 0.183 |
| Coronary artery disease | 175 (29) | 140 (29) | 35 (28) | 0.897 | 109 (18) | 89 (17) | 20 (20) | 0.562 |
| COPD | 11 (2) | 10 (2) | 1 (1) | 0.35 | 9 (1) | 9 (2) | 0 (0) | 0.179 |
| eGFR, mL/min·per 1.73 m2 | 84 (72–94) | 85 (72–94) | 83 (71–93) | 0.374 | 87 (74–95) | 87 (74–95) | 85 (71–94) | 0.217 |
| Excessive alcohol drinking | 116 (19) | 95 (20) | 21 (17) | 0.507 | 2 (0) | 2 (0) | 0 (0) | 0.529 |
| Current smoking | 179 (30) | 138 (29) | 41 (33) | 0.308 | 5 (1) | 5 (1) | 0 (0) | 0.319 |
| CHA2DS2‐VASc score | 2 (1–4) | 2 (1–3) | 2.4±1.5 | 2 (1–4) | 3 (2–4) | 3 (2–4) | 3 (2–4) | 0.839 |
| Pacing indication | ||||||||
| Sinus‐node disease | 234 (39) | 192 (40) | 42 (34) | 0.248 | 340 (55) | 282 (55) | 58 (57) | 0.667 |
| Atrioventricular node disease | 265 (44) | 215 (45) | 50 (41) | 0.430 | 214 (35) | 176 (34) | 38 (37) | 0.533 |
| Both sinus and atrioventricular node disease | 31 (5) | 23 (5) | 8 (7) | 0.437 | 13 (2) | 12 (2) | 1 (1) | 0.388 |
| Others | 75 (12) | 52 (11) | 23 (19) | 0.017 | 52 (8) | 47 (9) | 5 (5) | 0.163 |
| Device implanted | ||||||||
| PPM | 528 (87) | 428 (89) | 100 (81) | 0.026 | 567 (92) | 472 (91) | 95 (93) | 0.540 |
| ICD | 43 (7) | 33 (7) | 10 (8) | 0.621 | 17 (3) | 16 (3) | 1 (1) | 0.232 |
| CRT‐P | 10 (2) | 7 (1) | 3 (2) | 0.444 | 17 (3) | 15 (3) | 2 (2) | 0.664 |
| CRT‐D | 24 (4) | 14 (3) | 10 (8) | 0.008 | 18 (3) | 14 (3) | 4 (4) | 0.505 |
| Medications | ||||||||
| Aspirin | 269 (44) | 202 (42) | 67 (54) | 0.012 | 217 (35) | 173 (33) | 44 (43) | 0.061 |
| ACE inhibitor/ARB | 268 (44) | 210 (44) | 58 (47) | 0.475 | 253 (41) | 200 (39) | 53 (52) | 0.013 |
| CCB | 305 (50) | 238 (49) | 67 (54) | 0.313 | 320 (52) | 258 (50) | 62 (61) | 0.044 |
| Statin | 359 (59) | 273 (57) | 86 (70) | 0.007 | 338 (55) | 273 (53) | 65 (64) | 0.043 |
| Echocardiogram parameters | ||||||||
| LAD, mm | 38 (35–41) | 38 (35–40) | 38 (36–42) | 0.010 | 37 (35–39) | 37 (34–39) | 37 (35–40) | 0.032 |
| LVEF, % | 58 (57–59) | 58 (57–59) | 58 (54–59) | 0.001 | 58 (58–59) | 58 (58–59) | 58 (58–59) | 0.466 |
| Biomarkers | ||||||||
| Homocysteine, μmol/L | 14.8 (12.7–18.1) | 14.4 (12.4–17.5) | 16.2 (13.9–19.4) | <0.001 | 12.2 (10.1–14.3) | 11.8 (9.9–13.9) | 14.2 (11.7–17.1) | <0.001 |
| UA, μmol/L | 366 (310–425) | 361 (299–417) | 396 (337–448) | <0.001 | 309 (258–366) | 303 (252–352) | 364 (296–436) | <0.001 |
Values are reported as median values (interquartile range) or n (%). ACE indicates angiotensin‐converting enzyme; ARB, angiotensin receptor blocker; CCB, calcium channel blocker; COPD, chronic obstructive pulmonary disease; CRT‐D/P, cardiac resynchronization therapy with/without defibrillation therapy; eGFR, estimated glomerular filtration rate; ICD, implantable defibrillator; LAD, left atrial diameter; LVEF, left ventricular ejection fraction; PPM, permanent pacemaker; SCAF, subclinical atrial fibrillation; TIA, transient ischemic attack; and UA, uric acid.
The Association of Homocysteine and UA
As shown in Figure 2, plasma homocysteine and UA levels were significantly elevated in SCAF patients in comparison with those without SCAF (all P<0.001). No significant difference was observed for the other clinical biomarkers provided in Table S2. Regardless of the SCAF status, men had higher homocysteine and UA levels compared with women (Figure 2A and 2B). We also examined the association between plasma homocysteine and UA levels (Figure 2C and 2D). Given the influence of gender on the metabolism of homocysteine and UA, the cutoff points for homocysteine and UA were analyzed separately for women and men. For men, a positive association was significantly found between homocysteineand UA levels (r=0.118; P=0.001). Similar findings were found for women (r=0.254; P<0.001).
Figure 2. Serum homocysteine (A) and uric acid (B) in patients with or without SCAF and their correlation in males (C) and females (D).
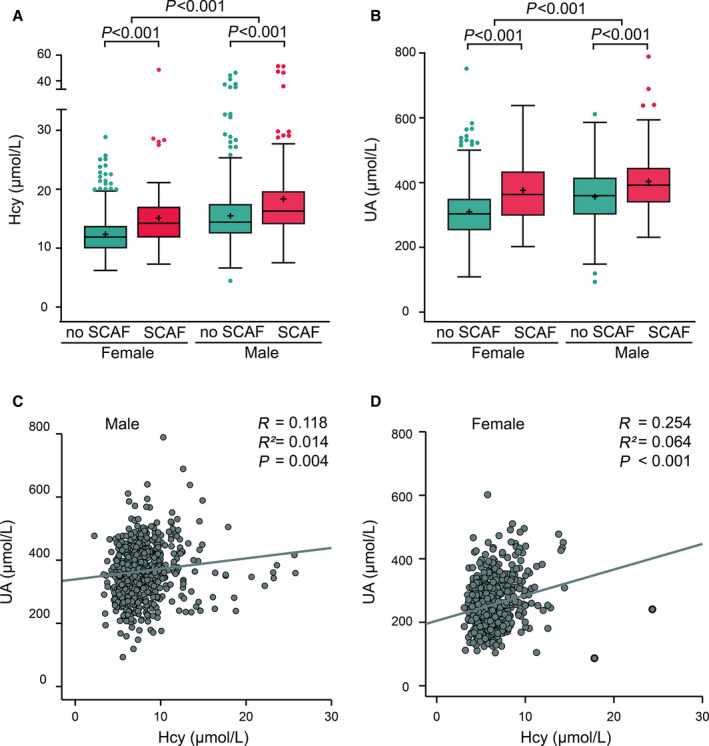
Hcy indicates homocysteine; SCAF, subclinical atrial fibrillation; and UA, uric acid.
Quantitative Approach to Markers and SCAF
After we observed that the proportional hazards assumption was satisfied, we further explored the association between quantitative measures of plasma homocysteine and UA levels and SCAF using restricted cubic spline analysis to stratify participants into low‐ and high‐risk groups based on the new reference values of homocysteine and UA (Figure 3). The HR value served as the threshold for further analysis. 20 , 21 The cut point for UA was 420 μmol/L in men, and 320 μmol/L in women, respectively, whereas the cutoff point for homocysteine was 14 µmol/L in men and 12 µmol/L in women, respectively.
Figure 3. Multivariable adjusted hazard ratios for SCAF incidence according to levels of homocysteine and uric acid on a continuous scale.
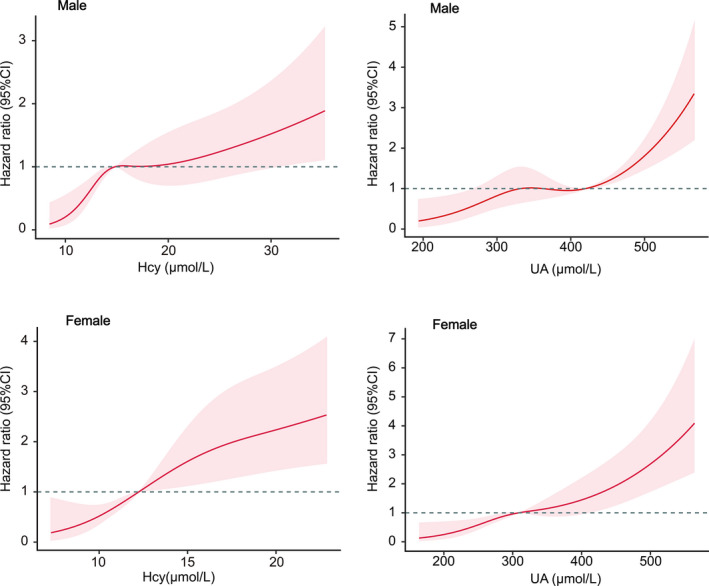
Red lines are multivariable‐adjusted hazard ratios, with pink areas showing 95% CIs derived from restricted cubic spline regressions with four knots located at the 5th, 35th, 65th, and 95th percentiles. Reference lines for no association are indicated by the dashed gray lines at a hazard ratio of 1.0. Analyses were adjusted for age, smoking, drinking, body mass index, systolic blood pressure, diastolic blood pressure, estimating glomerular filtration rate, coronary heart disease, diabetes, congestive heart failure, chronic obstructive pulmonary disease, left atrial diameter, and left ventricular ejection fraction. Hcy indicates homocysteine; SCAF, subclinical atrial fibrillation; and UA, uric acid.
Relationship Between Homocysteine, UA, and SCAF
The association between plasma concentrations of homocysteine and UA levels and the risk of SCAF is presented in Table S3. In the fully adjusted model, each 1‐SD increase in UA was associated with a 69% increase in the risk for SCAF in men (HR, 1.69; 95% CI, 1.37–2.08; P<0.001). Interestingly, our result shows that women demonstrated a higher risk than men (HR, 1.93; 95% CI, 1.57–2.36; P<0.001). Each 1‐SD increase in homocysteine was associated with a 39% increase in SCAF among women (HR, 1.39; 95% CI, 1.25–1.54; P<0.001). Also, a 27% increase was observed with a 1‐SD increase in homocysteine in men (HR, 1.27; 95% CI, 1.11–1.44; P<0.001). A similar result was observed when plasma homocysteine and UA levels were included in regression models as categorical variables. There was a positive association between the high level of homocysteine/UA and the presence of SCAF after adjusting for potential confounders (Table S3). As shown in Figure 4, there were significant differences in the incidence of SCAF between the cutoff value of homocysteine and UA mentioned above, suggesting that the cutoff points can successfully discriminate between the lower‐risk group and the higher‐risk group.
Figure 4. Kaplan‐Meier curves showing the incidence of SCAF for different levels of homocysteine and UA.
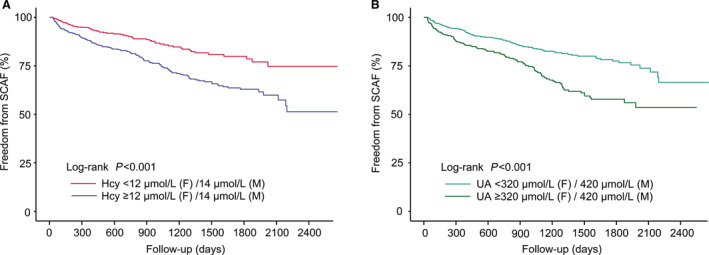
A, Kaplan‐Meier survival curves for homocysteine, the cutoff points for homocysteine 14 µmol/L in men, and 12 µmol/L in women, respectively. B, Kaplan‐Meier survival curves for UA; the cut points for UA were 420 μmol/L in men and 320 μmol/L in women, respectively. Hcy indicates homocysteine; SCAF, subclinical atrial fibrillation; and UA, uric acid.
The Interaction Effect Between Homocysteine and UA in SCAF
The forest plot illustrates the odds ratios associated with an increase in 1 SD (5.7 μmol/L) in homocysteine among participants grouped by UA status and the OR associated with an increase in 1 SD (91 μmol/L) in UA among participants grouped by homocysteine status (Figure 5). With an increase in 1 SD of homocysteine, the fully adjusted Cox regression model confirmed that patients with high‐level UA had a higher risk for SCAF compared with the low‐level group in both men and women (both P‐interaction <0.05). When we treated these 2 biomarkers independently, our result showed a significant interaction between homocysteine and dichotomous UA classes for SCAF in women but not in men (P‐interaction=0.048; P‐interaction=0.179, respectively).
Figure 5. Hazard ratios with 95% CIs for 1 SD increase in Homocysteine/UA of SCAF.
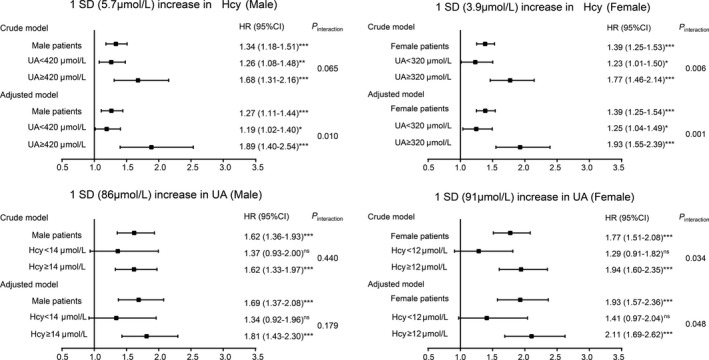
Hcy indicates homocysteine; HR, hazard ratio; SCAF, subclinical atrial fibrillation; and UA, uric acid. *P<0.05, **P<0.01, ***P<0.001, ns: not significant.
Rates of SCAF according to different levels of homocysteine and UA are shown in Figure 6. Based on the low‐ and high‐risk subset defined by the spline curve of homocysteine/UA, we divided patients into 4 groups, which represented different combinations of the 2 biomarkers: group 1: patients with both low‐level homocysteineand UA; group 2: patients with high‐level UA and low‐level homocysteine; group 3: patients with high‐level homocysteineand low‐level of UA; group 4: patients with high levels of both homocysteineand UA. Patients with high levels of both homocysteineand UA had an increased incidence of SCAF (log‐rank test, P<0.001). After the full adjustment, the HRs for the patients in groups 2, 3 and 4 were 1.57 (95% CI, 0.96–2.56), 1.72 (95% CI, 1.16–2.55), and 3.50 (95% CI, 2.39–5.13), respectively. Schoenfeld residual tests revealed that there was no linear correlation between Schoenfeld residuals and time (Figure S1), indicating the proportional hazard assumption was satisfied.
Figure 6. Kaplan‐Meier curve showing the incidence of SCAF.
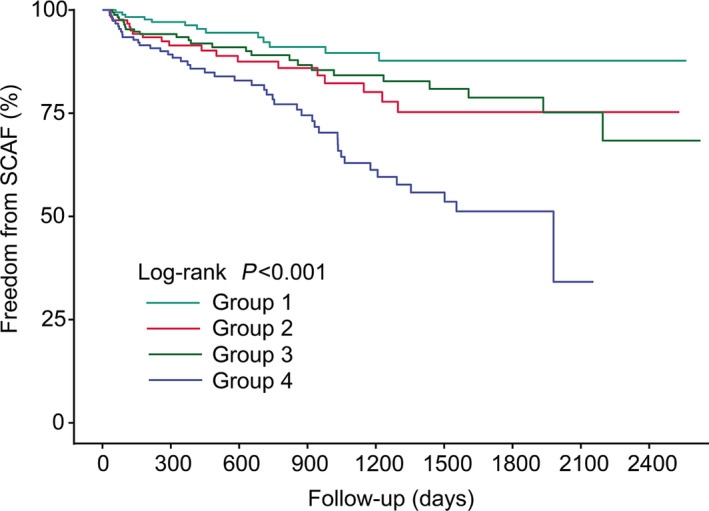
All patients were divided into 4 categories. From top to bottom, the lines represent the following: group 1: patients with both low‐level homocysteine and UA (turquoise); group 2: patients with high‐level UA and low‐level homocysteine (red); group 3: patients with high‐level homocysteine and low‐level of UA (green); group 4: patients with high levels of both Hcy and UA (blue). Hcy indicates homocysteine; SCAF, subclinical atrial fibrillation; and UA, uric acid.
The Additive Effect of Homocysteine and UA Levels on the ESC Model
We performed receiver‐operating characteristic analysis to determine the diagnostic utility of the biomarkers (homocysteine and UA) and ESC model to identify patients with SCAF (Figure 7A). The area under the curve was 0.607 (95% CI, 0.579–0.634) for the ESC model. We tested the models to improve the identification of patients from the SCAF group by combining both homocysteine and UA biomarkers to the ESC model. The combination of ESC model, homocysteine and UA (final model) reached the highest AUC (0.717; 95% CI, 0.691–0.742) followed by the models of risk factors and UA (0.688; 95% CI, 0.662–0.714) and risk factors and homocysteine (0.688; 95% CI, 0.662–0.714). The AUC results for the biomarkers and ESC risk factors are shown in Figure 7B.
Figure 7. Model‐comparison results of predicting the 5‐year incidence of SCAF.
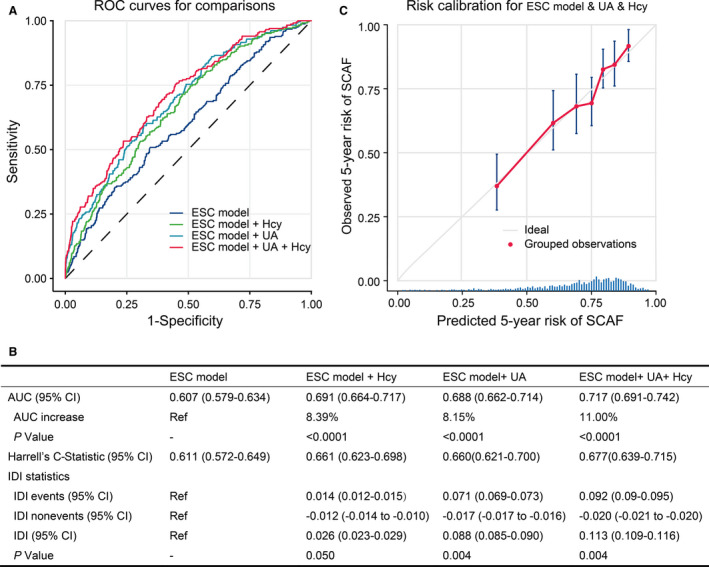
A, Receiver operating characteristics (ROC) curves of freedom from SCAF at 5 years for the different risk prediction models. B, Comparison of the area under the curve (AUC), Harrel’s C‐statistic, the integrated discrimination improvement (IDI) statistics, and 95% CIs in the different risk prediction models. C, Validation of the final model (ESC model+UA+homocysteine) showing observed incidences of SCAF within 5 years. The diagonal gray line represents a situation of perfect prediction when the observed incidences would be identical to the predicted baseline risks. Points are drawn to represent the averages in 7 discretized bins, and error bars are 95% CIs for the proportion of events in each group. The rug under the plot illustrates the distribution of predictions. ESC indicates European Society of Cardiology; Hcy, homocysteine; SCAF, subclinical atrial fibrillation; and UA, uric acid.
Though the combination in the ESC model and homocysteine increase the AUC by 8.39%, their combination did not result in significant increment in IDI (2.6%; P=0.050). Adding UA to the ESC model, improved SCAF detection models by the score, with an IDI of 8.8% (P<0.001) (Figure 7B). Moreover, the ESC model combined with homocysteine and UA biomarkers yielded an increase of 11.3% in IDI (P<0.001). The aforementioned data suggested that plasma homocysteine and UA increased the discrimination ability of the clinical model, indicating the addition of the plasma markers not only improves the prediction of the events but also reduces the potential for false‐positive rates.
The calibration plot in Figure 7C shows an adequate calibration of the predicted probabilities against the observed proportions of SCAF (Figure 7C). In addition, the decision curve analyses based on the ESC model and final model are shown in Figure 8. The analysis revealed that the combined final model had a higher net benefit than at a threshold probability of 0.025 to 0.25. Hence, it is compelling to choose the combined final model in clinical utility.
Figure 8. Decision curve analyses (DCA) of the ESC model and final model for 5‐year SCAF incidence.
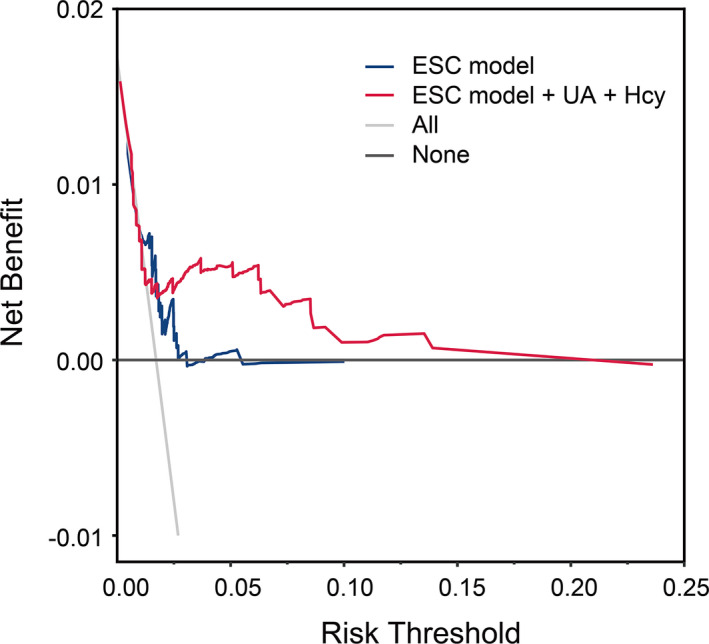
The x axis indicates the threshold incidence for SCAF at 5 years, and the y axis indicates the net benefit. The horizontal dark gray line: to assume no patients will experience the event; the light gray line: to assume all patients will experience the event. The ESC final model had enhanced net benefit compared with the ESC model at risk threshold >2.5%. ESC indicates European Society of Cardiology; Hcy, homocysteine; SCAF, subclinical atrial fibrillation; and UA, uric acid.
DISCUSSION
In this study, we investigated whether SCAF is associated with homocysteine and UA biomarkers in patients with continuous rhythm monitoring. We found that elevated homocysteine and UA were significantly associated with SCAF and added to the discriminatory performance of using the clinical risk factors (ESC model) to identify patients with increased incidence of SCAF.
We established the regulation of homocysteine and UA biomarkers in high‐risk patients of SCAF based on the clinical history and electrogram recordings. In this study, we found a positive and significant correlation between the homocysteine and UA biomarkers in both men and women categories, consistent with previous findings from a large cross‐sectional study. 22 Though prior studies using implanted cardiac devices suggest that up to 85% of AF is not clinically recognized, 3 , 23 follow‐up studies consistently reported SCAF incidence >20% in patients with CIEDs. 3 , 4 , 23 However, the result of the current study found a low SCAF incidence rate compared with the previous studies. This discrepancy could be attributed to the following reasons: First, our study included a younger population (mean age, 69.1±11.8 years) with fewer comorbid diseases. Second, all patients were assessed at baseline on the basis of self‐reported history, 12‐lead ECG, and 24‐hour Holter to exclude potential unreported AF. Third, a considerable proportion of the participants were receiving statins (56.9%), angiotensin‐converting enzyme inhibitors/angiotensin receptor blockers (42.6%), which might mitigate the potential risk for AF.
We established the estimated risk of SCAF in the subgroup of patients with low and high levels of homocysteine and UA. We observed differences not only in the biomarker regulation between the SCAF and no SCAF groups, but also the combination of the high levels of homocysteine and UA amplifies the risk of SCAF. The prognostic relevance of homocysteine‐UA has not been prospectively studied, and biomarkers investigated should be interpreted in this context. The current study aimed to evaluate the use of homocysteine/UA along with the established risk factors in clinical practice to identify patients with increased risk for SCAF. Therefore, it may be reasonable to consider CIED patients with increased homocysteine and UA as candidates for more intensive rhythm monitoring.
Homocysteine, a highly reactive, sulfur‐containing amino acid, is an intermediate by‐product during dietary methionine metabolism. Previous research has mainly focused on the relationship between the plasma homocysteine and hypertension, left atrium thrombus formation, ischemic events, and recurrence after catheter ablation of the individual diagnosed AF, but only a few clinical studies tried to determine the associations between homocysteine and onset of AF. 24 In the present study, we demonstrated that plasma homocysteine levels were significantly higher in patients with new‐onset SCAF than those without it, and elevated plasma homocysteine was independently associated with SCAF. Although the exact mechanism linking elevated homocysteine levels and SCAF remains unclear, different pathways including oxidative stress, production, and bioavailability of nitric oxide, and inflammatory response 25 are speculated as plausible mechanisms. These mechanisms could further result in atrial structural and electrical remodeling.
UA is a heterocyclic organic compound and an end product of purine metabolism in humans and has been known as an antioxidant and pro‐oxidant at its normal and high concentration, respectively. 26 Recently, the significance of UA widely emerged in AF and has been broadly investigated in various types of the population with or without chronic disease. According to a community‐based study, the elderly population with high UA (UA >416 µmol/L in men and >357 µmol/L in women) had a higher risk of AF. 27 Chang‐Fu Kuoetal reported that gout is independently associated with a persistently higher risk of AF at diagnosis and 5 to 10 years after diagnosis. 28 Another study also showed a positive and independent association between UA and AF in patients with type 2 diabetes with the cutoff point of 300 µmol/L. 29 Akin to homocysteine, UA‐induced AF are closely related to electrophysiological and structural alterations via various mechanisms, including oxidative stress, 11 inflammation, 12 and fibrosis. 13
In our follow‐up study, we observed differences in the biomarker regulation between the SCAF and no SCAF groups. Also, we confirmed the relationship between high homocysteine and UA levels and the presence of SCAF. The incidence of SCAF in patients with a CIED depends on the clinical profile of the beneficiary and device‐specific detection algorithm. 30 Many CIED‐implanted patients own significantly high ventricular pacing and/or sinus node diseases, consequently, these populations intrinsically have a high incidence of AF. 31 , 32 Therefore, we redefined the cutoff points of the low and high risk for SCAF using the spline curve. An increase in homocysteine and UA values was markedly associated with an increased risk for SCAF in both men and women, suggesting that a substantial SCAF risk was present among those patients classified at the high homocysteine (>14 µmol/L in men and >12 µmol/L in women) and high UA (>420 µmol/L in men and >320 µmol/L in women) levels. Therefore, it may be reasonable to interpret in a way that CIED‐implanted patients with increased homocysteine and UA as candidates for more intensive rhythm monitoring. In addition, longer SCAF episodes (≥6 minutes) are more relevant to clinical AF 33 and carry a higher risk of systemic embolism/ischemic stroke. 34 The preexisting stroke risk factors aggravate the SCAF‐related thromboembolic risk. 35 Whereas the thromboembolic risk in patients with CIEDs is primarily attributed to the burden of comorbidity (such as the components of CHA2DS2‐VASc score). 35 Adding SCAF duration to the clinical risk scores has significantly improved discrimination for thromboembolism and may be useful in guiding anticoagulation therapy. 36 Thus, early identification of SCAF is important to reduce the risk of clinical AF/stroke. The unified model that combined homocysteine and UA levels with the ESC model improves the SCAF risk prediction, indicating patients with SCAF with CIEDs, particularly patients classified as a high‐risk group, requires an intensive and strict follow‐up to prevent the risk of clinical AF, stroke, and death.
The present study demonstrated that homocysteine and UA biomarkers own a good prognostic performance for SCAF independently. Also, the use of clinical risk factors, particularly those listed in the 2020 ESC guidelines definition for risk factors, has shown a good performance to discriminate SCAF in our study. In this study, compared with the ESC model alone, the unified model that combined the UA or/and homocysteine biomarkers with the ESC model offered an increase in the AUC and IDI statistics in SCAF detection. Therefore, simultaneous application of both homocysteine and UA biomarkers facilitates the prediction of the risk of SCAF more accurately in those with CIEDs in clinical practice. These circulating biomarkers may commonly regulate AF‐associated mechanisms such as inflammation and oxidative stress activation process. Additionally, homocysteine and UA are involved in the methionine homocysteine cycle. Methionine is converted to S‐adenosyl‐L‐homocysteine, split into homocysteine and adenosine. 37 Further, adenosine is metabolized to UA (Figure 9). In this case, it is reasonable to hypothesize that the relationship between the adenosine molecule and UA may contribute to the observed synergy. Bearing in mind that methionine metabolism influences the homocysteine and adenosine levels, the concentration of homocysteine may determine the amount of adenosine, which in turn increase UA levels. Further study is required to investigate the metabolic relationship between homocysteine and UA to solve the route of their synergistic effect in SCAF.
Figure 9. Homocysteine and UA metabolism.
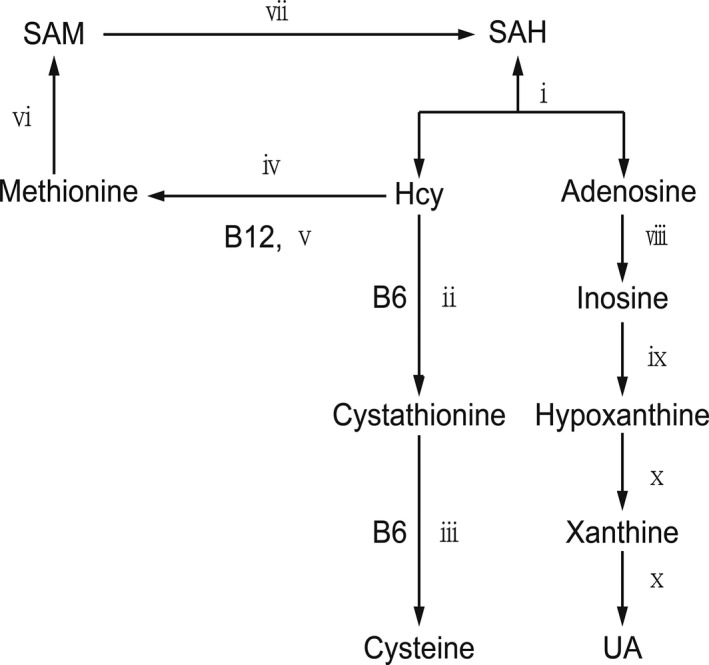
The circled numbers refer to the following enzymes: ⅰ, SAH hydrolase; ⅱ, cystathionine‐β‐synthase; ⅲ, cystathionine‐γ‐ lyase; ⅳ, betaine‐homocysteine methlytransferase; ⅴ, methionine synthase; ⅵ, methionine adenosyltransferase; ⅶ, methyltransferases; ⅷ adenosine deaminase; ⅸ, phosphorylase; ⅹ, xanthine oxidase. SAH indicates S‐adenosyl‐L‐homocysteine; and SAM indicates S‐adenosyl‐methionine.
Study Limitations
Considering the high rate of silent AF and the limited sensitivity of routine ECGs, continuous rhythm monitoring provides a strong basis to evaluate the role of plasma homocysteine and UA biomarkers to discriminate for SCAF. The associations of biomarkers with SCAF in our study are strengthened by the continuous monitoring of heart rhythm with months‐ to years‐long observation time, allowing detection of SCAF that might be otherwise overlooked with standard or 24‐hour ECG recording. However, the present study has several limitations. First, this was a single‐center, nonrandomized, retrospective observational study, and was subject to inherent limitations associated with retrospective analyses. Second, some of our patients may have had silent AF before CIED implantation. However, there is no reliable method to identify such patients precisely. Third, CIED‐implanted patients are known for their high risk of increased ventricular pacing or sinus node disease that makes them special cases for AF risk, which may limit the generalization of our results in the general population. Finally, there was a slight configuration difference in SCAF detection because of the different permanent pacemaker manufacturers.
CONCLUSIONS
In conclusion, we found strong independent associations between homocysteine and UA concentrations and the presence of SCAF in patients with implanted CIEDs. Also, our study identified that elevated homocysteine and UA were independent prognostic markers for SCAF in patients with CIEDs. The combination of homocysteine and UA with ESC definition of AF risk factors significantly improved the prediction of SCAF in patients with CIEDs, indicating that simultaneous application of this unified model can significantly improve discrimination for SCAF in CIED‐implanted patients.
Sources of Funding
This research was funded by the National Natural Science Foundation of China (grant number 81970286 and 81900439), the Science Foundation of Doctors of Liaoning Province (grant number 2020‐BS‐197), the Chang Jiang Scholars Program (grant number T2017124), the Dalian Talents Innovation Supporting Project (grant number 2018RD09), the Program of Liaoning Distinguished Professor.
Disclosures
None.
Supporting information
Tables S1–S3
Figure S1
Supplemental Material for this article is available at https://www.ahajournals.org/doi/suppl/10.1161/JAHA.121.021997
For Sources of Funding and Disclosures, see page 13.
Contributor Information
Xiaolei Yang, Email: yangxl_1012@yeah.net.
Yunlong Xia, Email: yunlong_xia@126.com.
REFERENCES
- 1. Hindricks G, Potpara T, Dagres N, Arbelo E, Bax JJ, Blomstrom‐Lundqvist C, Boriani G, Castella M, Dan GA, Dilaveris PE, et al. 2020 ESC guidelines for the diagnosis and management of atrial fibrillation developed in collaboration with the European Association for Cardio‐Thoracic Surgery (EACTS): the Task Force for the diagnosis and management of atrial fibrillation of the European Society of Cardiology (ESC) developed with the special contribution of the European Heart Rhythm Association (EHRA) of the ESC. Eur Heart J. 2021;42:4194. doi: 10.1093/eurheartj/ehab648 [DOI] [PubMed] [Google Scholar]
- 2. Lip GY, Lane DA. Stroke prevention in atrial fibrillation: a systematic review. JAMA. 2015;313:1950–1962. doi: 10.1001/jama.2015.4369 [DOI] [PubMed] [Google Scholar]
- 3. Healey JS, Connolly SJ, Gold MR, Israel CW, Van Gelder IC, Capucci A, Lau CP, Fain E, Yang S, Bailleul C, et al. Subclinical atrial fibrillation and the risk of stroke. N Engl J Med. 2012;366:120–129. doi: 10.1056/NEJMoa1105575 [DOI] [PubMed] [Google Scholar]
- 4. Glotzer TV, Hellkamp AS, Zimmerman J, Sweeney MO, Yee R, Marinchak R, Cook J, Paraschos A, Love J, Radoslovich G, et al. Atrial high rate episodes detected by pacemaker diagnostics predict death and stroke: report of the Atrial Diagnostics Ancillary Study of the MOde Selection Trial (MOST). Circulation. 2003;107:1614–1619. doi: 10.1161/01.CIR.0000057981.70380.45 [DOI] [PubMed] [Google Scholar]
- 5. Nishinarita R, Niwano S, Fukaya H, Oikawa J, Nabeta T, Matsuura G, Arakawa Y, Kobayashi S, Shirakawa Y, Horiguchi A, et al. Burden of implanted‐device‐detected atrial high‐rate episode is associated with future heart failure events‐ clinical significance of asymptomatic atrial fibrillation in patients with implantable cardiac electronic devices. Circ J. 2019;83:736–742. doi: 10.1253/circj.CJ-18-1130 [DOI] [PubMed] [Google Scholar]
- 6. Yao Y, Gao LJ, Zhou Y, Zhao JH, Lv Q, Dong JZ, Shang MS. Effect of advanced age on plasma homocysteine levels and its association with ischemic stroke in non‐valvular atrial fibrillation. J Geriatr Cardiol. 2017;14:743–749. doi: 10.11909/j.issn.1671-5411.2017.12.004 [DOI] [PMC free article] [PubMed] [Google Scholar]
- 7. Kuwabara M, Niwa K, Nishihara S, Nishi Y, Takahashi O, Kario K, Yamamoto K, Yamashita T, Hisatome I. Hyperuricemia is an independent competing risk factor for atrial fibrillation. Int J Cardiol. 2017;231:137–142. doi: 10.1016/j.ijcard.2016.11.268 [DOI] [PubMed] [Google Scholar]
- 8. Outinen PA, Sood SK, Liaw PC, Sarge KD, Maeda N, Hirsh J, Ribau J, Podor TJ, Weitz JI, Austin RC. Characterization of the stress‐inducing effects of homocysteine. Biochem J. 1998;332(Pt 1):213–221. doi: 10.1042/bj3320213 [DOI] [PMC free article] [PubMed] [Google Scholar]
- 9. Ganguly P, Alam SF. Role of homocysteine in the development of cardiovascular disease. Nutr J. 2015;14:6. doi: 10.1186/1475-2891-14-6 [DOI] [PMC free article] [PubMed] [Google Scholar]
- 10. Wald DS, Law M, Morris JK. Homocysteine and cardiovascular disease: evidence on causality from a meta‐analysis. BMJ. 2002;325:1202. doi: 10.1136/bmj.325.7374.1202 [DOI] [PMC free article] [PubMed] [Google Scholar]
- 11. Doehner W, Landmesser U. Xanthine oxidase and uric acid in cardiovascular disease: clinical impact and therapeutic options. Semin Nephrol. 2011;31:433–440. doi: 10.1016/j.semnephrol.2011.08.007 [DOI] [PubMed] [Google Scholar]
- 12. Kanellis J, Watanabe S, Li JH, Kang DH, Li P, Nakagawa T, Wamsley A, Sheikh‐Hamad D, Lan HY, Feng L, et al. Uric acid stimulates monocyte chemoattractant protein‐1 production in vascular smooth muscle cells via mitogen‐activated protein kinase and cyclooxygenase‐2. Hypertension. 2003;41:1287–1293. doi: 10.1161/01.HYP.0000072820.07472.3B [DOI] [PubMed] [Google Scholar]
- 13. Yan M, Chen K, He L, Li S, Huang D, Li J. Uric acid induces cardiomyocyte apoptosis via activation of calpain‐1 and endoplasmic reticulum stress. Cell Physiol Biochem. 2018;45:2122–2135. doi: 10.1159/000488048 [DOI] [PubMed] [Google Scholar]
- 14. Ma Y‐C, Zuo LI, Chen J‐H, Luo Q, Yu X‐Q, Li Y, Xu J‐S, Huang S‐M, Wang L‐N, Huang W, et al. Modified glomerular filtration rate estimating equation for Chinese patients with chronic kidney disease. J Am Soc Nephrol. 2006;17:2937–2944. doi: 10.1681/ASN.2006040368 [DOI] [PubMed] [Google Scholar]
- 15. Bild DE, Bluemke DA, Burke GL, Detrano R, Diez Roux AV, Folsom AR, Greenland P, Jacob DR Jr, Kronmal R, Liu K, et al. Multi‐Ethnic Study of Atherosclerosis: objectives and design. Am J Epidemiol. 2002;156:871–881. doi: 10.1093/aje/kwf113 [DOI] [PubMed] [Google Scholar]
- 16. Ford ES, Giles WH, Mokdad AH. The distribution of 10‐year risk for coronary heart disease among US adults: findings from the National Health and Nutrition Examination Survey III. J Am Coll Cardiol. 2004;43:1791–1796. doi: 10.1016/j.jacc.2003.11.061 [DOI] [PubMed] [Google Scholar]
- 17. Powers RW, Majors AK, Lykins DL, Sims CJ, Lain KY, Roberts JM. Plasma homocysteine and malondialdehyde are correlated in an age‐ and gender‐specific manner. Metabolism. 2002;51:1433–1438. doi: 10.1053/meta.2002.35587 [DOI] [PubMed] [Google Scholar]
- 18. Suzuki S, Sagara K, Otsuka T, Matsuno S, Funada R, Uejima T, Oikawa Y, Koike A, Nagashima K, Kirigaya H, et al. Gender‐specific relationship between serum uric acid level and atrial fibrillation prevalence. Circ J. 2012;76:607–611. doi: 10.1253/circj.cj-11-1111 [DOI] [PubMed] [Google Scholar]
- 19. Pickering JW, Endre ZH. New metrics for assessing diagnostic potential of candidate biomarkers. Clin J Am Soc Nephrol. 2012;7:1355–1364. doi: 10.2215/CJN.09590911 [DOI] [PubMed] [Google Scholar]
- 20. Zhang S, Liu L, Huang YQ, Lo K, Feng YQ. A U‐shaped association between serum uric acid with all‐cause mortality in normal‐weight population. Postgrad Med. 2020;132:391–397. doi: 10.1080/00325481.2020.1730610 [DOI] [PubMed] [Google Scholar]
- 21. Zhong C, Xu T, Xu T, Peng Y, Wang A, Wang J, Peng H, Li Q, Geng D, Zhang D, et al. Plasma homocysteine and prognosis of acute ischemic stroke: a gender‐specific analysis from CATIS randomized clinical trial. Mol Neurobiol. 2017;54:2022–2030. doi: 10.1007/s12035-016-9799-0 [DOI] [PubMed] [Google Scholar]
- 22. Cohen E, Levi A, Vecht‐Lifshitz SE, Goldberg E, Garty M, Krause I. Assessment of a possible link between hyperhomocysteinemia and hyperuricemia. J Investig Med. 2015;63:534–538. doi: 10.1097/JIM.0000000000000152 [DOI] [Google Scholar]
- 23. Healey JS, Alings M, Ha A, Leong‐Sit P, Birnie DH, de Graaf JJ, Freericks M, Verma A, Wang J, Leong D, et al. Subclinical atrial fibrillation in older patients. Circulation. 2017;136:1276–1283. doi: 10.1161/CIRCULATIONAHA.117.028845 [DOI] [PubMed] [Google Scholar]
- 24. Marcucci R, Betti I, Cecchi E, Poli D, Giusti B, Fedi S, Lapini I, Abbate R, Gensini GF, Prisco D. Hyperhomocysteinemia and vitamin B6 deficiency: new risk markers for nonvalvular atrial fibrillation? Am Heart J. 2004;148:456–461. doi: 10.1016/j.ahj.2004.03.017 [DOI] [PubMed] [Google Scholar]
- 25. Steed MM, Tyagi SC. Mechanisms of cardiovascular remodeling in hyperhomocysteinemia. Antioxid Redox Signal. 2011;15:1927–1943. doi: 10.1089/ars.2010.3721 [DOI] [PMC free article] [PubMed] [Google Scholar]
- 26. Kang DH, Ha SK. Uric acid puzzle: dual role as anti‐oxidant and pro‐oxidant. Electrolyte Blood Press. 2014;12:1–6. doi: 10.5049/EBP.2014.12.1.1 [DOI] [PMC free article] [PubMed] [Google Scholar]
- 27. Huang G, Xu RH, Xu JB, Liu Y, Liu ZH, Xie X, Zhang TJ. Hyperuricemia is associated with atrial fibrillation prevalence in very elderly—a community based study in Chengdu, China. Sci Rep. 2018;8:12403. doi: 10.1038/s41598-018-30321-z [DOI] [PMC free article] [PubMed] [Google Scholar]
- 28. Kuo CF, Grainge MJ, Mallen C, Zhang W, Doherty M. Impact of gout on the risk of atrial fibrillation. Rheumatology (Oxford). 2016;55:721–728. doi: 10.1093/rheumatology/kev418 [DOI] [PMC free article] [PubMed] [Google Scholar]
- 29. Valbusa F, Bertolini L, Bonapace S, Zenari L, Zoppini G, Arcaro G, Byrne CD, Targher G. Relation of elevated serum uric acid levels to incidence of atrial fibrillation in patients with type 2 diabetes mellitus. Am J Cardiol. 2013;112:499–504. doi: 10.1016/j.amjcard.2013.04.012 [DOI] [PubMed] [Google Scholar]
- 30. Solari D, Bertero E, Miceli R, Brunelli C, Ameri P, Canepa M. Methods, accuracy and clinical implications of atrial fibrillation detection by cardiac implantable electronic devices. Int J Cardiol. 2017;236:262–269. doi: 10.1016/j.ijcard.2016.12.189 [DOI] [PubMed] [Google Scholar]
- 31. Sweeney MO, Bank AJ, Nsah E, Koullick M, Zeng QC, Hettrick D, Sheldon T, Lamas GA; Search AVE, Managed Ventricular Pacing for Promoting Atrioventricular Conduction T . Minimizing ventricular pacing to reduce atrial fibrillation in sinus‐node disease. N Engl J Med. 2007;357:1000–1008. doi: 10.1056/NEJMoa071880 [DOI] [PubMed] [Google Scholar]
- 32. Stiles MK, John B, Wong CX, Kuklik P, Brooks AG, Lau DH, Dimitri H, Roberts‐Thomson KC, Wilson L, De Sciscio P, et al. Paroxysmal lone atrial fibrillation is associated with an abnormal atrial substrate: characterizing the "second factor." J Am Coll Cardiol. 2009;53:1182–1191. doi: 10.1016/j.jacc.2008.11.054 [DOI] [PubMed] [Google Scholar]
- 33. Kaufman ES, Israel CW, Nair GM, Armaganijan L, Divakaramenon S, Mairesse GH, Brandes A, Crystal E, Costantini O, Sandhu RK, et al. Positive predictive value of device‐detected atrial high‐rate episodes at different rates and durations: an analysis from ASSERT. Heart Rhythm. 2012;9:1241–1246. doi: 10.1016/j.hrthm.2012.03.017 [DOI] [PubMed] [Google Scholar]
- 34. Glotzer TV, Daoud EG, Wyse DG, Singer DE, Ezekowitz MD, Hilker C, Miller C, Qi D, Ziegler PD. The relationship between daily atrial tachyarrhythmia burden from implantable device diagnostics and stroke risk: the TRENDS study. Circ Arrhythm Electrophysiol. 2009;2:474–480. doi: 10.1161/CIRCEP.109.849638 [DOI] [PubMed] [Google Scholar]
- 35. Kaplan RM, Koehler J, Ziegler PD, Sarkar S, Zweibel S, Passman RS. Stroke risk as a function of atrial fibrillation duration and CHA2DS2‐VASc Score. Circulation. 2019;140:1639–1646. doi: 10.1161/CIRCULATIONAHA.119.041303 [DOI] [PubMed] [Google Scholar]
- 36. Boriani G, Botto GL, Padeletti L, Santini M, Capucci A, Gulizia M, Ricci R, Biffi M, De Santo T, Corbucci G, et al. Improving stroke risk stratification using the CHADS2 and CHA2DS2‐VASc risk scores in patients with paroxysmal atrial fibrillation by continuous arrhythmia burden monitoring. Stroke. 2011;42:1768–1770. doi: 10.1161/STROKEAHA.110.609297 [DOI] [PubMed] [Google Scholar]
- 37. Palmer JL, Abeles RH. The mechanism of action of S‐adenosylhomocysteinase. J Biol Chem. 1979;254:1217–1226. doi: 10.1016/S0021-9258(17)34190-X [DOI] [PubMed] [Google Scholar]
Associated Data
This section collects any data citations, data availability statements, or supplementary materials included in this article.
Supplementary Materials
Tables S1–S3
Figure S1


