

Abstract
Background
Anticancer therapies have significantly improved patient outcomes; however, cardiac side effects from cancer therapies remain a significant challenge. Cardiotoxicity following treatment with proteasome inhibitors such as carfilzomib is known in clinical settings, but the underlying mechanisms have not been fully elucidated.
Methods and Results
Using human induced pluripotent stem cell‐derived cardiomyocytes (hiPSC‐CMs) as a cell model for drug‐induced cytotoxicity in combination with traction force microscopy, functional assessments, high‐throughput imaging, and comprehensive omic analyses, we examined the molecular mechanisms involved in structural and functional alterations induced by carfilzomib in hiPSC‐CMs. Following the treatment of hiPSC‐CMs with carfilzomib at 0.01 to 10 µmol/L, we observed a concentration‐dependent increase in carfilzomib‐induced toxicity and corresponding morphological, structural, and functional changes. Carfilzomib treatment reduced mitochondrial membrane potential, ATP production, and mitochondrial oxidative respiration and increased mitochondrial oxidative stress. In addition, carfilzomib treatment affected contractility of hiPSC‐CMs in 3‐dimensional microtissues. At a single cell level, carfilzomib treatment impaired Ca2+ transients and reduced integrin‐mediated traction forces as detected by piconewton tension sensors. Transcriptomic and proteomic analyses revealed that carfilzomib treatment downregulated the expression of genes involved in extracellular matrices, integrin complex, and cardiac contraction, and upregulated stress responsive proteins including heat shock proteins.
Conclusions
Carfilzomib treatment causes deleterious changes in cellular and functional characteristics of hiPSC‐CMs. Insights into these changes could be gained from the changes in the expression of genes and proteins identified from our omic analyses.
Keywords: cardiomyocyte, cardiotoxicity, drug research, gene expression, stem cell
Subject Categories: Basic Science Research
Nonstandard Abbreviations and Acronyms
- 3D
3‐dimensional
- DMSO
dimethyl sulfoxide
- ECM
extracellular matrix
- GO
gene ontology
- hiPSC‐CMs
human induced pluripotent stem cell‐derived cardiomyocytes
- HSPs
heat shock proteins
- RNA‐seq
RNA sequencing
- ROS
reactive oxygen species
- TGT
tension gauge tether
Clinical Perspective
What Is New?
Treatment of human stem cell‐derived cardiomyocytes with carfilzomib resulted in oxidative stress, mitochondrial dysfunction, and cell death.
Carfilzomib treatment negatively affected contractility, Ca2+ handling, and integrin‐mediated traction forces in human stem cell‐derived cardiomyocytes.
Carfilzomib treatment downregulated the expression of genes involved in extracellular matrices, integrin complex, and cardiac contraction and upregulated stress responsive proteins.
What Are the Clinical Implications?
Improving mitochondrial function, Ca2+ handling, cardiac contraction, and integrin‐mediated traction forces has the potential to mitigate carfilzomib‐induced cardiotoxicity.
The molecules such as heat shock proteins upregulated by carfilzomib treatment are potential biomarkers for carfilzomib‐induced cardiotoxicity.
Anticancer therapies have significantly improved the outcomes of patients with cancer over the past decade. However, several common chemotherapeutic agents, including proteasome inhibitors, are associated with an increased risk of arrhythmias, conduction abnormalities, and other cardiac adverse events. Cardiac toxicities have been reported with Food and Drug Administration–approved proteasome inhibitors in clinical trials. 1 Carfilzomib, a second‐generation proteasome inhibitor for the treatment of relapsed or refractory multiple myeloma, can cause cardiotoxicity. 1 , 2 , 3 , 4 Clinical trials with carfilzomib have indicated cardiotoxicity including heart failure and cardiac arrhythmias. 5 , 6 , 7 A meta‐analysis of 29 clinical trials including 4164 patients who received carfilzomib reported 8.6% and 4.9% incidence of all‐grade and high‐grade cardiotoxicity, respectively. 8 Another meta‐analysis of 24 clinical trials including 2594 patients who received carfilzomib showed 18.1% and 8.2% incidence of all‐grade and high‐grade cardiotoxicity, respectively. 9 Although carfilzomib is used frequently in the treatment of multiple myeloma, the incidence of cardiotoxicity caused by carfilzomib appears to be higher than other proteasome inhibitors. 8
Carfilzomib has been well‐characterized for its potent activity to irreversibly bind to and inhibit the chymotrypsin‐like site of the proteasome, 10 blocking the ability of the ubiquitin/proteasome system to degrade and recycle misfolded or damaged proteins. 11 Carfilzomib can effectively induce apoptosis and kill multiple types of human cancer cells with IC50 ranging from 50 to 300 nmol/L after 24 hours exposure of cell cultures to carfilzomib. 12 Cardiomyocytes are also sensitive to proteasome inhibition possibly because of high protein turnover of contractile proteins. 11 For example, exposure of primary neonatal rat cardiomyocytes to submicromolar concentrations of carfilzomib induced apoptosis and myocyte damage. 13 A preclinical pharmacokinetics study identified chymotrypsin‐like proteasomal activity of carfilzomib that can potentially damage rat cardiomyocytes at clinically relevant concentrations. 14 However, cellular and molecular mechanisms underlying carfilzomib‐induced cardiotoxicity remain to be fully elucidated.
Because cardiovascular side effects of cancer therapies are increasing, the development of a human cell model is needed to facilitate the understanding of cardiotoxicity‐related mechanisms. Progress in hiPSC‐CM research has provided a new platform for the studies of drug‐induced side effects and disease modeling. 15 , 16 hiPSC‐CMs have translational potential to improve current models by providing more precise and clinically relevant characteristics on responses to drug treatment. 17 They can also overcome the differences between human and animal cardiac physiology and challenges in long‐term maintenance of primary human cardiomyocytes and can be engineered for scalable manufacture. hiPSC‐CMs have provided novel insights for the study of genetic heart diseases and drug responses. 18 , 19 , 20 Patient‐specific hiPSC‐CMs have also been used for pharmacogenetic studies to facilitate the identification of cancer survivors with increased risk of chemotherapy‐related cardiomyopathy. 21
To advance our understanding of the underlying mechanisms contributing to the carfilzomib‐induced cardiotoxicity, here we provide a molecular and functional view of hiPSC‐CMs after carfilzomib treatment. We found that carfilzomib induced dose‐dependent cytotoxicity and targeted mitochondria at physiologically relevant doses, leading to the disruption of cellular energy and contractility. Additionally, we examined cellular function at the single cell level through traction force measurements using a nucleic acid‐based tension sensor along with Ca2+ transient imaging. Our findings on reduction in traction forces, abnormal Ca2+ transients, mitochondrial dysfunction, and contractility impairment, in combination with comprehensive transcriptome and proteome analyses, illustrate the possible molecular mechanisms in cardiomyocyte functional alteration after carfilzomib treatment. Our study also provides a unique resource for the discovery of biomarkers associated with cardiomyocyte dysfunction and arrhythmias following carfilzomib therapy.
METHODS
Data Availability
Global gene expression profiling of RNA sequencing (RNA‐seq) data are available at the National Center for Biotechnology Information Gene Expression Omnibus database with the accession number GSE163102. The proteomics data were deposited in the public MassIVE database with the identifier MSV000087350. Institutional review board approval was not required, because this study did not involve the use of animals or human subjects.
Cardiomyocyte Differentiation and Spheroid Formation
Human induced pluripotent stem cell lines SCVI‐273 (Stanford Cardiovascular Institute) and IMR‐90 (WiCell Research Institute) were differentiated toward cardiomyocytes using small molecules or growth factors based on previously published differentiation protocols 22 , 23 (Figure 1A). Human induced pluripotent stem cell monolayers were dissociated using Versene (Thermo Fisher Scientific) and seeded onto 12‐well plates coated with 1:60 Matrigel (Thermo Fisher Scientific). Cardiomyocyte differentiation was performed using 6 µmol/L CHIR 99021 (Selleck Chemicals) in RPMI/B27 insulin‐free medium (days 0–1) followed by 5 µmol/L IWR‐1 (Sigma‐Aldrich) for 2 days on days 3 to 5. Medium was changed on day 5, and cells were maintained in RPMI/B27 with insulin for the remaining of days. In the second protocol, cells were treated with 100 ng/mL recombinant human activin A (R&D Systems) on day 0 and replaced with 10 ng/mL recombinant human bone morphogenic protein‐4 (R&D Systems) in RPMI/B27 insulin‐free medium from days 1 to 4. Differentiated cells were maintained in RPMI/B27 with insulin for 5 weeks with medium change every 2 to 3 days. Spheroids were generated using AggreWell400 plates (1800 cells per microwell for each spheroid) from differentiated cultures on differentiation day 6 and maintained in RPMI/B27 with insulin.
Figure 1. Cfz treatment‐induced dose‐dependent cytotoxicity in human induced pluripotent stem cell‐derived cardiomyocytes (hiPSC‐CMs).

A, Overall experimental design. B, Representative images of immunofluorescence staining for examining cardiac purity using NKX2.5 antibodies and cardiomyocyte purity (percent NKX 2.5‐positive cells) of 3‐dimensional (3D) hiPSC‐CMs following the treatment with Cfz analyzed by ArrayScan. C, Relative cell viability of hiPSC‐CMs 24 and 48 hours after Cfz treatment measured by CellTiter‐Blue fluorescence assay (n=4 cultures). D, Cell viability of 3D hiPSC‐CMs 24 hours after Cfz treatment using Live/Dead staining (red ethidium‐stained cells were dead cells; green calcein‐stained cells were live cells). Scale bar=100 µm. E, Relative caspase3/7 activity of hiPSC‐CMs 48 hours after Cfz treatment (n=4–5 cultures). F, Representative images of MitoSOX staining and summary of MitoSOX MFI in hiPSC‐CMs 24 and 48 hours after Cfz treatment (n=3–4 cultures). Nuclei were counterstained with Hoechst. Scale bar=50 µm. G, Relative cell viability of hiPSC‐CMs 24 hours following Cfz treatment with and without ascorbic acid (n=3 cultures). hiPSC‐CMs were pretreated with ascorbate acid for 2 hours, followed by cotreatment with Cfz for 24 hours. Cfz indicates carfilzomib; D, day; DMSO, dimethyl sulfoxide; h, hour; and MFI, mean fluorescence intensity. *P<0.05; **P<0.01; ***P<0.001; ****P<0.0001.
SCVI‐273 hiPSC‐CMs were used for oxidative stress, caspase activity, mitochondrial membrane potential, ATP measurement, Ca2+ transients, measurements of sarcomere length and cell structure, and RNA‐seq analysis. IMR‐90 hiPSC‐CMs were used for quantitative reverse transcription–polymerase chain reaction, traction force, contractility, and proteomics analysis. Both hiPSC lines SCVI‐273‐ and IMR90‐derived CMs were used for cell viability and mitochondrial function with similar results, and data from SCVI‐273 hiPSC‐CMs were presented.
Assay to Determine Mitochondrial Membrane Potential
To analyze changes in mitochondrial membrane potential in hiPSC‐CMs, we used tetramethyl rhodamine methyl ester, a dye probe that accumulates in mitochondria. Medium was removed following 1‐day treatment with carfilzomib, and cells were labeled with 100 nmol/L tetramethyl rhodamine methyl ester for 30 minutes at 37 °C. Cells were then counter stained with Hoechst (Thermo Fisher Scientific; H3570) and imaged immediately using ArrayScan XTI Live High Content Platform (Life Technologies). 24 We quantified the nuclear spots within the ring in channel 2 by using intensity as a readout.
Drug Preparation and Treatment
The stock solution of 10 mmol/L carfilzomib (Selleck Chemicals; PR‐171 and S2853) was prepared by dissolving 10 mg carfilzomib in 1.389 mL dimethyl sulfoxide (DMSO; Sigma‐Aldrich) and stored at −80 °C. The peak plasma concentration based on pharmacokinetic characteristics of carfilzomib is 5.88 µmol/L. A dose range from 0.01 to 10 µmol/L was selected following initial testing of carfilzomib at 1, 2, 10, and 20 µmol/L. To make ×2 final concentration of carfilzomib in RPMI/B27 with insulin, drug dilution was performed on the day of each experiment and kept on ice in the dark. DMSO at 0.2% (v/v), a concentration corresponding to the highest drug concentration, was used as vehicle control. Doxorubicin (Adriamycin; Selleck Chemicals) at 10 μmol/L was used as a positive control for viability testing and 1 μmol/L for contractility and Ca2+ transient analysis. Stock solution of doxorubicin (10 mmol/L) was made in the same manner as carfilzomib. The peak plasma concentration of doxorubicin is 1.8 to 11 μmol/L.
For the rescue experiment, hiPSC‐CMs were pretreated with ascorbic acid (Sigma‐Aldrich) at 25 µg/mL for 2 hours before the carfilzomib treatment and then treated with carfilzomib and ascorbic acid for 24 hours before the analysis of cell viability by CellTiter‐Blue assay (Promega). All treatments were adjusted to equivalent concentrations of DMSO (solvent).
In Vitro Cytotoxicity Assays
For monolayer culture of hiPSC‐CMs, cell viability was measured using CellTiter‐Blue assay (Promega). Monolayer cultures of hiPSC‐CMs (IMR‐90 and SCVI‐273) were plated in Matrigel (1/60)‐coated 96‐well plates with clear bottom and black wall. Cells were allowed to attach at 37 °C in RPMI‐B27 with Rock inhibitor (10 µmol/L) for 24 hours before treatment with carfilzomib. Serially diluted carfilzomib was added to cells. After 24 and 48 hours of carfilzomib treatment, cells were incubated with 20 µL of the CellTiter‐Blue reagent in 100 µL of RPMI/B27 medium solution for 2 hours, and the reduction of resazurin to resorufin in live cells was measured by fluorescence excitation at 530 nm and emission at 590 nm using a BioTek micro‐plate reader and Gen5 3.03 software. For 3‐dimensional (3D) hiPSC‐CMs, cell viability was measured by Live/Dead staining (Thermo Fisher Scientific). A master mix of 1 µmol/L ethidium homodimer and 0.25 µmol/L of calcein in RPMI/B27 medium was added following a wash with PBS. Cells were incubated for 25 minutes at 37 °C, washed twice with PBS, and suspended in 5 mL of RPMI/B27 medium without phenol red. Live/dead‐stained cells were observed at 645 nm for ethidium homodimer and 530 nm for calcein‐acetoxymethyl ester.
Immunofluorescence Staining
hiPSC‐CMs were dissociated with 0.05% Trypsin‐EDTA and reseeded in Matrigel‐coated 96‐well culture plates at a density of 5×10⁴ cells per well. Retrieved cells were fixed in 4% paraformaldehyde for 15 minutes following gentle PBS wash and permeabilized using 90% cold methanol for 2 minutes at room temperature. The cells were then blocked with 10% normal goat serum in PBS at room temperature for 1 hour and incubated overnight at 4 °C with the primary antibodies against NKX2.5 (Cell Signaling; 1:1600) and α‐actinin (Sigma‐Aldrich; 1:800) diluted in 3% normal goat serum for the purity assay. 23 After the incubation with the primary antibodies, the cells were washed twice with PBS and incubated with secondary antibodies, Alexa Fluor 488‐conjugated goat anti‐mouse immunoglobulin G1 (for α‐actinin staining, Life Technologies) and Alexa Fluor 594‐conjugated goat anti‐rabbit immunoglobulin G (for NKX2.5 staining; Life Technologies) diluted at 1:1000 in PBS with 0.25% BSA. The nuclei were counterstained with 7 µmol/L Hoechst33342 (Thermo Fisher Scientific) for 15 minutes at room temperature and preimaged using an inverted microscope (Axio Vert.A1). Images of immunocytochemistry were quantitatively analyzed using ArrayScan XTI Live High Content Platform. The Cellomics Scan Software (Thermo Fisher Scientific) was used to capture images, and data analysis was performed using Cellomics View Software (Thermo Fisher Scientific). Twenty fields per well were imaged using a ×10 objective. Spot threshold was set to 10 units, and detection limit was set at 25 units. The percentage of α‐actinin–positive cells and the average intensity per well were used as a readout.
Caspase 3/7 Detection
Fresh Caspase‐GloR 3/7 reagent (Promega) was reconstituted and added to cells as an indicator of apoptosis. Background readings were measured from wells containing culture medium without cells. Illuminometer readings were taken 1 hour after adding the Caspase‐GloR 3/7 reagent.
Assay to Measure ATP Content
CellTiter‐Glo 3D Cell Viability kit (Promega) was used to detect alterations in the cellular ATP content. 3D hiPSC‐CMs were dissociated into single cells using 0.25% Trypsin‐EDTA and replated into a 96‐well plate at a density of 4.5×10⁴ cells per well. Medium was removed, and RPMI without phenol red was added at 100 µL per well. The kit was thawed at 4 °C a day before and the reagent was added at 100 µL per well (1:1 ratio) with 2 minutes shaking. Measurement was performed at Top Count NXT Microplate Luminescence Counter (PerkinElmer) with integration time of 1 second per well after 20 minutes incubation in room temperature.
Quantitative Reverse Transcription–Polymerase Chain Reaction
Total RNA was extracted using Aurum total RNA mini kit (Bio‐Rad) according to manufacturer’s instructions. One microgram total RNA was used for complementary DNA synthesis using the Superscript VILO complementary DNA synthesis kit (Thermo Fisher Scientific), and reaction mixture was incubated using a C1000 touch thermal cycler (Bio‐Rad) as follows: 25 °C for 10 minutes, 37 °C for 2 hours and 85 °C for 5 minutes. The reaction mixture was further diluted to 300 and 2 µL complementary DNA as the template was subjected to quantitative reverse transcription–polymerase chain reaction, which was performed in triplicate for each gene using a SYBR Green reaction master mix (Bio‐Rad). Real‐time polymerase chain reaction conditions included initial denaturation step at 95 °C for 10 minutes, 40 cycles of 2‐steps with 15 seconds of denaturation at 95 °C, followed by 1 minutes of annealing at 60 °C using Applied Biosystems 7500 real‐time polymerase chain reaction systems. The messenger RNA levels of the genes examined were normalized to GAPDH messenger RNA levels. The primers used for the genes are listed in Table 1.
Table 1.
Primers for Quantitative Reverse Transcription–Polymerase Chain Reaction
| Gene | Description of full name | Accession code | Primer |
|---|---|---|---|
| ATP2A2 | ATPase, Ca2+ transporting, cardiac muscle, slow twitch 2 | NM_170665 |
Forward: TCAGCAGGAACTTTGTCACC Reverse: GGGCAAAGTGTATCGACAGG |
| CASQ2 | Calsequestrin 2 | NM_001232 |
Forward: TTATGTTCAAGGACCTGGGC Reverse: GCCTCTACTACCATGAGCCG |
| GAPDH | Glyceraldehyde‐3‐phosphate dehydrogenase | NM_001256799 |
Forward: CTGGGCTACACTGAGCACC Reverse: AAGTGGTCGTTGAGGGCAATG |
| MYH6 | Myosin, heavy chain 6, cardiac muscle, alpha (α‐MHC) | NM_002471 |
Forward: CTTCTCCACCTTAGCCCTGG Reverse: GCTGGCCCTTCAACTACAGA |
| MYL2 | Myosin, light chain 2, regulatory, cardiac, slow (MLC‐2V) | NM_000432 |
Forward: CGTTCTTGTCAATGAAGCCA Reverse: CAACGTGTTCTCCATGTTCG |
| RYR2 | Ryanodine receptor 2, cardiac | NM_001035 |
Forward: CAAATCCTTCTGCTGCCAAG Reverse: CGAAGACGAGATCCAGTTCC |
| SLC8A1 | Solute carrier family 8 (sodium/calcium exchanger), member 1 | NM_021097 |
Forward: CTGGAATTCGAGCTCTCCAC Reverse: ACATCTGGAGCTCGAGGAAA |
| OPA1 | OPA1 mitochondrial dynamin like GTPase | NM_015560.3 |
Forward: TGAAAGCATCAAGTTTTTCTTG Reverse: TGCTGAAGATGGTGAGAAGAAG |
| NDUFB5 | NADH ubiquinone oxoreductase subunit B5 | NM_002492.4 |
Forward: ATGGTCTCCACTGTGTCGAA Reverse: GGTGGCAGCTCTGTCTGG |
| MFN2 | Mitofusin 2 | NM_014874.4 |
Forward: TTGCATCGAGAGAAGAGCAG Reverse: GTCTTTTGGACTTCAGCCAT |
| MFN1 | Mitofusin 1 | NM_033540.3 |
Forward: GTTTTCACTGCTGACTGCGA Reverse: GTGGCACTTGCTGAAGGATT |
| COQ10A | Coenzyme Q10 homolog A | NM_144576 | Forward: CTTACCTTCGAGCCGTTCCTT Reverse: CCATGATTCTACGCTCCGAGTA |
| UCP3 | Uncoupling protein 3 | NM_003356.4 |
Forward: AACGCAAAAAGGAGGGTGTA Reverse: CTCCAGGCCAGTACTTCAGC |
Primers were retrieved from open access websites (http://primerdepot.nci.nih.gov/ or http://pga.mgh.harvard.edu/primerbank/).
Detection of Mitochondrial Reactive Oxygen Species
To analyze changes in mitochondrial reactive oxygen species (ROS), we used MitoSOX Red (Thermo Fisher Scientific) staining. The cells were washed with PBS and incubated with 5 µmol/L MitoSOX Red for 15 minutes at 37 °C and protected from light. Cells were counter‐stained with Hoechst (Thermo Fisher Scientific) and imaged using ArrayScan XTI Live High Content Platform (Life Technologies).
Seahorse Extracellular Flux Analysis of Mitochondrial Respiration
Seahorse plates were coated with Matrigel at 1:50 dilution 1 day before cell seeding. hiPSC‐CMs were seeded at 2.5×10⁵ cells per well in 300 µL of the medium and were allowed to adhere for 1 day in a 37 °C humidified incubator with 5% CO2. The Seahorse XF Sensor Cartridge was hydrated the day before by filling each well of the XF Utility plate with 1 mL of Seahorse XF Calibrant Solution and kept in a non‐CO2 37 °C incubator for 24 hours to remove CO2 from the media to prevent interference with pH‐sensitive measurements. To pre‐equilibrate, hiPSC‐CMs were washed once with nonbuffered RPMI supplemented with 10 mmol/L glucose, 2 mmol/L sodium pyruvate, and 2 mmol/L glutamine. Cells were maintained in 525 µL of XF Assay medium at 37 °C in a non‐CO2 incubator for 1 hour. Agilent Seahorse XF24 Analyzer (Agilent Seahorse Bioscience) was used to analyze the mitochondrial function of the cells by sequential injections of modulators. A mixture of oligomycin (2 µmol/L), carbonyl cyanide‐4‐(trifluoromethoxy) phenylhydrazone (1 µmol/L), and rotenone (0.5 µmol/L) were suspended in a prewarmed XF Assay medium and loaded into the injection ports (75 µL) of the hydrated sensor cartridge corresponding to the order of injection. Each measurement cycle consisted of 3 minutes of mixing, 2 minutes of waiting, and 3 minutes of measurements of oxygen consumption respiration. Measurement cycles were performed after each addition of the given compounds. The data were analyzed using Wave 2.6 and Report Generator Version: 4.0.
Ca2+ Transient Imaging
Live cell imaging of intracellular Ca2+ transients was performed with dye Fluo‐4 AM (Thermo Fisher Scientific). Cells were incubated in Tyrode solution 25 containing Fluo‐4 AM at a final concentration of 10 μmol/L in the dark at 37 °C for 20 minutes followed by a gentle wash at room temperature in prewarm Tyrode solution. Fluorescence images were acquired using the Image Xpress Micro XLS System (Molecular Devices) with excitation/emission at 488/515 to 600 nm at a rate of 5 frames per second and ×10 magnification for 4 fields per well.
Video‐Based Contractility Measurement
Contractility of spontaneously beating hiPSC‐CMs was recorded using a phase‐contrast inverted microscope (Axio Vert.A1) equipped with Zeiss Axio Cam digital camera system.
Videos were recorded for 30 seconds (5 frames/s) under ×10 magnification and were processed and exported using Zeiss AxioVision LE imaging software. Videos were converted to frame by frame image sequence using ImageJ (National Institutes of Health). Video‐based analysis of contractility was performed using MATLAB and motion vector software (R2016b; MathWorks). 26
Probe Preparation and Traction Force Measurement
Turn on tension gauge tether (TGT) probes were used to measure molecular traction forces. DNA duplexes were conjugated to the fibronectin mimic cyclic‐Arg‐Gly‐Asp‐Phe‐Lys (Phe is D isomer) (cRGDfK), fluorophore (Cy3B), and quencher (BHQ) using previously published protocols. 27 , 28 The duplex was tethered to a surface using biotin‐streptavidin binding. When integrin receptors apply sufficient tension, the duplex will mechanically denature and specifically when the applied force exceeds the tension tolerance of the probe. The shearing TGT with a tension tolerance of 56 pN was used as described previously. 29 Glass surfaces were activated and functionalized with streptavidin. Next, biotinylated DNA tension probes were added. 3D hiPSC‐CMs were treated with carfilzomib for 1 day, dissociated, and then reseeded on the DNA‐modified glass surfaces. Microscopy imaging of spontaneously contracting cells was performed using a Nikon TIRF microscope with ×100 objectives.
Measurements of Sarcomere Length and Cell Structure
3D‐derived hiPSC‐CMs were treated with carfilzomib for 1 day, and then dissociated and reseeded on the glass‐bottom microplates. Cells were stained with antibodies against α‐actinin, and microscopy imaging was performed using a Nikon TIRF microscope in reflection interference contrast microscopy and TRITC channels with ×100 objectives. ImageJ software was used to quantify cell morphology, cell spread area, circularity, and aspect ratio. A program was written to obtain automated outlining of cells. To measure the z‐lines, individual z‐lines were selected, and lengths were measured per cell. For each cell, the average length of ≈20 to 30 z‐lines was plotted.
RNA Sequencing
Total RNA was isolated from day 30 hiPSC‐CMs in biological triplicates following 1 day of carfilzomib treatment using Aurum total RNA mini kit (Bio‐Rad) according to the manufacturer’s instructions. RNA concentrations were measured using Nanodrop Spectrophotometer (Thermo Fisher Scientific). Library preparation and RNA‐seq was conducted by Novogene with 20 M reads per sample, PE150 Mapped Homo sapiens (GRCh38/hg38) to the genome using STAR (v2.6.1d) with ensemble annotation. Fastp was used for length limitation of adapter trimming (https://github.com/novogene‐europe/fastp). The differentially expressed genes were used for analyses of gene ontology (GO) terms and Kyoto Encyclopedia of Genes and Genomes pathways, which were considered significantly enriched if the adjusted P<0.05.
Proteomic Analysis
Cells and culture media were collected from the triplicates of 3D hiPSC‐CM cultures following 1 day of carfilzomib treatment. Proteins were extracted from 3 to 4×10⁶ hiPSC‐CMs per sample by suspending the cells in the lysis buffer as described previously. 30 Proteins were purified through methanol‐chloroform precipitation. For the secretome analysis, the media was passed through a filter (0.45 µm) and then concentrated by centrifugation (molecular weight 3 kDa cutoff). Proteins were digested with trypsin overnight. Then, purified peptides were labeled with the 6‐plex tandem mass tag reagents for protein quantitation. The tandem mass tag–labeled samples (6 for the cell lysates and 6 for the secretomes) were mixed and fractionated. Each fraction was analyzed by liquid chromatography‐tandem mass spectrometry. The data analyses were conducted as reported previously. 30
Statistical Analysis
Statistical analyses were done using GraphPad Prism version 8.00. Global differences were evaluated by Dunnett and Turkey test (1‐way ANOVA). P<0.05 was taken as statistically significant. Results are presented as mean±SD in all experiments. Sample sizes are indicated in figure legends. For group comparison of gene expression in RNA‐seq analysis, Benjamin‐Hochberg correction was used to control false‐discovery rate. We considered genes to be significantly differentially expressed between the two groups if adjusted P<0.05 and absolute value of log2 (fold change) >1.
RESULTS
Carfilzomib Treatment Induced a Dose‐ and Duration‐Dependent Cardiotoxicity
To examine whether carfilzomib treatment causes cytotoxicity in hiPSC‐CMs, we generated enriched hiPSC‐CMs (>90% NKX2.5‐positive cells), treated the cells with various doses of carfilzomib, and characterized the cells 24 and 48 hours after treatment (Figure 1A and 1B). We used a common chemotherapeutic drug, doxorubicin, at 10 µmol/L (a peak plasma concentration) as a control. 31 Following carfilzomib treatment, we observed dose‐ and duration‐dependent increase of cell loss in carfilzomib‐treated cultures compared with DMSO‐treated cultures (Figure 1C). As detected by CellTiter Blue assay, cultures treated with carfilzomib at 10 μmol/L and doxorubicin for 24 hours had lower cell viabilities compared with cultures treated with DMSO. The cell viability in cultures treated with carfilzomib for 48 hours began to decrease at doses as low as 0.1 μmol/L, which is significantly lower than the peak concentration of the carfilzomib observed in patients’ plasma after intravenous administration. 32 , 33 Given that hiPSC‐CM spheroids (3D cultures) provide a more physiologically relevant context for drug toxicity, 34 we examined whether carfilzomib could also induce cytotoxicity in 3D cultures. We generated hiPSC‐CM spheroids using microscale tissue engineering 23 and treated them with carfilzomib for 24 hours. Using calcein and ethidium bromide as indicators for live and dead cells, respectively, we found that cultures treated with carfilzomib at 10 μmol/L and doxorubicin had increased dead cells (ethidium bromide–positive cells), whereas moderate toxicity was also observed in cultures treated with carfilzomib at 0.1 and 1 μmol/L (Figure 1D). These results suggest that carfilzomib induced dose‐dependent cytotoxicity in both 2‐dimensional and 3D cultures.
To determine the mechanism of cell death, we examined caspase3/7 activity using Caspase‐Glo 3/7 Luminescent assay. Increased caspase3/7 activation was detected after carfilzomib treatment for 24 hours, indicating that carfilzomib‐induced cytotoxicity might be the result of apoptosis (Figure 1E).
Carfilzomib Treatment Increased Mitochondrial Superoxide and Reduced Mitochondrial Function of hiPSC‐CMs
Oxidative stress through generation of mitochondrial superoxide and mitochondrial dysfunction plays important roles in cellular cytotoxicity, 35 , 36 which could affect cardiac function. 37 , 38 , 39 We therefore examined the effect of carfilzomib treatment on mitochondrial oxidative stress and mitochondrial function. Based on fluorescence intensity of MitoSOX, a mitochondrial superoxide indicator, the relative levels of mitochondrial superoxide were higher in cultures treated with carfilzomib at 1 and 10 μmol/L compared with DMSO‐treated cultures (Figure 1F).
To examine if carfilzomib induced cytotoxicity through oxidative stress, we evaluated if ascorbic acid, a commonly used antioxidant, could rescue carfilzomib‐induced cell loss. Compared with carfilzomib‐treated cultures without ascorbic acid, the carfilzomib‐treated cultures with ascorbic acid had significantly attenuated cell loss when cells were treated with carfilzomib at 0.01, 0.1, and 1 μmol/L (Figure 1G), suggesting that carfilzomib‐induced cytotoxicity is in part mediated by oxidative stress.
We also examined the effect of carfilzomib treatment on mitochondria membrane potential by staining the cells with tetramethylrhodamine methyl ester, a cell‐permeant fluorescent dye that is sequestered by active mitochondria. hiPSC‐CMs treated with carfilzomib at 0.1, 1, and 10 μmol/L had >10‐fold reduced levels of tetramethylrhodamine methyl fluorescence intensity (Figure 2A and 2B). These results indicate a substantial decrease in mitochondrial membrane potential and increase in mitochondrial superoxide following carfilzomib treatment, suggesting that oxidative stress could play an important role in carfilzomib‐mediated cardiac cytotoxicity.
Figure 2. Cfz treatment reduced mitochondrial function of human induced pluripotent stem cell‐derived cardiomyocytes (hiPSC‐CMs).

A, Measurement of TMRM fluorescence 24 hours after Cfz treatment. Nuclei were counterstained with Hoechst. Scale bar=100 µm. B, Summary of TMRM MFI analyzed by ArrayScan (n=5 cultures). C, Effects of Cfz treatment on the expression of genes related to mitochondrial function in hiPSC‐CMs (n=3 cultures). Gene expression is normalized to the housekeeping gene GAPDH and shown as relative levels to the control (DMSO treated) group. D, Representative traces of oxygen consumption rate recording in hiPSC‐CMs upon sequential treatments with oligomycin, FCCP, and a mixture of rotenone and antimycin A. E, Quantification of ATP production, basal respiration, and maximal respiration (n=4 cultures). The results were normalized to 1×10⁶ cells. F, Relative cellular ATP content in 3‐dimensional hiPSC‐CMs 24 hours after Cfz treatment as measured by an ATP‐based luminescence assay (n=5 cultures). *P<0.05; **P<0.01; ***P<0.001; ****P<0.0001. Cfz indicates carfilzomib; COQ10A, coenzyme Q10A; DMSO, dimethyl sulfoxide; FCCP, carbonyl cyanide‐4‐(trifluoromethoxy) phenylhydrazone; MFI, mean fluorescence intensity; MFN1, mitofusin 1; MFN2, mitofusin 2; NDUFB8, NADH:ubiquinone oxidoreductase subunit B8; OCR, oxygen consumption rate; OPA1, OPA1 mitochondrial dynamin like GTPase; TMRM, tetramethyl rhodamine methyl; and UCP3, uncoupling protein 3.
To understand the effects of carfilzomib on mitochondrial function, we examined the expression of genes associated with mitochondrial function and performed a Seahorse XF Cell Mito stress test 1 day after carfilzomib treatment. Carfilzomib treatment caused a dose‐dependent decrease in the expression of genes associated with mitochondrial function, including COQ10A (coenzyme Q10A), MFN1 (mitofusin 1), MFN2 (mitofusin 2), and NDUFB5 (NADH:ubiquinone oxidoreductase subunit B8), but not OPA1 (OPA1 mitochondrial dynamin like GTPase) and UCP3 (uncoupling protein 3) (Figure 2C). The basal and maximal respiratory capacity and ATP production (serving as an indicator of mitochondrial function) were measured by monitoring oxygen consumption respiration after sequential injection of oligomycin, carbonyl cyanide‐4‐(trifluoromethoxy) phenylhydrazone, and rotenone according to the manufacture's instruction. As shown in Figure 2D and 2E, a significant decrease in ATP production was detected following the treatment of carfilzomib at 0.1, 1, and 10 μmol/L in SCVI‐273 hiPSC‐CMs. The reduced ATP levels were also observed in 3D cultures treated with carfilzomib as detected by CellTiter‐Glo viability assay (Figure 2F). Higher concentrations of carfilzomib (10 μmol/L) also decreased the basal and maximal mitochondrial respiration in SCVI‐273 hiPSC‐CMs (Figure 2D and 2E). Similarly, carfilzomib treatment reduced ATP production and basal mitochondrial respiration in IMR90 hiPSC‐CMs (data not shown). These results suggest that carfilzomib induces mitochondrial damage and consequently the cardiotoxicity.
Carfilzomib Treatment Induced Abnormal Ca2+ Transients and Dysfunctional Contractility
There is increasing evidence that alteration in mitochondrial function results in increased ROS generation and abnormal Ca2+ transients. 37 , 40 Considering the link of oxidative stress and Ca2+ transients, we analyzed the Ca2+ transient profile 24 hours after carfilzomib treatment. Carfilzomib treatment of SCVI‐273 hiPSC‐CMs increased the proportion of cells with abnormal Ca2+ transients (Figure 3A). Consistently, carfilzomib treatment decreased the expression of genes associated with Ca2+ handling (SLC8A1 [solute carrier family 8 member A1], RYR2 [ryanodine receptor 2], CASQ2 [calsequestrin 2], and ATP2A2 [ATPase sarcoplasmic/endoplasmic reticulum Ca2+ transporting 2]) (Figure 3B). The downregulation of these genes is consistent with the abnormal Ca2+ transients following carfilzomib treatment. These results indicate that carfilzomib treatment impairs Ca2+ transients at the single cell level, which may affect the contractility function of hiPSC‐CMs.
Figure 3. Cfz increased abnormal intercellular Ca2+ transients of human induced pluripotent stem cell‐derived cardiomyocytes (hiPSC‐CMs) and decreased the expression of genes associated with Ca2+ handling.

A, Representative Ca2+ transient traces from each group and summary of cells with normal and abnormal Ca2+ transients (n=9–58 cells). hiPSC‐CMs were treated with Cfz for 24 hours and measured for Ca2+ transients. Numbers shown on the stack bars represents percentages of cells with normal and abnormal Ca2+ transients. B, Relative expression levels of genes associated with Ca2+ handling in hiPSC‐CMs treated with Cfz for 24 hours (n=3 cultures). *P<0.05; **P<0.01. ATP2A2 indicates ATPase sarcoplasmic/endoplasmic reticulum Ca2+ transporting 2; CASQ2, calsequestrin 2; Cfz, carfilzomib; DMSO, dimethyl sulfoxide; RYR2, ryanodine receptor 2; and SLC8A1, solute carrier family 8 member A1.
To address if mitochondrial dysfunction along with abnormal Ca2+ transients was associated with contractile dysfunction in carfilzomib‐treated hiPSC‐CMs, we assessed the contractility of 3D hiPSC‐CM static spheroids after treatment with carfilzomib for 24 and 48 hours using video microscopy with motion vector analysis. Cessations in contraction occurred in cultures treated with all concentrations (0.01, 0.1, 1, and 10 µmol/L) of carfilzomib for 48 hours. At 24 hours after carfilzomib treatment, a portion of hiPSC‐CM spheroids treated with carfilzomib at 0.01 µmol/L or doxorubicin and all spheroids treated with 0.1, 1, and 10 µmol/L stopped beating (Figure 4A). Similar results of cessations in contraction were observed in hiPSC‐CMs derived from both SCVI‐273 and IMR90 lines treated with carfilzomib at high doses. The average maximum contraction, maximum relaxation velocity, and the beat rate remained unchanged in the remaining beating cells from cultures treated with carfilzomib at 0.01 µmol/L or doxorubicin compared with those from DMSO‐treated cultures (Figure 4B and 4C). Additionally, carfilzomib reduced the expression of genes associated with contractility (MYH6 [myosin heavy chain 6] and MYL2 [myosin light chain 2]) (Figure 4D). These data suggest that carfilzomib increases contractile dysfunction after treatment.
Figure 4. Cfz treatment induced contractility dysfunction in 3‐dimensional (3D) human induced pluripotent stem cell‐derived cardiomyocytes (hiPSC‐CMs).

A, Pie chart representing proportions of spheroids with or without beating arrest 24 hours after Cfz treatment (n=16–60 cardiac spheroids). B, Contractility of static 3D hiPSC‐CMs was video recorded and analyzed using MATLAB. Representative heat maps and graphs of averaged magnitude of beating speed over time in Cfz‐treated hiPSC‐CMs. Red cycles and blue triangles represent contraction and relaxation, respectively. Note: hiPSC‐CMs stopped beating following 24 hours of treatment of Cfz at 0.1, 1, and 10 µmol/L. C, Quantification of contraction, relaxation, and beating rate among groups (n=14–17 cardiac spheroids). D, Expression of genes encoding contractile proteins MYH6 (myosin heavy chain 6) and MYL2 (myosin light chain 2) detected by quantitative reverse transcription–polymerase chain reaction (n=3 cultures). Cfz indicates carfilzomib; and DMSO, dimethyl sulfoxide.
Carfilzomib Treatment Reduced Traction Forces and Caused Structural Disorganization
To further examine the carfilzomib‐induced alteration in contraction, we used a DNA duplex TGT probe 29 to measure integrin‐mediated traction forces in single cardiomyocytes. The TGT probe was modified with a fibronectin mimetic ligand (cyclic‐RGD [the tripeptide consists of arginine, glycine, and aspartate]), fluorophore (Cy3B), and quencher. When cell integrins bind to the RGD ligand and transmit a threshold magnitude of tension greater than the probe’s tension tolerance (56 pN), the duplex mechanically denatures, and the fluorophore separates from the quencher. Because the biotin‐anchored nucleic acid is also fluorescently tagged, shearing of the top strand leads to ≈20‐fold enhancement in fluorescence. Moreover, the fluorescence signal is directly proportional to the number of probes that experiences a threshold force exceeding 56 pN; therefore, the fluorescence signal provides a quantitative readout of integrin traction forces (Figure 5A). 3D hiPSC‐CMs were treated with carfilzomib for 1 day, dissociated, and then reseeded onto the glass surface with the TGT probe. We then quantified the fluorescence signal of single cardiomyocytes upon plating to monitor the traction forces of spontaneously contracting cardiomyocytes. As shown in Figure 5B and 5C, the traction forces of hiPSC‐CMs decreased in cultures treated with carfilzomib at 0.01, 0.1, 1, and 10 µmol/L or doxorubicin compared with DMSO‐treated cells. Thus, carfilzomib reduced integrin‐mediated traction forces.
Figure 5. Cfz treatment reduced the traction forces of human induced pluripotent stem cell‐derived cardiomyocytes (hiPSC‐CMs).

For quantification of molecular traction forces of spontaneously contracting cardiomyocytes, hiPSC‐CMs were treated for 1 day with Cfz and reseeded on the glass bottom microplates coated with the DNA probes through biotin streptavidin conjugation. A, Illustrative model of traction force measurement principle. The probes were decorated with peptide mimic (cRGDfk) of fibronectin, a fluorophore (Cy3B), and quencher (BHQ‐2). Fluorescence intensity of the probes on the surface increases upon rupturing of the probes when cells contract and apply a force to the probes greater than the force tolerance of around 56 pN. B, Summary of traction force measurement in hiPSC‐CMs treated with Cfz vs DMSO (n=20–30 cells). ****P<0.0001. C, Representative traction force microscopy of hiPSC‐CMs after Cfz treatment. Scale bar=12 µm. Cfz indicates carfilzomib; DMSO, dimethyl sulfoxide; pN, pico newton; RICM, reflection interference contrast microscopy; and TGT, tension gauge tether.
To evaluate if structural changes were accompanied with the alteration in contraction induced by carfilzomib treatment, we measured the cell structure of hiPSC‐CMs after carfilzomib treatment by immunocytochemistry of α‐actinin, a protein expressed in z‐lines of cardiomyocytes. Cells treated with carfilzomib at 1 and 10 µmol/L lacked clear z‐lines, whereas the DMSO‐treated cells and cells treated with carfilzomib at 0.01 and 0.1 µmol/L had clear z‐lines (Figure 6A). We also quantified cell size and shape along with sarcomere length to identify the link between the shape and contraction. Cells treated with higher concentrations of carfilzomib (1 and 10 µmol/L) showed decreased cell area compared with DMSO‐treated cells; these cells also had irregular peripheral borders resulting in an increased circularity (Figure 6B). In addition, cells treated with carfilzomib at 0.01 and 0.1 µmol/L or doxorubicin had shorter z‐line length and sarcomere length compared with DMSO‐treated cells (Figure 6B). These results indicate that carfilzomib treatment can induce significant structural alteration parallel with contractility dysfunction.
Figure 6. Cfz treatment led to structural alterations in human induced pluripotent stem cell‐derived cardiomyocytes (hiPSC‐CMs).

hiPSC‐CMs were treated with Cfz for 24 hours, fixed, and stained with antibodies against α‐actinin. Cells were imaged using fluorescence microscopy and quantitatively analyzed. A, Representative RICM and fluorescence images of hiPSC‐CMs treated with Cfz. Scale bar=12 µm. B, Summary of structural parameters of hiPSC‐CMs after Cfz treatment (n=20–30 cells). **P<0.01; ****P<0.0001. Note that Cfz treatment significantly decreased the spread area, z‐line length, and sarcomere length and increased circularity. Cells treated with Cfz at 1 and 10 µmol/L did not show clear striation and z lines. Cfz indicates carfilzomib; DMSO, dimethyl sulfoxide; and RICM, reflection interference contrast microscopy.
Transcriptomic and Proteomic Analyses Revealed That Carfilzomib Dysregulated Genes Related to Stress Response, Extracellular Matrix, and Contractility
To further elucidate the mechanism of carfilzomib‐induced alteration in contractility, we compared global gene expression profile of hiPSC‐CMs treated with carfilzomib at 1 µmol/L for 24 hours with DMSO‐treated cells. RNA‐seq analysis identified 5027 genes that were differentially expressed based on absolute log2 (fold change) >1 and adjusted P<0.05. Compared with DMSO‐treated cells, 1913 genes were upregulated, whereas 3114 genes were downregulated in carfilzomib‐treated cells (Figure 7A). For example, carfilzomib induced downregulation of genes involved in cardiac muscle contraction (eg, ACTA2 [actin alpha‐2, smooth muscle]) and integrin complex (eg, ITGA11 [integrin subunit alpha 11]). In addition, genes related to heat shock stress were upregulated, including HSPA1B (heat shock protein family A member 1B), HSPA6 (heat shock protein family A member 60), HSPH1 (heat shock protein family H member 1), and BAG3 (BAG cochaperone 3), which participate in cellular response to stress, cell death, and apoptosis.
Figure 7. Cfz treatment altered global gene expression in human induced pluripotent stem cell‐derived cardiomyocytes (hiPSC‐CMs).
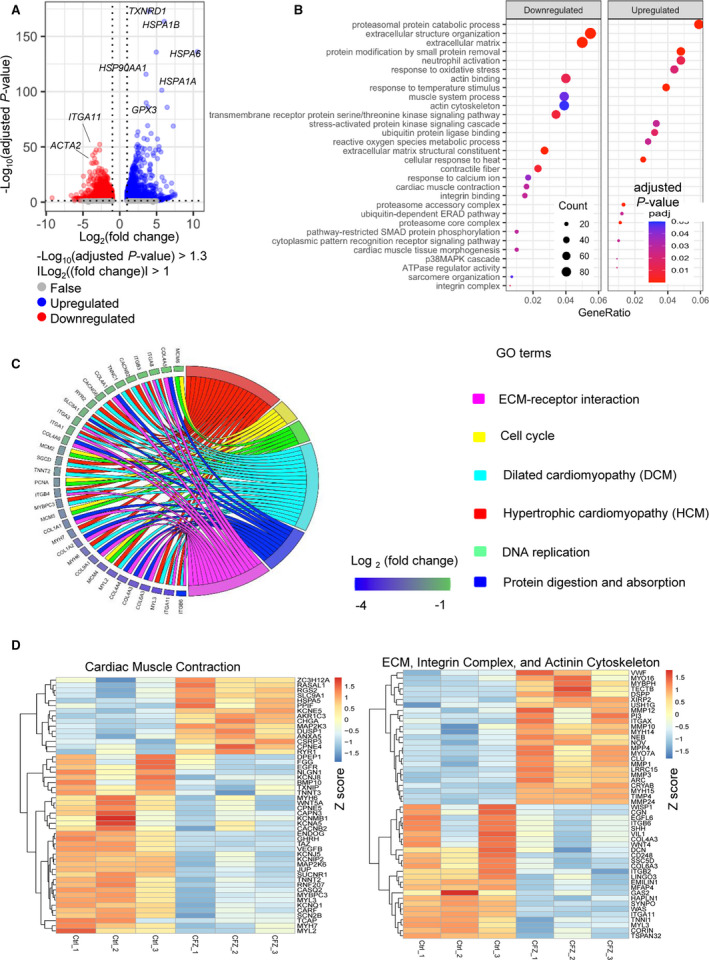
Gene expression profiling of hiPSC‐CMs after treatment with 1 μmol/L Cfz for 24 hours was analyzed by RNA sequencing (n=3 cultures). DEGs in cells after Cfz were compared with those in the cells treated with DMSO. Volcano plot representing 3114 downregulated genes and 1913 upregulated genes are depicted in the red and blue dots, respectively. DEGs between the 2 groups were defined based on adjusted P<0.05 and the absolute value of log2 (fold change) ≥1. B, Bubble plots representing enrichment analysis of DEGs using GO enrichment analysis. C, Chord diagram of relationship between selected GO terms and relevant DEGs. Each GO term is shown on the right, and genes contributing to these enrichments are presented on the left. Colored squares next to each gene indicate log2 (fold change) from the highest to the lowest level. D, Heatmap of DEGs associated with cardiac muscle contraction (left) and ECM, integrin complex, and actinin cytoskeleton (right). Red color indicated relatively high expression and blue color indicated relatively low expression based on Z score. ACTA2 indicates actin alpha 2, smooth muscle; AKR1C3, aldo‐keto reductase family 1 member C3; ANXA5, annexin A5; ARC, activity regulated cytoskeleton associated protein; BMP10, bone morphogenetic protein 10; CACNB2, calcium voltage‐gated channel auxiliary subunit beta 2; CACNG6, calcium voltage‐gated channel auxiliary subunit gamma 6; CAPN3, calpain 3; CARF, calcium responsive transcription factor; CASQ2, calsequestrin 2; CCDC80, coiled‐coil domain containing 80; CD248, CD248 molecule; Cfz, carfilzomib; CGN, cingulin; CHGA, chromogranin A; CLU, clusterin; COL1A1, collagen type I alpha 1 chain; COL1A2, collagen type I alpha 2 chain; COL3A1, collagen type III alpha 1 chain; COL4A1, collagen type IV alpha 1 chain; COL4A3, collagen type IV alpha 3 chain; COL4A4, collagen type IV alpha 4 chain; COL4A5, collagen type IV alpha 5 chain; COL4A6, collagen type IV alpha 6 chain; COL6A3, collagen type VI alpha 3 chain; COL9A1, collagen type IX alpha 1 chain; CORIN, corin, serine peptidase; CPNE4, copine 4; CPNE5, copine 5; CRYAB, crystallin alpha B; CSRP3, cysteine and glycine rich protein 3; DCN, decorin; DEGs, differentially expressed genes; DMSO, dimethyl sulfoxide; DPEP1, dipeptidase 1; DUSP1, dual specificity phosphatase 1; ECM, extracellular matrix; EGFL6, EGF like domain multiple 6; EGFR, epidermal growth factor receptor; EMILIN1, elastin microfibril interfacer 1; ENDOG, endonuclease G; FERMT3, FERM domain containing kindlin 3; FLNC, filamin C; FN1, fibronectin 1; GAA, alpha glucosidase; GAS2, growth arrest specific 2; GO, gene ontology; GPX3, glutathione peroxidase 3; HAPLN1, hyaluronan and proteoglycan link protein 1; HMGCR, 3‐hydroxy‐3‐methylglutaryl‐CoA reductase; HSP90AA1, heat shock protein 90 alpha family class A member 1; HSPA1A, heat shock protein family A; HSPA1B, heat shock protein family A; HSPA5, heat shock protein family A; HSPA6, heat shock protein family A; ITGA1, integrin subunit alpha 1; ITGA11, integrin subunit alpha 11; ITGA3, integrin subunit alpha 3; ITGA8, integrin subunit alpha 8; ITGAX, integrin subunit alpha X; ITGB3, integrin subunit beta 3; ITGB4, integrin subunit beta 4; ITGB6, integrin subunit beta 6; JUP, junction plakoglobin; KCNA5, potassium voltage‐gated channel subfamily A member 5; KCNE5, potassium voltage‐gated channel subfamily E regulatory subunit 5; KCNIP2, potassium voltage‐gated channel interacting protein 2; KCNJ5, potassium inwardly rectifying channel subfamily J member 5; KCNJ8, potassium inwardly rectifying channel subfamily J member 8; KCNMB1, potassium calcium‐activated channel subfamily M regulatory beta subunit 1; KCNQ1, potassium voltage‐gated channel subfamily Q member 1; LRRC15, leucine rich repeat containing 15; MAFG, MAF bZIP transcription factor G; MAP2K3, mitogen‐activated protein kinase kinase 3; MAP2K6, mitogen‐activated protein kinase kinase 6; MCM2, minichromosome maintenance complex component 2; MCM4, minichromosome maintenance complex component 4; MCM5, minichromosome maintenance complex component 5; MCM6, minichromosome maintenance complex component 6; MFAP4, microfibril associated protein 4; MMP1, matrix metallopeptidase 1; MMP10, matrix metallopeptidase 10; MMP12, matrix metallopeptidase 12; MMP24, matrix metallopeptidase 24; MMP3, matrix metallopeptidase 3; MPP4, membrane palmitoylated protein 4; MSN, moesin; MUC4, mucin 4, cell surface associated; MYBPC3, myosin binding protein C3; MYBPH, myosin binding protein H; MYH14, myosin heavy chain 14; MYH15, myosin heavy chain 15; MYH6, myosin heavy chain 6; MYH7, myosin heavy chain 7; MYL2, myosin light chain 2; MYL3, myosin light chain 3; MYO16, myosin XVI; MYO7A, myosin VIIA; NEB, nebulin; NLGN1, neuroligin 1; NTN1, netrin 1; PCNA, proliferating cell nuclear antigen; PHOSPHO1, phosphoethanolamine/phosphocholine phosphatase 1; PHPT1, phosphohistidine phosphatase 1; PKM, pyruvate kinase M1/2; POSTN, periostin; PPIF, peptidylprolyl isomerase F; RASAL1, RAS protein activator like 1; RELL2, RELT like 2; RGS2, regulator of G protein signaling 2; RND3, Rho family GTPase 3; RNF207, ring finger protein 207; RYR1, ryanodine receptor 1; RYR2, ryanodine receptor 2; SCN2B, sodium voltage‐gated channel beta subunit 2; SCN5A, sodium voltage‐gated channel alpha subunit 5; SERPINE1, serpin family E member 1; SGCD, sarcoglycan delta; SHH, sonic hedgehog signaling molecule; SLC8A1, solute carrier family 8 member A1; SLC9A1, solute carrier family 9 member A1; SOD1, superoxide dismutase 1; SSC5D, scavenger receptor cysteine rich family member with 5 domains; ST13, ST13 Hsp70 interacting protein; SUCNR1, succinate receptor 1; SYNPO, synaptopodin; TAFAZZIN, tafazzin, phospholipid‐lysophospholipid transacylase; TCAP, titin‐cap; TIMP4, TIMP metallopeptidase inhibitor 4; TNNC1, troponin C1, slow skeletal and cardiac type; TNNI1, troponin I1, slow skeletal type; TNNT2, troponin T2, cardiac type; TNNT3, troponin T3, fast skeletal type; TSPAN32, tetraspanin 32; TXNIP, thioredoxin interacting protein; TXNRD1, thioredoxin reductase 1; VCP, valosin containing protein; VEGFB, vascular endothelial growth factor B; VIL1, villin 1; WAS, WASP actin nucleation promoting factor; WNT5A, Wnt family member 5A; XIRP2, xin actin binding repeat containing 2; and ZC3H12A, zinc finger CCCH‐type containing 12A.
We also performed analysis of GO terms using the differentially expressed genes. GO terms related to oxidative stress, heat shock proteins (HSPs) and proteasomal protein catabolic process were upregulated, and GO terms related to extracellular matrix (ECM) and cardiac contraction were downregulated (Figure 7B, Table 2). In line with carfilzomib‐mediated mitochondrial oxidative stress, carfilzomib induced upregulation of GO terms including response to oxidative stress, ROS metabolic process, response to temperature stimulus, and cellular response to heat. In contrast, carfilzomib induced downregulation of GO terms of extracellular structure organization, extracellular matrix, actin binding, muscle system process, actin cytoskeleton, transmembrane receptor protein serine/threonine kinase signaling pathway, ECM structural constituent, contractile fiber, response to calcium ion, cardiac muscle contraction, and integrin binding and pathway‐restricted Smad protein phosphorylation.
Table 2.
Top Downregulated GO Terms Based on DEGs
| GO term | Category | No. of genes | GO term ID | Adjusted P value | Enrichment |
|---|---|---|---|---|---|
| Extracellular matrix | Biological process | 106 | GO:0031012 | 1.24E‐17 | 3.2 |
| Extracellular structure organization | Cellular component | 108 | GO:0043062 | 2.02E‐12 | 3 |
| Extracellular matrix structural constituent | Morphological function | 54 | GO:0005201 | 1.37E‐10 | 3.6 |
| Contractile fiber | Biological process | 49 | GO:0043292 | 0.006207 | 2.3 |
| Transmembrane receptor protein serine/threonine kinase signaling pathway | Cellular component | 68 | GO:0007178 | 0.007959 | 2.1 |
| Integrin complex | Morphological function | 12 | GO:0008305 | 0.010804 | 3.4 |
| Actin binding | Morphological function | 79 | GO:0003779 | 0.012514 | 2 |
| Integrin binding | Biological process | 29 | GO:0005178 | 0.027535 | 2.5 |
| Pathway‐restricted Smad protein phosphorylation | Biological process | 19 | GO:0060389 | 0.028713 | 3.1 |
| Cardiac muscle contraction | Biological process | 31 | GO:0060048 | 0.028713 | 2.7 |
| Cardiac muscle tissue morphogenesis | Biological process | 20 | GO:0055008 | 0.028713 | 3.2 |
| Response to calcium ion | Biological process | 34 | GO:0051592 | 0.03831 | 2.4 |
| Muscle system process | Biological process | 77 | GO:0003012 | 0.044283 | 1.8 |
| Sarcomere organization | Cellular component | 14 | GO:0045214 | 0.046017 | 3.4 |
| Actin cytoskeleton | Cellular component | 83 | GO:0015629 | 0.048669 | 1.7 |
DEGs indicates differentially expressed genes; and GO, gene ontology.
The top downregulated genes based on fold change included those involved in integrin and ECM (ITGA11, MEGF6 [multiple EGF like domains 6], FJX1 [four‐jointed box kinase 1], MFAP4 [microfibril associated protein 4], CCDC80 [coiled‐coil domain containing 80], and FNDC10 [fibronectin type III domain containing 10]), mitochondria (SLIT3 [slit guance ligand 3], DUT [deoxyurine triphosphatase], PCK2 [phosphoenolpyruvate carboxykinase 2, mitochondrial], and ATP6V0E2 [ATPase H+ transporting V0 subunit E2]) and muscle contraction/tight junction (ACTA2 [actin alpha 2, smooth muscle] and SYNPO [Synaptopodin]) (Table 3). The top upregulated genes included genes involved in response to oxidative stress, heat stress, and ROS metabolic process, including HSPA1B, HSPA1A (heat shock protein family H member 1), DNAJA1 (DnaJ heat shock protein family member A1), BAG3, and HSP90AB1 (heat shock protein 90 alpha family class B member 1) (Table 4). Additionally, carfilzomib upregulated genes involved in mitogen‐activated protein kinase‐mediated signaling cascade (MAP2K3) and downregulated genes involved in Smad pathway (BMP10 and BMP7) (Figure 7B). Carfilzomib also altered the expression of genes associated with ECM‐receptor interaction, cell cycle, protein digestion and absorption, dilated cardiomyopathy, and hypertrophic cardiomyopathy (Figure 7C).
Table 3.
Top Downregulated DEGs
| Gene ID | Gene symbol | Description of full name | Adjusted P value | Log2, fold change |
|---|---|---|---|---|
| ENSG00000177943 | MAMDC4 | MAM domain containing 4 | 4.94E‐56 | −9.199087572 |
| ENSG00000171992 | SYNPO | Synaptopodin | 8.84E‐51 | −6.60093912 |
| ENSG00000104738 | MCM4 | Minichromosome maintenance complex component 4 | 1.11E‐50 | −6.261530975 |
| ENSG00000137809 | ITGA11 | Integrin subunit alpha 11 | 2.58E‐48 | −6.196870403 |
| ENSG00000184347 | SLIT3 | Slit guance ligand 3 | 5.13E‐46 | −6.157781163 |
| ENSG00000156427 | FGF18 | Fibroblast growth factor 18 | 6.14E‐43 | −6.150872209 |
| ENSG00000185567 | AHNAK2 | AHNAK nucleoprotein 2 | 3.69E‐39 | −6.083552672 |
| ENSG00000128951 | DUT | Deoxyurine triphosphatase | 7.18E‐39 | −6.012024116 |
| ENSG00000225138 | None | None | 1.01E‐38 | −5.979760829 |
| ENSG00000166482 | MFAP4 | Microfibril associated protein 4 | 2.35E‐38 | −5.973236912 |
| ENSG00000107796 | ACTA2 |
Actin alpha 2, smooth muscle |
4.87E‐34 | −5.900336258 |
| ENSG00000162591 | MEGF6 | Multiple EGF like domains 6 | 5.24E‐33 | −5.883525697 |
| ENSG00000179431 | FJX1 | Four‐jointed box kinase 1 | 1.35E‐31 | −5.691046545 |
| ENSG00000157637 | SLC38A10 | Solute carrier family 38 member 10 | 2.21E‐31 | −5.669748257 |
| ENSG00000171130 | ATP6V0E2 | ATPase H+ transporting V0 subunit e2 | 8.55E‐31 | −5.627308177 |
| ENSG00000129103 | SUMF2 | Sulfatase modifying factor 2 | 9.96E‐31 | −5.615074065 |
| ENSG00000100889 | PCK2 | Phosphoenolpyruvate carboxykinase 2, mitochondrial | 1.01E‐30 | −5.606701278 |
| ENSG00000228594 | FNDC10 | Fibronectin type III domain containing 10 | 1.94E‐30 | −5.571960443 |
| ENSG00000091986 | CCDC80 | Coiled‐coil domain containing 80 | 6.85E‐30 | −5.561040949 |
| ENSG00000100297 | MCM5 | Minichromosome maintenance complex component 5 | 2.30E‐29 | −5.547162364 |
DEGs indicates differentially expressed genes.
Table 4.
Top Upregulated DEGs
| Gene ID | Gene symbol | Description of full name | P value | Log2, fold change |
|---|---|---|---|---|
| ENSG00000198431 | TXNRD1 | (Thioredoxin reductase 1) | 4.82E‐178 | 4.006453 |
| ENSG00000204388 | HSPA1B | Heat shock protein family A (Hsp70) member 1B | 3.04E‐168 | 6.043998 |
| ENSG00000173110 | HSPA6 | Heat shock protein family A (Hsp70) member 6 | 1.07E‐140 | 10.52902 |
| ENSG00000178381 | ZFAND2A | Zinc finger AN1‐type containing 2A | 3.06E‐140 | 4.963423 |
| ENSG00000080824 | HSP90AA1 | Heat shock protein 90 alpha family class A member 1 | 4.45E‐120 | 3.567891 |
| ENSG00000204389 | HSPA1A | Heat shock protein family H (Hsp110) member 1 | 1.35E‐105 | 5.713138 |
| ENSG00000120694 | HSPH1 | Heat shock protein family H (Hsp110) member 1 | 4.87E‐94 | 3.593188 |
| ENSG00000151929 | BAG3 |
BAG cochaperone 3 |
2.72E‐90 | 3.825662 |
| ENSG00000187134 | AKR1C1 | Aldo‐keto reductase family 1 member C1 | 7.03E‐90 | 6.435566 |
| ENSG00000211445 | GPX3 | Glutathione peroxidase 3 | 2.76E‐73 | 3.792141 |
| ENSG00000248713 | C4orf54 | Chromosome 4 open reading frame 54 | 7.41E‐73 | 7.267963 |
| ENSG00000096384 | HSP90AB1 | Heat shock protein 90 alpha family class B member 1 | 1.18E‐67 | 2.472503 |
| ENSG00000132002 | DNAJB1 | DnaJ heat shock protein family (Hsp40) member B1 | 4.49E‐66 | 4.255973 |
| ENSG00000013275 | PSMC4 | Proteasome 26S subunit, ATPase 4 | 3.71E‐64 | 2.343216 |
| ENSG00000150991 | UBC | Ubiquitin C | 1.83E‐61 | 3.294192 |
| ENSG00000272899 | ATP6V1FNB | (ATP6V1F neighbor) | 6.66E‐61 | 5.123917 |
| ENSG00000023909 | GCLM | Glutamate‐cysteine ligase modifier subunit | 2.35E‐60 | 3.747229 |
| ENSG00000116161 | CACYBP | Calcyclin binding protein | 7.54E‐56 | 2.419254 |
| ENSG00000197170 | PSMD12 | Proteasome 26S subunit, non‐ATPase 12 | 1.96E‐54 | 2.627123 |
DEGs indicates differentially expressed genes.
We further analyzed the differentially expressed genes based on Z scores. As shown in the heatmap (Figure 7D), the expression of genes related to cardiac muscle contraction was dramatically downregulated in carfilzomib‐treated cells compared with DMSO‐treated cells. These genes included response to calcium ion (TNNT2 [troponin T2, cardiac type], EEF2K [eukaryotic elongation factor 2 kinase], CARF [calcium responsive transcription factor], MYL3 [myosin light chain 3], MAP2K6 [mitogen‐activated protein kinase kinase 6], MYB [MYB proto‐oncogene, transcription factor], KCNJ5 [potassium inwardly rectifying channel subfamily J member 5], KCNQ1 [potassium voltage‐gated channel subfamily Q member 1], TNNT2, MYH7 [myosin heavy chain 7], RYR2, and CASQ2), calcium responsive proteins (RYR2, SLC25A12 [solute carrier family 25 member 12], CASQ2, and KCNMB1), and contractile proteins (SYNPO [synaptopodin], ACTA2, FLNC [filamin C], BMF [Bcl2 modifying factor], MYL3, MYO1D [myosin ID], ZNF185 [zinc finger protein 185 with LIM domain], TNNI1 [troponin I1, slow skeletal type], TNNT3 [troponin T3, fast skeletal type], MYL2, MYL5 [myosin light chain 5], MYLK [myosin light chain kinase], MYO5C [myosin VC], MYO15B [myosin XVB], MYH6, and MYL7 [myosin light chain 7]). In addition, carfilzomib‐dysregulated genes were involved in ECM, integrin complex, and actinin cytoskeleton. These genes included ITGA11, SYNPO, SLC6A4 [solute carrier family 6 member 4], CASQ2, TNNI1, and MYL3 (Figure 7D).
To examine the effect of carfilzomib at the protein level, we performed quantitative proteomic analysis on both the cell supernatant and cell lysate of hiPSC‐CMs treated with carfilzomib at 1 µmol/L versus DMSO for 24 hours. Out of the 4060 proteins quantified in the cell lysate, 183 proteins were upregulated, and 39 proteins were downregulated (Figure 8A). Out of the 298 proteins detected in the cell supernatant, 6 proteins were upregulated, and 18 proteins were downregulated after carfilzomib treatment (P<0.05, absolute fold change >1.3) (Figure 8B). The downregulated proteins in the cell lysate included ANXA6 (annexin A6, a calcium‐dependent membrane and phospholipid binding protein), SPTN1 (spectrin alpha, non‐erythrocytic 1, a filamentous cytoskeletal protein highly expressed in cardiac muscle at z‐disc), and TPM1 (tropomyosin 1, a protein that forms a complex with troponin T and regulates actin‐myosin interaction in response to intracellular Ca2+ concentration).
Figure 8. Profiling of proteins after Cfz treatment by proteomics.

DEPs were identified with abundance change by >1.3‐fold (absolute log2 [fold change] >0.38) compared with the DMSO‐treated group (n=3 cultures). A and B, Volcano plot illustrating proteins in the cell lysate (right) and secreted proteins (left) with statistically significant abundance differences. Significantly upregulated proteins are marked in blue, and significantly downregulated proteins are in red. C and D, Venn diagram showing overlapping of DEGs and DEPs after Cfz treatment in the cell lysate and the secretome. E, Bubble plot represents selected GO terms based on overlapped DEGs and DEPs with significant upregulation. ANX6 indicates annexin 6; ATG101, autophagy related 101; CDKN1A, cyclin dependent kinase inhibitor 1A; Cfz, carfilzomib; C1S complement C1s; COL1A2, collagen type I alpha 2 chain; COL3A1, collagen type III alpha 1 chain; COL3A1, collagen type III alpha 1 chain; DEGs, differentially expressed genes; DEPs, differentially expressed proteins; DMSO, dimethyl sulfoxide; FLNC, filamin C; FN1, fibronectin 1; GO, gene ontology; HMGCR, 3‐hydroxy‐3‐methylglutaryl‐CoA reductase; HSPA1A, heat shock protein family A, Hsp70 member 1A; HSPA1A, heat shock protein family A, Hsp70 member 1A; HSPA1A, heat shock protein family A, Hsp70 member 1A; KCTD10, potassium channel tetramerization domain containing 10; MAFG, MAF bZIP transcription factor G; MFAP4, microfibril associated protein 4; MSN, moesin; Not Found; PHPT1, phosphohistidine phosphatase 1; PKM, pyruvate kinase M1/2; POSTN, periostin; RNA‐seq, RNA sequencing; RND3, Rho family GTPase 3; SERPINE1, serpin family E member 1; ST13, ST13 Hsp70 interacting protein; TPM, tropomyosin; VCP, valosin containing protein; and VCP, valosin containing protein.
As shown in Figure 8A, carfilzomib treatment reduced the expression of proteins in the cells associated with metabolic process, including pyruvate kinase M2 (PKM2), which is involved in glycolysis and regulates cardiomyocyte cell cycle, and protein kinase cAMP‐activated catalytic subunit alpha (PRKACA), which is the catalytic subunit α of protein kinase A that contributes to the control of glucose metabolism and cell division. The downregulated proteins were associated with GO terms of metabolic process (PRKACA [protein kinase cAMP‐activated catalytic subunit alpha], SDHAF2 [succinate dehydrogenase complex assembly factor 2], PGAM2 [phosphoglycerate mutase 2], GOT1 [glutamic‐oxaloacetic transaminase 1], IMPA1 [inositol monophosphatase 1], CLEC16A [C‐type lectin domain containing 16A], and ATM [ATM serine/threonine kinase]), mitochondrion organization (SDHFA2, GGCT [gamma‐glutamylcyclotransferase], and MICOS13 [mitochondrial contact site and cristae organizing system subunit 13]), striated muscle contraction (PRKACA, GSTM2 [glutathione S‐transferase mu 2], PGAM2, TPM1, and RCSD1 [RCSD domain containing 1]), oxidation reduction (FDX1 [ferredoxin 1], HADH [hydroxyacyl‐CoA dehydrogenase], IDH3G [isocitrate dehydrogenase (NAD(+) 3 non‐catalytic subunit gamma], PGAM2, PKM [pyruvate kinase M1/2], TPI1 [triosephosphate isomerase 1], and SDHAF2), and muscle system process (ANXA [annexin A], GSTM2 [glutathione S‐transferase mu 2], PGAM2, PRKACA, TPM1, and RCSD1) (Figure 9A, Table 5).
Figure 9. Profiling of protein changes in response to Cfz treatment in human induced pluripotent stem cell‐derived cardiomyocytes.

A and B, GO‐term enrichment of the downregulated and upregulated proteins in the cell lysate. C, GO‐term enrichment of the downregulated secreted proteins. D, Pearson correlation of biological triplicate experiments of control group (C1–3) and Cfz‐treated group (T1–3). Pearson correlation coefficient (r) values are depicted for each group. Cfz indicates carfilzomib; and GO, gene ontology.
Table 5.
Top Downregulated DEPs in Cell Lysate
| Protein ID | Protein symbol | Description of full name | P value | Log2 (fold change) |
|---|---|---|---|---|
| P28161 | GSTM2 | Glutathione S‐transferase mu 2 | 0.000199 | −0.37869 |
| Q5XKP0 | QIL1 (MICOS13) | Mitochondrial contact site and cristae organizing system subunit 13 | 0.000256 | −0.38072 |
| P14618 | PKM | Pyruvate kinase M1/2 | 0.000615 | −0.3854 |
| O15067 | PFAS | Phosphoribosylformylglycinamidine synthase | 0.001144 | −0.39249 |
| Q14254 | FLOT2 | Flotillin 2 | 0.001165 | −0.39616 |
| Q9H0R4 | HDHD2 | Haloacid dehalogenase like hydrolase domain containing 2) | 0.00178 | −0.39726 |
| P29218 | IMPA1 | Inositol monophosphatase 1 | 0.002187 | −0.39969 |
| P30041 | PRDX6 | Peroxiredoxin 6 | 0.002598 | −0.40337 |
| P08243 | ASNS | Asparagine synthetase (glutamine‐hydrolyzing) | 0.003198 | −0.40509 |
| P60174 | TPI1 | Triosephosphate isomerase 1 | 0.003513 | −0.40568 |
| Q3MHD2 | LSM12 | LSM12 homolog | 0.004002 | −0.40938 |
| P48509 | CD151 | CD151 molecule (Raph blood group) | 0.004477 | −0.4101 |
| P15259 | PGAM2 | Phosphoglycerate mutase 2 | 0.005065 | −0.41576 |
| Q16836 | HADH | Hydroxyacyl‐CoA dehydrogenase | 0.005345 | −0.41756 |
| Q99541 | PLIN2 | (Perilipin 2) | 0.006138 | −0.42144 |
| Q9Y235 | APOBEC2 | Apolipoprotein B mRNA editing enzyme catalytic subunit 2 | 0.006633 | −0.42492 |
| Q13813‐2 | SPTAN1 | Spectrin alpha, non‐erythrocytic 1 | 0.006885 | −0.43392 |
| O60669 | SLC16A7 | Solute carrier family 16 member 7 | 0.008852 | −0.43623 |
| Q96AX9 | MIB2 | Mindbomb E3 ubiquitin protein ligase 2 | 0.009051 | −0.44424 |
| P51553 | IDH3G | Isocitrate dehydrogenase (NAD (+) 3 non‐catalytic subunit gamma) | 0.009335 | −0.44433 |
| P08133 | ANXA6 | Annexin A6 | 0.009685 | −0.46695 |
| P17174 | GOT1 | Glutamic‐oxaloacetic transaminase 1 | 0.011001 | −0.47138 |
| P10109 | FDX1 | (Ferredoxin 1) | 0.014375 | −0.47543 |
| P43007 | SLC1A4 | Solute carrier family 1 member 4 | 0.014845 | −0.48642 |
| P30046 | DDT | D‐dopachrome tautomerase | 0.017058 | −0.50283 |
| Q13315 | ATM | ATM serine/threonine kinase | 0.0171 | −0.50678 |
| P34949 | MPI | Mannose phosphate isomerase | 0.018324 | −0.50884 |
| Q8IYM0 | FAM186B | Family with sequence similarity 186 member B | 0.018496 | −0.51545 |
| Q9NX18 | SDHAF2 | Succinate dehydrogenase complex assembly factor 2 | 0.021519 | −0.51609 |
| P80723 | BASP1 | Brain abundant membrane attached signal protein 1 | 0.022129 | −0.52675 |
| O75223 | GGCT | Gamma‐glutamylcyclotransferase) | 0.022945 | −0.53503 |
| P17612 | PRKACA | Protein kinase cAMP‐activated catalytic subunit alpha | 0.02751 | −0.55372 |
| P00374 | DHFR | Dihydrofolate reductas | 0.027565 | −0.5787 |
| Q8N111 | CEND1 | Cell cycle exits and neuronal differentiation 1 | 0.033353 | −0.61374 |
| B7Z596 | TPM1 | Tropomyosin 1 | 0.033428 | −0.72819 |
DEPs indicates differentially expressed proteins.
The enriched GO terms of upregulated proteins in the cells included cellular response to stress, ubiquitin‐dependent protein catabolic process, protein folding, regulation of cellular response to heat, cell death, and stress‐activated mitogen‐activated protein kinase cascade (Figure 9B). In addition, proteins associated with oxidative stress, autophagy, apoptosis and cell cycle were upregulated in the cells, including MAFG (MAF bZIP transcription factor G, a transcription factor that is induced following oxidative stress), ATG101 (autophagy related 101, an essential protein for the initiation of autophagy), RND3 (Rho family GTPase 3, a member of the small Rho GTPase family that regulates apoptosis), and CDKN1A (cyclin dependent kinase inhibitor 1, Figure 8A, Table 6).
Table 6.
Top Upregulated DEPs in Cell Lysate
| Protein ID | Protein symbol | Description of full name | P value | Log2, fold change |
|---|---|---|---|---|
| P17066 | HSPA6 | Heat shock protein family A (Hsp70) member 6 | 5.85E‐06 | 2.920214 |
| Q8N6M9 | ZFAND2A | Zinc finger AN1‐type containing 2A | 8.86E‐06 | 2.792291 |
| P18847 | ATF3 | Activating transcription factor 3 | 2.03E‐05 | 2.655011 |
| Q15327 | ANKRD1 | Ankyrin repeat domain 1 | 2.93E‐05 | 2.301373 |
| O76080 | ZFAND5 | Zinc finger AN1‐type containing 5 | 5.43E‐05 | 2.210395 |
| P08107 | HSPA1A | Heat shock protein family A (Hsp70) member 1A | 6.26E‐05 | 2.166783 |
| P38936 | CDKN1A | Cyclin dependent kinase inhibitor 1 | 7.03E‐05 | 2.135166 |
| Q9H0R8 | GABARAPL1 | GABA type A receptor associated protein like 1 | 8.41E‐05 | 1.985212 |
| P25685 | DNAJB1 | DnaJ heat shock protein family (Hsp40) member B1 | 0.000163 | 1.945932 |
| P04035 | HMGCR | 3‐hydroxy‐3‐methylglutaryl‐CoA reductase | 0.000211 | 1.855423 |
| P61587 | RND3 | Rho family GTPase 3 | 0.000249 | 1.649824 |
| Q01581 | HMGCS1 | 3‐hydroxy‐3‐methylglutaryl‐CoA synthase 1 | 0.000271 | 1.626212 |
| O15525 | MAFG | MAF bZIP transcription factor G | 0.000284 | 1.601714 |
| Q9H3F6 | KCTD10 | Potassium channel tetramerization domain containing 10 | 0.00037 | 1.507235 |
| Q9UDY4 | DNAJB4 | DnaJ heat shock protein family (Hsp40) member B4 | 0.000379 | 1.484945 |
| P54868 | HMGCS2 | 3‐hydroxy‐3‐methylglutaryl‐CoA synthase 2 | 0.000395 | 1.463084 |
| P02792 | FTL | Ferritin light chain | 0.000444 | 1.432189 |
| Q9UBU8 | MORF4L1 | Mortality factor 4 like 1 | 0.000498 | 1.42401 |
| Q9BYN0 | SRXN1 | Sulfiredoxin 1 | 0.000514 | 1.416937 |
| Q92963 | RIT1 | Ras like without CAAX 1 | 0.000551 | 1.341017 |
| P02511 | CRYAB | (Crystallin alpha B) | 0.000627 | 1.330892 |
| Q9UH92 | MLX | MAX dimerization protein MLX) | 0.000713 | 1.30305 |
| Q92598 | HSPH1 | (Heat shock protein family H (Hsp110) member 1) | 0.00072 | 1.288595 |
| Q99608 | NDN | Necdin, MAGE family member | 0.000767 | 1.265368 |
| Q9BY42 | RTFDC1 | Replication termination factor 2 | 0.000826 | 1.221335 |
| Q13501 | SQSTM1 | Sequestosome 1 | 0.000845 | 1.207748 |
| P78362 | SRPK2 | SRSF protein kinase 2 | 0.000887 | 1.198661 |
| Q9Y5A7 | NUB1 | Negative regulator of ubiquitin like proteins 1 | 0.000906 | 1.194131 |
| P68133 | ACTA1 | Actin alpha 1, skeletal muscle | 0.000913 | 1.178388 |
| O60333‐3 | KIF1B | Kinesin family member 1B | 0.000962 | 1.153891 |
| P62699 | YPEL5 | Yippee like 5 | 0.001058 | 1.125207 |
| O75794 | CDC123 | Cell division cycle 12 | 0.001082 | 1.097219 |
| O95817 | BAG3 | BAG cochaperone 3 | 0.001229 | 1.091382 |
| O43164 | PJA2 | Praja ring finger ubiquitin ligase 2 | 0.001327 | 1.058091 |
| Q07352 | ZFP36L1 | ZFP36 ring finger protein like 1 | 0.00139 | 1.046927 |
| O14950 | MYL12B | Myosin light chain 12B | 0.001602 | 1.007005 |
| Q9UGL1 | KDM5B | Lysine demethylase 5B | 0.001648 | 0.977882 |
| P24844 | MYL9 | Myosin light chain 9 | 0.001717 | 0.966276 |
| Q9UK73 | FEM1B | Fem‐1 homolog B | 0.00174 | 0.953693 |
| Q8TEY7 | USP33 | Ubiquitin specific peptidase 33 | 0.001752 | 0.948084 |
| P0CG47 | UBB | Ubiquitin B | 0.001801 | 0.928962 |
| P46976 | GYG1 | Glycogenin 1 | 0.001869 | 0.926016 |
DEPs indicates differentially expressed proteins.
The downregulated proteins in the secretome included POSTN (periostin), C1S (complement C1s), THBS1 (thrombospondin 1), and COL3A1 (collagen type III alpha 1 chain) (Figure 8B, Table 7). THBS1 is an adhesive glycoprotein that mediates cell‐to‐cell and cell‐to‐ECM interactions, COL3A1 provides instructions for making type III collagen that strengthens and supports cardiac tissue, and POSTN is a ligand for integrins providing the support for cell adhesion. The downregulated proteins in secretome are associated with GO terms including extracellular matrix organization, cell‐matrix adhesion, and cell motility (Figure 9C) and Kyoto Encyclopedia of Genes and Genomes pathways including tight junction and DNA replication (Table 8). In addition, upregulation of HSPA1A was observed in both the cells and the secretome (Figure 8A and 8B, Table 7).
Table 7.
Top Dysregulated DEPs in Secretome
| Protein ID | Protein symbol | Description of full name | P value | Log2, fold change |
|---|---|---|---|---|
| P01009 | SERPINA1 | Serpin family A member 1 | 0.002177 | −1.01851 |
| P09871 | C1S | Complement C1s | 0.005218 | −0.71786 |
| Q9UBP4 | DKK3 | Dickkop WNT signaling pathway inhibitor 3 | 0.00526 | 0.74339 |
| P08107 | HSPA1A | Heat shock protein family A (Hsp70) member 1A | 0.005936 | 1.115906 |
| Q15063 | POSTN | Periostin | 0.006501 | −0.55999 |
| O60814 | HIST1H2BK | H2B clustered | 0.006567 | −0.27213 |
| P55083 | MFAP4 | Microfibril associated protein 4 | 0.007602 | −0.69158 |
| Q86UP2 | KTN1 | Kinectin 1 | 0.011208 | 0.152319 |
| Q12841 | FSTL1 | Follistatin like 1 | 0.012976 | −0.5254 |
| P08238 | HSP90AB1 | Heat shock protein 90 alpha family class B member 1 | 0.013136 | −0.13566 |
| P02461 | COL3A1 | Collagen type III alpha 1 chain | 0.013179 | −0.55331 |
| P26038 | MSN | Moesin | 0.013885 | 0.42732 |
| O95373 | IPO7 | Importin 7 | 0.014671 | −0.63705 |
| P11142 | HSPA8 | Heat shock protein family A (Hsp70) member 8 | 0.016105 | 0.364134 |
| P31946 | YWHAB | Tyrosine 3‐monooxygenase/tryptophan 5‐monooxygenase activation protein beta) | 0.016696 | 0.35428 |
| P08123 | COL1A2 | Collagen type I alpha 2 chain | 0.017711 | −0.45736 |
| Q14315 | FLNC | Filamin C | 0.021456 | 0.693258 |
| P02751 | FN1 | Fibronectin 1 | 0.021493 | −0.54779 |
| P13929 | ENO3 | Enolase 3 | 0.024012 | −0.33332 |
| Q7Z7M1 | GPR144 | ADGRD2‐ adhesion G protein‐coupled receptor D2 | 0.024362 | 3.30262 |
| P55072 | VCP | Valosin containing protein | 0.025906 | 0.830314 |
| P05121 | SERPINE1 | Serpin family E member 1 | 0.027676 | 0.433167 |
| P26038 | MSN | Moesin | 0.013885 | 0.42732 |
| P50502 | ST13 | ST13 Hsp70 interacting protein | 0.044477 | 0.412665 |
DEPs indicates differentially expressed proteins.
Table 8.
Downregulated DEPs in Secretome and Their Association With KEGG Pathways
| Gene ID | Protein symbol | Description of full name | P value | Log2, fold change | KEGG pathway |
|---|---|---|---|---|---|
| ENSG00000177943 | MAMDC4 | MAM domain containing 4 | 4.94E‐56 | −9.19909 | None |
| ENSG00000171992 | SYNPO | Synaptopodin | 8.84E‐51 | −6.60094 | N/A |
| ENSG00000104738 | MCM4 | Minichromosome maintenance complex component 4 | 1.11E‐50 | −6.26153 | (ko04530) Tight junction; (hsa04530) Tight junction |
| ENSG00000137809 | ITGA11 | Integrin subunit alpha 11 | 2.58E‐48 | −6.19687 | (ko03030) DNA replication; (hsa03030) DNA replication; (ko04110) Cell cycle |
| ENSG00000184347 | SLIT3 | Slit guidance ligand 3 | 5.13E‐46 | −6.15778 | (ko05412) Arrhythmogenic right ventricular cardiomyopathy (ARVC); (hsa05412) Arrhythmogenic right ventricular cardiomyopathy; (ko04512) ECM‐receptor interaction |
| ENSG00000156427 | FGF18 | Fibroblast growth factor 18 | 6.14E‐43 | −6.15087 | (ko04360) Axon guidance; (hsa04360) Axon guidance |
| ENSG00000185567 | AHNAK2 | AHNAK nucleoprotein 2 | 3.69E‐39 | −6.08355 | (ko05218) Melanoma; (hsa05218) Melanoma; (ko05224) Breast cancer |
| ENSG00000128951 | DUT | Deoxyuridine triphosphatase | 7.18E‐39 | −6.01202 | N/A |
| ENSG00000225138 | SLC9A3‐AS1 | None | 1.01E‐38 | −5.97976 | (ko00240) Pyrimidine metabolism; (hsa00240) Pyrimidine metabolism; (hsanan01) drug metabolism |
DEPs indicates differentially expressed proteins; and KEGG, Kyoto Encyclopedia of Genes and Genomes.
Comparison of the proteomic and transcriptomic data revealed a set of overlapping genes and proteins that were differentially expressed in response to carfilzomib treatment (Figure 8C and 8D). We performed additional GO‐term analysis using these overlapping genes and proteins (Figure 8E, Table 9). The enriched GO terms included response to heat, HSP binding, and ATPase regulator activity (Figure 8E). Several pathways were upregulated, including apoptotic signaling (ATF3 [activating transcription factor 3], CDKN1A, DNAJA1, HSPA1A, SERPINE1 [serpin family E member 1], BAG3, and USP47 [ubiquitin specific peptidase 47]), stress‐activated mitogen‐activated protein kinase cascade (CRYAB, HMGCR [3‐hydroxy‐3‐methylglutaryl‐CoA reductase], DNAJA1, SKP1 [S‐Phase Kinase Associated Protein 1], and UBB [ubiquitin B]) and ATPase activity (DNAJA1, DNAJB1 [DnaJ heat shock protein family (Hsp40) member B1], BAG3, HSPH1, and DNAJB4 [DnaJ heat shock protein family (Hsp40) member B4]) (Table 9). We note that RNA‐seq was analyzed using hiPSC‐CMs derived from the SCVI‐273 line, and proteomics analysis was performed using hiPSC‐CMs derived from IMR‐90 hiPSCs. The consistency in the alterations in the expression of these overlapping genes and proteins in 2 cell lines suggests that the observed alterations induced by carfilzomib treatment are independent of the cell lines used.
Table 9.
GO Terms and KEGG Pathways Associated With Overlapped Genes/Proteins Identified by DEPs From Cell Lysate and DEGs by RNA‐seq
| Description | Category | Count | GO/KEGG term ID | Adjusted P value | Enrichment |
|---|---|---|---|---|---|
| Response to heat | GO term biological processes | 15 | GO:0009408 | 1E‐15 | 40 |
| Heat shock protein binding | GO term molecular functions | 10 | GO:0031072 | 7.9E‐10 | 35 |
| ATPase regulator activity | GO term molecular functions | 6 | GO:0060590 | 5E‐07 | 65 |
| ATPase activator activity | GO term molecular functions | 4 | GO:0001671 | 0.00016 | 71 |
| Ferroptosis | KEGG pathway | 4 | ko04216 | 0.00079 | 44 |
| Necroptosis | KEGG pathway | 6 | hsa04217 | 0.00079 | 16 |
| Tau protein binding | GO term molecular functions | 4 | GO:0048156 | 0.001 | 39 |
| Myeloid cell activation involved in immune response | GO term biological processes | 9 | GO:0002275 | 0.00126 | 7.3 |
| Chaperone‐mediated autophagy | GO term biological processes | 3 | GO:0061684 | 0.00158 | 83 |
| Positive regulation of ATPase activity | GO term biological processes | 4 | GO:0032781 | 0.002 | 32 |
| Apoptotic signaling pathway | GO term biological processes | 9 | GO:0097190 | 0.00251 | 6.5 |
| ATPase activity | GO term molecular functions | 7 | GO:0016887 | 0.00501 | 8.3 |
| Regulation of ATPase activity | GO term biological processes | 4 | GO:0043462 | 0.00631 | 22 |
| Cellular response to interleukin 1 | GO term biological processes | 5 | GO:0071347 | 0.01 | 12 |
| Interleukin 1–mediated signaling pathway | GO term biological processes | 4 | GO:0070498 | 0.01259 | 17 |
| Stress‐activated MAPK cascade | GO term biological processes | 5 | GO:0051403 | 0.05012 | 7.7 |
| Regulation of extrinsic apoptotic signaling pathway | GO term biological processes | 4 | GO:2001236 | 0.05012 | 11 |
| Intrinsic apoptotic signaling pathway | GO term biological processes | 5 | GO:0097193 | 0.05012 | 7.7 |
| Regulation of intrinsic apoptotic signaling | GO term biological processes | 4 | GO:2001242 | 0.0631 | 11 |
| Response to oxidative stress | GO Biological Processes | 6 | GO:0006979 | 0.0631 | 5.8 |
| Extrinsic apoptotic signaling pathway via death domain receptors | GO term biological processes | 3 | GO:0008625 | 0.1 | 15 |
| Regulation of reactive oxygen species metabolic process | GO term biological processes | 4 | GO:2000377 | 0.1 | 8.9 |
| Autophagy | GO term biological processes | 6 | GO:0006914 | 0.11749 | 4.9 |
| Positive regulation of cell death | GO term biological processes | 7 | GO:0010942 | 0.12589 | 4.2 |
| Pathways in cancer | KEGG pathway | 6 | hsa05200 | 0.15136 | 4.6 |
| Mitogen‐activated protein kinase (MAPK) signaling pathway | KEGG pathway | 4 | ko04010 | 0.19953 | 7 |
| Apoptotic mitochondrial changes | GO term biological processes | 3 | GO:0008637 | 0.2138 | 11 |
| ATPase activity, coupled | GO term molecular functions | 4 | GO:0042623 | 0.2138 | 6.8 |
| Macro autophagy | GO term biological processes | 4 | GO:0016236 | 0.35481 | 5.6 |
| Cellular senescence | KEGG pathway | 3 | hsa04218 | 0.42658 | 7.7 |
| Oxidoreductase activity | GO molecular functions | 6 | GO:0016491 | 0.43652 | 3.5 |
| PI3K‐Akt signaling pathway | KEGG pathway | 4 | ko04151 | 0.4466 | 5.2 |
| Regulation of Ras protein signal transduction | GO term biological processes | 3 | GO:0046578 | 0.56234 | 6.8 |
| Regulation of MAPK cascade | GO term biological processes | 5 | GO:0043408 | 0.025119 | 2.9 |
| Wnt signaling pathway | GO term biological processes | 4 | GO:0016055 | 0.031623 | 3.4 |
| Cell‐cell signaling by wnt | GO term biological processes | 4 | GO:0198738 | 0.031623 | 3.4 |
| Retina‐expressed kinase (ERK)1 and ERK2 cascade | GO term biological processes | 3 | GO:0070371 | 0.039811 | 4 |
| Regulation of mitogen‐activated protein kinase activity | GO term biological processes | 3 | GO:0043405 | 0.039811 | 3.8 |
DEGs indicates differentially expressed genes; DEPs, differentially expressed proteins; GO, gene ontology; KEGG, Kyoto Encyclopedia of Genes and Genomes; and RNA‐seq, RNA sequencing.
In addition, carfilzomib treatment upregulated several ubiquitin‐related proteins. As detected by RNA‐seq, ubiquitin C was among the top 20 upregulated proteins (Table 4). Proteomic analysis of cell lysates also revealed that several ubiquitin‐related proteins were upregulated, including negative regulator of ubiquitin like proteins 1, praja ring finger ubiquitin ligase 2, ubiquitin specific peptidase 33, and ubiquitin B (Table 6). GO‐term analysis of differentially expressed proteins identified ubiquitin protein ligase binding (n=44) and ubiquitin‐dependent ERAD (endoplasmic reticulum‐associated degradation) pathway (n=16). These changes may indicate the direct effect of carfilzomib on the ubiquitin‐proteasome pathway.
Taken together, the transcriptomic and proteomic analyses of hiPSC‐CMs indicate that downregulation of contractile‐related genes/proteins, and ECM and integrin‐related genes/proteins together with upregulation of HSPs and stress‐activated pathways were associated with cardiac‐toxic effects of carfilzomib treatment.
DISCUSSION
Using molecular tension sensors to quantify cellular traction forces in combination with high‐throughput imaging, functional assessments, and transcriptomic and proteomic analyses, we investigated mechanisms of earlier cellular and molecular events associated with alterations of contraction after carfilzomib treatment in hiPSC‐CMs. Our results suggest a possible role of ECM and integrin‐related genes in contractility and traction force defects as an early response to carfilzomib treatment. We also identified increased mitochondrial oxidative stress, reduced mitochondrial function, abnormal Ca2+ transients, and changes in the sarcomere structure and cell morphology that might impact the contractile potency and traction forces of hiPSC‐CMs after carfilzomib treatment. Transcriptomic and proteomic analyses highlighted an important role of the genes involved in ECM signaling including integrin and actin filaments. In parallel, our study revealed an increase in genes associated with stress response (eg, HSPs). These results suggest that cardiotoxicity can result from the cumulative response to both off‐target and on‐target effects of carfilzomib treatment.
Since the Food and Drug Administration’s approval of carfilzomib in 2012, there has been increasing evidence surrounding carfilzomib‐associated adverse cardiovascular events including cardiac arrest and cardiac arrhythmias. 1 , 3 , 4 , 6 Carfilzomib is also considered as an approved drug with repurposing potential for mechano‐based therapeutic interventions, 41 although integrin‐mediated contraction alteration of cardiomyocytes after carfilzomib treatment has not yet been characterized. This is the first study that applies a piconewton tension sensor to examine cytotoxic effects of carfilzomib on hiPSC‐CMs. Using the TGT probes, we found that carfilzomib decreased integrin‐mediated traction forces of hiPSC‐CMs as measured by changes in fluorescence intensity on the probes because of contraction of individual cells. Our study provides a new avenue of mechano‐pharmacology platform to study the impact of carfilzomib at molecular and cellular levels.
Recent evidence illustrates off‐target effects of carfilzomib treatment in animal models; however, mechanisms underlying contraction alteration after carfilzomib treatment in cardiomyocytes have not been fully characterized. Our findings indicate the possibility of on‐target and off‐target effects of carfilzomib on human cardiac cells. Using RNA‐seq, we identified early transcriptomic signatures of carfilzomib‐induced cardiotoxicity and important genes/pathways that might mediate carfilzomib‐induced cell death and contraction defects. Following a 24‐hour treatment of hiPSC‐CMs with carfilzomib, there was significant upregulation of genes and related proteins involved in cellular stress. In particular, RNA‐seq revealed that carfilzomib treatment induced the overexpression of genes encoding HSPs including HSPA1B, HSPA1A, and HSPA6. Consistent with our RNA‐seq data, the proteomic analysis also confirmed upregulation of HSPs in both the cell lysate and the secretome, including HSPAB1, and HSPA1A as well as molecules that act as cochaperones including DNAJA&B, HSPH1, ZFAND2A, and CRYAB. It has been reported that proteasome inhibitors such as bortezomib can upregulate HSPs, 42 and targeting HSPs has been considered to overcome resistance to chemotherapeutic agents such as imatinib and cisplatin. 43 HSP90 has been found to assist in degrading toxic metabolites by promoting ubiquitination and proteasome lysis. 44 Overexpression of HSPs is also linked to many pathological conditions, 45 , 46 and increased HSPs have a protective function by blocking apoptosis, which allows cells to survive in otherwise lethal conditions. 47 , 48 It is likely that increased HSPs may overcome the toxic effect of the inhibition of proteasomes after carfilzomib treatment in hiPSC‐CMs. Given that increased HSPs are detectable in the secretome following the carfilzomib treatment, these HSPs may serve as biomarkers for early detection of carfilzomib‐induced cardiotoxicity.
Our results highlight the possible role of the ECM and integrins in contractility defects as an early response to carfilzomib treatment. Alterations in ECM can impact cardiomyocyte function. 49 , 50 ECM and secreted proteins are important components of the stroma, which could play important roles in the cell‐cell communication and regulation of cell process including contraction. 51 Integrins are sensors that transmit mechanical signals to ion channels. 52 The results of the GO term analysis indicate that genes belong to the ECM, integrin complex, and actinin cytoskeleton proteins were downregulated in carfilzomib‐treated cells. Carfilzomib treatment also downregulated genes associated with cardiac muscle cell contraction, including contractile proteins (eg, MYL2 and MYH6) and Ca2+ handing proteins. In line with RNA‐seq data, our proteome data in both cell lysate and secretome also indicate significant reduction of proteins related to both contraction and ECM including POSTN, COL3A1, THBS1, C1S, ANXA6, and TPM.
The current results demonstrate that carfilzomib interferes with mitochondrial function as indicated by reduced ATP production and respiration, increased mitochondrial ROS, and decreased mitochondrial membrane potentials. The reduced mitochondrial function and cellular energy impairment may contribute to cardiomyocyte dysfunction, which is consistent with previously published in vivo off‐target effects of carfilzomib. 53 Increased mitochondrial ROS is known to be associated with cytotoxicity. 35 , 38 , 54 We also found similar results of increased mitochondrial ROS by treating hiPSC‐CMs with doxorubicin, a cancer therapy drug with well‐known cardiovascular toxicity effect because of the generation of ROS, 55 , 56 reduced contractile capacity, 57 and adverse effect on Ca2+ transport. 31 The increased mitochondrial ROS and decreased mitochondrial function in carfilzomib‐treated hiPSC‐CMs were also associated with the downregulation of genes associated with mitochondrial function such as nicotinamide adenine dinucleotide (NADH) ubiquinone oxidoreductase subunit AB1, which is a crucial regulator of mitochondrial energy and ROS metabolism through coordinating the assembly of respiratory complexes. 58 In addition, our proteomic analysis indicated downregulation of SDHFA2, a member of succinate dehydrogenase complex, which plays essential roles in both the mitochondrial electron transport chain and the tricarboxylic acid cycle.
Consistent with the findings on increased mitochondrial oxidative stress, defects in mitochondrial function, and increased gene expression and proteins related to response to oxidative stress in carfilzomib‐treated hiPSC‐CMs, we found that cell death in carfilzomib‐treated hiPSC‐CMs could be rescued by targeting oxidative stress with ascorbic acid. These results suggest that oxidative stress plays an important role in carfilzomib‐induced cytotoxicity and that antioxidants have the potential for cardioprotective therapy.
The carfilzomib‐induced mitochondrial changes may lead to other functional alterations including abnormal Ca2+ signaling. On the other hand, abnormal Ca2+ signaling can induce alterations in respiratory chain complexes, which lead to increased mitochondrial oxidative stress and reduced mitochondrial membrane potential. 35 , 37 Our results showed a significant increase in Ca2+ transient abnormalities after carfilzomib treatment, which is consistent with clinical observations showing arrhythmias after chemotherapeutic drugs as a common phenomenon. 40 , 59 In pathological conditions, Ca2+ overload is accompanied by alterations in mitochondrial function and mitochondrial membrane potential, 37 , 38 , 60 and abnormal Ca2+ transients can be an indicator for proarrhythmic behavior of cardiomyocytes. 61 In cardiomyocytes, the interplay between Ca2+ signaling and mitochondrial function is necessary to maintain normal cardiac function. 22 , 37 Carfilzomib treatment of hiPSC‐CMs significantly downregulated several genes encoding Ca2+ handling proteins, including RYR2 and CASQ2, which play a critical role in excitation–contraction coupling in cardiomyocytes. Consistently, carfilzomib treatment increased abnormal Ca2+ transients in hiPSC‐CMs. Our findings support that possible mechanisms of carfilzomib‐induced cardiotoxicity are associated with abnormal Ca2+ signaling and mitochondrial oxidative stress, contributing to the development of arrhythmias after carfilzomib treatment.
We also found that carfilzomib treatment reduced the expression of proteins associated with metabolic process. For example, carfilzomib reduced the expression of glucose metabolism‐related enzymes including PKM2 and PRKACA. Loss of function studies show that PKM2 deletion in cardiomyocytes resulted in significantly reduced cell cycle. 62 PRKACA is a key regulatory enzyme in humans and contributes to the control of cellular processes including glucose metabolism and cell division. Defective regulation of protein kinase A activity is also linked to the progression of cardiovascular disease, and reduced protein kinase A activity is associated with reduction of Ca2+ signaling in embryonic hearts. 63 In addition, carfilzomib dysregulated the expression of proteins involved in autophagy, apoptosis, and cell cycle. For example, carfilzomib downregulated CLEC16A, a regulator of autophagy through mTOR (the mammalian target of rapamycin) activity, 64 and upregulated ATG101 (an autophagy factor required for autophagosome formation), CDKN1A (a regulator of cell cycle in response to stress stimuli), and RND3 (a member of the small Rho GTPase family that regulates apoptosis through the Rho kinase‐dependent signaling pathway).
Considering the complexity of cardiotoxicity, several possible mechanisms can synergistically induce cytotoxic effects after carfilzomib treatment. As expected from its on‐target effect, proteasome inhibition by carfilzomib treatment can promote cell death. Our study also reveals potential novel mechanisms induced by carfilzomib‐treatment, including (1) targeting mitochondria that may lead to oxidative stress, disruptions in cellular energy, and contractility defect; and (2) triggering downregulation of ECM and integrin‐related genes that may result in reduced integrin‐mediated traction forces and alterations of cell structure and morphology.
We note that a replication study in human patients is an important next step to examine if the alterations of genes and proteins observed in hiPSC‐CMs are also observed in human patients. However, given the similar end points observed in hiPSC‐CMs and human patients (eg, cytotoxicity and abnormal contractility), the findings of hiPSC‐CMs from this study may have important implications toward discovery of new therapies to overcome clinical side effects after chemotherapeutic drug treatment. In addition, molecular changes, such as upregulation of heat shock‐related genes and other proteins, may provide a new avenue toward biomarker development for early detection of carfilzomib‐induced cardiotoxicity.
Sources of Funding
This study was supported by the Children’s Heart Research and Outcomes Center at Emory University and Children’s Healthcare of Atlanta; the Center for Pediatric Technology and Biolocity at Emory University and Georgia Institute of Technology; Imagine, Innovate and Impact (I3) Funds from the Emory School of Medicine and through the Georgia Clinical and Translational Science Awards Program (the National Institutes of Health award) (UL1‐TR002378); the National Institutes of Health (R21AA025723, R01HL136345, and R01AA028527); and the National Science Foundation and the Center for the Advancement of Science in Space (CBET 1926387).
Disclosures
None.
Acknowledgments
Drs Forghani, Mandawat, and Xu conceived and designed research. Dr Forghani, A. Rashid, Dr Sun, M. R. Lee, and Dr Li performed research and acquired the data. Dr Forghani, A. Rashid, Dr Sun, R. Liu, M.R. Lee, Dr Li, H. Hwang, and Dr Maxwell analyzed and interpreted the data. Dr Forghani, Dr Sun, and R. Liu performed statistical analysis. Dr Mandawat provided clinical guidance. Drs Wu and Salaita contributed new reagents or analytic tools, interpreted the data, and made critical revision of the article for important intellectual content. Drs Forghani and Xu wrote the article and made critical revisions of the article for important intellectual content. Dr Xu handled funding and supervision.
For Sources of Funding and Disclosures, see page 26.
REFERENCES
- 1. Cole DC, Frishman WH. Cardiovascular complications of proteasome inhibitors used in multiple myeloma. Cardiol Rev. 2018;26:122–129. doi: 10.1097/CRD.0000000000000183 [DOI] [PubMed] [Google Scholar]
- 2. Kuhn DJ, Chen Q, Voorhees PM, Strader JS, Shenk KD, Sun CM, Demo SD, Bennett MK, van Leeuwen FWB, Chanan‐Khan AA, et al. Potent activity of carfilzomib, a novel, irreversible inhibitor of the ubiquitin‐proteasome pathway, against preclinical models of multiple myeloma. Blood. 2007;110:3281–3290. doi: 10.1182/blood-2007-01-065888 [DOI] [PMC free article] [PubMed] [Google Scholar]
- 3. Dimopoulos MA, Roussou M, Gavriatopoulou M, Psimenou E, Ziogas D, Eleutherakis‐Papaiakovou E, Fotiou D, Migkou M, Kanellias N, Panagiotidis I, et al. Cardiac and renal complications of carfilzomib in patients with multiple myeloma. Blood Adv. 2017;1:449–454. doi: 10.1182/bloodadvances.2016003269 [DOI] [PMC free article] [PubMed] [Google Scholar]
- 4. Mangla A, Paydary K, Liu J, Mbachi C, Yim B, Lad TE. Carfilzomib‐associated cardiovascular adverse events in a non‐caucasian cohort of patients with multiple myeloma: a real‐world experience. Hematol Oncol. 2018;36:715–717. doi: 10.1002/hon.2535 [DOI] [PubMed] [Google Scholar]
- 5. Moreau P, Richardson PG, Cavo M, Orlowski RZ, San Miguel JF, Palumbo A, Harousseau JL. Proteasome inhibitors in multiple myeloma: 10 years later. Blood. 2012;120:947–959. doi: 10.1182/blood-2012-04-403733 [DOI] [PMC free article] [PubMed] [Google Scholar]
- 6. Jain T, Narayanasamy H, Mikhael J, Reeder CB, Bergsagel PL, Mayo A, Stewart AK, Mookadam F, Fonseca R. Systolic dysfunction associated with carfilzomib use in patients with multiple myeloma. Blood Cancer J. 2017;7:642. doi: 10.1038/s41408-017-0026-7 [DOI] [PMC free article] [PubMed] [Google Scholar]
- 7. Bruno G, Bringhen S, Maffei I, Iannaccone A, Crea T, Ravera A, Astarita A, Vallelonga F, Salvini M, Gay F, et al. Cardiovascular organ damage and blood pressure levels predict adverse events in multiple myeloma patients undergoing carfilzomib therapy. Cancers (Basel). 2019;11:622. doi: 10.3390/cancers11050622 [DOI] [PMC free article] [PubMed] [Google Scholar]
- 8. Shah C, Bishnoi R, Jain A, Bejjanki H, Xiong S, Wang Y, Zou F, Moreb JS. Cardiotoxicity associated with carfilzomib: systematic review and meta‐analysis. Leuk Lymphoma. 2018;59:2557–2569. doi: 10.1080/10428194.2018.1437269 [DOI] [PubMed] [Google Scholar]
- 9. Waxman AJ, Clasen S, Hwang W‐T, Garfall A, Vogl DT, Carver J, O’Quinn R, Cohen AD, Stadtmauer EA, Ky B, et al. Carfilzomib‐associated cardiovascular adverse events: a systematic review and meta‐analysis. JAMA Oncol. 2018;4:e174519. doi: 10.1001/jamaoncol.2017.4519 [DOI] [PMC free article] [PubMed] [Google Scholar]
- 10. Kortuem KM, Stewart AK. Carfilzomib. Blood. 2013;121:893–897. doi: 10.1182/blood-2012-10-459883 [DOI] [PubMed] [Google Scholar]
- 11. Hahn VS, Zhang KW, Sun L, Narayan V, Lenihan DJ, Ky B. Heart failure with targeted cancer therapies: mechanisms and cardioprotection. Circ Res. 2021;128:1576–1593. doi: 10.1161/CIRCRESAHA.121.318223 [DOI] [PMC free article] [PubMed] [Google Scholar]
- 12. Han B, Yao W, Oh YT, Tong JS, Li S, Deng J, Yue P, Khuri FR, Sun SY. The novel proteasome inhibitor carfilzomib activates and enhances extrinsic apoptosis involving stabilization of death receptor 5. Oncotarget. 2015;6:17532–17542. doi: 10.18632/oncotarget.3947 [DOI] [PMC free article] [PubMed] [Google Scholar]
- 13. Hasinoff BB, Patel D, Wu X. Molecular mechanisms of the cardiotoxicity of the proteasomal‐targeted drugs bortezomib and carfilzomib. Cardiovasc Toxicol. 2017;17:237–250. doi: 10.1007/s12012-016-9378-7 [DOI] [PubMed] [Google Scholar]
- 14. Efentakis P, Kremastiotis G, Varela A, Nikolaou P‐E, Papanagnou E‐D, Davos CH, Tsoumani M, Agrogiannis G, Konstantinidou A, Kastritis E, et al. Molecular mechanisms of carfilzomib‐induced cardiotoxicity in mice and the emerging cardioprotective role of metformin. Blood. 2019;133:710–723. doi: 10.1182/blood-2018-06-858415 [DOI] [PubMed] [Google Scholar]
- 15. Musunuru K, Sheikh F, Gupta RM, Houser SR, Maher KO, Milan DJ, Terzic A, Wu JC; American Heart Association Council on Functional G, Translational B . Induced pluripotent stem cells for cardiovascular disease modeling and precision medicine: a scientific statement from the American Heart Association. Circ Genom Precis Med. 2018;11:e000043. doi: 10.1161/HCG.0000000000000043 [DOI] [PMC free article] [PubMed] [Google Scholar]
- 16. Mordwinkin NM, Burridge PW, Wu JC. A review of human pluripotent stem cell‐derived cardiomyocytes for high‐throughput drug discovery, cardiotoxicity screening, and publication standards. J Cardiovasc Transl Res. 2013;6:22–30. doi: 10.1007/s12265-012-9423-2 [DOI] [PMC free article] [PubMed] [Google Scholar]
- 17. Hnatiuk AP, Briganti F, Staudt DW, Mercola M. Human iPSC modeling of heart disease for drug development. Cell Chem Biol. 2021;28:271–282. doi: 10.1016/j.chembiol.2021.02.016 [DOI] [PMC free article] [PubMed] [Google Scholar]
- 18. Bellin M, Mummery CL. Inherited heart disease—what can we expect from the second decade of human iPS cell research? FEBS Lett. 2016;590:2482–2493. [DOI] [PMC free article] [PubMed] [Google Scholar]
- 19. Mercola M, Colas A, Willems E. Induced pluripotent stem cells in cardiovascular drug discovery. Circ Res. 2013;112:534–548. doi: 10.1161/CIRCRESAHA.111.250266 [DOI] [PMC free article] [PubMed] [Google Scholar]
- 20. Nair P, Prado M, Perea‐Gil I, Karakikes I. Concise review: precision matchmaking: induced pluripotent stem cells meet cardio‐oncology. Stem Cells Transl Med. 2019;8:758–767. doi: 10.1002/sctm.18-0279 [DOI] [PMC free article] [PubMed] [Google Scholar]
- 21. Singh P, Wang X, Hageman L, Chen Y, Magdy T, Landier W, Ginsberg JP, Neglia JP, Sklar CA, Castellino SM, et al. Association of GSTM1 null variant with anthracycline‐related cardiomyopathy after childhood cancer‐a Children's Oncology Group ALTE03N1 report. Cancer. 2020;126:4051–4058. doi: 10.1002/cncr.32948 [DOI] [PMC free article] [PubMed] [Google Scholar]
- 22. Lan F, Lee A, Liang P, Sanchez‐Freire V, Nguyen P, Wang LI, Han L, Yen M, Wang Y, Sun N, et al. Abnormal calcium handling properties underlie familial hypertrophic cardiomyopathy pathology in patient‐specific induced pluripotent stem cells. Cell Stem Cell. 2013;12:101–113. doi: 10.1016/j.stem.2012.10.010 [DOI] [PMC free article] [PubMed] [Google Scholar]
- 23. Jha R, Wu Q, Singh M, Preininger MK, Han P, Ding G, Cho HC, Jo H, Maher KO, Wagner MB, et al. Simulated microgravity and 3D culture enhance induction, viability, proliferation and differentiation of cardiac progenitors from human pluripotent stem cells. Sci Rep. 2016;6:30956. doi: 10.1038/srep30956 [DOI] [PMC free article] [PubMed] [Google Scholar]
- 24. Billis P, Will Y, Nadanaciva S. High‐content imaging assays for identifying compounds that generate superoxide and impair mitochondrial membrane potential in adherent eukaryotic cells. Curr Protoc Toxicol. 2014;59:25.1.1–25.1.14. doi: 10.1002/0471140856.tx2501s59 [DOI] [PubMed] [Google Scholar]
- 25. Rampoldi A, Crooke SN, Preininger MK, Jha R, Maxwell J, Ding L, Spearman P, Finn MG, Xu C. Targeted elimination of tumorigenic human pluripotent stem cells using suicide‐inducing virus‐like particles. ACS Chem Biol. 2018;13:2329–2338. doi: 10.1021/acschembio.8b00490 [DOI] [PMC free article] [PubMed] [Google Scholar]
- 26. Huebsch N, Loskill P, Mandegar MA, Marks NC, Sheehan AS, Ma Z, Mathur A, Nguyen TN, Yoo JC, Judge LM, et al. Automated video‐based analysis of contractility and calcium flux in human‐induced pluripotent stem cell‐derived cardiomyocytes cultured over different spatial scales. Tissue Eng Part C Methods. 2015;21:467–479. doi: 10.1089/ten.tec.2014.0283 [DOI] [PMC free article] [PubMed] [Google Scholar]
- 27. Gao W, Shi P, Chen X, Zhang L, Liu J, Fan X, Luo X. Clathrin‐mediated integrin alphaIIbbeta3 trafficking controls platelet spreading. Platelets. 2018;29:610–621. [DOI] [PubMed] [Google Scholar]
- 28. Liu Y, Blanchfield L, Ma VP, Andargachew R, Galior K, Liu Z, Evavold B, Salaita K. DNA‐based nanoparticle tension sensors reveal that T‐cell receptors transmit defined pN forces to their antigens for enhanced fidelity. Proc Natl Acad Sci USA. 2016;113:5610–5615. doi: 10.1073/pnas.1600163113 [DOI] [PMC free article] [PubMed] [Google Scholar]
- 29. Ma R, Kellner AV, Ma VP, Su H, Deal BR, Brockman JM, Salaita K. DNA probes that store mechanical information reveal transient piconewton forces applied by T cells. Proc Natl Acad Sci USA. 2019;116:16949–16954. doi: 10.1073/pnas.1904034116 [DOI] [PMC free article] [PubMed] [Google Scholar]
- 30. Liu R, Sun F, Forghani P, Armand LC, Rampoldi A, Li D, Wu R, Xu C. Proteomic profiling reveals roles of stress response, Ca(2+) transient dysregulation, and novel signaling pathways in alcohol‐induced cardiotoxicity. Alcohol Clin Exp Res. 2020;44:2187–2199. [DOI] [PMC free article] [PubMed] [Google Scholar]
- 31. Hanna AD, Lam A, Tham S, Dulhunty AF, Beard NA. Adverse effects of doxorubicin and its metabolic product on cardiac RyR2 and SERCA2A. Mol Pharmacol. 2014;86:438–449. doi: 10.1124/mol.114.093849 [DOI] [PMC free article] [PubMed] [Google Scholar]
- 32. Takemura G, Fujiwara H. Doxorubicin‐induced cardiomyopathy from the cardiotoxic mechanisms to management. Prog Cardiovasc Dis. 2007;49:330–352. doi: 10.1016/j.pcad.2006.10.002 [DOI] [PubMed] [Google Scholar]
- 33. Maillet A, Tan K, Chai X, Sadananda SN, Mehta A, Ooi J, Hayden MR, Pouladi MA, Ghosh S, Shim W, et al. Modeling doxorubicin‐induced cardiotoxicity in human pluripotent stem cell derived‐cardiomyocytes. Sci Rep. 2016;6:25333. doi: 10.1038/srep25333 [DOI] [PMC free article] [PubMed] [Google Scholar]
- 34. Polonchuk L, Chabria M, Badi L, Hoflack JC, Figtree G, Davies MJ, Gentile C. Cardiac spheroids as promising in vitro models to study the human heart microenvironment. Sci Rep. 2017;7:7005. doi: 10.1038/s41598-017-06385-8 [DOI] [PMC free article] [PubMed] [Google Scholar]
- 35. Starkov AA. The role of mitochondria in reactive oxygen species metabolism and signaling. Ann N Y Acad Sci. 2008;1147:37–52. doi: 10.1196/annals.1427.015 [DOI] [PMC free article] [PubMed] [Google Scholar]
- 36. Bernardi P, Di Lisa F, Fogolari F, Lippe G. From ATP to PTP and back: a dual function for the mitochondrial ATP synthase. Circ Res. 2015;116:1850–1862. doi: 10.1161/CIRCRESAHA.115.306557 [DOI] [PMC free article] [PubMed] [Google Scholar]
- 37. Brookes PS, Yoon Y, Robotham JL, Anders MW, Sheu SS. Calcium, ATP, and ROS: a mitochondrial love‐hate triangle. Am J Physiol Cell Physiol. 2004;287:C817–C833. doi: 10.1152/ajpcell.00139.2004 [DOI] [PubMed] [Google Scholar]
- 38. Indo HP, Davidson M, Yen HC, Suenaga S, Tomita K, Nishii T, Higuchi M, Koga Y, Ozawa T, Majima HJ. Evidence of ros generation by mitochondria in cells with impaired electron transport chain and mitochondrial DNA damage. Mitochondrion. 2007;7:106–118. doi: 10.1016/j.mito.2006.11.026 [DOI] [PubMed] [Google Scholar]
- 39. Sabharwal SS, Schumacker PT. Mitochondrial ROS in cancer: initiators, amplifiers or an Achilles' heel? Nat Rev Cancer. 2014;14:709–721. doi: 10.1038/nrc3803 [DOI] [PMC free article] [PubMed] [Google Scholar]
- 40. Buza V, Rajagopalan B, Curtis AB. Cancer treatment‐induced arrhythmias: focus on chemotherapy and targeted therapies. Circ Arrhythm Electrophysiol. 2017;10:e005443. doi: 10.1161/CIRCEP.117.005443 [DOI] [PubMed] [Google Scholar]
- 41. Lampi MC, Reinhart‐King CA. Targeting extracellular matrix stiffness to attenuate disease: from molecular mechanisms to clinical trials. Sci Transl Med. 2018;10:eaao0475. doi: 10.1126/scitranslmed.aao0475 [DOI] [PubMed] [Google Scholar]
- 42. Shah SP, Nooka AK, Jaye DL, Bahlis NJ, Lonial S, Boise LH. Bortezomib‐induced heat shock response protects multiple myeloma cells and is activated by heat shock factor 1 serine 326 phosphorylation. Oncotarget. 2016;7:59727–59741. doi: 10.18632/oncotarget.10847 [DOI] [PMC free article] [PubMed] [Google Scholar]
- 43. Lu XY, Xiao L, Wang L, Ruden DM. Hsp90 inhibitors and drug resistance in cancer: the potential benefits of combination therapies of Hsp90 inhibitors and other anti‐cancer drugs. Biochem Pharmacol. 2012;83:995–1004. doi: 10.1016/j.bcp.2011.11.011 [DOI] [PMC free article] [PubMed] [Google Scholar]
- 44. Pratt WB, Morishima Y, Peng HM, Osawa Y. Proposal for a role of the Hsp90/Hsp70‐based chaperone machinery in making triage decisions when proteins undergo oxidative and toxic damage. Exp Biol Med (Maywood). 2010;235:278–289. doi: 10.1258/ebm.2009.009250 [DOI] [PMC free article] [PubMed] [Google Scholar]
- 45. Kamal A, Boehm MF, Burrows FJ. Therapeutic and diagnostic implications of Hsp90 activation. Trends Mol Med. 2004;10:283–290. doi: 10.1016/j.molmed.2004.04.006 [DOI] [PMC free article] [PubMed] [Google Scholar]
- 46. Hoter A, El‐Sabban ME, Naim HY. The HSP90 family: structure, regulation, function, and implications in health and disease. Int J Mol Sci. 2018;19:2560. doi: 10.3390/ijms19092560 [DOI] [PMC free article] [PubMed] [Google Scholar]
- 47. Creagh EM, Sheehan D, Cotter TG. Heat shock proteins—modulators of apoptosis in tumour cells. Leukemia. 2000;14:1161–1173. doi: 10.1038/sj.leu.2401841 [DOI] [PubMed] [Google Scholar]
- 48. Lanneau D, Brunet M, Frisan E, Solary E, Fontenay M, Garrido C. Heat shock proteins: essential proteins for apoptosis regulation. J Cell Mol Med. 2008;12:743–761. doi: 10.1111/j.1582-4934.2008.00273.x [DOI] [PMC free article] [PubMed] [Google Scholar]
- 49. Boothe SD, Myers JD, Pok S, Sun J, Xi Y, Nieto RM, Cheng J, Jacot JG. The effect of substrate stiffness on cardiomyocyte action potentials. Cell Biochem Biophys. 2016;74:527–535. [DOI] [PMC free article] [PubMed] [Google Scholar]
- 50. Tallawi M, Rai R, Boccaccini AR, Aifantis KE. Effect of substrate mechanics on cardiomyocyte maturation and growth. Tissue Eng Part B Rev. 2015;21:157–165. doi: 10.1089/ten.teb.2014.0383 [DOI] [PMC free article] [PubMed] [Google Scholar]
- 51. Schelbert EB, Fonarow GC, Bonow RO, Butler J, Gheorghiade M. Therapeutic targets in heart failure: refocusing on the myocardial interstitium. J Am Coll Cardiol. 2014;63:2188–2198. doi: 10.1016/j.jacc.2014.01.068 [DOI] [PubMed] [Google Scholar]
- 52. Becchetti A, Petroni G, Arcangeli A. Ion channel conformations regulate integrin‐dependent signaling. Trends Cell Biol. 2019;29:298–307. doi: 10.1016/j.tcb.2018.12.005 [DOI] [PubMed] [Google Scholar]
- 53. Moreb JS. Off‐target effects of carfilzomib that cause cardiotoxicity. Blood. 2019;133:626–628. doi: 10.1182/blood-2018-12-889758 [DOI] [PubMed] [Google Scholar]
- 54. Raturi A, Simmen T. Where the endoplasmic reticulum and the mitochondrion tie the knot: the mitochondria‐associated membrane (MAM). Biochim Biophys Acta. 2013;1833:213–224. doi: 10.1016/j.bbamcr.2012.04.013 [DOI] [PubMed] [Google Scholar]
- 55. Arai M, Yoguchi A, Takizawa T, Yokoyama T, Kanda T, Kurabayashi M, Nagai R. Mechanism of doxorubicin‐induced inhibition of sarcoplasmic reticulum Ca(2+)‐ATPase gene transcription. Circ Res. 2000;86:8–14. [DOI] [PubMed] [Google Scholar]
- 56. Berthiaume JM, Wallace KB. Adriamycin‐induced oxidative mitochondrial cardiotoxicity. Cell Biol Toxicol. 2007;23:15–25. doi: 10.1007/s10565-006-0140-y [DOI] [PubMed] [Google Scholar]
- 57. Dimitrakis P, Romay‐Ogando MI, Timolati F, Suter TM, Zuppinger C. Effects of doxorubicin cancer therapy on autophagy and the ubiquitin‐proteasome system in long‐term cultured adult rat cardiomyocytes. Cell Tissue Res. 2012;350:361–372. doi: 10.1007/s00441-012-1475-8 [DOI] [PubMed] [Google Scholar]
- 58. Hou T, Zhang R, Jian C, Ding W, Wang Y, Ling S, Ma Q, Hu X, Cheng H, Wang X. NDUFAB1 confers cardio‐protection by enhancing mitochondrial bioenergetics through coordination of respiratory complex and supercomplex assembly. Cell Res. 2019;29:754–766. doi: 10.1038/s41422-019-0208-x [DOI] [PMC free article] [PubMed] [Google Scholar]
- 59. Guglin M, Aljayeh M, Saiyad S, Ali R, Curtis AB. Introducing a new entity: chemotherapy‐induced arrhythmia. Europace. 2009;11:1579–1586. doi: 10.1093/europace/eup300 [DOI] [PubMed] [Google Scholar]
- 60. Sauer H, Wartenberg M, Hescheler J. Reactive oxygen species as intracellular messengers during cell growth and differentiation. Cell Physiol Biochem. 2001;11:173–186. doi: 10.1159/000047804 [DOI] [PubMed] [Google Scholar]
- 61. Filice D, Dhahri W, Solan JL, Lampe PD, Steele E, Milani N, Van Biber B, Zhu W‐Z, Valdman TS, Romagnuolo R, et al. Optical mapping of human embryonic stem cell‐derived cardiomyocyte graft electrical activity in injured hearts. Stem Cell Res Ther. 2020;11:417. doi: 10.1186/s13287-020-01919-w [DOI] [PMC free article] [PubMed] [Google Scholar]
- 62. Magadum A, Singh N, Kurian AA, Munir I, Mehmood T, Brown K, Sharkar MTK, Chepurko E, Sassi Y, Oh JG, et al. Pkm2 regulates cardiomyocyte cell cycle and promotes cardiac regeneration. Circulation. 2020;141:1249–1265. doi: 10.1161/CIRCULATIONAHA.119.043067 [DOI] [PMC free article] [PubMed] [Google Scholar]
- 63. Sui X, Kong N, Ye L, Han W, Zhou J, Zhang Q, He C, Pan H. p38 and JNK MAPK pathways control the balance of apoptosis and autophagy in response to chemotherapeutic agents. Cancer Lett. 2014;344:174–179. doi: 10.1016/j.canlet.2013.11.019 [DOI] [PubMed] [Google Scholar]
- 64. Tam RC, Li MW, Gao YP, Pang YT, Yan S, Ge W, Lau CS, Chan VS. Human CLEC16A regulates autophagy through modulating mTOR activity. Exp Cell Res. 2017;352:304–312. doi: 10.1016/j.yexcr.2017.02.017 [DOI] [PubMed] [Google Scholar]
Associated Data
This section collects any data citations, data availability statements, or supplementary materials included in this article.
Data Availability Statement
Global gene expression profiling of RNA sequencing (RNA‐seq) data are available at the National Center for Biotechnology Information Gene Expression Omnibus database with the accession number GSE163102. The proteomics data were deposited in the public MassIVE database with the identifier MSV000087350. Institutional review board approval was not required, because this study did not involve the use of animals or human subjects.