Abstract
The potential relevance of blood flow for describing cardiac function has been known for the past 2 decades, but the association of clinical parameters with the complexity of fluid motion is still not well understood. Hemodynamic force (HDF) analysis represents a promising approach for the study of blood flow within the ventricular chambers through the exploration of intraventricular pressure gradients. Previous experimental studies reported the significance of invasively measured cardiac pressure gradients in patients with heart failure. Subsequently, advances in cardiovascular imaging allowed noninvasive assessment of pressure gradients during progression and resolution of ventricular dysfunction and in the setting of resynchronization therapy. The HDF analysis can amplify mechanical abnormalities, detect them earlier compared with conventional ejection fraction and strain analysis, and possibly predict the development of cardiac remodeling. Alterations in HDFs provide the earliest signs of impaired cardiac physiology and can therefore transform the existing paradigm of cardiac function analysis once implemented in routine clinical care. Until recently, the HDF investigation was possible only with contrast‐enhanced echocardiography and magnetic resonance imaging, precluding its widespread clinical use. A mathematical model, based on the first principle of fluid dynamics and validated using 4‐dimensional‐flow‐magnetic resonance imaging, has allowed HDF analysis through routine transthoracic echocardiography, making it more readily accessible for routine clinical use. This article describes the concept of HDF analysis and reviews the existing evidence supporting its application in several clinical settings. Future studies should address the prognostic importance of HDF assessment in asymptomatic patients and its incorporation into clinical decision pathways.
Keywords: blood flow, cardiac mechanics, deformation imaging, heart failure, intraventricular pressure gradient
Subject Categories: Basic Science Research, Heart Failure, Hemodynamics, Imaging, Remodeling
Nonstandard Abbreviations and Acronyms
- CRT
cardiac resynchronization therapy
- HDF
hemodynamic force
- IVPG
intraventricular pressure gradient
Significant advances have been made in recent years in cardiovascular imaging for the quantitative assessment of cardiac function. The conventional approach based on left ventricular systolic emptying (ejection fraction [EF]) has been supplemented with deformation imaging (strain, strain rate) resulting in superior morphologic‐functional characterization of the heart. 1 , 2 The quantitative analysis of the dynamic segmental contraction‐relaxation sequence demonstrates the importance of mechanical synchrony and synergy in the hemodynamic performance of the normal and remodeled left ventricle (LV). 3 There is a significant relationship between segmental wall mechanics and the fluid dynamics of left ventricular filling and ejection, both in physiological and pathological conditions. 4 , 5 , 6 , 7 , 8 , 9 Blood flow analysis may provide insights into cardiac physiology, unachievable with conventional cardiovascular imaging.
The blood flow is driven by intraventricular pressure gradients (IVPG), which in turn are determined by the functional interplay of the myocardium, valves, and large vessels. The existence of IVPGs was initially hypothesized almost a century ago, 10 and the demonstration of their role in LV diastolic suction was described in the middle of the last century 11 (see also the note 12 ). More recently, open‐chest experiments in instrumented dogs 13 have measured the phasic patterns of pressure gradients between the base and the apex of LV that explained the incoming flow and the mitral valve motion. These studies have also demonstrated that the ventricular filling relies on the factors that determine the pressure gradients for any given valve impedance. In addition, they have shown that an efficient ventricular contraction generates high IVPG that underlies systolic blood ejection, whereas the degree of relaxation determines the amplitude of IVPG, which facilitates diastolic filling.
IVPGs were initially investigated using cardiac catheterization in animal models 14 revealing a high sensitivity to detect alterations in LV function in patients with heart failure (HF). 15 These findings were not translated into the clinical settings because of the invasive nature of this experiment. In the 1990s noninvasive estimation of diastolic pressure gradients was explored using the spatial‐temporal velocity distribution derived from M‐mode color Doppler 16 , 17 or from phase‐contrast magnetic resonance imaging (MRI). 18 , 19 However, the clinical application of these methods did not find wide acceptance because of lack of automated quantitative analysis tools.
The analysis of intracardiac hemodynamic force (HDF), 20 which corresponds to the global value of IVPG integrated over the ventricular volume, offers a rigorous method to explore IVPGs and blood flow within LV. It represents a spatial‐temporal course of the pressure gradients generated by the cyclical movement of the blood and tissue boundary, and it is therefore considered the fluid dynamics correlate of deformation imaging.
In recent years, HDF analysis has been conducted using echocardiographic particle image velocimetry, 9 but the need for contrast agent infusion and high quality images, recorded at high frame rate, resulted in poor applicability. Three‐dimensional (3D) phase‐contrast MRI, often referred to as 4‐dimensional flow MRI, has also been used to quantify HDF. 4 , 5 , 6 , 7 Four‐dimensional (4D) flow MRI is a highly reproducible method, which is considered the reference standard for measuring HDF. It has been evaluated against external reference standards such as laser particle imaging velocimetry and numerical models 21 , 22 ; however, it gained limited popularity because of high cost and low availability. In recent years, HDF analysis has become possible with use of a mathematical model that is based on the first principle of fluid dynamics 23 and incorporates the knowledge of LV geometry, endocardial tissue movement, and areas of the aortic and mitral orifices, without the need for assessment of blood velocities inside LV. The HDF analysis has demonstrated reliable results with both transthoracic echocardiography and traditional cardiac MRI, compared well with 4D flow MRI 24 and retained high accuracy against a numerical test model. 23 It can be considered the extension of deformation imaging to the intraventricular flow dynamics to diagnose early‐stage cardiac dysfunction (Figure 1). Therefore, HDF could be a useful novel tool in preventive cardiology, which can detect impaired cardiac physiology in asymptomatic subjects and provide an opportunity for medical intervention at an early stage.
Figure 1. Temporal evolution of cardiac function analysis and improvement in mechanical abnormalities detection.
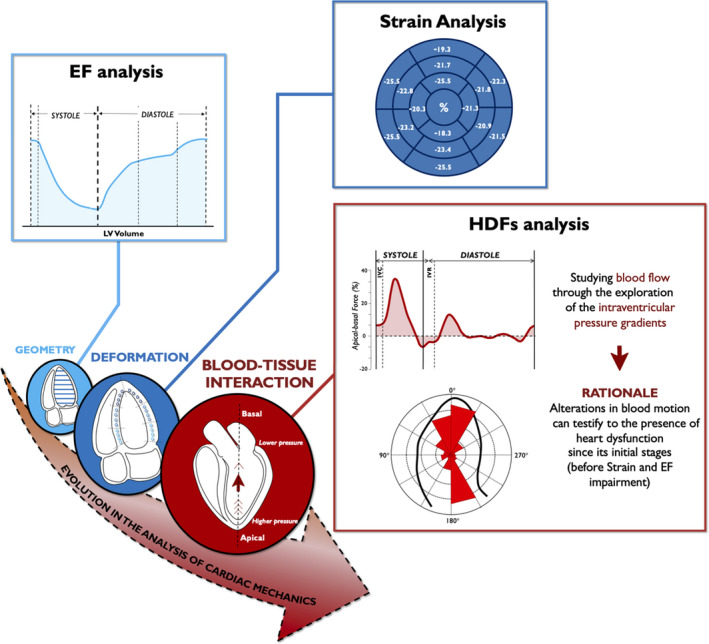
Noninvasive echocardiographic HDF analysis represents the latest evolution of cardiac deformation analysis. HDFs could greatly amplify mechanical abnormalities and place even minor kinetic dysfunction within detectable range. EF indicates ejection fraction; GLS, global longitudinal strain; HDF, hemodynamic force; IVC, isovolumic contraction; IVR, isovolumic relaxation; and LV, left ventricle.
Because the evidence base for HDF analysis is still limited, it is considered an emerging method. The aim of this brief review is to introduce the concepts of HDF analysis to clinicians and highlight the potential for clinical use. The first part presents the necessary background for the interpretation of HDF in physiological and pathological settings, and the following part reviews the existing clinical results and discusses the possible future applications.
THE PREMISE AND PHYSICAL RATIONALE
The physical definitions of force and pressure are the essential prerequisites to understand HDF analysis. Force is defined as any interaction that, if not counteracted, can move the object on which it is acting. Force is a vector quantity, composed of magnitude and direction. It is measured in Newton (kg×m/s2), according to the International System of Units, wherein 1 Newton is the force required to impart an acceleration of 1 m/s2 to 1 kg of mass. Pressure is the force applied per unit area; it is measured in Pascal (Pa), equal to N/m2, wherein 1 Pa is the pressure of 1 N applied to an area of 1 square meter. However, the millimeter of mercury (mm Hg) is routinely used in medicine, and 1 mm Hg is equivalent to 133 Pa.
The intracardiac blood flow direction is driven by the pressure gradient between chambers. Blood moves from regions with a higher pressure to those at a lower pressure, with the benefit of competent valves preventing retrograde flow; mean pressures at the aortic, left ventricular, and left atrial levels, along the cardiac cycle, are shown in Figure 2 (top chart).
Figure 2. Intracavitary pressure profiles, left ventricular blood volume, longitudinal hemodynamic force, and electrical activity along the cardiac cycle.
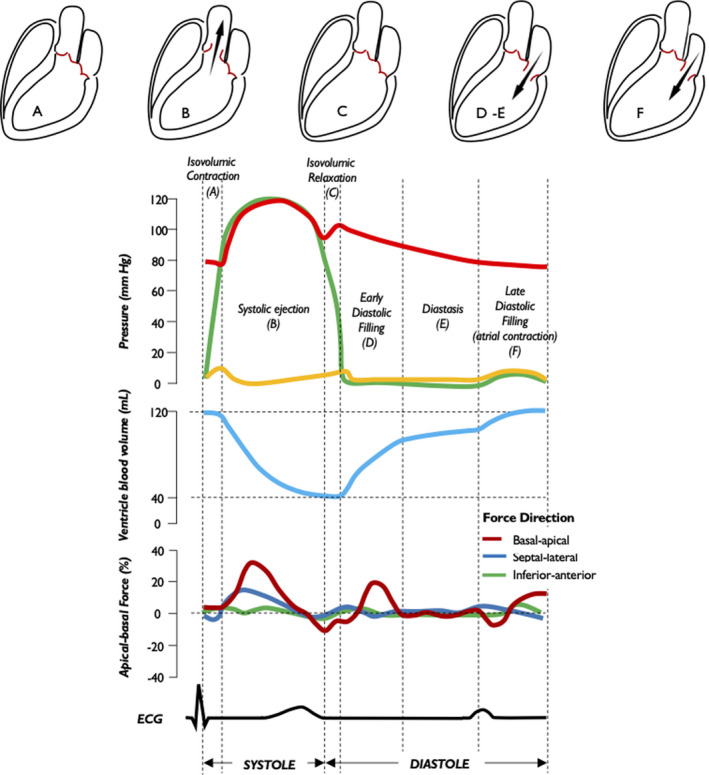
Profiles of aortic pressure (red), LV pressure (green), LA pressure (yellow), LV volume (blue), and LV longitudinal force (dark red) during the 5 phases of the cardiac cycle are shown: isovolumic contraction (A), systolic ejection (B), isovolumic relaxation (C), early diastolic filling (D), diastasis (E) and late diastolic filling (F). LA indicates left atrium; and LV, left ventricle.
HDF represents the global force exchanged between blood volume and endocardium. It is derived from the summation of the individual IVPGs driving blood inside the ventricular chamber of interest. This global force, by the relationship between pressure gradient and velocity field (Navier‐Stokes equation), is
| (1) |
where is the blood velocity at all points x inside the LV volume V(t), at all instants of time and ρ=1.05 kg/L is the blood density (this definition includes the force due to viscous stresses, albeit mostly negligible).
The HDF force vector, F (t), is directed from the highest to the lowest pressure area. The intraventricular HDF direction may not always coincide with blood flow direction, because HDF aligns with the direction of the acceleration of blood flow that, in unsteady motion, may require some time to modify its direction after the application of force.
Using the blood velocity recorded in the LV pool with 4D flow MR, formula (1) allows the estimation of the HDF. However, the same force vector can also be computed from an integral over the LV boundary, S(t), instead of the internal volume,
| (2) |
This formula requires the knowledge of the velocity only over the endocardial boundary and across the valves and does not require measuring the blood velocity inside the ventricular cavity. Therefore, it allows evaluation of HDFs from the knowledge of the moving ventricular geometry and the valve orifice and can be employed with standard multiplane or 3D echocardiographic exams, without the need of a 4D flow MR system. Although formula (2) may appear complex, it corresponds to the summation of values given by tissue position, velocity, and acceleration over the endocardial border. These values are commonly used in other calculations, such as strain and strain rate. Similarly, the average blood velocity across the valve can be evaluated from the volumetric changes using the conservation of mass principle. Therefore, the HDF estimation from formula (2) can be included in currently available imaging solutions that compute volumetric rates or are dedicated to deformation imaging, and therefore it can be applied to standard images recorded during an echocardiographic examination.
PHYSIOLOGICAL PATTERN OF HEMODYNAMIC FORCES
HDFs in LV occur along 3 planes: basal‐apical, septal‐lateral, and inferior‐anterior. HDFs in the right ventricle occur along the diaphragm‐outflow tract, basal‐apical, and septal‐free wall directions. 22 For brevity, we will discuss the LV HDF in the basal‐apical direction, the most widely reproducible and detectable force in all patients and mention other components only when applicable. We will defer discussion of HDF in the right ventricle, because the analysis is more complex owing to the changing dominant direction of flow during the various phases of the cycle, and the evidence is more limited. 6 , 22 , 25 , 26 When the HDF vector is directed from the apex to base of LV (when apical pressure is higher than basal pressure), it is defined as a positive deflection (above the zero line); when the HDF vector is directed from the base to apex (basal pressure higher than apical pressure), it is defined as a negative deflection (below the zero line) (Figure 2).
An innovative feature inherent to HDF analysis is the possibility to explore the time course of the HDF curve during the heartbeat. Longitudinal HDF curves are demonstrated in Figure 3, 27 and Figure 4, 10 , 28 which detail the systolic and diastolic phases of cardiac cycle, respectively.
Figure 3. Left ventricular longitudinal hemodynamic force (basal‐apical): systolic phase.
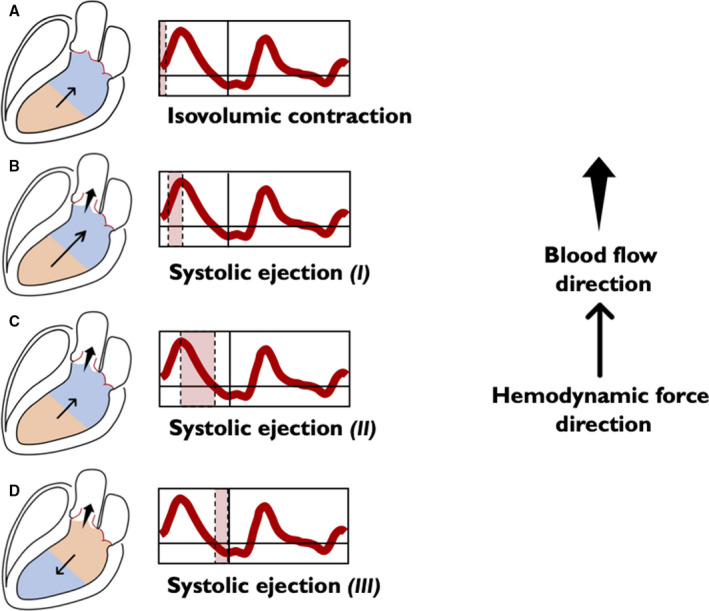
The intraventricular pressure gradients are illustrated for simplicity through only 2 areas: the area at a higher pressure is shown in orange and the area at a lower pressure is shown in blue. The direction of the hemodynamic force (thin arrow) always goes from the higher toward the lower pressure area. The direction of flow (wide arrow) goes from the higher to the lower pressure chamber. The beginning of systole is characterized by isovolumic contraction, which occurs between the mitral valve closure and aortic valve opening. During this phase the longitudinal force presents a positive deflection (A) due to an apex‐base IVPG, which causes an acceleration of flow in the apex‐base direction accompanying movement of blood flow toward the outflow, just before the opening of the aortic valve. Redirection of flow and ventricular reshape are causally and temporally related and, if the mitral valve is competent, there is no blood flow among the chambers, because both the aortic and mitral valves are closed. At this point of time, aortic pressure still exceeds the ventricular pressure. As myocardial contraction continues, LV pressure exceeds the aortic pressure, and the aortic valve opens. When the aortic valve opens, blood ejection from LV begins. Initially, longitudinal force curve is characterized by a positive ascending phase, because of the increase of the pressure gradient from the apex to base up to the maximum (B). Once the peak is reached the second part, although ventricular contraction continues, LV starts to lose tension and the gradient between the apex and the base decreases in a positive descending phase, as a large part of blood volume has been ejected (C). Approaching the end systole, the gradient between apex and base reverses (it becomes greater at the basal level). At this stage, ventricular flow is still exiting but decelerating, because aortic pressure exceeds LV pressure and the intraventricular HDF is in the direction opposite to flow (D) until aortic valve closes, and the LV enters the diastolic phase. HDF indicates hemodynamic force; IVPG, intraventricular pressure gradient; and LV, left ventricle.
Figure 4. Left ventricular longitudinal hemodynamic force (basal‐apical): diastolic phase.
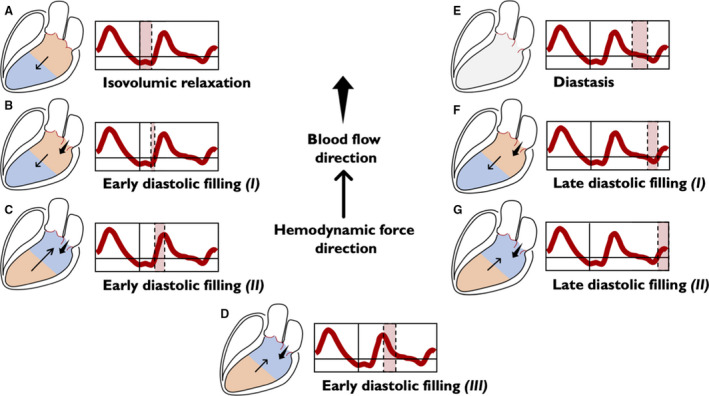
The intraventricular pressure gradients are illustrated for simplicity through only 2 areas: the area at a higher pressure is shown in orange and the area at a lower pressure is shown in blue. The absence of intraventricular gradient is colored in gray. The direction of the hemodynamic force (thin arrow) always goes from the higher toward the lower pressure area. The direction of flow (wide arrow) goes from the higher to the lower pressure chamber. Diastole begins with the isovolumic relaxation (A), in which both the aortic and the mitral valves are closed. During this period, there is no flow between the cardiac chambers, but because of active myocardial relaxation and recoil of elastic forces generated during the previous systole, the pressure gradient directed toward the ventricular apex increases, thus generating a diastolic suction before the opening of the mitral valve. This phase persists until the LV pressure drops below the left atrial pressure, the mitral valve opens, and the early diastolic filling begins; ventricular filling at the beginning is passive and the HDF vector continues to be directed toward the LV apex, but the pooling of blood within the LV (toward the apex) rapidly reduces the HDF toward zero (B). After this stage, LV filling continues supported by the upward movement of the mitral plane that displaces the blood contained into the atrium inside the LV. In this phase, gradually, the pressure in the LV increases until it exceeds the atrial pressure, thus inverting the A‐V pressure gradient, decelerating the LV filling and making HDF to grow in the positive ascending phase (C). The reduced passage of blood from the atrium to the LV progressively equilibrates the pressures in both chambers, eventually reducing the gradient to zero, causing a positive descending phase on the HDF curve (D). In the next phase (diastasis), a pressure equilibrium is established between the base and apex (and between the ventricle and left atrium) (E). The occurrence of atrial contraction, causes a relative gradient from apex to base, resulting in HDF negative vectors (F) and producing the late diastolic filling. Once again, as blood accumulates in LV, the ventricular gradient is reversed and HDF vector become positive (G), decelerating the diastolic filling flow and preparing LV for the systolic ejection phase. A‐V indicates atrio‐ventricular; HDF, hemodynamic force; and LV, left ventricle.
In general, the curve profiles are intended both as intervals of time and as instants and contain wealth of information not obtainable by traditional noninvasive imaging methods. They could facilitate a deeper understanding of individual events during the cardiac cycle (Figure 5). This quantitative graphical representation of events of the cardiac cycle integrates the time course of the ventricular volumes, LV shape, and the intracavitary fluid dynamics. Reduction of the positive HDF wave during systole may signal either impaired global myocardial contractility or the presence of an abnormal spatial‐temporal contractile pattern, because of lack of mechanical or electrical synergy among the different segments resulting in an attenuated thrust toward the LV outflow tract. The suction dynamics of LV can be evaluated by the extent and duration of the negative deflection that precedes mitral valve opening, when changes in the LV shape and the magnitude of elastic restoring forces generate a pressure gradient directed toward the LV apex (negative HDF). On the other hand, the way in which the negative diastolic part of HDF is attenuated and reversed reflects mechanical events more related to the load and to the passive mechanical properties of the LV chamber in its entirety. Nevertheless, parameters that are most appropriate to describe specific cardiac disorders are still to be validated in the clinical settings.
Figure 5. Relationship between heartbeat events and longitudinal hemodynamic force.
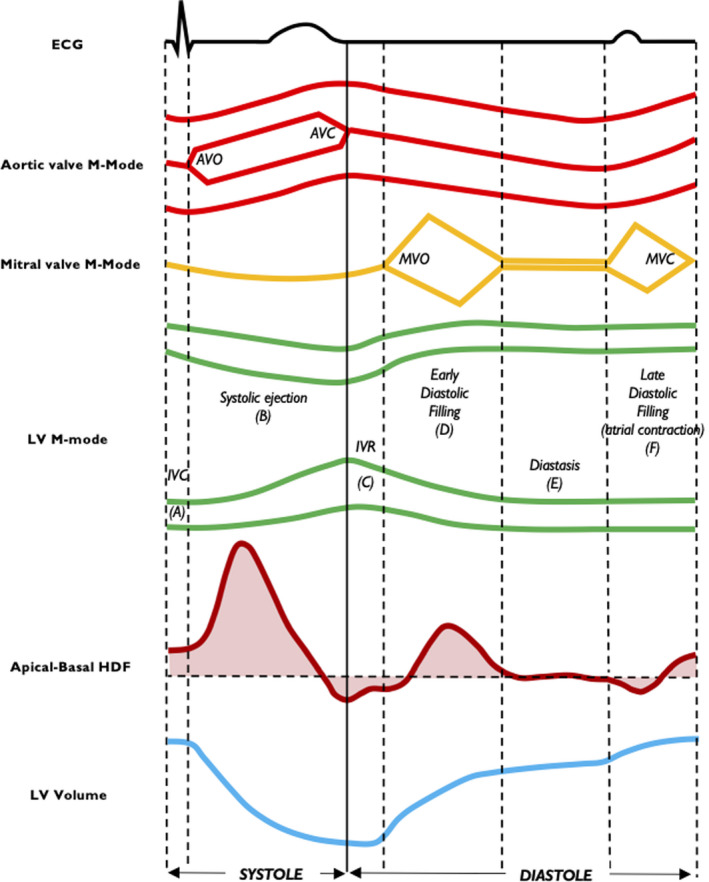
Time coupling among apical‐basal HDF, LV volume, mitral and aortic valve M‐mode, and LV M‐mode is shown. Isovolumic contraction (A), systolic ejection (B), isovolumic relaxation (C), early diastolic filling (D), diastasis (E) and late diastolic filling (F). AVC indicates aortic valve closure; AVO, aortic valve opening; ECG, electrocardiography; HDF, hemodynamic force; IVC, isovolumic contraction; IVR, isovolumic relaxation; LV, left ventricular; MVC, mitral valve closure; and MVO, mitral valve opening.
HEMODYNAMIC FORCE NORMALIZATION
HDFs, being a physical quantity, are expressed in Newton. They represent the force expressed by the entire blood volume to the surrounding boundary. Therefore, to enable comparisons between ventricles of different sizes, it is necessary to normalize the raw value of forces (in Newton) to the corresponding value of LV volume for obtaining the average IVPG. 6 Moreover, adjusting for fluid density and gravity acceleration should allow representation of force as a dimensionless number 24 , 29 ; with this normalization, its expression in % corresponds to a force given in percentage of the static weight of the blood in LV or to an acceleration expressed in percentage of gravity acceleration. The definition in dimensionless terms permits comparisons between patients and consequently simplifies the definition of normal reference limits for HDF.
HDF PARAMETERS
Several measures have been proposed to describe LV HDF. 29 They are mainly based on the time‐curve of the base‐apex HDFs displayed in Figure 6 that can be described by a series of parameters classified into 3 main categories.
-
Amplitude parameters have been most frequently reported in literature and include the following:
-
‐
The mean amplitude of the longitudinal force along the entire cardiac cycle. This amplitude is usually expressed as root mean square including both positive and negative values.
-
‐
The mean amplitude of longitudinal force during the systole.
-
‐
LV impulse: the mean amplitude of the longitudinal force during the positive systolic phase, when the force has an apex‐base direction. 30
-
‐
LV suction: the mean amplitude of the longitudinal force across the diastolic phases, when the force is negative (base‐apex direction), encompassing end‐systole and isovolumic relaxation.
-
‐
-
Timing parameters are the measures associated with timing of events derived from the HDF curve, and include the following:
-
‐
Time from R‐wave to positive peak of systolic LV longitudinal force, including the rates of force generation and force decay.
-
‐
Duration of LV negative longitudinal force in the transition from systole to diastole.
-
‐
Time from the start of relaxation to positive peak of diastolic LV longitudinal force.
-
‐
-
Orientation parameters are measures associated with the direction of LV force vector. They provide a comparison between longitudinal and transverse components, which can be presented as the average value for the entire or a selected period of the cardiac cycle. These include:
-
‐
Ratio between the transverse force and the longitudinal force.
-
‐
Dominant angle of the force vector, ranging from 90° (when the force is perfectly along the base‐apex direction) to 0°.
-
‐
Figure 6. Left ventricular longitudinal hemodynamic force (apical‐basal).
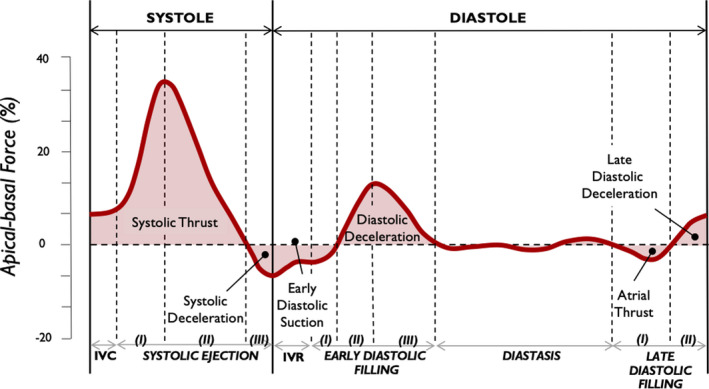
Time profile of the apical‐basal left ventricular hemodynamic force is shown highlighting main intracardiac events during individual time intervals. IVC indicates isovolumic contraction; and IVR, isovolumic relaxation.
TECHNICAL LIMITATION
HDF analysis is a technique that exploits endocardial edge tracking technology, whether applied to echocardiography or MRI. In order to obtain a 3D reconstruction of the ventricle from the standard 2D echocardiography, it is necessary to acquire endocardial tracking in multiple projections, which cannot be obtained simultaneously. Therefore, acquisitions of 3 different windows are required, which are obtained at different times and then synchronized by ECG gating. A proper HDF analysis assumes a good ECG tracing, a stable hemodynamic state during examination, and the presence of a sinus rhythm. If these criteria are not met, there is a risk of erroneous reconstruction of LV, and therefore HDF analysis becomes inadequate. Currently, the described methodology of HDF analysis is not applicable to patients with irregular rhythms, such as atrial fibrillation.
Endocardial tracing technology requires the visualization of endocardial border throughout the whole cardiac cycle and proper image contrast between the endocardial border and the blood pool. Because of high anatomic resolution, it is generally not an issue with cardiac MRI, but it may be more problematic with echocardiography. Regardless, because both HDF analysis and strain analysis rely on speckle‐tracking technology, dropout rates due to suboptimal image quality are similar for these methods.
HDF ANALYSIS: CLINICAL APPLICATIONS
Under normal conditions, the main HDFs are predominantly oriented along the basal‐apical direction, as detailed previously (Figure 7A). Such an orientation optimizes the energy expenditure required to produce the stroke volume because the myocardial deformation drives blood along its natural direction from base to apex and vice versa. Although the presence of a small transversal component is unavoidable due to the 3D anatomy, the appearance of relevant transversal components of HDF (Figure 7B) is always due to the breakdown of the delicate synergy/synchrony of the segmental myocardial deformation, which gives rise to abnormally oriented, transient pressure gradients. When a transversal component of HDFs develops with an amplitude comparable to the longitudinal component, it corresponds to a thrust made by a myocardial region onto a facing regions through the column of (incompressible) fluid between them and can be considered a form of wasted effort, which does not contribute efficiently to the ejection or filling. Alteration in the HDF pattern is always the result of segmental or global abnormalities of the movement of the blood‐cavity wall interface. The added value of HDF analysis is usually because of the ability to amplify mechanical abnormalities and make even small kinetic dysfunction detectable in a way that cannot be recognized by direct observation. The perturbation of IVPG induces flow diversion, abnormalities of the vorticity pattern, and ultimately reduction of endocardial shear stress, which is a powerful trigger for ventricular remodeling. In that sense, HDFs can identify conditions capable of inducing adverse LV remodeling or predict reverse remodeling when a therapeutic intervention reorients it in an orthodromic direction. Current clinical applications of HDF are discussed later.
Figure 7. Intensity‐weighted polar histogram.
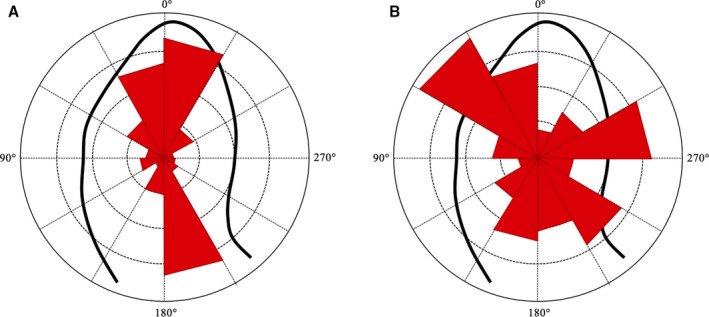
The distribution and intensity of the left ventricular hemodynamic forces during the entire heartbeat are shown by red isosceles triangles within a polar histogram. A, Patient with a mainly longitudinal (apex‐base) directed forces; (B) Patient with a prevalent transversal (septal‐lateral or inferior‐anterior) directed forces.
Cardiac Resynchronization Therapy
In patients with advanced HF, for whom cardiac resynchronization therapy (CRT) is indicated, HDF analysis shows substantial alteration of the systolic‐diastolic patterns, both quantitative and qualitative. The delayed and asynchronous mechanical activation, generally coupled with QRS complex widening, generates increased transverse components of HDF, which in turn result in increased energy dissipation. 5 , 7 , 9
Early longitudinal normalization of HDF following CRT, inferable both from the realignment of the longitudinal HDF with the anatomical axis of the ventricular inflow and from the reduction of transverse HDF, has been associated with favorable volumetric and functional response to CRT at follow‐up. 31 Moreover, the degree of pacing‐induced longitudinal alignment of HDF appears to be strongly related to the extent of response. 9 These results have been reproducible in both echocardiography or MRI studies, which highlights the methodologic robustness of HDF analysis. 5 , 7 , 9 It should also be noted that the reorientation of HDF direction can be detected in responders after a few paced beats in biventricular mode during CRT and can be employed for fine‐tuning the A‐V and V‐V intervals or selecting the best stimulation mode for multipolar catheters. 32
Left bundle branch block (LBBB) is the major cause of LV dyssynchrony and affects up to 25% of patients with HF (Figure 8A). 33 A recent study compared patients with HF and LBBB with patients with HF without LBBB, 5 focusing on the diastolic phase of cardiac cycle. During early diastole, patients with LBBB showed less longitudinal and more transverse component of HDF; therefore, LV filling forces were more orthogonal to the main LV flow direction resulting in abnormal diastolic function. HDF orientation, computed in early diastole, was related to QRS duration and septal‐lateral delay providing a reliable parameter of diastolic dysfunction in patients with LBBB.
Figure 8. Left ventricular longitudinal hemodynamic force (apical‐basal) in normal and pathologic hearts.
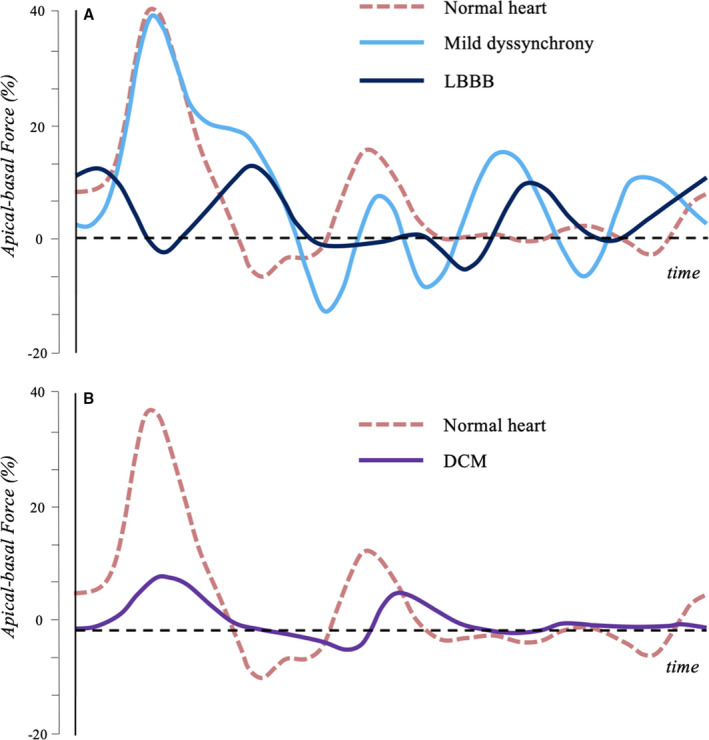
A, Longitudinal HDF in normal heart (red), in mild dyssynchrony with preserved EF (light blue) and in LBBB with reduced EF (dark blue) are shown. Mild dyssynchrony is associated with a modulation of the systolic wave, due to the asynchronous contraction of different regions, and a rebound effect during the diastolic relaxation phase. In presence of LBBB, the asynchrony is even more evident, especially in systole. B, Longitudinal HDF in normal heart (red) and in DCM with reduced EF (purple) are shown. In absence of asynchrony, DCM presents a generalized reduction in HDF amplitude. DCM indicates dilated cardiomyopathy; EF, ejection fraction; HDF, hemodynamic force; and LBBB, left bundle branch block.
Heart Failure
Comparative HDF analyses were recently reported for patients with HF with preserved , midrange, and reduced EF and in healthy controls. 8 HDFs have shown a directly proportional relationship with EF: a progressive reduction in HDF amplitude appears to correlate with worsening LV systolic function. In patients with HF with preserved EF, there is a significant variability of global longitudinal strain and a wide distribution of myocardial mass. Interestingly, the quantitative analysis of HDF, which shifts the focus from wall mechanics to intracavitary fluid dynamics, showed significant differences between patients with HF with preserved EF and controls, whereas EF and global longitudinal strain showed no discrimination. This observation adds a new dimension to phenotyping of HF. 8
In 1 HDF study 7 of patients with clinically compensated HF but LV dyssynchrony, 3 different patterns of forces were related to the functional status of the LV: (1) normal HDF pattern with larger diastolic inferior‐anterior forces, (2) reduced basal‐apical forces in diastole, and (3) increased inferior‐anterior systolic forces with 1 large diastolic pair of peaks in the basal‐apical direction. These patterns were proposed as a tool to assist or replace QRS duration as an indication for CRT in patients with HF.
Idiopathic Dilated Cardiomyopathy
HDF patterns, along both long and short axes, were analyzed in patients with dilated cardiomyopathy by 4D flow MRI. 4 A more heterogeneous pattern of HDFs was observed compared with healthy subjects: the ratio between the maximum short‐ and long‐axis forces was substantially larger, both at early and late diastolic filling in patients with dilated cardiomyopathy (Figure 8B). Although more studies are needed to define clinical implications, HDF analysis may be suggested as a novel tool in the study of early adverse cardiac remodeling.
Competitive Athletes
A 4D flow MRI‐based HDF analysis comparing healthy volunteers and elite athletes confirmed previous observations of the prominent longitudinal alignment of hemodynamic forces in normal volunteers. 6 The presence of an HDF physiologic transverse component during systole aligned along the lateral‐septal axis, is expected to support redirection of blood from the mitral valve toward the left ventricular outflow tract. No differences in magnitude of HDF were found between healthy volunteers and elite athletes when indexed to ventricular volumes. These results further confirmed that normalizing HDF to LV volume allowed comparison of ventricles of different sizes. 29
Diastolic Function
The study of HDFs is suitable for a deeper understanding of the diastolic LV function. It is possible to noninvasively quantify the extent and dynamics of the diastolic suction function of LV from the curve of the longitudinal trend of HDFs, as well as LV compliance and passive properties from indices derived from the rebound and early diastolic damping of the base‐apex HDF. 34 , 35 In a recent pilot study, HDF analysis has been applied to patients who had undergone right cardiac catheterization. 36 HDF analysis identified several the most robust parameters associated with the presence of increased LV filling pressures, which justifies its inclusion in a multiparametric assessment of diastolic function.
CLINICAL PERSPECTIVES AND CONCLUSIONS
Flow determines the optimum cardiac function. Flow is the main ontogenetic determinant of cardiac development, form, and function, and it underlies the structural and functional effects of compensatory dynamic remodeling. This interdependence, which is established during embryonic development, 37 , 38 , 39 seeks scientific confirmation for the efficacy of therapeutic interventions. HDF analysis allows the understanding of the flow‐tissue interaction.
Systematically designed studies will need to clarify the prognostic influence of early assessment of HDF in asymptomatic patients, in which pathologies or groups of patients HDF provides incremental information and how it could influence clinical decisions. Valvular diseases have yet to be investigated, and it is possible that HDF analysis could provide early quantitative information regarding the indications for surgical treatment or the success of such treatment. Flow assessment in arterial hypertension, a highly prevalent cardiovascular risk factor, could determine the presence and degree of hypertension‐mediated organ damage and potentially guide the therapeutic approach. Finally, HDF analysis could offer invaluable insights into myocardial dysfunction beyond traditional echocardiographic parameters and deformation measures. The possible applications and areas of research that could yield to HDF analysis appear considerable and need to be expeditiously explored.
Sources of Funding
Professor Pedrizzetti acknowledges partial support for this study by the Italian Ministry of Education and Research under project PRIN 2017 A889FP.
Disclosures
None.
For Sources of Funding and Disclosures, see page 12.
REFERENCES
- 1. Potter E, Marwick TH. Assessment of left ventricular function by echocardiography: the case for routinely adding global longitudinal strain to ejection fraction. JACC Cardiovasc Imaging. 2018;11:260–274. doi: 10.1016/j.jcmg.2017.11.017 [DOI] [PubMed] [Google Scholar]
- 2. Claus P, Omar AMS, Pedrizzetti G, Sengupta PP, Nagel E. Tissue tracking technology for assessing cardiac mechanics: principles, normal values, and clinical applications. JACC Cardiovasc Imaging. 2015;8:1444–1460. doi: 10.1016/j.jcmg.2015.11.001 [DOI] [PubMed] [Google Scholar]
- 3. Pedrizzetti G, La Canna G, Alfieri O, Tonti G. The vortex—an early predictor of cardiovascular outcome? Nat Rev Cardiol. 2014;11:545–553. doi: 10.1038/nrcardio.2014.75 [DOI] [PubMed] [Google Scholar]
- 4. Eriksson J, Bolger AF, Ebbers T, Carlhall CJ. Left ventricular hemodynamic forces are altered in patients with dilated cardiomyopathy. J Cardiovasc Magn Reson. 2015;17:P292. doi: 10.1186/1532-429X-17-S1-P282 [DOI] [Google Scholar]
- 5. Eriksson J, Zajac J, Alehagen U, Bolger AF, Ebbers T, Carlhäll C‐J. Left ventricular hemodynamic forces as a marker of mechanical dyssynchrony in heart failure patients with left bundle branch block. Sci Rep. 2017;7:2971. doi: 10.1038/s41598-017-03089-x [DOI] [PMC free article] [PubMed] [Google Scholar]
- 6. Arvidsson PM, Töger J, Carlsson M, Steding‐Ehrenborg K, Pedrizzetti G, Heiberg E, Arheden H. Left and right ventricular hemodynamic forces in healthy volunteers and elite athletes assessed with 4D flow magnetic resonance imaging. Am J Physiol Heart Circ Physiol. 2017;312:H314–H328. doi: 10.1152/ajpheart.00583.2016 [DOI] [PubMed] [Google Scholar]
- 7. Arvidsson PM, Töger J, Pedrizzetti G, Heiberg E, Borgquist R, Carlsson XM, Arheden H. Hemodynamic forces using four‐dimensional flow MRI: an independent biomarker of cardiac function in heart failure with left ventricular dyssynchrony? Am J Physiol Heart Circ Physiol. 2018;315:H1627–H1639. doi: 10.1152/ajpheart.00112.2018 [DOI] [PubMed] [Google Scholar]
- 8. Lapinskas T, Pedrizzetti G, Stoiber L, Düngen HD, Edelmann F, Pieske B, Kelle S. The intraventricular hemodynamic forces estimated using routine CMR cine images: a new marker of the failing heart. JACC Cardiovasc Imaging. 2019;12:377–379. doi: 10.1016/j.jcmg.2018.08.012 [DOI] [PubMed] [Google Scholar]
- 9. Pedrizzetti G, Martiniello AR, Bianchi V, D’Onofrio A, Caso P, Tonti G. Changes in electrical activation modify the orientation of left ventricular flow momentum: novel observations using echocardiographic particle image velocimetry. Eur Heart J Cardiovasc Imaging. 2016;17:203–209. doi: 10.1093/ehjci/jev137 [DOI] [PMC free article] [PubMed] [Google Scholar]
- 10. Katz N. The role payed by the ventricular relaxation process in filling the ventricle. Am J Physiol. 1930;95:542–553. [Google Scholar]
- 11. Brecher G, Kissen A. Relation of negative intraventricular pressure to ventricular volume. Circ Res. 1957;5:157–162. doi: 10.1161/01.RES.5.2.157 [DOI] [PubMed] [Google Scholar]
- 12. Wiggers CJ. Cardiac mechanisms that limit operation of ventricular suction. Science. 1957;126:1237. [Google Scholar]
- 13. Yellin EL, Nikolic S, Frater RWM. Left ventricular filling dynamics and diastolic function. Prog Cardiovasc Dis. 1990;32:247–271. doi: 10.1016/0033-0620(90)90016-U [DOI] [PubMed] [Google Scholar]
- 14. Courtois M, Kovacs SJ, Ludbrook PA. Transmitral pressure‐flow velocity relation. Importance of regional pressure gradients in the left ventricle during diastole. Circulation. 1988;78:661–671. doi: 10.1161/01.CIR.78.3.661 [DOI] [PubMed] [Google Scholar]
- 15. Guerra M, Brás‐Silva C, Amorim MJ, Moura C, Bastos P, Leite‐Moreira AF. Intraventricular pressure gradients in heart failure. Physiol Res. 2013;62:479–487. doi: 10.33549/physiolres.932531 [DOI] [PubMed] [Google Scholar]
- 16. Stugaard M, Risöe C, Ihlen H, Smiseth OA. Intracavitary filling pattern in the failing left ventricle assessed by color M‐mode Doppler echocardiography. J Am Coll Cardiol. 1994;24:663–670. doi: 10.1016/0735-1097(94)90012-4 [DOI] [PubMed] [Google Scholar]
- 17. Firstenberg MS, Vandervoort PM, Greenberg NL, Smedira NG, McCarthy PM, Garcia MJ, Thomas JD. Noninvasive estimation of transmitral pressure drop across the normal mitral valve in humans: importance of convective and inertial forces during left ventricular filling. J Am Coll Cardiol. 2000;36:1942–1949. doi: 10.1016/S0735-1097(00)00963-3 [DOI] [PubMed] [Google Scholar]
- 18. Yang G‐Z, Kilner PJ, Wood NB, Underwood SR, Firmin DN. Computation of flow pressure fields from magnetic resonance velocity mapping. Magn Reson Med. 1996;36:520–526. doi: 10.1002/mrm.1910360404 [DOI] [PubMed] [Google Scholar]
- 19. Ebbers T, Wigstrm L, Bolger AF, Engvall J, Karlsson M. Estimation of relative cardiovascular pressures using time‐resolved three‐dimensional phase contrast MRI. Magn Reson Med. 2001;45:872–879. doi: 10.1002/mrm.1116 [DOI] [PubMed] [Google Scholar]
- 20. Pedrizzetti G, Martiniello AR, Bianchi V, D’Onofrio A, Caso P, Tonti G, D’Onofrio A, Caso P, Tonti G. Cardiac fluid dynamics anticipates heart adaptation. J Biomech. 2015;48:388–391. doi: 10.1016/j.jbiomech.2014.11.049 [DOI] [PubMed] [Google Scholar]
- 21. Töger J, Arvidsson PM, Kanski M, Steding‐Ehrenborg K, Pedrizzetti G, Carlsson M, Arheden H, Heiberg E. Intracardiac hemodynamic forces using 4D flow: a new reproducible method applied to healthy controls, elite athletes and heart failure patients. J Cardiovasc Magn Reson. 2016;18(suppl 1). doi: 10.1186/1532-429x-18-s1-q61 [DOI] [Google Scholar]
- 22. Töger J, Arvidsson PM, Bock J, Kanski M, Pedrizzetti G, Carlsson M, Arheden H, Heiberg E. Hemodynamic forces in the left and right ventricles of the human heart using 4D flow magnetic resonance imaging: phantom validation, reproducibility, sensitivity to respiratory gating and free analysis software. PLoS One. 2018;13:e0195597. doi: 10.1371/journal.pone.0195597 [DOI] [PMC free article] [PubMed] [Google Scholar]
- 23. Pedrizzetti G. On the computation of hemodynamic forces in the heart chambers. J Biomech. 2019;95:109323. doi: 10.1016/j.jbiomech.2019.109323 [DOI] [PubMed] [Google Scholar]
- 24. Pedrizzetti G, Arvidsson PM, Töger J, Borgquist R, Domenichini F, Arheden H, Heiberg E. On estimating intraventricular hemodynamic forces from endocardial dynamics: a comparative study with 4D flow MRI. J Biomech. 2017;60:203–210. doi: 10.1016/j.jbiomech.2017.06.046 [DOI] [PubMed] [Google Scholar]
- 25. Sjöberg P, Töger J, Hedström E, Arvidsson PM, Heiberg E, Arheden H, Gustafsson R, Nozohoor S, Carlsson M. Altered biventricular hemodynamic forces in patients with repaired tetralogy of Fallot and right ventricular volume overload due to pulmonary regurgitation. Am J Physiol Heart Circ Physiol. 2018;315:H1691–H1702. doi: 10.1152/ajpheart.00330.2018 [DOI] [PubMed] [Google Scholar]
- 26. Pedrizzetti G, Faganello G, Croatto E, Di Lenarda A. The hemodynamic power of the heart differentiates normal from diseased right ventricles. J Biomech. 2021;119:110312. doi: 10.1016/j.jbiomech.2021.110312 [DOI] [PubMed] [Google Scholar]
- 27. Noble MIM. The contribution of blood momentum to left ventricular ejection in the dog. Circ Res. 1968;23:663–670. doi: 10.1161/01.RES.23.5.663 [DOI] [PubMed] [Google Scholar]
- 28. Chung CS, Shmuylovich L, Kovács SJ. What global diastolic function is, what it is not, and how to measure it. Am J Physiol Heart Circ Physiol. 2015;309:H1392–H1406. doi: 10.1152/ajpheart.00436.2015 [DOI] [PubMed] [Google Scholar]
- 29. Faganello G, Collia D, Furlotti S, Pagura L, Zaccari M, Pedrizzetti G, Di Lenarda A. A new integrated approach to cardiac mechanics: reference values for normal left ventricle. Int J Cardiovasc Imaging. 2020;36:2173–2185. doi: 10.1007/s10554-020-01934-1 [DOI] [PubMed] [Google Scholar]
- 30. Rushmer RF, Harding D, Baker D, Watson N. Initial ventricular impulse. a potential key to cardiac evaluation. Circulation. 1964;29:268–283. doi: 10.1161/01.CIR.29.2.268 [DOI] [PubMed] [Google Scholar]
- 31. Dal Ferro M, De Paris V, Collia D, Stolfo D, Caiffa T, Barbati G, Korcova R, Pinamonti B, Zovatto L, Zecchin M, et al. Left ventricular response to cardiac resynchronization therapy: insights from hemodynamic forces computed by speckle tracking. Front Cardiovasc Med. 2019;6:59. doi: 10.3389/fcvm.2019.00059 [DOI] [PMC free article] [PubMed] [Google Scholar]
- 32. Martiniello AR, Pedrizzetti G, Bianchi V, Tonti G, D’Onofrio A, Caso P. Left ventricular pacing vector selection by novel echo‐particle imaging velocimetry analysis for optimization of quadripolar cardiac resynchronization device: a case report. J Med Case Rep. 2016;10:191. doi: 10.1186/s13256-016-0965-9 [DOI] [PMC free article] [PubMed] [Google Scholar]
- 33. Baldasseroni S, Opasich C, Gorini M, Lucci D, Marchionni N, Marini M, Campana C, Perini G, Deorsola A, Masotti G, et al. Left bundle‐branch block is associated with increased 1‐year sudden and total mortality rate in 5517 outpatients with congestive heart failure: a report from the Italian Network on Congestive Heart Failure. Am Heart J. 2002;143:398–405. doi: 10.1067/mhj.2002.121264 [DOI] [PubMed] [Google Scholar]
- 34. Watanabe H, Sugiura S, Kafuku H, Hisada T. Multiphysics simulation of left ventricular filling dynamics using fluid‐structure interaction finite element method. Biophys J. 2004;87:2074–2085. doi: 10.1529/biophysj.103.035840 [DOI] [PMC free article] [PubMed] [Google Scholar]
- 35. Kheradvar A, Milano M, Gorman RC, Gorman JH, Gharib M. Assessment of left ventricular viscoelastic components based on ventricular harmonic behavior. Cardiovasc Eng. 2006;6:30–39. doi: 10.1007/s10558-006-9001-9 [DOI] [PubMed] [Google Scholar]
- 36. Airale L, Vallelonga F, Forni T, Leone D, Magnino C, Cesareo M, Giordana C, Omedè P, Moretti C, Veglio F. A novel approach to left ventricular filling pressure assessment: the role of hemodynamic forces analysis. Front Cardiovasc Med. 2021;8:1–10. doi: 10.3389/fcvm.2021.704909 [DOI] [PMC free article] [PubMed] [Google Scholar]
- 37. Hove JR, Köster RW, Forouhar AS, Acevedo‐Bolton G, Fraser SE, Gharib M. Intracardiac fluid forces are an essential epigenetic factor for embryonic cardiogenesis. Nature. 2003;421:172–177. doi: 10.1038/nature01282 [DOI] [PubMed] [Google Scholar]
- 38. Andrés‐Delgado L, Mercader N. Interplay between cardiac function and heart development. Biochim Biophys Acta. 2016;1863:1707–1716. doi: 10.1016/j.bbamcr.2016.03.004 [DOI] [PMC free article] [PubMed] [Google Scholar]
- 39. Midgett M, Rugonyi S. Congenital heart malformations induced by hemodynamic altering surgical interventions. Front Physiol. 2014;5:1–18. doi: 10.3389/fphys.2014.00287 [DOI] [PMC free article] [PubMed] [Google Scholar]


