

Abstract
Background
Evidence is limited on the predictive validity of absolute cardiovascular disease (CVD) risk, estimated by multivariable assessments in old age, for disability and mortality. We aimed to examine the longitudinal associations of absolute CVD risk assessed using region‐specific risk estimation charts with disability and mortality among community‐dwelling people aged ≥65 years.
Methods and Results
This retrospective cohort study included 7456 community‐dwelling people aged ≥65 years (mean age, 73.7 years) without CVD and functional decline at baseline. They lived in either Obu City or Midori Ward of Nagoya City, Aichi Prefecture, Japan. We estimated absolute CVD risk using the revised World Health Organization CVD risk estimation charts and stratified risk levels into 3 categories: low (<10%), mid (10% to <20%), and high (≥20%). We followed up the functional disability incidence and all‐cause mortality monthly for 5 years. The prevalence of each CVD risk level based on the laboratory‐based model was as follows: low CVD risk, 1096 (14.7%); mid CVD risk, 5510 (73.9%); and high CVD risk, 850 (11.4%). During follow‐up, the incidence rates of disability and mortality were 33.4 per 1000 and 12.4 per 1000 person‐years, respectively. Cox regression analysis showed that the adjusted hazard ratios (95% CIs) for disability incidence were 1.32 (1.13–1.56) and 1.44 (1.18–1.77) in mid and high CVD risk levels, respectively (reference: low CVD risk level); for mortality incidence, they were 1.53 (1.16–2.01) and 2.02 (1.45–2.80) in mid and high CVD risk levels, respectively (reference: low CVD risk level).
Conclusions
Absolute CVD risk was associated with both disability and mortality in people aged ≥65 years. Estimated CVD risk levels may be useful surrogate markers for disability and mortality risks even when assessed in old age.
Keywords: aged, cardiovascular diseases, mortality, risk assessment
Subject Categories: Cardiovascular Disease, Aging, Primary Prevention, Risk Factors
Nonstandard Abbreviations and Acronyms
- LTCI
long‐term care insurance
- WHO
World Health Organization
Clinical Perspective
What Is New?
Our Japanese cohort study revealed that the absolute cardiovascular disease (CVD) risk estimated by the revised World Health Organization CVD risk charts was significantly associated not only with mortality but also with functional disability.
Additionally, our results suggested that estimated CVD risk levels assessed in old age could be useful to predict disability and mortality as well as CVD risk levels assessed in middle age, as shown in previous studies.
What Are the Clinical Implications?
Our findings reinforced the usefulness of the recently updated World Health Organization CVD risk estimation charts for prediction of adverse health outcomes based on data from a Japanese cohort.
Furthermore, even when assessed in old age, the estimated CVD risk levels may be useful surrogate markers of both disability and mortality risks.
In the aging societies of the world, CVD risk estimation in old age may become increasingly beneficial for early screening of future risk for disability and mortality.
Cardiovascular disease (CVD) is the leading cause of death worldwide. 1 An estimated 17.9 million people died from CVD in 2016, representing 31% of all global deaths. Global deaths from CVD are increasing under the influence of population growth, population aging, and epidemiological changes in CVD. 2 Recently, multivariable CVD risk assessments have been advocated to estimate the absolute CVD risk level and to guide treatment of the risk factors. 3 In recent decades, a variety of CVD risk estimation tools using multivariable risk factors 4 , 5 , 6 have been developed to search for accurate estimation models for individuals’ overall risk of CVD events. Previous large‐scale cohort studies have demonstrated that some CVD risk estimation tools are useful for predicting mortality as well as CVD events. 7 , 8 , 9 Therefore, it is important to examine the predictive validity of CVD risk estimation tools not only for CVD events, but also for other adverse health outcomes.
In Japan, an estimated 370 857 deaths were attributed to CVD in 2016, accounting for 28% of all deaths. 10 According to projections, the proportions of the population aged >65 and >75 years may reach 38% and 25%, respectively, by 2055 in Japan. 11 With the increase in life expectancy, comprehensive health assessments, not only in middle age, but also in old age, have become increasingly important. However, most previous studies using CVD risk estimation tools have examined the relationships between CVD risk assessed in middle age and CVD events or adverse health outcomes. 4 , 5 , 6 Previous large‐scale cohort studies have reported the possibility that the effects of individual cardiovascular risks on mortality are age specific 12 , 13 ; however, the association between CVD risk in old age (≥65 years) and future mortality has not been examined in detail.
CVD is also the leading cause of disability‐adjusted life‐years, 14 which quantify the loss of health attributable to specific diseases and injuries. 15 In Japan, stroke and heart diseases are among the main causes of functional disability, and together these account for 19.8% of the causes of disability based on data from the long‐term care insurance (LTCI) system. 16 Nonetheless, to the best of our knowledge, only 1 previous study, by Vu et al, addressed the association between CVD risk profiles and incidence of disability. 17 However, they only showed the association between CVD risk levels classified by their original definition and functional disability; therefore, external validation of existing and international CVD risk estimation tools for disability prediction has not been examined.
Therefore, we aimed to examine the longitudinal associations of absolute CVD risk assessed in old age with disability and mortality in a cohort study of community‐dwelling people aged ≥65 years.
METHODS
Study Setting and Participants
This retrospective cohort study included community‐dwelling people aged ≥65 years who were part of a subcohort of the NCGG‐SGS (National Centre for Geriatrics and Gerontology Study of Geriatric Syndromes). 18 The data that support the findings of this study are available from the corresponding author upon reasonable request. The inclusion criteria were residence in either Obu City or Midori Ward of Nagoya City and age ≥65 years at the time of baseline assessment. Overall, 10 361 individuals aged ≥65 years completed the baseline assessment. We excluded participants with a history of Alzheimer disease (n=15) or Parkinson disease (n=40) to avoid the effect of progression of their symptoms and excluded participants with depression (n=346) to ensure the accuracy of self‐reported assessment. Additionally, we excluded participants with stroke (n=596) or heart disease (n=1627) to estimate CVD risk levels without prior CVD and excluded participants with prior disability based on the LTCI system at baseline (n=156) and missing data about these criteria (n=57) or the assessment of CVD risks (n=68) at baseline. Finally, 7456 participants were included in the longitudinal analysis.
The study protocol was developed in accordance with the Declaration of Helsinki and was approved by the ethics committee of the National Center for Geriatrics and Gerontology (approval reference number: 1440‐2). Written informed consent was obtained from all participants before their participation in the study.
Estimation of Absolute CVD Risk
We estimated the 10‐year CVD risk using the revised World Health Organization (WHO) CVD risk estimation charts (2019) 19 at baseline. The details about the WHO CVD estimation charts are shown in Data S1, and variables contained in the WHO risk estimation charts are summarized in Table S1.
We assessed the current history of diabetes based on face‐to‐face interviews conducted by nurses. Nurses measured systolic blood pressure using an automated sphygmomanometer with the participant seated. We also measured the total serum cholesterol in millimoles per liter by the enzyme method in a laboratory at Good Life Design Company in Japan. We assessed smoking status as the absence or presence of regular smoking (current versus former/never) based on interviews conducted by study assistants. Body mass index was calculated as body weight (kilograms) divided by the square of body height (meters squared). Finally, we calculated the absolute CVD risk (percent) based on the above risk status using the revised WHO CVD risk estimation charts and stratified the CVD risk into 3 categories: low (<10%), mid (10% to <20%), and high (≥20%). 20
Follow‐Up of Functional Disability and Mortality
We followed up the incidence of functional disability based on the public LTCI system for an average of 65.6±19.8 months. The nationally uniform criteria for long‐term care need certification were objectively established by the Japanese government, and the computer‐aided standardized needs‐assessment system categorizes people into 7 need levels (certified support level ranging between 1 and 2 or care level ranging between 1 and 5) based on the estimated time required for care in 9 categories (grooming, bathing, eating, toileting, transferring, assistance with instrumental activities of daily living, behavioral problems, rehabilitation, and medical services). 21 In the present study, we received the certification data of care needs from the municipal government monthly, and incidences of functional disability were defined as new certifications by the LTCI service at any level reflecting that the individuals require constant support or care in basic or instrumental activities of daily living. The details about the certification process of the LTCI system are shown in Data S2. Follow‐up was censored when participants relocated to another city or died.
We also followed up the incidence of all‐cause mortality using residence records and local government data for an average of 70.4±14.7 months. In the present study, we also received vital data from the municipal government monthly, and the incidence of death was identified. Follow‐up was censored when participants relocated to another city.
Assessment of Potential Confounding Factors
We used medical history of pulmonary disease and cancer, the number of prescribed medications, and education level as covariates; this information was collected through face‐to‐face interviews at baseline. We also included cognitive function, slow gait speed, depressive symptoms, physical inactivity, drinking habits, employment status, and living arrangements (living alone or cohabiting) as covariates. We measured cognitive function using the Mini‐Mental State Examination. 22 We also measured gait speed using a 2.4‐m walkway, and a gait speed under 1.0 m/s was defined as slow. The cutoff point <1.0 m/s was identified in our earlier study, 23 and its predictive validity for disability was confirmed in another study of ours. 24 We assessed depressive symptoms using the 15‐item Geriatric Depression Scale. 25 Participants who scored 6 or higher on the Geriatric Depression Scale were considered to have depressive symptoms. 26 We evaluated physical inactivity by asking the following questions: (1) Do you engage in more than moderate levels of physical exercise or sports aimed at health? (2) Do you engage in low levels of physical exercise aimed at health? Participants who responded “no” to both questions were defined as inactive. 27 We defined current drinking habits as regular alcohol consumption (current versus former/never).
Statistical Analysis
We compared baseline characteristics using laboratory‐based CVD risk levels (low, mid, and high risk levels). We also examined baseline CVD risk levels and incidence rates of disability and mortality using the χ2 test. We estimated the cumulative survival rates of the incidence of disability and mortality during the follow‐up period, according to CVD risk levels at baseline using Kaplan‐Meier curves, and intergroup differences were examined using the log‐rank test. We used Bonferroni adjustment for multiple comparisons in the log‐rank test. Finally, we performed Cox proportional hazards regressions to examine the effects of estimated CVD risk levels on the incidence of disability and mortality. The covariate‐adjusted hazard ratios (HRs) were calculated with 95% CIs. Additionally, we conducted a stratified Cox proportion hazards regression analysis by age groups of <75 and ≥75 years to examine the differences in the predictive validity of CVD risk levels between the young‐old and old‐old populations, respectively. In the adjusted models of the Cox proportional hazards regression, the backward stepwise method was used for variable selection. The proportional hazards assumptions were verified by checking the log‐log plot for each of the adjusted models, and no violations were found. Relocation or death in survival analysis for disability, and relocation in survival analysis for mortality, were treated as censored observations.
All analyses were performed using IBM SPSS Statistics 25 software (IBM Japan, Tokyo, Japan).
RESULTS
CVD Risk Levels and Characteristics at Baseline
Among the 7456 individuals who participated in our baseline assessment, the group classification according to CVD risk levels was as follows: (1) low risk: n=1096 (14.7%), (2) mid risk: n=5510 (73.9%), (3) high risk: n=850 (11.4%) in the laboratory‐based model and (1) low risk: n=1073 (14.4%), (2) mid risk: n=5653 (75.8%), (3) high risk: n=730 (9.8%) in the non–laboratory‐based model. The overall prevalence and age‐ and sex‐stratified prevalence are shown in Figure 1 and Figure S1.
Figure 1. Prevalence of cardiovascular disease risk levels according to age and sex based on the laboratory‐based model.

The differences in baseline characteristics between laboratory‐based CVD levels are shown in Table 1. In regard to components of the WHO risk estimation model, increasing CVD risk levels were associated with increase in age, decrease in the proportion of female sex, increase in the prevalence of diabetes and the proportion of current smokers, and elevated systolic blood pressure, total cholesterol levels, and body mass index. In regard to other characteristics, increasing CVD risk levels were associated with an increased prevalence of pulmonary disease and cancer, increased number of prescribed medications, lower Mini‐Mental State Examination score, increased prevalence of slow gait speed and physical inactivity, increased proportions of current drinkers, and a decreased proportion of individuals living alone.
Table 1.
Baseline Characteristics According to Estimated CVD Risk Levels
| Overall, n=7456 | Missing | CVD risk levels* | P value † | |||
|---|---|---|---|---|---|---|
| Low risk, <10%, n=1096 | Mid risk, 10%–<20%, n=5510 | High risk, ≥20%, n=850 | ||||
| Components of the WHO risk estimation model | ||||||
| Age, y | 73.7 [73.6–73.8] | 0 | 70.6 [70.3–70.8] | 74.2 [74.1–74.3] | 74.5 [74.1–74.8] | <0.01 |
| Female sex, % | 53.4 [52.3–54.6] | 0 | 98.3 [97.3–99.0] | 50.1 [48.8–51.5] | 17.1 [14.6–19.8] | <0.01 |
| Diabetes, % | 10.5 [9.8–11.2] | 0 | 0.3 [0.1–0.8] | 7.7 [7.0–8.4] | 41.9 [38.5–45.3] | <0.01 |
| Smoking status, % | 8.4 [7.8–9.1] | 0 | 0.5 [0.2–1.2] | 6.2 [5.5–6.8] | 33.5 [30.4–36.8] | <0.01 |
| Systolic blood pressure, mm Hg | 140.2 [139.7–140.6] | 0 | 120.1 [119.2–121.0] | 140.6 [140.2–141.1] | 163.0 [161.7–164.3] | <0.01 |
| Total cholesterol, mmol/L | 5.5 [5.4–5.5] | 0 | 5.5 [5.5–5.6] | 5.4 [5.4–5.4] | 5.6 [5.5–5.7] | <0.01 |
| Body mass index, kg/m2 | 23.1 [23.0–23.2] | 0 | 22.3 [22.1–22.4] | 23.1 [23.1–23.2] | 23.9 [23.7–24.1] | <0.01 |
| Other characteristics | ||||||
| Pulmonary disease, % | 13.7 [12.9–14.5] | 2 | 11.4 [9.6–13.4] | 14.2 [13.3–15.1] | 13.2 [11.0–15.6] | 0.04 |
| Cancer, % | 11.9 [11.2–12.7] | 2 | 9.6 [7.9–11.5] | 12.4 [11.5–13.3] | 11.8 [9.7–14.1] | 0.03 |
| Prescribed medications, n | 2.2 [2.2–2.3] | 23 | 1.8 [1.7–2.0] | 2.3 [2.2–2.3] | 2.6 [2.5–2.8] | <0.01 |
| Education level, y | 11.6 [11.6–11.7] | 10 | 11.6 [11.5–11.7] | 11.6 [11.6–11.7] | 11.8 [11.6–12.0] | 0.09 |
| MMSE score | 26.1 [26.1–26.2] | 19 | 26.8 [26.7–27.0] | 26.0 [26.0–26.1] | 25.8 [25.6–26.0] | <0.01 |
| Slow gait speed, % | 14.8 [14.1–15.7] | 24 | 8.3 [6.7–10.1] | 16.0 [15.1–17.0] | 15.8 [13.4–18.5] | <0.01 |
| Depressive symptoms, % | 13.4 [12.7–14.2] | 34 | 12.6 [10.7–14.7] | 13.4 [12.5–14.3] | 14.7 [12.4–17.3] | 0.39 |
| Physical inactivity, % | 24.5 [23.6–25.5] | 13 | 20.4 [18.0–22.9] | 24.4 [23.3–25.6] | 30.7 [27.6–33.9] | <0.01 |
| Drinking habit, % | 44.5 [43.4–45.6] | 0 | 31.2 [28.5–34.0] | 45.1 [43.8–46.4] | 57.6 [54.2–61.0] | <0.01 |
| Employment, % | 24.6 [23.7–25.6] | 0 | 26.3 [23.7–29.0] | 24.2 [23.1–25.4] | 25.3 [22.4–28.4] | 0.31 |
| Living alone, % | 12.1 [11.4–12.9] | 17 | 13.7 [11.7–15.9] | 12.3 [11.4–13.2] | 8.7 [6.9–10.8] | <0.01 |
Data are expressed as mean or percent with 95% CI. CVD indicates cardiovascular disease; MMSE, Mini‐Mental State Examination; and WHO, World Health Organization.
CVD risk levels in this table are defined using the laboratory‐based prediction model including age, sex, current diabetes history, smoking status, systolic blood pressure, and total cholesterol.
P values are based on 1‐way ANOVA for continuous variables and χ2 tests for categorical variables.
Longitudinal Associations of CVD Risk Levels With Disability and Mortality
During the follow‐up period, the incidence rate of functional disability was 33.4 per 1000 person‐years (95% CI, 31.7–35.3) with 321 censored data (relocation, n=90; death, n=231). The incidence rate of all‐cause mortality was 12.4 per 1000 person‐years (95% CI, 11.4–13.5) with 105 censored data (relocation).
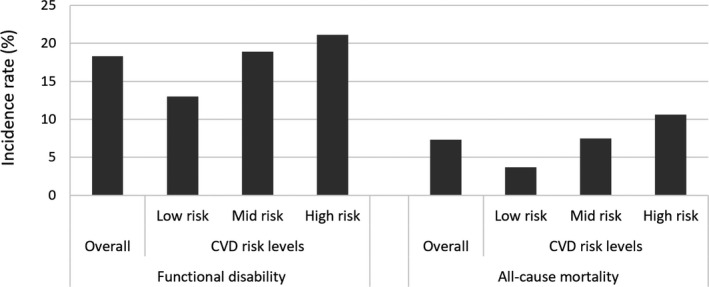
The proportions of functional disability and all‐cause mortality are shown in Figure 2 and Figure S2. The incidence proportions of disability in the low, mid, and high CVD risk groups were 13.0%, 18.9%, and 21.1%, respectively, in the laboratory‐based estimation model, and 13.1%, 19.2%, and 18.5%, respectively, in the non–laboratory‐based estimation model. The incidence rates of mortality in the low, mid, and high CVD risk groups were 3.7%, 7.5%, and 10.6%, respectively, in the laboratory‐based estimation model, and 4.0%, 7.2%, and 12.3%, respectively, in the non–laboratory‐based estimation model. Results from the χ2 test showed that CVD risk levels at baseline were associated with both functional disability and all‐cause mortality. The associations of CVD risk level with disability and mortality were similar in both laboratory‐based and non–laboratory‐based models (all P<0.01).
Figure 2. Incidence proportions of functional disability and all‐cause mortality according to cardiovascular disease (CVD) risk levels based on the laboratory‐based model.
The survival rates for disability and mortality according to CVD risk levels are shown in Figure 3 and Figure S3. The probability of disability was higher in mid and high CVD risk levels than in low CVD risk levels (all P<0.01), but the difference was not substantial between mid and high CVD risk levels (P≥0.05). The probability of mortality was higher in mid and high CVD risk levels than in low CVD risk levels (all P<0.01), and the probability of mortality was also different between mid and high CVD risk levels (P<0.01). The results of the survival analysis were similar in both the laboratory‐based and non–laboratory‐based models.
Figure 3. Kaplan‐Meier survival estimates for disability and mortality according to cardiovascular disease risk levels based on the laboratory‐based model.

Left panel: survival rates for functional disability. Right panel: survival rates for all‐cause mortality.
In the laboratory‐based model, the Cox regression analysis showed that the covariate‐adjusted HRs and 95% CIs for the incidence of disability (reference: low CVD risk level) were 1.32 (95% CI, 1.13–1.56) in the mid CVD risk level and 1.44 (95% CI, 1.18–1.77) in the high CVD risk level, and the covariate‐adjusted HRs and 95% CIs for the incidence of mortality (reference: low CVD risk level) were 1.53 (95% CI, 1.16–2.01) in the mid CVD risk level and 2.02 (95% CI, 1.45–2.80) in the high CVD risk level (Table 2). Similarly, in the non–laboratory‐based model, the Cox regression analysis showed that the covariate‐adjusted HRs and 95% CIs for the incidence of disability (reference: low CVD risk level) were 1.34 (95% CI, 1.14–1.57) in the mid CVD risk level and 1.49 (95% CI, 1.21–1.85) in the high CVD risk level, and the covariate‐adjusted HRs and 95% CIs for the incidence of mortality (reference: low CVD risk level) were 1.50 (95% CI, 1.14–1.98) in the mid CVD risk level and 2.43 (95% CI, 1.74–3.38) in the high CVD risk level (Table S2). In regard to the stratified analysis by age group, among participants aged <75 years, covariate‐adjusted HRs for disability and mortality remained statistically significant in the high CVD risk level (P<0.01) but not in the mid CVD risk level (P≥0.05). Among participants aged ≥75 years, covariate‐adjusted HRs for disability and mortality lost statistical significance both in the mid and high CVD risk levels (P≥0.05, Table S3).
Table 2.
Incidence of Disability and Mortality According to CVD Risk Levels Based on the Laboratory‐Based Model
| Disability | Mortality | |||||||||||
|---|---|---|---|---|---|---|---|---|---|---|---|---|
| Crude model | Adjusted model* | Crude model | Adjusted model* | |||||||||
| HR | 95% CI | P value | HR | 95% CI | P value | HR | 95% CI | P value | HR | 95% CI | P value | |
| CVD risk † | ||||||||||||
| Low, <10% | Ref | Ref | Ref | Ref | ||||||||
| Mid, 10% to <20% | 1.62 | 1.36–1.93 | <0.01 | 1.32 | 1.13–1.56 | 0.01 | 2.22 | 1.61–3.06 | <0.01 | 1.53 | 1.16–2.01 | <0.01 |
| High, ≥20% | 1.81 | 1.45–2.25 | <0.01 | 1.44 | 1.18–1.77 | <0.01 | 3.17 | 2.19–4.58 | <0.01 | 2.02 | 1.45–2.80 | <0.01 |
| Potential confounding factors | ||||||||||||
| Pulmonary disease, n (%) | 1.38 | 1.12–1.69 | <0.01 | |||||||||
| Cancer, n (%) | 1.29 | 1.13–1.48 | <0.01 | 1.76 | 1.44–2.15 | <0.01 | ||||||
| Prescribed medications, n | 1.08 | 1.06–1.10 | <0.01 | |||||||||
| Education level, y | 0.96 | 0.94–0.98 | <0.01 | |||||||||
| MMSE score | 0.91 | 0.89–0.93 | <0.01 | 0.92 | 0.89–0.94 | <0.01 | ||||||
| Slow gait speed, n (%) | 2.64 | 2.36–2.95 | <0.01 | 1.93 | 1.60–2.33 | <0.01 | ||||||
| Depressive symptoms, n (%) | 1.25 | 1.11–1.42 | <0.01 | 1.40 | 1.14–1.70 | <0.01 | ||||||
| Physical inactivity, n (%) | 1.11 | 0.99–1.23 | 0.07 | |||||||||
| Drinking habit, n (%) | 0.82 | 0.73–0.91 | <0.01 | |||||||||
| Employment, n (%) | 0.65 | 0.57–0.74 | <0.01 | 0.79 | 0.65–0.96 | 0.02 | ||||||
| Living alone, n (%) | 1.45 | 1.27–1.66 | <0.01 | 1.36 | 1.09–1.69 | <0.01 | ||||||
CVD indicates cardiovascular disease; HR, hazard ratio; MMSE, Mini‐Mental State Examination; and Ref, reference.
The backward stepwise method was applied for variable selection including potential confounding factors (pulmonary disease, cancer, prescribed medications, educational level, MMSE, slow gait speed, depressive symptoms, physical inactivity, drinking habit, employment, and living alone).
CVD risk levels in this table are defined by the laboratory‐based prediction model including age, sex, current diabetes history, smoking status, systolic blood pressure, and total cholesterol.
DISCUSSION
Our longitudinal analysis revealed that the absolute CVD risk estimated by the revised WHO CVD risk charts was associated not only with mortality but also with disability. Additionally, our results suggested that estimated CVD risk levels assessed in old age could be useful to predict disability and mortality as well as CVD risk levels assessed in middle age, as shown in previous studies.
Previous epidemiological studies have demonstrated that individual CVD risk factors are also risk factors for functional disability in old age. In terms of multiple CVD risk assessment, Vu et al examined CVD risk levels and functional disability; however, they assessed the absolute CVD risk in younger subjects using their original definition. 17 To the best of our knowledge, this is the first report to demonstrate the predictive validity of existing and international CVD risk estimation tools for estimating the risk of functional disability. In regard to the potential mechanisms behind the association between CVD risk levels and functional disability, it is possible that participants with high CVD risk at baseline develop myocardial infarction or stroke more frequently during the follow‐up period, and these acute symptoms directly inhibit activities of daily living. Another possibility is that absolute CVD risk is a surrogate marker of biological aging. Vascular endothelial dysfunction with aging plays a key role in the increased risk of CVD and is mediated largely by NO insufficiency linked to vascular oxidative stress and chronic low‐grade inflammation, as modulated by altered cellular homeostasis/stress resistance processes. 28 For instance, a previous cross‐sectional study demonstrated that CVD risk is associated with frailty 29 ; a high‐risk state for disability development is based on diminished homeostatic capacity across multiple physiological systems. 30 Additionally, Bouillon et al reported that estimated CVD risk predicted the incidence of frailty in a longitudinal analysis. 31 Therefore, multivariable CVD risk estimation may also be a useful tool for estimating biological aging as well as CVD risk. Additionally, Sergi et al showed that frailty status predicts the incidence of CVD events 32 ; therefore, the reverse temporal relationship between CVD risk and frailty or disability should be examined in a future study.
Furthermore, in our study we showed that estimated CVD risk assessed in old age could be useful to predict 5‐year disability and mortality as well as CVD risk levels in middle age, as shown in previous studies. In Japan, the average life span is ≈81 years for men and 87 years for women, 33 and interventions to expand disability‐free life expectancy are urgently required. Furthermore, early screening and intervention to mitigate the adverse effects of prolonged exposure to CVD risks in old age are essential, although the optimal approach is the control of CVD risk beginning early in life. 34 In older people, relatively short‐term risk prediction may be more relevant than lifetime risk prediction, given the remaining years of life. 34 Therefore, our results demonstrating the short‐term predictive ability of CVD risk estimation in old age may have important implications for clinical settings in the aging societies of the world. However, in our stratified analysis, the CVD risk levels were associated with disability and mortality only among participants aged <75 years. Additionally, de Ruijter et al examined the predictive performance of multivariable CVD risk assessment for 5‐year cardiovascular mortality among much older people (aged 85 years at baseline), and in their study, the CVD risk score could not identify those at high risk of cardiovascular mortality. 35 In old‐old age, it is possible that the proportions of disability and mortality caused by risk factors other than CVD risk, such as dementia or pneumonia, are increased, and for that reason, the predictive validity of estimated CVD risk levels for disability and mortality may be limited. Further investigations are needed to confirm the predictive performance of short‐term CVD risk estimation in old age.
Additionally, previous studies demonstrating that CVD risk estimation based on multivariable risk assessments is useful to predict not only CVD events, but also mortality, were based on data from Western countries. 7 , 8 , 9 However, predictive validation for mortality using region‐specific CVD risk estimation tools, developed for non‐Western countries, has rarely been conducted. In the present study, we demonstrated that CVD risk levels estimated by region‐specific charts are useful for predicting the incidence of mortality using the revised WHO CVD risk estimation charts based on a Japanese cohort study. These findings reinforce the usefulness of the recently updated WHO CVD risk estimation charts for mortality risk prediction.
Strengths and Limitations
This study has several strengths and implications. We included large and well‐characterized cohort data, including a monthly follow‐up of disability and mortality. In addition, we collected data on functional disability from the objective and mandatory assessment in the Japanese public LTCI system, because it has no dropout during the follow‐up period except for relocation or death. However, certain limitations of this study should be addressed. First, we could not access information about the cause of disability and mortality; therefore, we did not establish direct causality. Second, our study examined linear relationships between CVD risks and disability or mortality but did not address nonlinear relationships. However, previous studies have reported that relatively low blood pressure 36 or body mass index 37 may be associated with worse outcomes, particularly among frail or multimorbid older individuals. Further studies are needed to examine the possibility of U‐shaped relationships between specific CVD risks and disability or mortality. Third, our sample came from only a single country (Japan); therefore, further investigation is required to clarify whether our findings can be generalized to other countries. Fourth, we did not control for age in the Cox proportional hazards regression because of multicollinearity (CVD risk estimation chart already contained age). Although we conducted sensitivity analysis stratified by age group, the actual age may have potential effects on our results about CVD risk levels and disability and mortality. Finally, this was a single‐center retrospective study; therefore, information bias and missing data should be taken into consideration when interpreting our results.
In conclusion, absolute CVD risk levels estimated using the revised WHO CVD risk charts were associated not only with mortality but also with disability. The estimated CVD risk levels in old age could be useful for predicting disability and mortality as well as CVD risk levels in middle age, as shown in previous studies. The estimated CVD risk levels may be useful surrogate markers of both disability and mortality risk, even based on assessment in old age.
Sources of Funding
This work was supported by the Japan Society for the Promotion of Science KAKENHI Grants‐in‐Aid for Scientific Research B (grant number 23300205), for Japan Society for the Promotion of Science Research Fellows (grant number 20J01647), and for Early‐Career Scientists (grant number 20K19442); the Strategic Basic Research Programs Redesigning Communities for Aged Society of the Japan Science and Technology Agency; the Health and Labor Sciences Research Grants (Comprehensive Research on Aging and Health) from the Japanese Ministry of Health, Labor, and Welfare (grant numbers H23‐tyoujyu‐ippan‐001, H24‐tyoujyu‐ippan‐004); and the Research Funding for Longevity Sciences from the National Center for Geriatrics and Gerontology (grant numbers 22‐16, 24‐18, 25‐26).
Disclosures
None.
Supporting information
Data S1–S2
Tables S1–S3
Figures S1–S3
Acknowledgments
The authors thank Obu City and the Nagoya City Office for their assistance in recruiting participants. The authors also thank the health care staff for their assistance with the assessments.
For Sources of Funding and Disclosures, see page 9.
References
- 1. World Health Organization . Cardiovascular diseases (CVDs)—fact sheet. 2017. Available at: https://www.who.int/news‐room/fact‐sheets/detail/cardiovascular‐diseases‐(cvds). Accessed March 11, 2021.
- 2. Roth GA, Forouzanfar MH, Moran AE, Barber R, Nguyen G, Feigin VL, Naghavi M, Mensah GA, Murray CJL. Demographic and epidemiologic drivers of global cardiovascular mortality. N Engl J Med. 2015;372:1333–1341. doi: 10.1056/NEJMoa1406656 [DOI] [PMC free article] [PubMed] [Google Scholar]
- 3. De Backer G, Ambrosioni E, Borch‐Johnsen K, Brotons C, Cifkova R, Dallongeville J, Ebrahim S, Faergeman O, Graham I, Mancia G, et al.; European Society of Cardiology Committee for Practice Guidelines . European guidelines on cardiovascular disease prevention in clinical practice. Third Joint Task Force of European and Other Societies on Cardiovascular Disease Prevention in Clinical Practice. Eur Heart J. 2003;24:1601–1610. doi: 10.1016/s0195-668x(03)00347-6 [DOI] [PubMed] [Google Scholar]
- 4. Conroy RM, Pyörälä K, Fitzgerald AP, Sans S, Menotti A, De Backer G, De Bacquer D, Ducimetiere P, Jousilahti P, Keil U, et al.; SCORE Project Group . Estimation of ten‐year risk of fatal cardiovascular disease in Europe: the SCORE project. Eur Heart J. 2003;24:987–1003. doi: 10.1016/S0195-668X(03)00114-3 [DOI] [PubMed] [Google Scholar]
- 5. Hippisley‐Cox J, Coupland C, Vinogradova Y, Robson J, May M, Brindle P. Derivation and validation of QRISK, a new cardiovascular disease risk score for the United Kingdom: prospective open cohort study. BMJ. 2007;335:136. doi: 10.1136/bmj.39261.471806.55 [DOI] [PMC free article] [PubMed] [Google Scholar]
- 6. D'Agostino RB, Vasan RS, Pencina MJ, Wolf PA, Cobain M, Massaro JM, Kannel WB. General cardiovascular risk profile for use in primary care: the Framingham Heart Study. Circulation. 2008;117:743–753. doi: 10.1161/CIRCULATIONAHA.107.699579 [DOI] [PubMed] [Google Scholar]
- 7. Pocock SJ, McCormack V, Gueyffier F, Boutitie F, Fagard RH, Boissel JP. A score for predicting risk of death from cardiovascular disease in adults with raised blood pressure, based on individual patient data from randomised controlled trials. BMJ. 2001;323:75–81. doi: 10.1136/bmj.323.7304.75 [DOI] [PMC free article] [PubMed] [Google Scholar]
- 8. Sotos‐Prieto M, Mattei J, Cook NR, Hu FB, Willett WC, Chiuve SE, Rimm EB, Sesso HD. Association between a 20‐year cardiovascular disease risk score based on modifiable lifestyles and total and cause‐specific mortality among US men and women. J Am Heart Assoc. 2018;7:e010052. doi: 10.1161/JAHA.118.010052 [DOI] [PMC free article] [PubMed] [Google Scholar]
- 9. Razavi AC, Potts KS, Kelly TN, He J, Fernandez C, Krousel‐Wood M, Anderson AH, Bundy J, Whelton SP, Blumenthal RS, et al. Pooled cohort equations heart failure risk score predicts cardiovascular disease and all‐cause mortality in a nationally representative sample of US adults. BMC Cardiovasc Disord. 2020;20:202. doi: 10.1186/s12872-020-01485-2 [DOI] [PMC free article] [PubMed] [Google Scholar]
- 10. Arai H, Mortaki K, Rane P, Quinn C, Zhao Z, Qian Y. Estimating years of life lost due to cardiovascular disease in Japan. Circ J. 2019;83:1006–1010. doi: 10.1253/circj.CJ-18-1216 [DOI] [PubMed] [Google Scholar]
- 11. National Institute of Population and Society Security Research . Population projections for Japan: 2016–2065. 2017. Available at: http://www.ipss.go.jp/pp‐zenkoku/e/zenkoku_e2017/pp_zenkoku2017e.asp. Accessed March 11, 2021.
- 12. Khang YH, Lynch JW, Jung‐Choi K, Cho HJ. Explaining age‐specific inequalities in mortality from all causes, cardiovascular disease and ischaemic heart disease among South Korean male public servants: relative and absolute perspectives. Heart. 2008;94:75–82. doi: 10.1136/hrt.2007.117747 [DOI] [PubMed] [Google Scholar]
- 13. Hirakawa Y, Ninomiya T, Kiyohara Y, Murakami Y, Saitoh S, Nakagawa H, Okayama A, Tamakoshi A, Sakata K, Miura K, et al.; Evidence for Cardiovascular Prevention From Observational Cohorts in Japan Research Group (EPOCH‐Japan) . Age‐specific impact of diabetes mellitus on the risk of cardiovascular mortality: an overview from the evidence for Cardiovascular Prevention from Observational Cohorts in the Japan Research Group (EPOCH‐Japan). J Epidemiol. 2017;27:123–129. doi: 10.1016/j.je.2016.04.001 [DOI] [PMC free article] [PubMed] [Google Scholar]
- 14. Joseph P, Leong D, McKee M, Anand SS, Schwalm J, Teo K, Mente A, Yusuf S. Reducing the global burden of cardiovascular disease, part 1: the epidemiology and risk factors. Circ Res. 2017;121:677–694. doi: 10.1161/CIRCRESAHA.117.308903 [DOI] [PubMed] [Google Scholar]
- 15. GBD 2017 DALYs and HALE Collaborators . Global, regional, and national disability‐adjusted life‐years (DALYs) for 359 diseases and injuries and healthy life expectancy (HALE) for 195 countries and territories, 1990‐2017: a systematic analysis for the Global Burden of Disease Study 2017. Lancet. 2018;392:1859–1922. doi: 10.1016/S0140-6736(18)32335-3 [DOI] [PMC free article] [PubMed] [Google Scholar]
- 16. Cabinet Office, Government of Japan . Annual Report on the Aging Society 2018. 2018. Available at: https://www8.cao.go.jp/kourei/english/annualreport/2018/2018pdf_e.html. Accessed March 11, 2021.
- 17. Vu TH, Lloyd‐Jones DM, Liu K, Stamler J, Garside DB, Daviglus ML. Optimal levels of all major cardiovascular risk factors in younger age and functional disability in older age: the Chicago Heart Association Detection Project in Industry 32‐Year Follow‐Up Health Survey. Circ Cardiovasc Qual Outcomes. 2016;9:355–363. doi: 10.1161/CIRCOUTCOMES.115.002519 [DOI] [PMC free article] [PubMed] [Google Scholar]
- 18. Shimada H, Tsutsumimoto K, Lee S, Doi T, Makizako H, Lee S, Harada K, Hotta R, Bae S, Nakakubo S, et al. Driving continuity in cognitively impaired older drivers. Geriatr Gerontol Int. 2016;16:508–514. doi: 10.1111/ggi.12504 [DOI] [PubMed] [Google Scholar]
- 19. WHO CVD Risk Chart Working Group . World Health Organization cardiovascular disease risk charts: revised models to estimate risk in 21 global regions. Lancet Glob Health. 2019;7:e1332–e1345. doi: 10.1016/S2214-109X(19)30318-3 [DOI] [PMC free article] [PubMed] [Google Scholar]
- 20. World Health Organization . Prevention of cardiovascular disease: pocket guidelines for assessment and management of cardiovascular risk (WHO/ISH cardiovascular risk prediction charts for the South‐East Asia region). 2007. Available at: https://apps.who.int/iris/handle/10665/43784. Accessed June 7, 2021.
- 21. Tsutsui T, Muramatsu N. Care‐needs certification in the long‐term care insurance system of Japan. J Am Geriatr Soc. 2005;53:522–527. doi: 10.1111/j.1532-5415.2005.53175.x [DOI] [PubMed] [Google Scholar]
- 22. Folstein MF, Robins LN, Helzer JE. The Mini‐Mental State Examination. Arch Gen Psychiatry. 1983;40:812. doi: 10.1001/archpsyc.1983.01790060110016 [DOI] [PubMed] [Google Scholar]
- 23. Shimada H, Suzuki T, Suzukawa M, Makizako H, Doi T, Yoshida D, Tsutsumimoto K, Anan Y, Uemura K, Ito T, et al. Performance‐based assessments and demand for personal care in older Japanese people: a cross‐sectional study. BMJ Open. 2013;3:e002424. doi: 10.1136/bmjopen-2012-002424 [DOI] [PMC free article] [PubMed] [Google Scholar]
- 24. Doi T, Shimada H, Makizako H, Tsutsumimoto K, Hotta R, Nakakubo S, Suzuki T. Mild cognitive impairment, slow gait, and risk of disability: a prospective study. J Am Med Dir Assoc. 2015;16:1082–1086. doi: 10.1016/j.jamda.2015.07.007 [DOI] [PubMed] [Google Scholar]
- 25. Yesavage JA. Geriatric depression scale. Psychopharmacol Bull. 1988;24:709–711. [PubMed] [Google Scholar]
- 26. Ezzati A, Katz MJ, Derby CA, Zimmerman ME, Lipton RB. Depressive symptoms predict incident dementia in a community sample of older adults: results from the Einstein Aging Study. J Geriatr Psychiatry Neurol. 2019:891988718824036. doi: 10.1177/0891988718824036 [DOI] [PMC free article] [PubMed] [Google Scholar]
- 27. Shimada H, Makizako H, Doi T, Yoshida D, Tsutsumimoto K, Anan Y, Uemura K, Ito T, Lee S, Park H, et al. Combined prevalence of frailty and mild cognitive impairment in a population of elderly Japanese people. J Am Med Dir Assoc. 2013;14:518–524. doi: 10.1016/j.jamda.2013.03.010 [DOI] [PubMed] [Google Scholar]
- 28. Seals DR, Kaplon RE, Gioscia‐Ryan RA, LaRocca TJ. You're only as old as your arteries: translational strategies for preserving vascular endothelial function with aging. Physiology (Bethesda). 2014;29:250–264. doi: 10.1152/physiol.00059.2013 [DOI] [PMC free article] [PubMed] [Google Scholar]
- 29. Ramsay SE, Arianayagam DS, Whincup PH, Lennon LT, Cryer J, Papacosta AO, Iliffe S, Wannamethee SG. Cardiovascular risk profile and frailty in a population‐based study of older British men. Heart. 2015;101:616–622. doi: 10.1136/heartjnl-2014-306472 [DOI] [PMC free article] [PubMed] [Google Scholar]
- 30. Fried LP, Tangen CM, Walston J, Newman AB, Hirsch C, Gottdiener J, Seeman T, Tracy R, Kop WJ, Burke G, et al.; Cardiovascular Health Study Collaborative Research Group . Frailty in older adults: evidence for a phenotype. J Gerontol A Biol Sci Med Sci. 2001;56:M146–M156. doi: 10.1093/gerona/56.3.M146 [DOI] [PubMed] [Google Scholar]
- 31. Bouillon K, Batty GD, Hamer M, Sabia S, Shipley MJ, Britton A, Singh‐Manoux A, Kivimaki M. Cardiovascular disease risk scores in identifying future frailty: the Whitehall II prospective cohort study. Heart. 2013;99:737–742. doi: 10.1136/heartjnl-2012-302922 [DOI] [PMC free article] [PubMed] [Google Scholar]
- 32. Sergi G, Veronese N, Fontana L, De Rui M, Bolzetta F, Zambon S, Corti M‐C, Baggio G, Toffanello ED, Crepaldi G, et al. Pre‐frailty and risk of cardiovascular disease in elderly men and women: the Pro. V.A. study. J Am Coll Cardiol. 2015;65:976–983. doi: 10.1016/j.jacc.2014.12.040 [DOI] [PubMed] [Google Scholar]
- 33. Ministry of Health, Labour and Welfare . Vital Statistics Japan. 2019. Available at: https://www.mhlw.go.jp/toukei/saikin/hw/life/life19/index.html. Accessed March 11, 2021. [Google Scholar]
- 34. Kannel WB. Cardiovascular disease preventive measures for the older patient: an epidemiologic perspective. Am J Geriatr Cardiol. 2006;15:382–388. doi: 10.1111/j.1076-7460.2006.04397.x [DOI] [PubMed] [Google Scholar]
- 35. de Ruijter W, Westendorp RG, Assendelft WJ, den Elzen WPJ, de Craen AJM, le Cessie S, Gussekloo J. Use of Framingham risk score and new biomarkers to predict cardiovascular mortality in older people: population based observational cohort study. BMJ. 2009;338:a3083. doi: 10.1136/bmj.a3083 [DOI] [PMC free article] [PubMed] [Google Scholar]
- 36. Anker D, Santos‐Eggimann B, Santschi V, Del Giovane C, Wolfson C, Streit S, Rodondi N, Chiolero A. Screening and treatment of hypertension in older adults: less is more? Public Health Rev. 2018;39:26. doi: 10.1186/s40985-018-0101-z [DOI] [PMC free article] [PubMed] [Google Scholar]
- 37. Yamazaki K, Suzuki E, Yorifuji T, Tsuda T, Ohta T, Ishikawa‐Takata K, Doi H. Is there an obesity paradox in the Japanese elderly population? A community‐based cohort study of 13 280 men and women. Geriatr Gerontol Int. 2017;17:1257–1264. doi: 10.1111/ggi.12851 [DOI] [PubMed] [Google Scholar]
Associated Data
This section collects any data citations, data availability statements, or supplementary materials included in this article.
Supplementary Materials
Data S1–S2
Tables S1–S3
Figures S1–S3