

Abstract
Background
We previously reported that resuscitation delivering electrical shocks guided by real‐time ventricular fibrillation amplitude spectral area (AMSA) enabled return of spontaneous circulation (ROSC) with fewer shocks, resulting in less myocardial dysfunction. We now hypothesized that AMSA could also guide delivery of epinephrine, expecting further outcome improvement consequent to less electrical and adrenergic burdens.
Methods and Results
A swine model of ventricular fibrillation was used to compare after 10 minutes of untreated ventricular fibrillation a guidelines‐driven (n=8) resuscitation protocol, delivering shocks every 2 minutes and epinephrine every 4 minutes, with an AMSA‐driven shocks (n=8) protocol, delivering epinephrine every 4 minutes, and with an AMSA‐driven shocks and epinephrine (ADSE; n=8) protocol. For guidelines‐driven, AMSA‐driven shocks, and ADSE protocols, the time to ROSC (mean±SD) was 569±164, 410±111, and 400±80 seconds (P=0.045); the number of shocks (mean±SD) was 5±2, 3±1, and 3±2 (P=0.024) with ADSE fewer than guidelines‐driven (P=0.03); and the doses of epinephrine (median [interquartile range]) were 2.0 (1.3–3.0), 1.0 (1.0–2.8), and 1.0 (0.3–3.0) (P=0.419). The ROSC rate was similar, yet survival after ROSC favored AMSA‐driven protocols (guidelines‐driven, 3/6; AMSA‐driven shocks, 6/6; and ADSE, 7/7; P=0.019 by log‐rank test). Left ventricular function and survival after ROSC correlated inversely with electrical burden (ie, cumulative unsuccessful shocks, J/kg; P=0.020 and P=0.046) and adrenergic burden (ie, total epinephrine doses, mg/kg; P=0.042 and P=0.002).
Conclusions
Despite similar ROSC rates achieved with all 3 protocols, AMSA‐driven shocks and ADSE resulted in less postresuscitation myocardial dysfunction and better survival, attributed to attaining ROSC with less electrical and adrenergic myocardial burdens.
Keywords: adrenergic burden, defibrillation, electrical burden, epinephrine, resuscitation, sudden cardiac arrest, ventricular fibrillation amplitude spectral area (AMSA)
Subject Categories: Sudden Cardiac Death, Ventricular Fibrillation, Cardiopulmonary Arrest, Cardiopulmonary Resuscitation and Emergency Cardiac Care, Basic Science Research
Nonstandard Abbreviations and Acronyms
- ADS
AMSA‐driven shocks
- ADSE
AMSA‐driven shocks and epinephrine
- AMSA
amplitude spectral area
- GD
guidelines‐driven
- PEA
pulseless electrical activity
- ROSC
return of spontaneous circulation
Clinical Perspective
What Is New?
Currently, the decision to deliver electrical shocks and epinephrine during resuscitation from ventricular fibrillation is based on a time‐fixed guidelines‐driven algorithm.
We developed an algorithm based on real‐time analysis of the ventricular fibrillation waveform amplitude spectral area to decide when to deliver an electrical shock and when not to deliver epinephrine to achieve successful resuscitation.
The amplitude spectral area–driven delivery of electrical shocks and epinephrine, compared with the guidelines‐driven protocol, reduced the electrical burden (ie, cumulative number of ineffective shocks) and adrenergic burden (ie, total number of epinephrine doses given), resulting in less postresuscitation myocardial dysfunction and better short‐term survival.
What Are the Clinical Implications?
The studies, conducted in a translationally relevant animal model of ventricular fibrillation, showed the potential clinical feasibility of using real‐time amplitude spectral area–driven algorithms to guide more targeted delivery of electrical shocks and epinephrine during resuscitation from ventricular fibrillation.
The electrical and adrenergic burdens appeared not to compromise the return of spontaneous circulation but to compromise postresuscitation myocardial function and survival, consistent with recent clinical observations.
The approach for real‐time amplitude spectral area analysis, using the ventilation pauses during initial resuscitation efforts without an advance airway to obviate the need to filter compression artifacts, could also facilitate the clinical translation of the findings.
Cessation of coronary blood flow after cardiac arrest leads to rapid development of myocardial ischemia, which is particularly intense when cardiac arrest is precipitated by ventricular fibrillation (VF). In this setting, successful return of spontaneous circulation (ROSC) requires the delivery of electrical shocks to a myocardium that is energetically prepared to be successfully defibrillated and resume effective contractile activity. To this end, when an electrical shock is not immediately available, cardiopulmonary resuscitation (CPR) is required to generate enough coronary blood flow to reestablish the required myocardial conditions for successful defibrillation. Because conventional CPR is typically unable to generate >25% of the normal coronary blood flow, 1 , 2 , 3 delivery of a vasopressor agent promoting peripheral vasoconstriction to centrally distribute systemic blood flow and increase the aortic pressure driving coronary blood flow is often necessary. Epinephrine is the currently recommended vasopressor agent for CPR. 4 Epinephrine promotes peripheral vasoconstriction by acting on α1‐adrenoreceptors and α2‐adrenoceptors. 1 , 5 However, epinephrine also stimulates β1‐adrenoceptors in the myocardium, an effect that increases the myocardial energy demand, intensifying the imbalance between myocardial oxygen demand and myocardial oxygen delivery, 6 leading to worse postresuscitation myocardial dysfunction. 7 In the recent PARAMEDIC‐2 (Prehospital Assessment of the Role of Adrenaline: Measuring the Effectiveness of Drug Administration in Cardiac Arrest) randomized clinical trial, epinephrine increased ROSC by 3‐fold but worsened postresuscitation outcome, resulting in a similar rate of survival with good neurological function at day 30 as in the group that was resuscitated without administration of epinephrine, consistent with the adverse effects of epinephrine (that manifested postresuscitation) negating its favorable initial resuscitation effects. 8 The same study noted that at the time of hospital discharge, severe neurologic impairment was observed more often in the epinephrine group compared with placebo. Consistent with a detrimental neurologic effect of epinephrine, a retrospective cohort study found, after adjusting for confounders, a dose‐dependent adverse effect of epinephrine on neurologic outcomes at 3 months postresuscitation. 9 In a preclinical swine study of VF and resuscitation with the use of epinephrine, concurrent administration of the β1‐blocker esmolol resulted in better neurologic function and decreased histological brain injury at 96 hours postresuscitation. 10 Similarly, administration of prazosin and propranolol to block α1 and β effects of epinephrine during cardiac resuscitation resulted in improved neurological function after 72 hours postresuscitation. 11 Accordingly, these studies suggest that epinephrine during cardiac arrest may not only have a postresuscitation detrimental effect on the heart but also on the brain.
Thus, assessing real‐time the metabolic state of the myocardium during VF could help guide with greater precision the delivery of resuscitation interventions. Analysis of the VF waveform determining in the frequency domain its amplitude spectral area (AMSA) 12 , 13 , 14 , 15 , 16 has been shown to reflect the energy state of the myocardium and serve to identify myocardial “readiness” for successful defibrillation. 13 , 16 , 17 AMSA is affected by coronary blood flow with progressive increase during CPR and especially when robust coronary blood flow is maintained. We recently developed an AMSA‐driven defibrillation protocol and showed in a swine model of VF to be more effective than the current guidelines‐driven protocol. 18 The AMSA‐driven protocol required fewer shocks to achieve ROSC with successful survival at 240 minutes, a benefit that we attribute to a lower myocardial “shock burden” during the resuscitation effort.
In a post hoc analysis of this work, 19 we observed that epinephrine increased AMSA and facilitated myocardial readiness for successful resuscitation. We now hypothesized that real‐time monitoring of AMSA during CPR could also serve to target the administration of epinephrine to when there is a need to increase myocardial readiness for successful defibrillation by increasing myocardial perfusion based on the AMSA level and its predicted trajectory during the resuscitation effort.
We therefore conducted experiments in a swine model of electrically induced VF and conventional CPR, comparing a guidelines‐driven (GD) resuscitation protocol, delivering 30 compressions followed by 2 ventilations, shocks every 2 minutes, and epinephrine every 4 minutes with the first at 240 seconds of chest compressions; an AMSA‐driven shocks (ADS) protocol, delivering shocks based on a previously developed AMSA algorithm while delivering epinephrine according to guidelines; and an AMSA‐driven shocks and epinephrine (ADSE) protocol, delivering shocks and epinephrine based on an AMSA algorithm.
Methods
The study was approved by the Institutional Animal Care and Use Committee at Rosalind Franklin University of Medicine and Science (protocol No. 20‐09) and was conducted according to institutional guidelines. In these experiments, there was a fourth group in which animals treated with the ADSE protocol also received a sodium‐glucose co‐transporter 2 inhibitor. This was an exploratory group and was not included in the present report. The data that support the findings of this study are available from the corresponding author on reasonable request.
Study Design
Three groups of 8 pigs each were block randomized to 1 of 3 resuscitation protocols in 4 blocks of 6 experiments each (with each block including each protocol twice). The assignment was revealed only after completion of the surgical preparation and before induction of VF.
A 30:2 compression/ventilation ratio was used for all experiments. One “CPR cycle” corresponded to 5 30:2 compressions‐to‐ventilation sequences, and the entire resuscitation effort lasted a maximum of 8 CPR cycles (ie, 16 minutes). The decision to deliver a shock and to deliver epinephrine differed according to the specific protocol described below. For shock delivery in all groups, the defibrillator was charged during the chest compression phase preceding the pause in which the shock was to be delivered, aborting the shock if VF was no longer present immediately before the advised shock delivery. If a nonshockable rhythm developed, chest compression was continued until the mean aortic pressure was >25 mm Hg or 16 minutes of chest compression had been completed.
GD Protocol
Electrical shocks were delivered on the basis of the American Heart Association 2015 guidelines. The algorithm calls for rhythm analysis between CPR cycles of 2‐minute duration and delivery of an electrical shock if VF is present. The first shock was delivered at the end of the first cycle (ie, at 120 seconds). Chest compression was resumed, assessing the electrical and mechanical activity of the heart at the subsequent pause. Epinephrine in a dose of 1 mg was delivered every 4 minutes, according to same CPR guidelines.
ADS Protocol
Electrical shocks were delivered according to a previously developed 4‐criterion AMSA algorithm. 18 This algorithm advised shock delivery when AMSA ≥15 mV‐Hz (AMSA threshold), when AMSA increases by at least 30% the preceding AMSA value (AMSA Δ), when the duration of CPR exceeds a time previously determined on the basis of the pre‐CPR AMSA value (time threshold), or after 360 seconds of CPR without having met other shock advisory criteria (time maximum). The shock was delivered at the pause following the shock advisory (ie, 18 seconds later), allowing for charging of the defibrillator without interruption of chest compressions. Failure of the shock to achieve ROSC resulted in the shock advisory algorithm to be reset, starting at the pause following the delivered shock. Epinephrine was delivered every 4 minutes, according to current CPR guidelines.
ADSE Delivery
Electrical shocks were delivered according to the ADS protocol. For epinephrine delivery, we developed an algorithm based on the probability of shock success 120 seconds ahead of an AMSA measurement, estimated on the basis of data from a previous study using the same animal model and resuscitation protocol. 18 In the previous study, AMSA gradually increased during CPR, with the current AMSA value influenced by the pre‐CPR AMSA, duration of CPR, and preceding coronary perfusion pressure averaged from the beginning of CPR, with the latter having the greatest influence on the current AMSA. 19 In addition, the average AMSA associated with shock success and ROSC was (mean±SD) 13.8±2.4 mV·Hz. Accordingly, we developed an AMSA‐based epinephrine advisory criterion by continuously determining, using linear regression, the rate of AMSA change (ie, slope) of last 5 AMSA values (ie, during the preceding 120 seconds) and projecting the expected AMSA value 120 seconds ahead, according to:
Starting at 240 seconds, epinephrine was given if the projected AMSA value was <11.4 mV·Hz, corresponding to 1 SD below the average AMSA associated with successful defibrillation (ie, 13.8 mV·Hz minus 2.4 mV·Hz) (Figure 1A). Epinephrine was held if the projected AMSA value was ≥11.4 mV·Hz (Figure 1B). Epinephrine would continue to be held until the AMSA value decreased below the 11.4 mV·Hz threshold (Figure 1C). In addition, a minimum interval of 240 seconds was set for any additional dose of epinephrine. If epinephrine had not been advised by 360 seconds and the animal remained in VF, epinephrine was delivered at the 360‐second pause period (Figure 1D). Epinephrine was delivered at the start of chest compressions immediately following the pause period. If a shock and epinephrine delivery were advised at the same pause period, the shock was delivered first and epinephrine only if the shock failed to result in an organized rhythm.
Figure 1. Shown are examples of the algorithm used to advise epinephrine (Epi) delivery based on the projected amplitude spectral area (AMSA) value 120 seconds ahead.

The current and the 4 trailing AMSA values were entered in the regression equation used for the projection. Black circles represent actual AMSA values, and white circles represent the projected AMSA value 120 seconds ahead of the current AMSA value. If the projected AMSA was ≥11.4 mV‐Hz, Epi was not advised (red lines). If the projected AMSA was <11.4 mV‐Hz, Epi was advised (green lines). A, AMSA projected to be <11.4 mV‐Hz after the first “Epi Check” at 240 seconds, prompting Epi delivery immediately on resumption of chest compressions. B, AMSA projected to be ≥11.4 mV‐Hz, advising against Epi delivery after the first “Epi‐Check”. C, AMSA projected to be ≥11.4 mV‐Hz in 4 consecutive “Epi Checks,” advising against Epi, as shown by red discontinued lines, until the projection drops below the 11.4 mV‐Hz, advising Epi delivery. D, Despite repeated advisories against Epi, Epi was delivered after meeting the time threshold at 360 seconds.
If a nonshockable rhythm was observed during a compression pause, the following approach was taken to advise the delivery of epinephrine: (1) if <240 seconds of chest compressions had elapsed, epinephrine would be delivered at 240 seconds; (2) if >240 seconds of chest compressions had elapsed and no previous epinephrine had been delivered or >240 seconds had elapsed from previous epinephrine, epinephrine would be delivered at the next pause; (3) if >240 seconds of chest compressions had elapsed but <240 seconds had elapsed from a previously delivered epinephrine, epinephrine would be delivered 240 seconds after the previous epinephrine. This approach was continued until VF resumed and the projected AMSA algorithm guided subsequent delivery of epinephrine.
Software Applications
A custom‐developed LabVIEW application, previously developed by us, was used for data acquisition (eg, pressures, cardiac output, ECG, and capnography) and for real‐time analysis of AMSA and advisory algorithms using the ECG signal obtained during the last 4 seconds of the mechanical chest compression pauses (to obviate compression artifacts), also controlled by LabVIEW. The details for real‐time AMSA calculation and shock advisory criteria had been previously reported. 18 In brief, each AMSA value was calculated from a 2.1‐second VF segment (encompassing 525 data points at the sample rate of 250 Hz) and 475 sequential iterations over the 4‐second interval, shifting 1 data point forward after each iteration and using the lowest of the 475 AMSA calculations for the advisory algorithms. This approach successfully guided shock delivery in our previous study. 18 The shock and epinephrine advisory criteria were delivered through voice cues to the researchers, enabling charging the defibrillator and readying the epinephrine injection.
Animal Preparation
Male domestic pigs (weight, 34.4–39.6 kg) were fasted overnight and sedated with ketamine (30 mg/kg intramuscular) and anesthetized with propofol (2 mg/kg through an ear vein). The trachea was intubated with a size 7.5 orotracheal tube and positive pressure ventilation was initiated with 50% oxygen using a volume‐controlled ventilator set to deliver 10 mL/kg per breath. The respiratory rate will be adjusted to attain an end‐tidal Pco 2 between 35 and 45 mm Hg. Anesthesia was titrated to effect using isoflurane (1.5% to 4.0%). The animal was then instrumented, as previously described, to assess hemodynamic and metabolic function (Figure 2). 18
Figure 2. Swine model of electrically induced ventricular fibrillation (VF) with resuscitation attempted by conventional cardiopulmonary resuscitation using a mechanical piston device and bag‐valve ventilation through an endotracheal tube with delivery of 100% oxygen.

DEFIB indicates defibrillator; and PETCO2, end‐tidal Pco 2.
VF and Resuscitation Protocol
VF was induced by delivering an alternating current (1–10 mA) to the right ventricular endocardium and left untreated without ventilation for 10 minutes to simulate a common episode of out‐of‐hospital sudden cardiac arrest with delayed initiation of resuscitation. At the end of untreated VF, resuscitation was started, as previously described. 18 Briefly, chest compressions were delivered using a mechanical compressor (Michigan Thumper) factory programmed to deliver 100 compressions per minute. To simulate the early 30:2 compression‐to‐ventilation sequence before an advanced airway is secured, we retrofitted the compressor with a computer‐controlled device that actuated on its on‐off switch, pausing every 18 seconds (ie, after delivering 30 compressions) for 6 seconds to manually deliver 2 ventilations with 100% oxygen using a 350‐mL self‐inflating pediatric bag. Epinephrine (1‐mg bolus) was delivered through the right atrial port of the pulmonary artery catheter and flushed with 10 mL of 0.9% NaCl. During VF and the resuscitation efforts, the ECG for rhythm analysis and AMSA calculation was captured from chest pads (pedi‐padz; ZOLL Medical Corporation). For electrical defibrillation, rectilinear biphasic 200‐J electrical shocks were delivered through the chest pads using an E Series Zoll defibrillator (ZOLL Medical Corporation) during ventilation pauses, according to the 3 protocols described above. Ventilations were held during shock delivery. Chest compressions were immediately resumed if VF persisted, or the mean arterial pressure was <25 mm Hg immediately after the shock. If an electrically organized rhythm was recognized with a mean aortic pressure ≥25 mm Hg, chest compressions were held to determine whether ROSC had occurred; otherwise, chest compressions were resumed. Animals that achieved ROSC received 0.9% NaCl (30 mL/kg) at the maximum pump rate (999 mL/h) and were monitored for up to 240 minutes, euthanizing those that survived by delivering a right atrial bolus of KCl (150 mg/kg).
Measurements
Pressures were measured through fluid‐filled systems. Thermodilution cardiac output was measured in duplicate after 10‐mL bolus injection of 0.9% NaCl into the right atrium (Edwards Lifesciences Vigilance model, Irvine, CA) and normalized to body surface area using the Kelley equation (body surface area [m2]=0.073·body weight2/3 [kg]). 20 The coronary perfusion pressure during CPR was calculated as the difference between the aortic and right atrial pressures at the end of the interval between compressions. Blood samples collected from the aorta and pulmonary artery were processed on site for pH, Po 2, Pco 2, hemoglobin, base excess, and lactate using a cartridge‐based device (OPTI CCA‐TS Blood Gas and Electrolyte Analyzer; OPTI Medical Systems, Roswell, GA) and for common hemoglobin types (oxyhemoglobin, methemoglobin, carboxyhemoglobin, and reduced hemoglobin) using a co‐oximeter (AVOXimeter 4000; A‐VOX Systems Inc, San Antonio, TX). Pertinent indexes of cardiovascular and metabolic function were derived from these primary measurements, as previously described. 21 , 22
Outcomes
The immediate outcome after each shock was determined at the subsequent ventilation pause or equivalent time if compressions were not resumed (ie, 18 seconds after the shock) and classified as follows: (1) ROSC, return of spontaneous circulation with a mean aortic pressure ≥40 mm Hg lasting >5 minutes; (2) persistency of VF; and (3) PEA, pulseless electrical activity defined as an organized electrical cardiac activity with a mean aortic pressure <25 mm Hg. Recurrent VF was defined as any episode of VF occurring after ROSC. Each episode of recurrent VF was treated by delivering up to 10 consecutive electrical shocks without intervening additional chest compressions.
Electric burden was defined as the cumulative energy of shocks delivered during CPR that failed to achieve immediate ROSC, according to: electric burden (J/kg)=J/kg×no‐ROSC shocks (n), where no‐ROSC denotes the number of shocks that resulted in either pulseless electrical activity or persistent VF. Successful resuscitation was defined as achieving ROSC lasting >5 minutes; and survival as remaining hemodynamically viable at 240 minutes postresuscitation.
Adrenergic burden was defined as the cumulative doses of epinephrine administered during CPR, according to: epinephrine burden (mg/kg)=epinephrine (mg/kg)×epinephrine doses (n).
Statistical Analysis
Continuous time‐invariant dependent variables (CPR duration, doses of epinephrine, and number of electrical shocks) were analyzed by 1‐way ANOVA using the Holm‐Sidak test for pairwise comparisons if the data were normally distributed or by the Kruskal‐Wallis test on ranks using the Tukey test for pairwise comparisons if the data were not normally distributed (ie, failing the Shapiro‐Wilk and/or the equal variance test), correspondingly reporting means±SD or median with the interquartile range. Kaplan‐Meier survival curves were analyzed by log‐rank test using the Holm‐Sidak test for pairwise comparisons. Linear regression was used to analyze the relationship between electrical burden and adrenergic burden on survival time after ROSC and left ventricular stroke work index, reporting correlation coefficients as r value (SigmaPlot 12.5; Systat Software, Inc).
Sample sizes of 8 pigs per group were deemed adequate to detect statistically significant differences at an α level of 0.05 and power of 0.80 for the main effects based on similar studies by us using swine models of cardiac arrest. 18 , 23 , 24 The data were reported in the text as mean±SD, or median with the corresponding first and third quartiles. A 2‐tailed P<0.05 was considered statistically significant.
RESULTS
Baseline
At baseline, there were no statistically significant differences between groups (Table).
Table 1.
Baseline Characteristics
| Treatment group | ||||
|---|---|---|---|---|
| Characteristic | Guidelines driven | AMSA‐driven shocks | AMSA‐driven shocks and epinephrine | P value |
| Preparation time, min | 71 (61–79) | 71 (63–87) | 84 (66–110) | 0.218 |
| Weight, kg | 37.3±1.9 | 37.7±0.6 | 37.5±1.6 | 0.884 |
| Core temperature, °C | 38.6±0.5 | 38.4±0.36 | 38.3±0.70 | 0.540 |
| Heart rate, min−1 | 84±9 | 85±15 | 91±17 | 0.589 |
| Cardiac index, L/min∙m−2 | 3.50±1.00 | 3.54±0.51 | 3.60±0.74 | 0.956 |
| Left ventricular stroke work index, cJ | 27.6 (31.5–41.4) | 29.0 (24.9–35.3) | 28.0 (25.6–32.9) | 0.424 |
| Mean aortic pressure, mm Hg | 68±11 | 70±8 | 70±5 | 0.909 |
| Respiratory rate, min−1 | 27±2 | 28±3 | 27±2 | 0.752 |
| PETCO2, mm Hg | 37±2 | 38±1 | 37±3 | 0.747 |
| pH, aorta, unit | 7.44±0.04 | 7.46±0.03 | 7.47±0.02 | 0.171 |
| Lactate, aorta, mmol/L | 1.78±0.76 | 1.52±0.49 | 1.08±0.30 | 0.056 |
| Po 2, aorta, mm Hg | 143±21 | 164±20 | 146±16 | 0.095 |
| Pco 2, aorta, mm Hg | 42±3 | 40±4 | 41±3 | 0.203 |
| HCO3–, aorta, mmol/L | 28±3 | 28±2 | 29±2 | 0.659 |
Baseline measurements were obtained 5 minutes before inducing ventricular fibrillation. Differences among groups were analyzed by 1‐way ANOVA using the Holm‐Sidak test for pairwise comparisons if the data were normally distributed; otherwise, the Kruskal‐Wallis test on ranks with Tukey test for pairwise comparisons was used, correspondingly showing means±SD or median (quartile 1–quartile 3). AMSA indicates amplitude spectral area; and PETCO2, end‐tidal Pco 2.
Amplitude Spectral Area
There were no differences in AMSA (mV‐Hz) between groups after 15 seconds of untreated VF (GD, 19.1±1.8; ADS, 16.8±1.2; and ADSE, 17.7±1.0; P=0.422) and after 10 minutes of untreated VF (immediately before starting CPR) (GD, 10.4 [8.9–13.4]; ADS, 9.6 [7.9–12.0]; and ADSE, 10.8 [8.3–13.2]; P=0.0.677), showing that the myocardial metabolic state before starting CPR was comparable among groups.
Survival
Kaplan‐Meier curves were analyzed from the time VF was induced in all 24 animals and from the time ROSC occurred in 19 animals. From VF induction, the ADS and ADSE groups had high survival compared with the GD group, but the differences were not statistically significant (Figure 3A). Yet, the survival analysis limited to the animals that achieved ROSC showed a statistically significantly higher survival for ADS and ADSE (P=0.019) (Figure 3B).
Figure 3. Kaplan‐Meier survival curves analyzed from the time ventricular fibrillation (VF) was induced in all 24 animals (A) and from the time return of spontaneous circulation (ROSC) was achieved in 19 animals (B), comparing the 3 resuscitation protocols: guidelines‐driven (GD), amplitude spectral area (AMSA)–driven shocks (ADS), and AMSA‐driven shocks and epinephrine (ADSE).

Failure to achieve ROSC resulted in every instance from persistent VF. The overall P value, calculated using the log‐rank test, is shown in the graph.
Resuscitation Effort
The GD group had the shortest time to first shock delivery, followed by ADSE, and then ADS but without achieving statistical significance (P=0.129) (Figure 4A). In most instances, the first shock failed to terminate VF except in 1 animal in the ADS group in which the shock resulted in PEA and another instance in the ADSE group in which the shock resulted in ROSC. Subsequent shocks resulted in 3 instances of PEA in 3 animals in the GD group (all eventually achieving ROSC and surviving 3, 114, and 240 minutes), no additional instances of PEA in the ADS group, and 3 additional instances of PEA in the ADSE group (1 animal had 2 separate instances of PEA without achieving ROSC and 2 animals had 1 instance of PEA, eventually achieving ROSC and surviving 240 minutes). At the end of the resuscitation effort (ie, 16 minutes), 6 animals failed to achieved ROSC consequent to persistent VF (GD=2, ADS=2, and ADSE=1), as shown in Figure 3A.
Figure 4. Graphs depicting the 3 resuscitation protocols: guidelines‐driven (GD), amplitude spectral area (AMSA)–driven shocks (ADS), and AMSA‐driven shocks and epinephrine (ADSE), showing: the time to deliver the first shock (A); number of electrical shocks delivered during cardiopulmonary resuscitation (CPR) (*P=0.030 vs GD) (B); number of epinephrine doses (C); and duration of CPR in animals that achieved return of spontaneous circulation (ROSC) (D).

Differences among groups were analyzed by 1‐way ANOVA using the Holm‐Sidak test for pairwise comparisons if the data were normally distributed; otherwise, the Kruskal‐Wallis test on ranks with Tukey test for pairwise comparisons was used, correspondingly showing means±SD with data shown in bar graphs or median (quartile1–quartile 3) with data shown in box plots. The P value for the overall test is shown in the graph.
Overall, the ADS and ADSE groups had fewer shocks delivered compared with the GD group (P=0.024), with pairwise statistical significance between the ADSE group and the GD group (P=0.030) and nearly achieving significance between the ADS groups and the GD group (P=0.068) (Figure 4B). The GD group had the highest doses of epinephrine delivered, followed by the ADS groups, and then ADSE group nearly achieving statistical significance (P=0.068) (Figure 4C). The time to ROSC was shorter in the ADS and ADSE groups compared with the GD group, achieving statistical significance (P=0.045) (Figure 4D).
Recurrence of VF postresuscitation occurred only in the AMSA‐driven groups, with 2 animals in the ADS group requiring 2 and 4 shocks, respectively, and 3 in the ADSE group requiring 1, 1, and 2 shocks, respectively. Each of these 5 animals survived the 240‐minute postresuscitation interval, and there were no statistically significant differences on refibrillation among the 3 groups (P=0.212).
Shock Burden
The shock burden was the lowest in the ADSE group but did not attain statistical significance (P=0.065) (Figure 5A). In animals that attained ROSC (n=19), shock burden correlated inversely with survival time (r=0.463; P=0.046) (Figure 6A) and with the averaged left ventricular stroke work index (r=0.530; P=0.020) (Figure 6C).
Figure 5. Graphs arranged according to the resuscitation protocol, guidelines‐driven (GD), amplitude spectral area (AMSA)–driven shocks (ADS), and AMSA‐driven shocks and epinephrine (ADSE), showing electrical burden calculated as described in the text (A) and adrenergic burden calculated as described in the text (B).
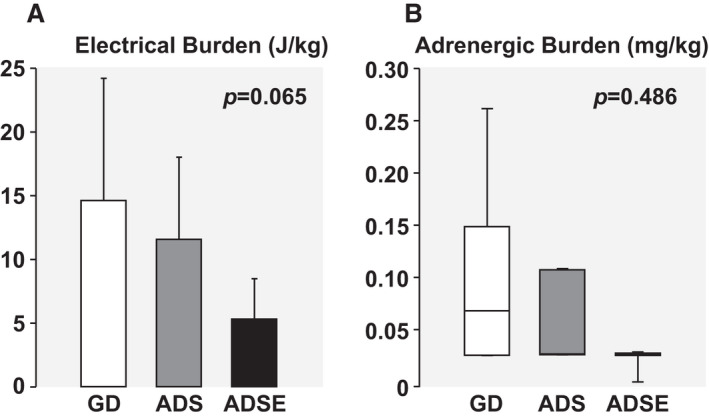
Differences among groups were analyzed by 1‐way ANOVA using the Holm‐Sidak test for pairwise comparisons if the data were normally distributed; otherwise, the Kruskal‐Wallis test on ranks with Tukey test for pairwise comparisons was used, correspondingly showing means±SD with data shown in bar graphs or median (quartile 1–quartile 3) with data shown in box plots. The P value for the overall test is shown in the graph.
Figure 6. Graphs showing the relationship between electrical burden and adrenergic burden with 240‐minute survival and postresuscitation left ventricular stroke work index (LVSWI) identifying the resuscitation protocol that each animal received: guidelines‐driven (white symbols), amplitude spectral area (AMSA)–driven shocks (gray symbols), and AMSA‐driven shocks and epinephrine (black symbols).

A, Linear regression between electrical burden and survival time after return of spontaneous circulation (ROSC). B, Linear regression between adrenergic burden and survival time after ROSC. C, Linear regression between electrical burden and LVSWI averaged across the entire postresuscitation interval. D, Linear regression between adrenergic burden and LVSWI averaged across the entire postresuscitation interval. All graphs show the corresponding 95% CI for the regression analysis.
Adrenergic Burden
The adrenergic burden was the lower in the ADS and ADSE groups compared with the GD group but did not achieve statistical significance (P=0.486) (Figure 5B). In animals that attained ROSC (n=19), adrenergic burden correlated inversely with survival time (r=0.673; P=0.002) (Figure 6B) and with the averaged left ventricular stroke work index (r=0.472; P=0.042) (Figure 6D).
Discussion
The ability of AMSA to predict shock success is well documented by multiple preclinical and clinical studies, and our previous work demonstrates that AMSA ability to predict shock outcome is preserved when monitored in real‐time. 13 , 14 , 16 , 18 , 25 , 26 , 27 , 28 , 29 Our previous work also demonstrated that pharmacological interventions that increase coronary perfusion pressure can also increase AMSA, suggesting improvement of the energy status. 30 The present study is the first, to the best of our knowledge, to investigate the use of AMSA for guiding real‐time delivery of both electrical shocks and epinephrine during CPR.
Electrical Burden
Current defibrillators deliver biphasic electrical shocks, which are considered safer than monophasic electrical shocks for the myocardium. 31 , 32 A previous study in swine showed that electrical shocks delivered during spontaneous circulation produced myocardial injury with functional reduction in left ventricular volume. 33 Histological analysis of these hearts revealed findings consistent with cell electroporation and capillary leakage, leading to tissue edema. A previous study in isolated rat hearts showed that repetitive monophasic shocks also resulted in decreased left ventricular volume and diastolic dysfunction. 34 Our previous study in swine subject to the same experimental design demonstrated an inverse relationship between electrical burden and left ventricular function and survival. 18 The current study supports these findings as left ventricular function and survival was again inversely related to electrical burden.
Adrenergic Burden
The PARAMEDIC‐2 trial reported that epinephrine increased ROSC but without improvement in survival, with good neurologic outcomes at 30 days. 8 The study suggested that although epinephrine facilitated ROSC, the myocardium was subjected to increased energy demand during CPR as a result of β1‐adrenoceptor stimulation, which we defined as adrenergic burden, negatively impacting survival. As discussed, AMSA has been used to predict “myocardial readiness” for successful defibrillation, enabling AMSA to guide the timing for shock delivery. We propose that a similar approach applies to the timing of epinephrine delivery. If the myocardium is in a state of readiness for successful shock delivery, the administration of epinephrine could be obviated. Yet, if the opposite is the case and increased coronary perfusion is deemed necessary to attain myocardial readiness, administration of epinephrine to promote peripheral vasoconstriction through α1‐adrenoreceptor and α2‐adrenoceptor stimulation becomes necessary. The present study showed the utility of AMSA to distinguish between these 2 conditions and thereby guide the decision whether to administer epinephrine and avoid unnecessary exposure of the myocardium to epinephrine. The beneficial effect of this approach is supported by the inverse relationship between adrenergic burden and both left ventricular function and survival, observed in the present study. In the PARAMEDIC‐2 trial, 8 the decreased survival after ROSC in the epinephrine group occurred during the hospital stay and remained largely unchanged by day 30 postresuscitation, suggesting that an early survival benefit from less adrenergic burden could have a lasting effect. Future studies are planned to assess the effect of the ADSE protocol on survival and neurological outcome after recovery from anesthesia.
Limitations
The study was conducted in healthy swine devoid of coronary artery disease, without previously compromised myocardial function, 35 and the necessity to conduct the experiments with the animals under anesthesia. Isoflurane has been shown to exert myocardial protection during ischemia and reperfusion, cautioning on direct extrapolation to human settings. 36
Our study examined the use of AMSA early in the resuscitation effort when a compression‐to‐ventilation resuscitation protocol is used before placing an advanced airway, taking advantage of ventilation pauses to analyze AMSA without compression artifacts. A different strategy might be required later in the resuscitation protocol after securing an advanced airway and providing chest compressions without ventilation pauses.
Clinical Implications
The study provides support for translational studies in sudden cardiac arrest investigating whether AMSA‐driven protocols could lead to similar myocardial benefits resulting from a more targeted approach to shock delivery and epinephrine delivery. This approach would be expected to maximize the efficacy of resuscitation interventions while minimizing their detrimental effects that become evident after resuscitation, despite being effective to achieve ROSC.
Sources of Funding
The study was supported by the ZOLL Foundation, Inc, through a research grant to Salvatore Aiello entitled “Amplitude Spectral Area to Assess Hemodynamic and Metabolic Interventions During Cardiac Arrest.”
Disclosures
None.
For Sources of Funding and Disclosures, see page 10.
Presented in part at the American Heart Association Resuscitation Science Symposium (ReSS), November 12–14, 2021.
References
- 1. Bellamy RF, DeGuzman LR, Pedersen DC. Coronary blood flow during cardiopulmonary resuscitation in swine. Circulation. 1984;69:174–180. doi: 10.1161/01.CIR.69.1.174 [DOI] [PubMed] [Google Scholar]
- 2. Voorhees WD, Babbs CF, Tacker WA Jr. Regional blood flow during cardiopulmonary resuscitation in dogs. Crit Care Med. 1980;8:134–136. doi: 10.1097/00003246-198003000-00008 [DOI] [PubMed] [Google Scholar]
- 3. Taylor RB, Brown CG, Bridges T, Werman HA, Ashton J, Hamlin RL. A model for regional blood flow measurements during cardiopulmonary resuscitation in a swine model. Resuscitation. 1988;16:107–118. doi: 10.1016/0300-9572(88)90075-5 [DOI] [PubMed] [Google Scholar]
- 4. Link MS, Berkow LC, Kudenchuk PJ, Halperin HR, Hess EP, Moitra VK, Neumar RW, O’Neil BJ, Paxton JH, Silvers SM, et al. Part 7: adult advanced cardiovascular life support: 2015 American Heart Association guidelines update for cardiopulmonary resuscitation and emergency cardiovascular care. Circulation. 2015;132:S444–S464. doi: 10.1161/CIR.0000000000000261 [DOI] [PubMed] [Google Scholar]
- 5. Paradis NA, Martin GB, Rivers EP, Goetting MG, Appleton TJ, Feingold M, Nowak RM. Coronary perfusion pressure and the return of spontaneous circulation in human cardiopulmonary resuscitation. JAMA. 1990;263:1106–1113. doi: 10.1001/jama.1990.03440080084029 [DOI] [PubMed] [Google Scholar]
- 6. Ditchey RV, Lindenfeld J. Failure of epinephrine to improve the balance between myocardial oxygen supply and demand during closed‐chest resuscitation in dogs. Circulation. 1988;78:382–389. doi: 10.1161/01.CIR.78.2.382 [DOI] [PubMed] [Google Scholar]
- 7. Tang W, Weil MH, Sun S, Noc M, Yang L, Gazmuri RJ. Epinephrine increases the severity of postresuscitation myocardial dysfunction. Circulation. 1995;92:3089–3093. doi: 10.1161/01.CIR.92.10.3089 [DOI] [PubMed] [Google Scholar]
- 8. Perkins GD, Ji C, Deakin CD, Quinn T, Nolan JP, Scomparin C, Regan S, Long J, Slowther A, Pocock H, et al. A randomized trial of epinephrine in out‐of‐hospital cardiac arrest. N Engl J Med. 2018;379:711–721. doi: 10.1056/NEJMoa1806842 [DOI] [PubMed] [Google Scholar]
- 9. Shi X, Yu J, Pan Q, Lu Y, Li L, Cao H. Impact of total epinephrine dose on long term neurological outcome for cardiac arrest patients: a cohort study. Front Pharmacol. 2021;12:580234. doi: 10.3389/fphar.2021.580234 [DOI] [PMC free article] [PubMed] [Google Scholar]
- 10. Ruggeri L, Nespoli F, Ristagno G, Fumagalli F, Boccardo A, Olivari D, Affatato R, Novelli D, De Giorgio D, Romanelli P, et al. Esmolol during cardiopulmonary resuscitation reduces neurological injury in a porcine model of cardiac arrest. Sci Rep. 2021;11:10635. doi: 10.1038/s41598-021-90202-w [DOI] [PMC free article] [PubMed] [Google Scholar]
- 11. Pellis T, Weil MH, Tang W, Sun S, Xie J, Song L, Checchia P. Evidence favoring the use of an alpha2‐selective vasopressor agent for cardiopulmonary resuscitation. Circulation. 2003;108:2716–2721. doi: 10.1161/01.CIR.0000096489.40209.DD [DOI] [PubMed] [Google Scholar]
- 12. Noc M, Weil MH, Gazmuri RJ, Sun S, Biscera J, Tang W. Ventricular fibrillation voltage as a monitor of the effectiveness of cardiopulmonary resuscitation. J Lab Clin Med. 1994;124:421–426. [PubMed] [Google Scholar]
- 13. Povoas HP, Weil MH, Tang W, Bisera J, Klouche K, Barbatsis A. Predicting the success of defibrillation by electrocardiographic analysis. Resuscitation. 2002;53:77–82. doi: 10.1016/S0300-9572(01)00488-9 [DOI] [PubMed] [Google Scholar]
- 14. Indik JH, Allen D, Shanmugasundaram M, Zuercher M, Hilwig RW, Berg RA, Kern KB. Predictors of resuscitation in a swine model of ischemic and nonischemic ventricular fibrillation cardiac arrest: superiority of amplitude spectral area and slope to predict a return of spontaneous circulation when resuscitation efforts are prolonged. Crit Care Med. 2010;38:2352–2357. doi: 10.1097/CCM.0b013e3181fa01ee [DOI] [PubMed] [Google Scholar]
- 15. Coult J, Sherman L, Kwok H, Blackwood J, Kudenchuk PJ, Rea TD. Short ECG segments predict defibrillation outcome using quantitative waveform measures. Resuscitation. 2016;109:16–20. doi: 10.1016/j.resuscitation.2016.09.020 [DOI] [PubMed] [Google Scholar]
- 16. Ristagno G, Mauri T, Cesana G, Li Y, Finzi A, Fumagalli F, Rossi G, Grieco N, Migliori M, Andreassi A, et al. Amplitude spectrum area to guide defibrillation: a validation on 1617 patients with ventricular fibrillation. Circulation. 2015;131:478–487. doi: 10.1161/CIRCULATIONAHA.114.010989 [DOI] [PubMed] [Google Scholar]
- 17. Indik JH, Conover Z, McGovern M, Silver AE, Spaite DW, Bobrow BJ, Kern KB. Amplitude‐spectral area and chest compression release velocity independently predict hospital discharge and good neurological outcome in ventricular fibrillation out‐of‐hospital cardiac arrest. Resuscitation. 2015;92:122–128. doi: 10.1016/j.resuscitation.2015.05.002 [DOI] [PubMed] [Google Scholar]
- 18. Aiello S, Perez M, Cogan C, Baetiong A, Miller SA, Radhakrishnan J, Kaufman CL, Gazmuri RJ. Real‐time ventricular fibrillation amplitude‐spectral area analysis to guide timing of shock delivery improves defibrillation efficacy during cardiopulmonary resuscitation in swine. J Am Heart Assoc. 2017;6:e006749. doi: 10.1161/JAHA.117.006749 [DOI] [PMC free article] [PubMed] [Google Scholar]
- 19. Gazmuri RJ, Kaufman CL, Aiello S, Miller SA, Baetiong A, Radhakrishnan J. Predictors of amplitude‐spectral area (AMSA) during CPR in a swine model of electrically‐induced ventricular fibrillation. Resuscitation. 2017;118:e6–e7. doi: 10.1016/j.resuscitation.2017.08.027 [DOI] [Google Scholar]
- 20. Kelley KW, Curtis SE, Marzan GT, Karara HM, Anderson CR. Body surface area of female swine. J Anim Sci. 1973;36:927–930. doi: 10.2527/jas1973.365927x [DOI] [PubMed] [Google Scholar]
- 21. Gazmuri RJ, Whitehouse K, Whittinghill K, Baetiong A, Radhakrishnan J. Vasopressin infusion with small‐volume fluid resuscitation during hemorrhagic shock promotes hemodynamic stability and survival in swine. PLoS One. 2015;10:e0130134. doi: 10.1371/journal.pone.0130134 [DOI] [PMC free article] [PubMed] [Google Scholar]
- 22. Gazmuri RJ, Whitehouse K, Whittinghill K, Baetiong A, Shah K, Radhakrishnan J. Early and sustained vasopressin infusion augments the hemodynamic efficacy of restrictive fluid resuscitation and improves survival in a liver laceration model of hemorrhagic shock. J Trauma Acute Care Surg. 2017;82:317–327. doi: 10.1097/TA.0000000000001318 [DOI] [PubMed] [Google Scholar]
- 23. Ayoub IM, Kolarova J, Gazmuri RJ. Cariporide given during resuscitation promotes return of electrically stable and mechanically competent cardiac activity. Resuscitation. 2010;81:106–110. doi: 10.1016/j.resuscitation.2009.09.013 [DOI] [PMC free article] [PubMed] [Google Scholar]
- 24. Borovnik‐Lesjak V, Whitehouse K, Baetiong A, Artin B, Radhakrishnan J, Gazmuri RJ. High‐dose erythropoietin during cardiac resuscitation lessens postresuscitation myocardial stunning in swine. Transl Res. 2013;162:110–121. doi: 10.1016/j.trsl.2013.06.002 [DOI] [PubMed] [Google Scholar]
- 25. Eftestol T, Wik L, Sunde K, Steen PA. Effects of cardiopulmonary resuscitation on predictors of ventricular fibrillation defibrillation success during out‐of‐hospital cardiac arrest. Circulation. 2004;110:10–15. doi: 10.1161/01.CIR.0000133323.15565.75 [DOI] [PubMed] [Google Scholar]
- 26. Marn‐Pernat A, Weil MH, Tang W, Pernat A, Bisera J. Optimizing timing of ventricular defibrillation. Crit Care Med. 2001;29:2360–2365. doi: 10.1097/00003246-200112000-00019 [DOI] [PubMed] [Google Scholar]
- 27. Firoozabadi R, Nakagawa M, Helfenbein ED, Babaeizadeh S. Predicting defibrillation success in sudden cardiac arrest patients. J Electrocardiol. 2013;46:473–479. doi: 10.1016/j.jelectrocard.2013.06.007 [DOI] [PubMed] [Google Scholar]
- 28. Indik JH, Conover Z, McGovern M, Silver AE, Spaite DW, Bobrow BJ, Kern KB. Association of amplitude spectral area of the ventricular fibrillation waveform with survival of out‐of‐hospital ventricular fibrillation cardiac arrest. J Am Coll Cardiol. 2014;64:1362–1369. doi: 10.1016/j.jacc.2014.06.1196 [DOI] [PubMed] [Google Scholar]
- 29. Coult J, Kwok H, Sherman L, Blackwood J, Kudenchuk PJ, Rea TD. Ventricular fibrillation waveform measures combined with prior shock outcome predict defibrillation success during cardiopulmonary resuscitation. J Electrocardiol. 2018;51:99–106. doi: 10.1016/j.jelectrocard.2017.07.016 [DOI] [PMC free article] [PubMed] [Google Scholar]
- 30. Aiello S, Lamoureux L, Baetiong A, Radhakrishnan J, Gazmuri RJ. Abstract 257: ventricular fibrillation amplitude spectral area to assess the myocardial effect of hemodynamic and metabolic interventions during cardiac resuscitation in a rat model. Circulation. 2019;140:A257. doi: 10.1161/circ.140.suppl_2.257 [DOI] [Google Scholar]
- 31. Tang W, Weil MH, Sun S, Yamaguchi H, Povoas HP, Pernat AM, Bisera J. The effects of biphasic and conventional monophasic defibrillation on postresuscitation myocardial function. J Am Coll Cardiol. 1999;34:815–822. doi: 10.1016/S0735-1097(99)00270-3 [DOI] [PubMed] [Google Scholar]
- 32. Leng CT, Paradis NA, Calkins H, Berger RD, Lardo AC, Rent KC, Halperin HR. Resuscitation after prolonged ventricular fibrillation with use of monophasic and biphasic waveform pulses for external defibrillation. Circulation. 2000;101:2968–2974. doi: 10.1161/01.CIR.101.25.2968 [DOI] [PubMed] [Google Scholar]
- 33. Guensch DP, Yu J, Nadeshalingam G, Fischer K, Shearer J, Friedrich MG. Evidence for acute myocardial and skeletal muscle injury after serial transthoracic shocks in healthy swine. PLoS One. 2016;11:e0162245. doi: 10.1371/journal.pone.0162245 [DOI] [PMC free article] [PubMed] [Google Scholar]
- 34. Gazmuri RJ, Deshmukh S, Shah PR. Myocardial effects of repeated electrical defibrillations in the isolated fibrillating rat heart. Crit Care Med. 2000;28:2690–2696. doi: 10.1097/00003246-200008000-00002 [DOI] [PubMed] [Google Scholar]
- 35. Olasveengen TM, Eftestol T, Gundersen K, Wik L, Sunde K. Acute ischemic heart disease alters ventricular fibrillation waveform characteristics in out‐of hospital cardiac arrest. Resuscitation. 2009;80:412–417. doi: 10.1016/j.resuscitation.2009.01.012 [DOI] [PubMed] [Google Scholar]
- 36. Kato R, Foex P. Myocardial protection by anesthetic agents against ischemia‐reperfusion injury: an update for anesthesiologists. Can J Anaesth. 2002;49:777–791. doi: 10.1007/BF03017409 [DOI] [PubMed] [Google Scholar]