

Abstract
Background
Isolated loss‐of‐function single nucleotide polymorphisms (SNPs) for SIRT3 (a mitochondrial deacetylase) and UCP2 (an atypical uncoupling protein enabling mitochondrial calcium entry) have been associated with both pulmonary arterial hypertension (PAH) and insulin resistance, but their collective role in animal models and patients is unknown.
Methods and Results
In a prospective cohort of patients with PAH (n=60), we measured SNPs for both SIRT3 and UCP2, along with several clinical features (including invasive hemodynamic data) and outcomes. We found SIRT3 and UCP2 SNPs often both in the same patient in a homozygous or heterozygous manner, correlating positively with PAH severity and associated with the presence of type 2 diabetes and 10‐year outcomes (death and transplantation). To explore this mechanistically, we generated double knockout mice for Sirt3 and Ucp2 and found increasing severity of PAH (mean pulmonary artery pressure, right ventricular hypertrophy/dilatation and extensive vascular remodeling, including inflammatory plexogenic lesions, in a gene dose‐dependent manner), along with insulin resistance, compared with wild‐type mice. The suppressed mitochondrial function (decreased respiration, increased mitochondrial membrane potential) in the double knockout pulmonary artery smooth muscle cells was associated with apoptosis resistance and increased proliferation, compared with wild‐type mice.
Conclusions
Our work supports the metabolic theory of PAH and shows that these mice exhibit spontaneous severe PAH (without environmental or chemical triggers) that mimics human PAH and may explain the findings in our patient cohort. Our study offers a new mouse model of PAH, with several features of human disease that are typically absent in other PAH mouse models.
Keywords: insulin resistance, mitochondria, plexogenic arteriopathy, pulmonary arterial hypertension, vascular disease, vascular remodeling, vascular smooth muscle cells
Subject Categories: Pulmonary Hypertension, Vascular Disease
Nonstandard Abbreviations and Acronyms
- CO
cardiac output
- PAH
pulmonary arterial hypertension
- PASMCs
pulmonary artery smooth muscle cells
- PHT
pulmonary hypertension
- PVR
pulmonary vascular resistance
- TAPSE
tricuspid annular plane systolic excursion
- Ucp2
uncoupling protein 2
Clinical Perspective
What Is New?
We found a provocative correlation between the loss‐of‐function SNPs of sirtuin3 and uncoupling protein 2 (both encode mitochondrial proteins) with the severity of disease in patients with pulmonary arterial hypertension (PAH), as well as an association with the presence of type 2 diabetes (a previously described feature of patients with PAH that remains unexplained) and outcomes (death or transplantation).
We also created a novel mouse model (sirtuin3 and uncoupling protein 2 double‐knockout) of PAH in which to explore our clinical data, and we found that it has more features of human PAH than any previously described rodent model of PAH.
This is the first mouse model of PAH with spontaneous and extensive plexogenic lesions (the sine qua non of human PAH).
What Are the Clinical Implications?
Our mouse model supports our provocative clinical data in our cohort and is directly relevant to a subgroup of patients with PAH carrying more than 1 loss‐of‐function SNPs in genes encoding mitochondrial proteins, particularly for those patients who carry them in both alleles.
These are relatively common SNPs in the general population and thus they could be further explored as potential biomarkers in Precision Medicine studies.
Also, since mouse models of PAH have been criticized for the lack of important clinical features of human PAH (including the mild increase in pulmonary artery pressures and the lack of plexogenic lesions), our new mouse PAH model is important for the translational research field of PAH, strengthening the role of genetic mouse models for mechanistic studies.
Pulmonary arterial hypertension (PAH) is characterized by pulmonary arterial remodeling that results in lumen obliteration, raising the pulmonary vascular resistance (PVR). While initially this leads to right ventricular (RV) hypertrophy, it then advances to RV dilatation and death from RV failure. 1 , 2 The vascular wall cells in the remodeled pulmonary arteries are characterized by activation of many transcription factors (eg, nuclear factor of activated T‐cells c2, hypoxia inducible factor 1α, etc) that promote proliferation; and by a multifactorial suppression of mitochondrial function that promotes apoptosis resistance in a cancer‐like manner. 1 Our proposed metabolic theory of PAH suggests that such a mitochondrial suppression is a critical and early event that has the potential to also activate many of the transcription factors implicated in PAH. 3 , 4 , 5 It could also promote the inflammation that has recently been shown to play a central role in the disease (eg, the remodeled pulmonary arteries are surrounded by many activated inflammatory cells). 3 , 4 , 6 Inhibition of mitochondrial oxidative phosphorylation (glucose oxidation) is an early and necessary event in T cell activation. 7 There is also evidence that patients with PAH have features of the metabolic syndrome and insulin resistance (without necessarily being obese). 8 In fact, in skeletal muscle biopsies in patients with PAH, there is evidence of mitochondrial dysfunction (downregulation of mitochondrial enzymes and upregulation of glycolytic enzymes). 9 In animals with PAH, decreased respiration in skeletal muscle was shown to be present early in the development of PAH. 10 This suggests that a systemic metabolic disturbance may affect the whole body in a patient with PAH, although the vascular pathology is specific to the pulmonary arteries (compared with systemic vessels). This is why knocking out mitochondrial proteins in the whole animal (as opposed to cell or tissue‐specific KO) is clinically relevant.
Indeed, KO mice lacking either Sirt3 (sirtuin3) 11 (a major mitochondrial deacetylase) or Ucp2 (uncoupling protein 2) 12 , 13 (an atypical uncoupling protein that mostly facilitates calcium entry into the mitochondria) developed spontaneous pulmonary hypertension (PHT) and vascular remodeling. However, as is commonly the case with mice PHT models, the increase in PA pressure was mild and the mice did not develop plexogenic lesions, perhaps the most typical pathology finding in human PAH (anarchic proliferation of diverse vascular and inflammatory cells causing near‐complete obliteration of the vascular lumen). 14 In fact, the only model that reliably exhibits plexiform lesions and severe PAH with high mortality is the rat in response to Sugen (a vascular endothelial growth factor inhibitor) plus hypoxia, although the plexiform lesions appear only at the late stages of the disease. 15 A potential limitation of that model is that a nonphysiologic drug has to be used, confounding the interpretation of the data, particularly on the role of endothelial cells. Currently, there is no mouse model that develops predictably and commonly plexogenic lesions.
Loss of Sirt3 or Ucp2 expression or function leads to hyperacetylation of mitochondrial proteins and enzymes (inhibiting their function 11 , 16 ) and decreased intramitochondrial calcium 17 (inhibiting the function of Ca++‐dependent enzymes such as pyruvate dehydrogenase, the gatekeeping enzyme in glucose oxidation 12 ), respectively. This results in mitochondrial hyperpolarization and decreased production of diffusible mitochondrial reactive oxygen species (such as H2O2) causing apoptosis resistance. 3 , 4 , 5 Along with the decreased production of diffusible metabolites (such as α‐ketoglutarate) in pulmonary vascular cells, these redox changes promote activation and nuclear translocation of pro‐proliferative transcription factors, such as hypoxia inducible factor 1α (even in the absence of hypoxia) or nuclear factor of activated T‐cells c2, which have been implicated in the pathogenesis of PAH. 3 , 4 , 5
We recently conducted a small clinical trial to test the response of patients with PAH to a metabolic modulator, showing potential beneficial effects. 18 To study the subgroup of patients who did not respond to dichloroacetate, a drug that has been shown to reactivate mitochondrial suppression by inhibiting pyruvate dehydrogenase kinase (a mitochondrial enzyme that inhibits pyruvate dehydrogenase), we performed genotyping. We found that several patients had loss of function SNPs in SIRT3 (rs11246020) and UCP2 (uncoupling protein 2) (rs659366) in 1 or both alleles, and in fact some patients carried both single nucleotide polymorphisms (SNPs) in either 1 or both alleles. 18 Clinically, the presence of these relatively common SNPs has been associated with the metabolic syndrome and type 2 diabetes in humans 16 , 19 , 20 , 21 , 22 (ie, conditions in which a generalized metabolic abnormality is present throughout the body). The SIRT3 SNP affects the catalytic domain of the sirtuin3 protein, inhibiting its activity by up to 34%, whereas the UCP2 SNP affects the promoter of the gene, resulting in decreased UCP2 mRNA levels. 16 , 22 Either way, the patients who carry these SNPs, which are not in linkage disequilibrium, would have abnormal mitochondrial function and may be predisposed to more severe PAH, particularly when both SNPs are present.
First, we hypothesized that these 2 SIRT3 and UCP2 SNPs may be prevalent in patients with PAH and may be correlated with the severity of disease, the presence of type 2 diabetes, and perhaps the outcomes of the disease. Second, to mechanistically explore this hypothesis, we generated mice that lack both Sirt3 and Ucp2 and hypothesized that they may develop severe PHT and perhaps recapitulate more features of human PAH than other commonly used rodent PHT models. We specifically aimed to determine whether they would develop spontaneous and severe PHT at a young age (without the use of external triggers such as hypoxia or Sugen), as well as inflammatory plexogenic lesions.
Methods
The data that support the findings of this study are available from the corresponding author upon reasonable request.
Our work with human clinical data and human blood as well as our work with mice were performed with permission from the University of Alberta Human Research Ethics Board (HREB) and Animal Care and Use Committee (ACUC), respectively.
SNP Genotyping Assay
Genomic DNA was extracted from buffy coat using FlexiGene DNA Kit (QIAGEN) following the manufacturer's instruction. DNA samples were quantified with a Nanodrop Spectrophotometer (ND‐8000) and normalized to a concentration of 6.5 ng/μL. Samples (50 ng per each) were genotyped by TaqMan SNP Genotyping Assays for rs11246020 (SIRT3) and rs659366 (UCP2), and processed and read on the Droplet Digital PCR QX200 (Bio‐Rad) according to the manufacturer's protocol. Each sample was partitioned into 20 000 discrete droplets and after amplification, each droplet was analyzed individually using a 2‐color detection system (FAM and VIC). Amplifications were carried out as follows: at 94 °C for 10 minutes, followed by 40 cycles at 94 °C (30 s), 60 °C (1 minute, ramp rate: 2–3 °C per s); followed by holding at 98 °C (10 minutes), and holding at 4 °C.
Sirt3 and Ucp2 Mutant Genotyping
Mice were genotyped by polymerase chain reaction (PCR) using genomic DNA isolated from ear notching biopsies as described by Jackson Laboratories. Sirt3 mutant mice have deletion of exons 2 to 3, which abolishes gene function. A combination of 2 forward primers (1 for mutant, sequence: TAC TGA ATA TCA GTG GGA ACG and 1 for wild type, sequence: CTT CTG CGG CTC TAT ACA CAG) along with 1 common reverse primer (sequence: TGC AAC AAG GCT TTA TCT TCC) was used to detect the wild‐type allele (562 bp) and the mutant allele (200 bp, deletion of exons 2–3 result in a smaller fragment). The Sirt3 heterozygous mice are positive for both alleles (wild type 562 bp and mutant 200 bp). The targeted Ucp2 mutant mice have an insertion of a PGK‐NEO cassette replacing exons 3 to 7 to create the larger mutant allele. Two sets of primers are used in combination to identify wild type (forward primer sequence: GCG TTC TGG GTA CCA TCC TA, reverse primer sequence: GCT CTG AGC CCT TGG TGT AG) and mutant mice (forward primer sequence: CTT GGG TGG AGA GGC TAT TC, reverse primer sequence: AGG TGA GAT GAC AGG AGA TC). The mutant allele (that expresses the larger PGK‐NEO cassette) is expressed at 280 bp, while the wild‐type allele (which does not express the PGK‐NEO cassette) is expressed at a lower 156 bp. The Ucp2 heterozygous mice are positive for both alleles (mutant 280 bp and wild type 156 bp). PCRs were carried out on a MasterCycler PCR Thermal Cycler (Eppendorf Cat # 5345) by direct amplification of the DNA from ear notching biopsies with the use of Phire Tissue Direct PCR Master Mix (ThermoFisher Scientific Cat # F170) following the manufacturer's protocol. Amplifications were carried out as follows: at 94 °C for 5 minutes, followed by 10 cycles at 94 °C (20 s), 65 °C (15 s, −0.5 °C per cycle decrease), 68 °C (10 s); followed by 32 cycles at 98 °C (15 s), 60 °C (15 s), 72 °C (10 s); finishing at 72 °C (2 minutes) and holding at 4 °C.
RNA Isolation and Quantitative Reverse Transcription PCR
mRNA was isolated using Qiazol (Qiagen). mRNA isolated from muscle and lung was added to a microwell plate with TaqMan probes and reagents. Primers were purchased from Thermo Fisher Scientific (Sirt3 Mm01275637_g1, Ucp2 Mm00627599_m1).
Cell Culture
Pulmonary artery smooth muscle cells (PASMCs) isolation was performed as previously described. 11 , 12 Briefly, PASMCs from wild‐type (WT), Sirt3−/−‐Ucp2+/− , Sirt3+/−‐Ucp2−/− , and Sirt3−/−‐Ucp2−/− mice were freshly isolated from intrapulmonary arteries (>fourth division), with an enzymatic cocktail containing papain (1 mg/mL) (Sigma Aldrich), dithiothreitol (0.5 mg/mL) (Sigma Aldrich), collagenase I (0.8 mg/mL) (Worthington), and bovine serum albumin (0.8 mg/mL) (Sigma‐Aldrich). PASMCs were cultured in Dulbecco's Modified Eagle's Medium (DMEM, Gibco) with 10% fetal bovine serum (Sigma‐Aldrich) and 1% penicillin/streptomycin (Gibco) at 9% CO2. Passages 2 to 4 PASMCs were used for all experiments.
Mitochondrial Respiration Measurements
PASMCs were seeded to Seahorse V7 tissue culture plates overnight for analysis of oxygen consumption and extracellular acidification using the Seahorse XFe 24 Analyzer (Agilent Technologies). Measurements were taken at baseline. Oxygen consumption rate and extracellular acidification rate were measured and normalized to total protein amounts isolated from each well.
Immunoblots
Tissues were collected and immunoblotting was performed as previously described. 11 , 12 Antibodies and dilutions: sirtuin3 (Cell Signaling Technology, 5490) 1:1000, Ucp2 (Santa Cruz, sc‐6525) 1:300, p‐AKT (Ser473) (Cell Signaling Technology, 4060T) 1:1000, AKT (Cell Signaling Technology, 4691) 1:3000, and β‐Actin (Santa Cruz sc81178) 1:2000.
Confocal Imaging
Immunofluorescence staining was performed as previously described 11 , 12 , 18 , 23 and imaging was performed using a Zeiss LSM‐710 model, equipped with an Airyscan module (Carl Zeiss). Antibodies used were alpha smooth muscle actin (Abcam, ab5694), von Willebrand factor (Abcam, ab11713), CD4 (Invitrogen, LS14004182), Ki67 (Abcam, ab16667), nuclear factor of activated T‐cells c2 (Abcam, ab2722), hypoxia inducible factor 1α (Abcam, 51608), and Y705p‐STAT3 (Cell Signaling Technology, 9131). All antibodies used for immunofluorescence were diluted in 1:100 and all secondary antibodies in 1:1000. Apoptosis was measured using the Apoptag Apoptosis Detection Kit for TUNEL (Invitrogen) and the Dead Cell Apoptosis Kit with Annexin V FITC and Propidium iodide (Invitrogen). The mitochondrial membrane potential was measured by staining live PASMCs with 20 nmol/L tetramethyl‐rhodamine methyl‐ester perchlorate (Invitrogen) and 500 nmol/L Hoechst 33342 (Invitrogen) for 30 minutes at 37 °C. The mitochondrial reactive oxygen species were measured by staining live PASMCs with 5 μmol/L MitoSOX (Invitrogen) and 500 nmol/L Hoechst 33342 in nonserum media for 15 minutes at 37 °C, and then cells were washed and replaced with regular media.
Echocardiography
Echocardiography was performed as previously described. 11 , 12 , 24 , 25 Mice were anesthetized with isoflurane and maintained a heart rate of 350 to 450 beats per minute and the Vevo 3100 High Resolution Imaging System (VisualSonics, Toronto, Canada) was used. RV thickness, RV end‐diastolic diameter, and tricuspid annular plane systolic excursion (TAPSE) were recorded in the M‐Mode. TAPSE was calculated by measuring the vertical movement of the tricuspid annulus between end‐diastole and end‐systole in the 4‐chamber view, reflecting the longitudinal contraction of the RV. Cardiac output (CO) was calculated after determining the pulmonary artery diameter, pulmonary artery velocity time integral, and heart rate using the formula: CO=7.85×PAD2×pulmonary artery velocity time integral×heart rate/10 000. Images with heart rate <350 were excluded from the analysis.
Hemodynamic Measurements
Mice were initially anesthetized with 3% to 4% isoflurane and maintained with 2% during procedures. Mice underwent hemodynamic studies as previously described 11 , 12 , 24 , 25 and were euthanized subsequently. A modified Millar catheter (microtip, 1.4F, Millar Instruments) was advanced through the jugular vein in closed‐chest animals into right atrium (RA), RV, and PA; and RA pressure, RV pressure, and mean PA pressure were recorded. Left ventricular end‐diastolic pressure was recorded by retrograde advancement of the catheter from the carotid artery into the left ventricle (Power Lab, with Chart software 5.4, ADInstruments).
Pulmonary Vascular Medial Wall Thickness and Pulmonary Arteriole Muscularization
Frozen lung samples were prepared after injecting OCT through the trachea to expand the lung. Lung sections (5 µm) were stained using hematoxylin and eosin stain for histology, and smooth muscle actin and von Willebrand factor (endothelial cell marker) for immunofluorescence. For measuring medial wall thickness, vessels >40 and <300 µm were identified and measured at the 2 ends of the shortest external diameter of the pulmonary arteries, and the average was taken ([2×wall thickness/external diameter] ×100). For measuring muscularization, vessels (<40 µm) were classified as fully (100%), partially, or nonmuscularized (0%), based on the percentage of von Willebrand factor surrounded by smooth muscle actin in each vessel.
In Vivo Assessment of Glucose Homeostasis
Glucose and insulin tolerance tests were performed in mice fasted overnight or after a 6‐hour fast, following which IP glucose (2 g/kg) or insulin (0.5 U/kg) was administered. Blood glucose measurements were assessed via tail whole‐blood at the end of the fast, followed by samples at various time points postglucose or insulin administration, using the Contour Next blood glucose monitoring system (Bayer) as previously described. 26 Plasma was also collected during the glucose tolerance test from tail whole‐blood at the 0‐ and 30‐minute time points for the assessment of circulating insulin levels, using a commercially available enzyme‐linked immunosorbent assay kit (Alpco Diagnostics) as previously described. 26
Statistical Analysis
All statistical analyses were performed on STATA (StataCorp LLC, TX). Values are expressed as mean±SEM. The use of parametric or nonparametric tests was decided after assessment of normal distribution of the values by the Shapiro–Wilk normality test. For parametric tests, we used 2‐tailed, unpaired Student t test to assess statistical significance between 2 groups, and multiple groups were compared using 1‐way ANOVA or 2‐way repeated‐measures ANOVA followed by a Bonferroni post hoc analysis. For nonparametric tests, Mann–Whitney U test was used for comparisons between 2 groups and Kruskal–Wallis test was used to compare multiple groups. Nonparametric correlation analysis of the clinical data was performed using the Spearman correlation coefficient. Significance for all statistical testing was considered to be P<0.05.
Results
To study the presence of SIRT3 and UCP2 SNPs, we used a small (n=60) but well‐characterized prospective cohort of patients with PAH that had agreed to participate in our clinical database and also offer blood for our biobank, at the time of their referral, over the past 10 years. These consisted of associated PAH (mainly patients with autoimmune collagen vascular diseases such as scleroderma or history of anorectic drugs use) and idiopathic PAH. All patients underwent right heart catheterization, echocardiography, pulmonary function testing, V/Q scan and lung computed tomography scans, as well as extensive bloodwork, so that all the potentially secondary causes of PHT were excluded and the patients could accurately be diagnosed with PAH. Patients were not included if they had a severe disease other than PAH, including cancer, evidence of significant systemic vascular disease, morbid obesity, or renal failure. The hemodynamics shown in Table reflect the first catheterization, before the initiation of PAH therapies. All the patients were followed at least 3 times a year and all received a protocol‐driven initiation of PAH therapies, which included the following: phosphodiesterase type 5 inhibitors as a first line of therapy; addition of an endothelin receptor antagonist if 3 to 4 months later the 6‐minute walk test remained below 350 m; and addition of a prostacyclin analogue if at any point the 6‐minute walk dropped below 200 m with clinical evidence of RV failure resistant to diuretics. Table also shows the therapies for each patient, at the last review of the 10‐year database (ie, June 2020). The common, protocol‐driven therapeutic approach and the exclusion of significant comorbidities at inclusion allowed us to follow outcomes (death or lung transplantation) in our cohort. All the deaths shown in Table were considered, to the best of our knowledge, to be a direct result of PAH worsening and right heart failure.
Table 1.
Single nucleotide polymorphism (SNP) Scores for UCP2/SIRT3 and Clinical Information Related to the PAH Cohort
| Age, y | Sex | Type | mPAP (mm Hg) | PVR (dyn·s/cm5) | Type 2 DM | Meds | Outcomes | SIRT3 | UCP2 | SNP score | |
|---|---|---|---|---|---|---|---|---|---|---|---|
| 1 | 63 | F | aPAH | 40 | 429 | Y | P, E | Dead | V/Wt | V/Wt | 2 |
| 2 | 62 | F | aPAH | 52 | 665 | Y | P | Alive | Wt/Wt | V/Wt | 1 |
| 3 | 77 | M | iPAH | 54 | 804 | N | P, E, Pr | Alive | Wt/Wt | V/Wt | 1 |
| 4 | 78 | M | iPAH | 52 | 752 | N | P, E | Dead | Wt/Wt | V/Wt | 1 |
| 5 | 74 | M | aPAH | 47 | 663 | Y | P, E | Dead | V/Wt | V/Wt | 2 |
| 6 | 48 | M | iPAH | 61 | 905 | N | P, E, Pr | Alive | V/Wt | Wt/Wt | 1 |
| 7 | 38 | F | aPAH | 60 | 634 | N | P | Dead | Wt/Wt | V/Wt | 1 |
| 8 | 66 | F | aPAH | 48 | 1376 | N | P, E, Pr | Dead | Wt/Wt | V/V | 2 |
| 9 | 68 | F | aPAH | 40 | 695 | N | P, E, Pr | Alive | V/Wt | Wt/Wt | 1 |
| 10 | 64 | F | aPAH | 28 | 597 | N | P | Alive | Wt/Wt | V/Wt | 1 |
| 11 | 53 | F | iPAH | 64 | 1429 | N | P, E | Alive | V/Wt | Wt/Wt | 1 |
| 12 | 67 | F | aPAH | 39 | 281 | N | P | Alive | Wt/Wt | Wt/Wt | 0 |
| 13 | 52 | F | aPAH | 70 | 609 | N | P, E, Pr | Alive | V/Wt | Wt/Wt | 1 |
| 14 | 46 | F | iPAH | 68 | 838 | Y | P, Pr | Alive | Wt/Wt | V/V | 2 |
| 15 | 45 | F | aPAH | 44 | 451 | N | P, E | Dead | V/Wt | Wt/Wt | 1 |
| 16 | 73 | M | iPAH | 53 | 640 | N | P, E | Dead | V/Wt | V/Wt | 2 |
| 17 | 55 | M | aPAH | 59 | 812 | N | P, E, Pr | Alive | V/Wt | V/Wt | 2 |
| 18 | 70 | M | aPAH | 60 | 580 | N | P, E, Pr | Dead | Wt/Wt | V/V | 2 |
| 19 | 63 | F | aPAH | 54 | 567 | N | P, Pr | Alive | Wt/Wt | Wt/Wt | 0 |
| 20 | 36 | M | iPAH | 68 | 1011 | N | P, Pr | Transpl | V/Wt | V/Wt | 2 |
| 21 | 48 | F | aPAH | 51 | 1502 | N | P, Pr | Dead | Wt/Wt | V/Wt | 1 |
| 22 | 51 | F | aPAH | 42 | 463 | N | P, E | Alive | Wt/Wt | Wt/Wt | 0 |
| 23 | 48 | F | iPAH | 69 | 709 | N | P, E | Alive | Wt/Wt | V/Wt | 1 |
| 24 | 24 | F | iPAH | 37 | 348 | N | P, E | Alive | Wt/Wt | Wt/Wt | 0 |
| 25 | 57 | M | iPAH | 55 | 775 | N | P, E, Pr | Alive | Wt/Wt | Wt/Wt | 0 |
| 26 | 72 | M | iPAH | 60 | 584 | Y | P | Dead | Wt/Wt | V/Wt | 1 |
| 27 | 74 | M | iPAH | 48 | 417 | N | P | Dead | Wt/Wt | V/Wt | 1 |
| 28 | 40 | F | iPAH | 48 | 950 | N | P, E | Alive | Wt/Wt | Wt/Wt | 0 |
| 29 | 22 | F | iPAH | 48 | 1097 | N | P, E, Pr | Alive | V/Wt | Wt/Wt | 1 |
| 30 | 70 | F | iPAH | 58 | 987 | N | P, Pr | Alive | Wt/Wt | V/V | 2 |
| 31 | 58 | M | iPAH | 94 | 1387 | N | P, Pr | Dead | V/V | Wt/Wt | 2 |
| 32 | 31 | M | aPAH | 29 | 434 | N | P | Alive | V/Wt | Wt/Wt | 1 |
| 33 | 58 | M | aPAH | 27 | 316 | N | P | Alive | Wt/Wt | Wt/Wt | 0 |
| 34 | 42 | M | iPAH | 65 | 592 | N | P, E | Dead | Wt/Wt | V/Wt | 1 |
| 35 | 70 | F | iPAH | 62 | 527 | Y | P, Pr | Dead | Wt/Wt | Wt/Wt | 0 |
| 36 | 53 | M | iPAH | 52 | 770 | N | P, E | Dead | V/Wt | V/Wt | 2 |
| 37 | 43 | F | iPAH | 34 | 465 | N | P | Alive | Wt/Wt | V/V | 2 |
| 38 | 36 | F | iPAH | 52 | 710 | N | P, E | Dead | Wt/Wt | Wt/Wt | 0 |
| 39 | 71 | F | aPAH | 31 | 480 | N | P, E | Dead | Wt/Wt | Wt/Wt | 0 |
| 40 | 73 | F | aPAH | 40 | 493 | N | P, E, Pr | Dead | Wt/Wt | V/Wt | 1 |
| 41 | 57 | M | aPAH | 37 | 617 | N | P, B | Dead | Wt/Wt | V/Wt | 1 |
| 42 | 49 | M | aPAH | 39 | 512 | N | P | Alive | Wt/Wt | Wt/Wt | 0 |
| 43 | 51 | F | aPAH | 29 | 336 | N | P, E | Dead | Wt/Wt | V/Wt | 1 |
| 44 | 56 | F | iPAH | 69 | 850 | N | P, E, Pr | Dead | Wt/Wt | Wt/Wt | 0 |
| 45 | 31 | F | iPAH | 26 | 357 | N | P | Alive | Wt/Wt | Wt/Wt | 0 |
| 46 | 74 | F | aPAH | 43 | 311 | Y | P, E | Dead | Wt/Wt | V/Wt | 1 |
| 47 | 31 | F | iPAH | 70 | 738 | N | P, E | Alive | Wt/Wt | Wt/Wt | 0 |
| 48 | 70 | F | iPAH | 51 | 710 | N | P, E | Alive | V/Wt | Wt/Wt | 1 |
| 49 | 60 | F | iPAH | 59 | 648 | Y | P, E | Dead | Wt/Wt | V/Wt | 1 |
| 50 | 48 | M | aPAH | 86 | 1067 | N | P, E | Dead | Wt/Wt | V/Wt | 1 |
| 51 | 44 | F | aPAH | 25 | 309 | N | P | Dead | Wt/Wt | V/Wt | 1 |
| 52 | 50 | F | aPAH | 60 | 832 | N | P, E | Alive | V/Wt | V/V | 3 |
| 53 | 71 | M | iPAH | 42 | 640 | N | P, E | Dead | Wt/Wt | Wt/Wt | 0 |
| 54 | 54 | F | aPAH | 45 | 577 | N | P, E | Dead | Wt/Wt | Wt/Wt | 0 |
| 55 | 47 | F | iPAH | 58 | 756 | N | P, E, Pr | Dead | V/V | Wt/Wt | 2 |
| 56 | 24 | F | iPAH | 56 | 912 | N | P, E, Pr | Transpl | Wt/Wt | Wt/Wt | 0 |
| 57 | 27 | F | iPAH | 50 | 1050 | N | P, E, Pr | Dead | V/Wt | V/Wt | 2 |
| 58 | 19 | M | aPAH | 40 | 334 | N | P | Alive | Wt/Wt | Wt/Wt | 0 |
| 59 | 61 | F | iPAH | 57 | 800 | N | P, E, Pr | Dead | Wt/Wt | V/V | 2 |
| 60 | 36 | F | iPAH | 52 | 710 | Y | P, E | Alive | Wt/Wt | Wt/Wt | 0 |
aPAH indicates associated pulmonary arterial hypertension; DM, diabetes mellitus; E, endothelin receptor antagonists; iPAH, idiopathic pulmonary arterial hypertension; mPAP, mean pulmonary artery pressure; P, phosphodiesterase type 5 inhibitors; Pr, prostacyclin analogues; PVR, pulmonary vascular resistance; V, gene variant (SNP); and Wt, wild type (normal).
Digital PCR was utilized with primers for both the SNP variant and the WT versions of each of the SIRT3 and UCP2 genes. We used an SNP score method that we previously described, 18 by which a score of 0 was given if both alleles were WT; a score of 1 if 1 of the SNPs was present in a heterozygous manner; a score of 2 if both SNPs were present in a heterozygous manner or 1 SNP was present in a homozygous manner; and a score of 3 if 1 SNP was present in a homozygous and the other was present in a heterozygous manner (Table; Figure 1A). Table lists the SNP (ie, gene variant) in both alleles for both SIRT3 and UCP2 genes. We found that the majority of patients had an SNP score of 1, many had a score of 2, and 1 patient had a score of 3 (Table). A nonparametric correlation analysis using the Spearman coefficient revealed a weak but statistically significant positive correlation between the PVR (mean PAP‐PAWP/CO) and the SNP score (Figure 1B), meaning the increase of PVR is a dosage effect of gene alleles. We found that type 2 diabetes was more prevalent in patients with an SNP score of 1 and 2 to 3 (attributable risk from the presence of the SNPs 58% and 75%, respectively), and the same was true for death/transplantation (attributable risk 29% and 47%), compared with patients with an SNP score of 0 (Table; Figure 1B). We realize the small size of our single center cohort does not allow us to conclude that there is either a true or a causal association with disease severity, type 2 diabetes, or negative outcomes, but this was a motivation to explore this provocative association mechanistically with an animal model.
Figure 1. SIRT3 and UCP2 single nucleotide polymorphisms (SNPs) in a cohort of patients with PAH.
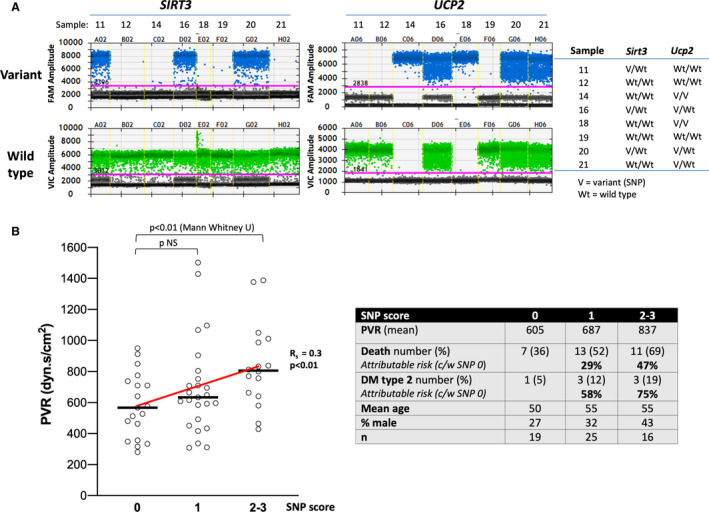
A, Representative PCR studies of a few patients with PAH showing how the detection of the gene variant (SNP) or the wild‐type gene in each of the 2 alleles allowed us to calculate the SNP score for each patient. For each sample the presence of “hits” above the threshold line (in pink) determines whether the variant is in none (Wt/Wt), 1 (V/Wt), or both alleles (V/V). B, Spearman coefficient of 0.3 shows a weak but statistically significant (P<0.01) correlation between the SNP score and the pulmonary vascular resistance (PVR) (see Table). (left) Mann–Whitney U testing shows a significant difference between SNP score 0 and 2 to 3. The sample size, the percent of death/transplantation, and the percent of type 2 diabetes mellitus for each SNP score group as well as the attributable risk for the SNP 1 and SNP 2 to 3 groups (compared with the SNP 0 group) is shown in the table to the right. c/w indicates compared with; DM, diabetes mellitus; FAM, fluorescein amidite; NS, not significant; PCR, polymerase chain reaction; SIRT3, sirtuin3; UCP2, uncoupling protein 2; V, variant; and Wt, wild type.
We generated a double knockout colony from a double heterozygous colony that was initially generated by crossing heterozygote Sirt3+/− mice (129/Sv background) with Ucp2+/− mice (C57BL6 background), both of which are commercially available and previously published by our group. 11 , 12 We then crossed double heterozygous mice to obtain a Mendelian mix of Sirt3+/−‐Ucp2+/− , Sirt3−/−‐Ucp2+/− , Sirt3+/−‐Ucp2−/− , and Sirt3−/−‐Ucp2−/− mice. We crossed the double heterozygous subcolony for 10 generations before we established a stable new mixed background WT mouse (WT, Sirt3+/+‐Ucp2+/+ ) and after that, we started crossing and studying littermate mice (Figure S1A through S1C). We chose this approach (rather than backcrossing toward 1 of the 2 backgrounds) because it better reflects the genetic variability of our patients with PAH. Sirt3−/−‐Ucp2−/− mice were viable at birth (ie, no embryonic lethality), and they also fit the predicted Mendelian ratio, suggesting that double loss of Sirt3 and Ucp2 is not required for embryogenesis.
By the third to fourth month of age, both male and female mice showed clinical evidence of disease (ie, decreased activity, agitation, and decreased feeding). Echocardiography and close‐chest right heart catheterization (via the jugular vein) at 3‐ to 4‐months‐old mice revealed PHT with elevated systolic and mean arterial pressures, increased right atrial pressure, decreased cardiac output, RV hypertrophy and RV dilatation (both by echocardiography and at euthanasia) and decreased systolic RV function (by TAPSE in echocardiography) (Figure 2A and 2B). Absence of any increase in left ventricular end‐diastolic pressure (Figure S2) and macroscopic/histology evidence of lung parenchymal abnormalities suggested that this was PAH. Importantly and as hypothesized, there was a dose–response between the degree of gene loss and the severity of PAH, as the worse PAH was found in Sirt3−/−‐Ucp2−/− mice, less in the Sirt3−/−‐Ucp2+/− or Sirt3+/−‐Ucp2−/− mice, and less in the Sirt3+/−‐Ucp2+/− mice, while all showed higher pressures than the WT mice (Figure 2A). Even at this young age of 3 to 4 months, the mice had clear right ventricular hypertrophy (RVH), and decreased systolic RV function and RV dilatation was mostly present at the Sirt3−/−‐Ucp2+/− or Sirt3+/−‐Ucp2−/− and the Sirt3−/−‐Ucp2−/− mice (Figure 2A). We also performed the Masson's trichrome staining to the right ventricles to measure fibrosis. These data showed that Sirt3−/− ‐Ucp2+/− (3 allele‐KO) and Sirt3−/− ‐Ucp2−/− (double KO) mice have a significant increase of fibrosis, compared with WT controls (Figure S3). Moreover, the mortality (as assessed by Kaplan–Meier survival curve) was significantly increased in the Sirt3−/− ‐Ucp2−/− mice, compared with WT (Figure S4). Although most of the mice studied were male, at least 2 female mice were included in each of the groups shown in Figure 2A. No difference was detected between male and female mice and the data were expressed as 1 group for each study.
Figure 2. A gene dose‐dependent effect on the severity of PAH in mice heterozygote or homozygote to the loss of both Sirt3 and Ucp2.
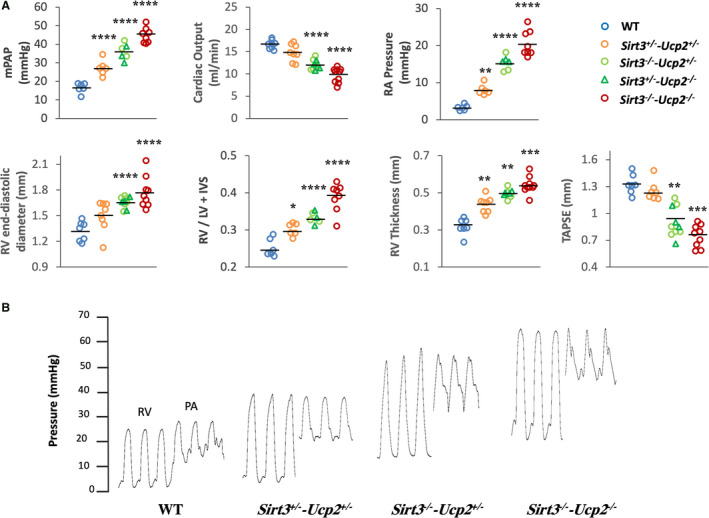
A, Several parameters measured by close chest right heart catheterization (mean PA pressure, RA pressure), echocardiography (cardiac output, RV thickness, RV end‐diastolic diameter, TAPSE) or measured after euthanasia (RV/LV+septum weight) are shown. In each graph, the third column of data shows a mixture of Sirt3+/− ‐Ucp2−/− or Sirt3−/− ‐Ucp2+/− , represented by circles or triangles. These 2 groups were graphed together since their values were similar. For mPAP, cardiac output, RV diameter: ****P<0.0001; for RA pressure: **P=0.008, ****P<0.0001; for RV/ LV+IVS: *P=0.024, ****P<0.0001; for RV thickness: **P=0.0008, ***P=0.0004; for TAPSE: **P=0.0006, ***P=0.0009, compared with WT mice. These comparisons (as well as in the subsequent figures) were done post hoc (Bonferroni) since the overall 1‐way ANOVA for the groups was significant. B, Representative tracings of RV and PA pressures in several mice groups. IVS indicates Interventricular septum; LV, left ventricular; mPAP, mean pulmonary artery pressure; PA, pulmonary artery; PAH, pulmonary arterial hypertension; RA, right atrium; RV, right ventricular; Sirt3, sirtuin3; Ucp2, uncoupling protein 2; TAPSE, tricuspid annular plane systolic excursion; and WT, wild type.
Lung histology showed the presence of extensive vascular remodeling, with the worst shown in Sirt3−/−‐Ucp2−/− and Sirt3−/−‐Ucp2+/− or Sirt3+/−‐Ucp2−/− , in keeping with the hemodynamic data. There was an increase in percent medial thickness in medium‐sized pulmonary arteries (40–100 µm) (Figure 3A) and increased muscularization of the small‐sized vessels (<40 µm), shown in both hematoxylin and eosin staining and confocal microscopy immunohistochemistry, using smooth muscle actin to mark smooth muscle cells and von Willebrand factor to mark the endothelium (Figure 3B). More importantly, there were extensive plexogenic lesions in the pulmonary vessels of the Sirt3−/−‐Ucp2−/− and Sirt3−/−‐Ucp2+/− or Sirt3+/−‐Ucp2−/− mice (Figure 4). The remodeled pulmonary arterioles also had increased levels of the proliferation marker Ki67 (Figure S5).
Figure 3. Pulmonary vascular remodeling in mice heterozygote or homozygote to the loss of both Sirt3 and Ucp2.
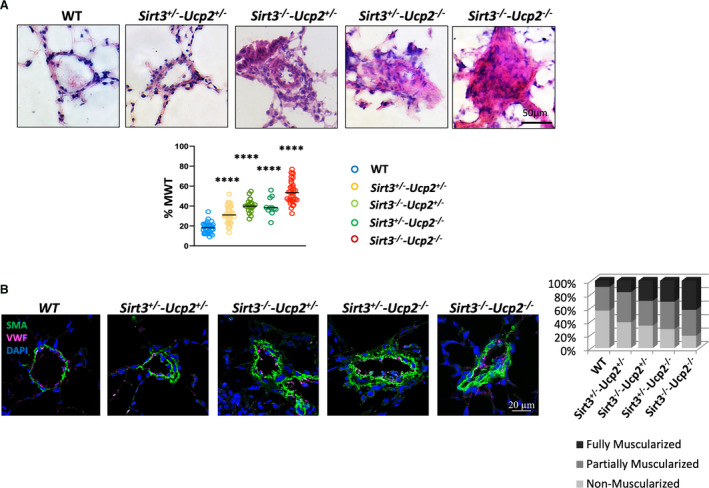
A, Representative images (hematoxylin and eosin staining) from lungs of all the mice groups along with mean data of percent medial wall thickness (MWT) of pulmonary arterioles (40–300 µm) are shown. ****P<0.0001 compared with WT mice. These comparisons were done post hoc (Bonferroni) since the overall 1‐way ANOVA for the groups was significant. n=35 arteries/group. B, Representative confocal images of small arterioles (<40 µm) and mean data of percent muscularization are shown. DAPI indicates 4',6‐diamidino‐2‐phenylindole (nuclear stain); SMA indicates smooth muscle actin; Ucp2, uncoupling protein 2; vWF, von Willebrand factor (marking endothelial cells), and WT, wild type.. The mean percent muscularization is shown to the right. n=50 arteries/group.
Figure 4. Plexogenic arteriopathy in mice lacking both Sirt3 and Ucp2.
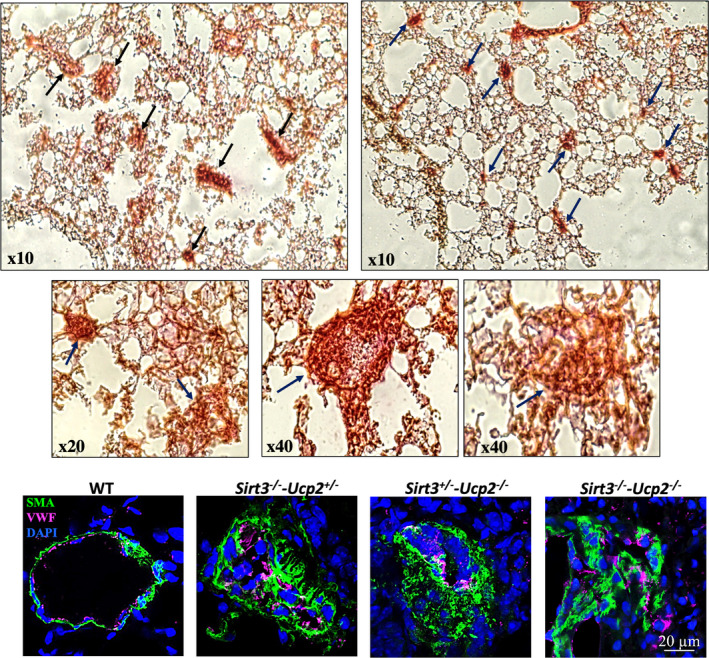
Representative pictures of lung histology (top) and confocal immunohistochemistry of small pulmonary arteries from Sirt3+/− ‐Ucp2−/− , Sirt3−/− ‐Ucp2+/− , and Sirt3−/− ‐Ucp2−/− mice. Arrows indicate plexogenic lesions in top 5 images. DAPI indicates 4',6‐diamidino‐2‐phenylindole (nuclear stain); Sirt3, sirtuin3; SMA, smooth muscle actin; Ucp2, uncoupling protein 2; and vWF, von Willebrand factor (marking endothelial cells).
An unanswered question in the PAH field is the mechanism of the plexogenic arteriopathy and particularly whether this is downstream or upstream to the increase in pressure. Performing closed chest right heart catheterization in young mice is challenging and very difficult in mice of 2 months of age. We managed to perform reliable catheterization in the three 2‐month‐old mice/group and we found that the Sirt3−/−‐Ucp2−/− mice had established plexogenic arteriopathy despite the fact that the PA pressure (at least at rest) was within normal levels and similar to the WT mice (Figure S6).
We then tested whether there was increased presence of inflammatory cells within and around the remodeled pulmonary vessels by staining the lungs with a marker of Treg cells (CD4), which have been directly implicated in the pathogenesis of PAH, although whether they promote injury or they participate in the healing response remains unclear. 27 , 28 Similar to the vascular remodeling degree, the Sirt3−/−‐Ucp2−/− and Sirt3−/−‐Ucp2+/− or Sirt3+/−‐Ucp2−/− mice exhibited a large pulmonary vascular infiltration with CD4+ T cells, compared with lungs from WT mice (Figure S7).
We then isolated and cultured PASMCs from the intrapulmonary pulmonary arteries of these mice (>fourth division) and we showed that even in in vitro conditions they maintained their proliferative phenotype, with the Sirt3−/−‐Ucp2−/− and Sirt3−/−‐Ucp2+/− or Sirt3+/−‐Ucp2−/− PASMCs expressing more Ki67, higher nuclear levels of the pro‐proliferative master transcription factors hypoxia inducible factor 1α and nuclear factor of activated T cells c2, and a higher ratio of nuclear/cytoplasmic of Y705p‐STAT3, than PASMCs from the WT mice (Figure 5A, Figure S8). Under serum starvation (0.1%), the Sirt3−/−‐Ucp2−/− and Sirt3−/−‐Ucp2+/− or Sirt3+/−‐Ucp2−/− PASMCs exhibited less apoptosis compared with the WT cells, measured with the TUNEL (terminal deoxynucleotidyl transferase‐mediated dUTP‐biotin nick‐end labeling) and Annexin V assays (Figure 5B and Figure S9). We have previously shown that proliferative PASMCs from animals with PAH had more hyperpolarized mitochondria (measured by tetramethyl‐rhodamine methyl‐ester perchlorate) and produced less mitochondrial reactive oxygen species (measured by MitoSox). 11 , 12 , 25 , 29 This was confirmed in these cells as well, with the Sirt3−/−‐Ucp2−/− and Sirt3−/−‐Ucp2+/− or Sirt3+/−‐Ucp2−/− PASMCs exhibiting higher mitochondrial membrane potential (higher tetramethyl‐rhodamine methyl‐ester perchlorate fluorescence) and lower levels of mitochondrial reactive oxygen species (lower MitoSox fluorescence) (Figure 6A). The increased mitochondrial potential contributes to the suppression of mitochondria‐dependent apoptosis and is consistent with a suppression of mitochondrial function, as we have previously shown in both PAH PASMCs and cancer cells. 18 , 30 , 31 Thus, we measured respiration and glycolytic rates in PASMCs. As expected, we found that Sirt3−/−‐Ucp2−/− and Sirt3−/−‐Ucp2+/− or Sirt3+/−‐Ucp2−/− PASMCs had lower respiration rates and higher glycolytic rates compared with WT PASMCs, using the SEAHORSE platform (Figure 6B).
Figure 5. Proliferative and anti‐apoptotic phenotype in cultured PASMCs from mice heterozygote or homozygote to the loss of both Sirt3 and Ucp2.
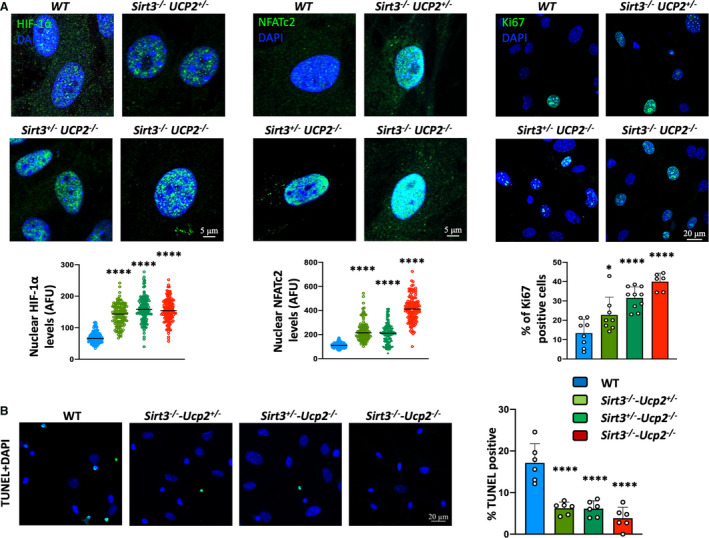
A, Increased intranuclear levels of HIF1α, NFATc2, and Ki67 in PASMCs from mice lacking Sirt3 and Ucp2 compared with PASMCs from WT mice. *P=0.0377, ****P<0.0001 (Bonferroni) compared with the WT PASMCs, following 1‐way ANOVA, n=≈150 cells/group (HIF1α and NFATc2), n=≈240 cells/group (Ki67) (from 3 mice/group). B, Increased resistance to apoptosis (less TUNEL‐positive PASMCs) in response to serum starvation for 48 hours is shown in PASMCs from mice lacking Sirt3 and Ucp2 compared with PASMCs from WT mice. ****P<0.0001 (Bonferroni) compared with the WT PASMCs, following 1‐way ANOVA, n=≈240 cells/group (from 3 mice/group). AFU indicates absolute fluorescence units; DAPI, 4',6‐diamidino‐2‐phenylindole (nuclear stain); HIF1α , hypoxia inducible factor 1 α; NFATc2, nuclear factor of activated T cells 2; PASMCs, pulmonary artery smooth muscle cells; sirt3, sirtuin3; TUNEL, terminal deoxynucleotidyl transferase‐mediated dUTP‐biotin nick‐end labeling; Ucp2, uncoupling protein 2; and WT, wild type.
Figure 6. Metabolic remodeling in PASMCs from mice lacking Sirt3 and Ucp2.
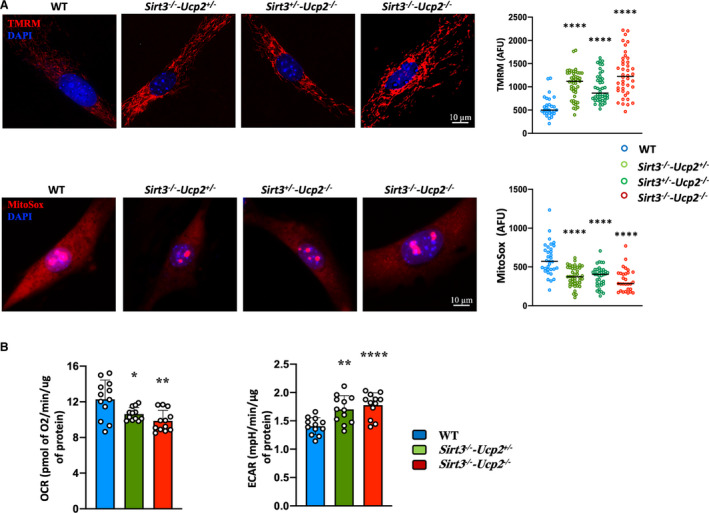
A, Staining with the mitochondrial tracer TMRM and MitoSox shows that PASMCs from Sirt3−/−‐Ucp2+/− , Sirt3+/−‐Ucp2−/− , and Sirt3−/−‐Ucp2−/− mice have higher mitochondrial membrane potential and lower production of mitochondrial‐derived ROS, respectively, compared with mitochondria from WT PASMCs. ****P<0.0001 (Mann–Whitney U test) compared with the WT PASMCs, n=50 cells/group (3 experiments). B, SEAHORSE measurements of respiration (OCR) and ECAR (indicative of glycolysis) show that PASMCs from Sirt3−/− ‐Ucp2+/− and Sirt3−/− ‐Ucp2−/− mice have suppressed OCR (ie, suppressed mitochondrial function) and increased ECAR (ie, secondary increase in glycolysis) compared with PASMCs from WT mice. For OCR: *P=0.0196, **P=0.0025; for ECAR: **P=0.0016, ****P<0.0001 (Bonferroni) compared with the WT PASMCs, following 1‐way ANOVA. n=12 measurements from 3 mice/group. AFU indicates absolute fluorescence units; DAPI, 4',6‐diamidino‐2‐phenylindole (nuclear stain); ECAR, extracellular acidification rate; OCR, oxygen consumption rate; PASMCs, pulmonary artery smooth muscle cells; ROS, reactive oxygen species; sirt3, sirtuin3; TMRM, tetramethylrhodamine methyl ester; Ucp2, uncoupling protein 2; and WT, wild type.
Last, we assessed for signs of insulin resistance in Sirt3−/− ‐Ucp2−/− mice, which demonstrated marked elevations in blood glucose levels in response to a glucose tolerance test, compared with WT mice (Figure 7A). 32 The glucose intolerance in Sirt3−/− ‐Ucp2−/− mice was associated with no change in circulating insulin levels, suggesting that there is skeletal muscle insulin resistance, rather than pancreatic dysfunction. Accordingly, the ability of insulin to lower blood glucose was markedly diminished in Sirt3−/− ‐Ucp2−/− mice during an insulin tolerance test, compared with WT mice (Figure 7A). Moreover, Akt phosphorylation was impaired in the gastrocnemius muscle collected from Sirt3−/− ‐Ucp2−/− mice during the insulin tolerance test, whereas the Akt phosphorylation increased appropriately in WT gastrocnemius muscle (Figure 7B). This finding also supported insulin resistance in Sirt3−/− ‐Ucp2−/− mice, likely because of impaired insulin signaling immediately downstream from the insulin receptor.
Figure 7. Insulin resistance in mice lacking Sirt3 and Ucp2 and an overall proposed mechanism for the diverse effects of SIRT3 and UCP2 loss in humans and mice with PAH.
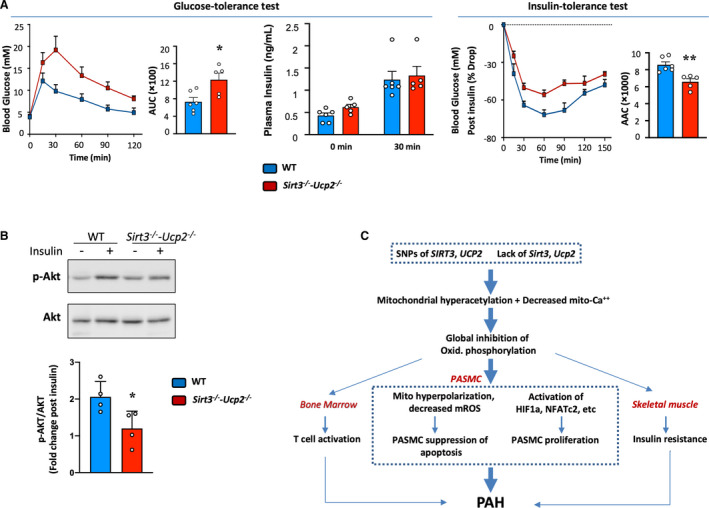
A, Following starvation for 16 h, the glucose levels in the blood Sirt3−/− ‐Ucp2−/− are higher following glucose administration at time 0, compared with WT mice (glucose 2 g/kg IP), but the blood insulin levels are not different (GTT). The glucose levels decrease less after insulin administration (0.5 U/kg IP) following 6 h starvation (the ITT was performed 5 d after the GTT), compared with WT mice. AUC (for GTT test) and AAC (for ITT test) are shown in the bar graphs. Differences were determined by the use of an unpaired 2‐tailed Student t test (AUC and AAC) or a 2‐way repeated‐measures ANOVA followed by Bonferroni post hoc analysis (GTT and ITT). 32 *P=0.0173, **P=0.0035 compared with WT mice, n=5 to 6 mice/group. B, Skeletal muscle (gastrocnemius) was removed at time 0 and 30 minutes during the ITT. Fold increase in p‐AKT/AKT shows that while the WT muscles showed the expected increase in Akt phosphorylation, the Sirt3−/−‐Ucp2−/− muscle did not show any change. A representative immunoblot is shown along with the mean data. *P=0.0331 (t test) compared with WT mice, n=4 mice/group. C, A proposed mechanism of how a primary mitochondrial abnormality can explain the presence of PAH, vascular inflammation, and insulin resistance in human and mouse PAH (see Discussion). AAC indicates areas above the curves; AUC, areas under the curves; GTT, glucose tolerance test; HIF1α, hypoxia inducible factor 1α; ITT, insulin tolerance test; mROS, mitochondrial reactive oxygen species; NFATc2, nuclear factor of activated T cells C2; PAH, pulmonary arterial hypertension; PASMC, pulmonary artery smooth muscle cell; Sirt3, sirtuin3; SNPs: single nucleotide polymorphisms; Ucp2, uncoupling protein 2; and WT, wild type.
Discussion
Our work supports the metabolic theory of PAH, which suggests that mitochondrial suppression is central to the pathogenesis of PAH, and not secondary or downstream to other abnormalities described in PAH pathogenesis. 3 , 4 There are 2 important and novel findings in our work, discussed below.
First, we describe a somewhat unexpected high prevalence of loss‐of‐function SNPs in 2 genes encoding mitochondrial proteins in a small but well‐characterized prospective cohort of patients with PAH, in whom we collected blood at the time of their original assessment and we followed over the past 10 years. We found a provocative association between these SNPs and the severity of PAH or the presence of type 2 diabetes (a previously described feature of patients with PAH that remains unexplained 8 , 9 ) and outcomes (death or transplantation), which clearly needs to be prospectively studied in larger and independent studies, before it can be claimed to be either true or causal (Table; Figure 1B). Moreover, PAH affects more women than men, but the prognosis of male patients is worse than that of female patients. This is in keeping with our data since male patients with PAH have a higher SNP score than female patients. For example, 33% of male patients have an SNP score 2 to 3 compared with 23% in female patients, while 36% of female patients have an SNP score 0 compared with 23% of male patients; also, a higher SNP score correlates positively with PAH severity and outcomes (death and transplantation). However, the overall small sample size does not allow for any conclusive statements when it comes to outcomes, other that hypothesis generation.
The fact that all patients received the same protocol‐driven therapeutic approach, the absence of significant comorbidities upon entering the cohort, along with the fact that PAH therapies are not known to affect survival, 2 allow us to report this association with outcomes. Importantly, we previously showed that patients with PAH with a high SNP score for these 2 SNPs had more inhibited pyruvate dehydrogenase function and mitochondrial respiration than patients without SNPs, studied in lungs immediately after they were explanted at transplant surgery. 18 The SIRT3 SNP variant (rs11246020) that affects the enzyme's catalytic activity has been shown to decrease the enzymatic activity of Sirt3 in patient carriers. 16 Carriers of the UCP2 SNP (rs659366) that affects the promoter of the gene have a variant‐dependent decrease in UCP2 mRNA in the subcutaneous fat (ie, the SNP homozygotes have the lowest level, followed by the heterozygotes and the patients carrying both WT type alleles). 22 Yet another study showed that the carriers of the same SNP had increased levels of Ucp2 mRNA in the intra‐abdominal fat, suggesting that the regulation of Ucp2 is tissue dependent and may also be affected by additional factors. 33 In summary, although from our small sample size we cannot be certain that this association will stand when tested in other multicenter and larger cohorts, we believed it deserved mechanistic exploration in an animal model that mimics the loss of function of Sirt3 and Ucp2.
Second, we created a novel mouse model of PAH in which to explore our clinical data, and we found that it has more features of human PAH than in previously described rodent models. First, the severe PHT found in mice lacking both Sirt3 and Ucp2 is spontaneous, occurs at a young age, and leads to definitive objective features of RV failure (ie, increased RA pressure, decreased CO, dilatation of the RV, and a significant decrease in RV function) (studied in vivo with TAPSE) (Figure 2A). Second, after following the strict pathology criteria that have been described for these plexogenic lesions in both the rat Sugen/hypoxia model and humans, 15 , 34 we found these mice had frequent plexogenic lesions, even at the age of 2 months, before the establishment of hemodynamic evidence of PHT (at least at rest) (Figure 4 and Figure S6). There is no other mouse model that shows frequent and predictable plexogenic lesions. This finding may offer a potential answer to the question of whether the plexogenic lesions follow or precede the increase in PA pressures. If anything, existing models (ie, the Sugen/hypoxic rat model) had suggested that these lesions appear late in the disease when PHT is already severe 15 ; and human data (because of the lack of biopsies at earlier stages of the disease) cannot provide an answer. 14 Third, we found an increased infiltration of the pulmonary arterioles with CD4+ T cells (Figure S7). Recently, the role of inflammation in PAH has emerged as central to the pathogenesis of PAH. 6 , 27 The lack of these 2 mitochondrial proteins from T cells themselves is predicted to facilitate their activation, since inhibition of oxidative phosphorylation is both necessary and precedes T cell activation. 7 Thus, we cannot determine whether the increased infiltration of T cells in the pulmonary vessels of these mice is a result of signaling from the lung microenvironment or it reflects T cell activation in the bone marrow. On the other hand, considering the presence of these SNPs in patients, the same applies to patients having suppressed mitochondrial function throughout the body. Fourth, the insulin resistance found in the Sirt3−/− ‐Ucp2−/− without the addition of high‐fat diet (Figure 7A) mimics clinical PAH, where some patients have evidence of unexplained metabolic syndrome without being obese. A hypothesis that stems from our work is that the patients with insulin resistance and skeletal muscle mitochondrial suppression, reported previously by other groups, 8 , 9 may actually be patients with higher SNP scores for SIRT3 and UCP2 allelic SNPs. Sirt3 KO mice are predisposed to insulin resistance in keeping with our data. 16 Ucp2 KO mice are also predisposed to diabetes because they exhibit suppressed glucose‐induced insulin secretion 35 (although in our case we found insulin resistance and not diabetes relating to pancreas dysfunction), but this appears to depend on mice background. 36 Regardless of their background, the fact that severe PAH coexists with insulin resistance in the same animal with a global mitochondrial deficiency directly supports our clinical finding that the presence of these SNPs is associated with the presence of type 2 diabetes in patients with PAH. It also allows us to speculate that this association is potentially causal. In fact, the skeletal muscle from the offspring of patients with type 2 diabetes has insulin resistance because of an inherited defect in oxidative phosphorylation, 37 a finding similar to what is reported for the skeletal muscle of patients with PAH. 9
Another important aspect of our work is that, while in our patient cohort the correlation of SNP score with the severity of PAH (PVR, outcomes) was weak (but statistically significant), our mice showed a very strong and positive gene dose‐dependent relation between the loss of Sirt3/Ucp2 and the increase in PA pressure, as well as the worsening of RV failure (RV end‐diastolic diameter, RA pressure, CO, and TAPSE) and vascular remodeling (Figure 2A). This supports our clinical data showing a correlation between the SNP score and PVR. Our animal ethics committee did not allow us to perform death end‐point studies, but the degree of RV failure and the clinical signs of the Sirt3−/−‐Ucp2−/− and Sirt3−/−‐Ucp2+/− or Sirt3+/−‐Ucp2−/− mice (decreased activity/withdrawal, decreased appetite, and irritability) suggested a significant burden of disease requiring euthanasia. Thus, our mice data also support the association of these SNPs with outcomes (death or transplantation) in our clinical cohort.
Since mouse models of PAH have been criticized for the lack of important clinical features of human PAH (including the mild increase in PA pressures and the lack of plexogenic lesions), our new mouse PAH model may prove to be helpful in the field. Mice are far more useful in molecular and genetic studies than other animal models. In the future, our mice could be crossed with other KO or transgenic mice that lack genes that either worsen or protect from PAH, further improving our tools for the study of PAH, a disease that is clearly multifactorial.
Two‐month‐old Sirt3−/− ‐Ucp2−/− mice have plexogenic lesions but normal PA pressures. Therefore, it appears that even in the early phase of the disease (2‐month‐old), the lack of Ucp2 and Sirt3 still induces a hyperproliferative phenotype of PASMCs, pulmonary artery endothelial cells (PAECs), and fibroblasts, which are components of plexogenic lesion (we stained for both PASMCs and PAECs). The observed proliferation of PAECs may be a repair response to an initial loss/injury of PAEC, as some theories suggest for early PAH. Our data show, however, that at this very young age there is already evidence of proliferation throughout the vascular wall, although the possibility of increased loss of PAEC at an even earlier stage cannot be excluded. We have previously summarized in original publications and reviews the potential mechanisms that are downstream of mitochondrial suppression (both in PAH and cancer), which explain both the proliferation and anti‐apoptotic phenotype in PASMCs, including the mechanism of activation of critical transcription factors that have been shown to be activated in human and animal PAH 3 , 4 , 5 (Figure 7C). In addition to loss of Sirt3 and Ucp2, other factors have been shown to contribute to the mitochondrial suppression in PAH PASMCs, including endoplasmic reticulum stress, 24 , 25 or abnormalities in mitochondrial fission/fusion. 38 , 39 Our current work now further suggests that mitochondrial suppression is not only “permissive” for the development of PAH, as we have previously suggested in our metabolic theory of PAH, 3 , 4 , 5 but also may be actually causal, since these mice recapitulate many features of human PAH.
We also previously proposed that although mitochondrial abnormalities may be present throughout the body, the fact that the vascular phenotype is restricted to the lung vasculature may have to do with the fact that there are differences between pulmonary vascular mitochondria and systemic vascular mitochondria 40 (a fact that may also explain why hypoxic pulmonary vasoconstriction is a specific feature of the pulmonary and not systemic circulation), making cells in pulmonary microvessels more responsive earlier to mitochondrial abnormalities, than cells in systemic vessels. Although we did not study that in detail, we did not observe systemic vascular abnormalities, at least enough to affect left ventricular end‐diastolic pressure. This allowed us to “diagnose” PAH in these mice, but we cannot be certain that these mice would not develop systemic vascular diseases if they were to survive to grow older.
Since Sirt3 KO mice have also been shown to develop pulmonary fibrosis, 41 it is possible that our Sirt3−/−‐Ucp2−/− mice may develop worsening pulmonary fibrosis with age, although they did not have anatomic evidence of fibrosis or hypoxemia at the time that we studied them. If these mice were to develop pulmonary fibrosis with age (either directly or secondary to inflammation) they would still be relevant to the clinical associated PAH because of collagen vascular diseases such as scleroderma, which is characterized by pulmonary fibrosis in addition to PAH.
However, this study also has some limitations. First, the size of the PAH patient cohort is small, so we were not able to analyze the subgroups of SNP score 2 to 3 to show whether there are any differences between SIRT3 SNP and UCP2 SNP. Second, to support the human data, our mouse model used gene knockout (KO) rather than a mouse expressing the human SNP. This is extraordinarily difficult and even more difficult is to express 2 human SNPs. On the other hand, the double KO mice allowed us to also study the lack of genes in a variety of homozygote/heterozygote combinations, allowing us to assess “gene dose‐dependent” associations, which strengthen the causality aspect of our mechanism. Third, we cannot rule out primary effects of Ucp2 or Sirt3 loss on the RV myocardium. However, because the left ventricular size and function were not affected, this is somewhat unlikely. In addition, the mild RV enlargement and dysfunction that we noted in our young mice is not out of proportion with the degree of PAH that we measured.
In conclusion, our mouse model supports our provocative clinical data in our cohort and is directly relevant to a subgroup of patients with PAH carrying more than 1 loss‐of‐function SNPs in genes encoding mitochondrial proteins, particularly those that carry them in both alleles.
Sources of Funding
Zhang is supported by a graduate scholarship from the Li Ka Shing Sino‐Canadian Exchange Program. Lorenzana‐Carrillo is supported by the Government of Mexico CONACYT Scholarship for Doctoral Studies Abroad. Saleme is supported by a graduate scholarship from Alberta Innovates. Ussher is supported by a Canada Research Chair. Sutendra is supported by an Alberta Innovates Translational Health Chair in Cardio‐Oncology, and a National and Alberta New Investigator Award from Heart and Stroke Foundation of Canada. Michelakis is supported by a Canada Research Chair, and this work was supported by the Heart and Stroke Foundation of Canada, and Canadian Institutes of Health Research Foundation grants to Michelakis.
Disclosures
None.
Supporting information
Figures S1–S9
Supplementary Material for this article is available at https://www.ahajournals.org/doi/suppl/10.1161/JAHA.120.020451
For Sources of Funding and Disclosures, see page 16.
See Editorial by Lajoie et al.
References
- 1. Sutendra G, Michelakis ED. Pulmonary arterial hypertension: challenges in translational research and a vision for change. Sci Transl Med. 2013;5:208sr5. doi: 10.1126/scitranslmed.3005428 [DOI] [PubMed] [Google Scholar]
- 2. McLaughlin VV, Archer SL, Badesch DB, Barst RJ, Farber HW, Lindner JR, Mathier MA, McGoon MD, Park MH, Rosenson RS, et al. ACCF/AHA 2009 expert consensus document on pulmonary hypertension: a report of the American College of Cardiology Foundation Task Force on Expert Consensus Documents and the American Heart Association: developed in collaboration with the American College of Chest Physicians, American Thoracic Society Inc, and the Pulmonary Hypertension Association. Circulation. 2009;119:2250–2294. doi: 10.1161/CIRCULATIONAHA.109.192230 [DOI] [PubMed] [Google Scholar]
- 3. Paulin R, Michelakis ED. The metabolic theory of pulmonary arterial hypertension. Circ Res. 2014;115:148–164. doi: 10.1161/CIRCRESAHA.115.301130 [DOI] [PubMed] [Google Scholar]
- 4. Sutendra G, Michelakis ED. The metabolic basis of pulmonary arterial hypertension. Cell Metab. 2014;19:558–573. doi: 10.1016/j.cmet.2014.01.004 [DOI] [PubMed] [Google Scholar]
- 5. Dromparis P, Michelakis ED. Mitochondria in vascular health and disease. Annu Rev Physiol. 2013;75:95–126. doi: 10.1146/annurev-physiol-030212-183804 [DOI] [PubMed] [Google Scholar]
- 6. Rabinovitch M, Guignabert C, Humbert M, Nicolls MR. Inflammation and immunity in the pathogenesis of pulmonary arterial hypertension. Circ Res. 2014;115:165–175. doi: 10.1161/CIRCRESAHA.113.301141 [DOI] [PMC free article] [PubMed] [Google Scholar]
- 7. MacIver NJ, Michalek RD, Rathmell JC. Metabolic regulation of T lymphocytes. Annu Rev Immunol. 2013;31:259–283. doi: 10.1146/annurev-immunol-032712-095956 [DOI] [PMC free article] [PubMed] [Google Scholar]
- 8. Zamanian RT, Hansmann G, Snook S, Lilienfeld D, Rappaport KM, Reaven GM, Rabinovitch M, Doyle RL. Insulin resistance in pulmonary arterial hypertension. Eur Respir J. 2009;33:318–324. doi: 10.1183/09031936.00000508 [DOI] [PMC free article] [PubMed] [Google Scholar]
- 9. Malenfant S, Potus F, Fournier F, Breuils‐Bonnet S, Pflieger A, Bourassa S, Tremblay È, Nehmé B, Droit A, Bonnet S, et al. Skeletal muscle proteomic signature and metabolic impairment in pulmonary hypertension. J Mol Med (Berl). 2015;93:573–584. doi: 10.1007/s00109-014-1244-0 [DOI] [PubMed] [Google Scholar]
- 10. Enache I, Charles AL, Bouitbir J, Favret F, Zoll J, Metzger D, Oswald‐Mammosser M, Geny B, Charloux A. Skeletal muscle mitochondrial dysfunction precedes right ventricular impairment in experimental pulmonary hypertension. Mol Cell Biochem. 2013;373:161–170. doi: 10.1007/s11010-012-1485-6 [DOI] [PubMed] [Google Scholar]
- 11. Paulin R, Dromparis P, Sutendra G, Gurtu V, Zervopoulos S, Bowers L, Haromy A, Webster L, Provencher S, Bonnet S, et al. Sirtuin 3 deficiency is associated with inhibited mitochondrial function and pulmonary arterial hypertension in rodents and humans. Cell Metab. 2014;20:827–839. doi: 10.1016/j.cmet.2014.08.011 [DOI] [PubMed] [Google Scholar]
- 12. Dromparis P, Paulin R, Sutendra G, Qi AC, Bonnet S, Michelakis ED. Uncoupling protein 2 deficiency mimics the effects of hypoxia and endoplasmic reticulum stress on mitochondria and triggers pseudohypoxic pulmonary vascular remodeling and pulmonary hypertension. Circ Res. 2013;113:126–136. doi: 10.1161/CIRCRESAHA.112.300699 [DOI] [PubMed] [Google Scholar]
- 13. Pak O, Sommer N, Hoeres T, Bakr A, Waisbrod S, Sydykov A, Haag D, Esfandiary A, Kojonazarov B, Veit F, et al. Mitochondrial hyperpolarization in pulmonary vascular remodeling. Mitochondrial uncoupling protein deficiency as disease model. Am J Respir Cell Mol Biol. 2013;49:358–367. doi: 10.1165/rcmb.2012-0361OC [DOI] [PubMed] [Google Scholar]
- 14. Stacher E, Graham BB, Hunt JM, Gandjeva A, Groshong SD, McLaughlin VV, Jessup M, Grizzle WE, Aldred MA, Cool CD, et al. Modern age pathology of pulmonary arterial hypertension. Am J Respir Crit Care Med. 2012;186:261–272. doi: 10.1164/rccm.201201-0164OC [DOI] [PMC free article] [PubMed] [Google Scholar]
- 15. Abe K, Toba M, Alzoubi A, Ito M, Fagan KA, Cool CD, Voelkel NF, McMurtry IF, Oka M. Formation of plexiform lesions in experimental severe pulmonary arterial hypertension. Circulation. 2010;121:2747–2754. doi: 10.1161/CIRCULATIONAHA.109.927681 [DOI] [PubMed] [Google Scholar]
- 16. Hirschey M, Shimazu T, Jing E, Grueter C, Collins A, Aouizerat B, Stančáková A, Goetzman E, Lam M, Schwer B, et al. SIRT3 deficiency and mitochondrial protein hyperacetylation accelerate the development of the metabolic syndrome. Mol Cell. 2011;44:177–190. doi: 10.1016/j.molcel.2011.07.019 [DOI] [PMC free article] [PubMed] [Google Scholar]
- 17. Trenker M, Malli R, Fertschai I, Levak‐Frank S, Graier WF. Uncoupling proteins 2 and 3 are fundamental for mitochondrial Ca2+ uniport. Nat Cell Biol. 2007;9:445–452. doi: 10.1038/ncb1556 [DOI] [PMC free article] [PubMed] [Google Scholar]
- 18. Michelakis ED, Gurtu V, Webster L, Barnes G, Watson G, Howard L, Cupitt J, Paterson I, Thompson RB, Chow K, et al. Inhibition of pyruvate dehydrogenase kinase improves pulmonary arterial hypertension in genetically susceptible patients. Sci Transl Med. 2017;9:eaao4583. doi: 10.1126/scitranslmed.aao4583 [DOI] [PubMed] [Google Scholar]
- 19. D'Adamo M, Perego L, Cardellini M, Marini MA, Frontoni S, Andreozzi F, Sciacqua A, Lauro D, Sbraccia P, Federici M, et al. The ‐866A/A genotype in the promoter of the human uncoupling protein 2 gene is associated with insulin resistance and increased risk of type 2 diabetes. Diabetes. 2004;53:1905–1910. doi: 10.2337/diabetes.53.7.1905 [DOI] [PubMed] [Google Scholar]
- 20. Dalgaard LT. Genetic variance in uncoupling protein 2 in relation to obesity, type 2 diabetes, and related metabolic traits: focus on the functional ‐866G>A promoter variant (rs659366). J Obes. 2011;2011:340241. doi: 10.1155/2011/340241 [DOI] [PMC free article] [PubMed] [Google Scholar]
- 21. Sesti G, Cardellini M, Marini MA, Frontoni S, D'Adamo M, Del Guerra S, Lauro D, De Nicolais P, Sbraccia P, Del Prato S, et al. A common polymorphism in the promoter of UCP2 contributes to the variation in insulin secretion in glucose‐tolerant subjects. Diabetes. 2003;52:1280–1283. doi: 10.2337/diabetes.52.5.1280 [DOI] [PubMed] [Google Scholar]
- 22. Wang H, Chu WS, Lu T, Hasstedt SJ, Kern PA, Elbein SC. Uncoupling protein‐2 polymorphisms in type 2 diabetes, obesity, and insulin secretion. Am J Physiol Endocrinol Metab. 2004;286:E1–E7. doi: 10.1152/ajpendo.00231.2003 [DOI] [PubMed] [Google Scholar]
- 23. Sutendra G, Kinnaird A, Dromparis P, Paulin R, Stenson TH, Haromy A, Hashimoto K, Zhang N, Flaim E, Michelakis ED. A nuclear pyruvate dehydrogenase complex is important for the generation of acetyl‐CoA and histone acetylation. Cell. 2014;158:84–97. doi: 10.1016/j.cell.2014.04.046 [DOI] [PubMed] [Google Scholar]
- 24. Dromparis P, Paulin R, Stenson TH, Haromy A, Sutendra G, Michelakis ED. Attenuating endoplasmic reticulum stress as a novel therapeutic strategy in pulmonary hypertension. Circulation. 2013;127:115–125. doi: 10.1161/CIRCULATIONAHA.112.133413 [DOI] [PubMed] [Google Scholar]
- 25. Sutendra G, Dromparis P, Wright P, Bonnet S, Haromy A, Hao Z, McMurtry MS, Michalak M, Vance JE, Sessa WC, et al. The role of Nogo and the mitochondria‐endoplasmic reticulum unit in pulmonary hypertension. Sci Transl Med. 2011;3:88ra55. doi: 10.1126/scitranslmed.3002194 [DOI] [PMC free article] [PubMed] [Google Scholar]
- 26. Al Batran R, Gopal K, Capozzi ME, Chahade JJ, Saleme B, Tabatabaei‐Dakhili SA, Greenwell AA, Niu J, Almutairi M, Byrne NJ, et al. Pimozide alleviates hyperglycemia in diet‐induced obesity by inhibiting skeletal muscle ketone oxidation. Cell Metab. 2020;31:909–919.e8. doi: 10.1016/j.cmet.2020.03.017 [DOI] [PubMed] [Google Scholar]
- 27. Qiu H, He Y, Ouyang F, Jiang P, Guo S, Guo Y. The role of regulatory T cells in pulmonary arterial hypertension. J Am Heart Assoc. 2019;8:e014201. doi: 10.1161/JAHA.119.014201 [DOI] [PMC free article] [PubMed] [Google Scholar]
- 28. Tamosiuniene R, Tian W, Dhillon G, Wang L, Sung YK, Gera L, Patterson AJ, Agrawal R, Rabinovitch M, Ambler K, et al. Regulatory T cells limit vascular endothelial injury and prevent pulmonary hypertension. Circ Res. 2011;109:867–879. doi: 10.1161/CIRCRESAHA.110.236927 [DOI] [PMC free article] [PubMed] [Google Scholar]
- 29. McMurtry MS, Archer SL, Altieri DC, Bonnet S, Haromy A, Harry G, Puttagunta L, Michelakis ED. Gene therapy targeting survivin selectively induces pulmonary vascular apoptosis and reverses pulmonary arterial hypertension. J Clin Invest. 2005;115:1479–1491. doi: 10.1172/JCI23203 [DOI] [PMC free article] [PubMed] [Google Scholar]
- 30. Bonnet S, Michelakis ED, Porter CJ, Andrade‐Navarro MA, Thebaud B, Bonnet S, Haromy A, Harry G, Moudgil R, McMurtry MS, et al. An abnormal mitochondrial‐hypoxia inducible factor‐1alpha‐Kv channel pathway disrupts oxygen sensing and triggers pulmonary arterial hypertension in fawn hooded rats: similarities to human pulmonary arterial hypertension. Circulation. 2006;113:2630–2641. doi: 10.1161/CIRCULATIONAHA.105.609008 [DOI] [PubMed] [Google Scholar]
- 31. Michelakis ED, Sutendra G, Dromparis P, Webster L, Haromy A, Niven E, Maguire C, Gammer TL, Mackey JR, Fulton D, et al. Metabolic modulation of glioblastoma with dichloroacetate. Sci Transl Med. 2010;2:31ra34. doi: 10.1126/scitranslmed.3000677 [DOI] [PubMed] [Google Scholar]
- 32. Virtue S, Vidal‐Puig A. GTTs and ITTs in mice: simple tests, complex answers. Nat Metab. 2021. doi: 10.1038/s42255-021-00414-7 [DOI] [PubMed] [Google Scholar]
- 33. Esterbauer H, Schneitler C, Oberkofler H, Ebenbichler C, Paulweber B, Sandhofer F, Ladurner G, Hell E, Strosberg AD, Patsch JR, et al. A common polymorphism in the promoter of UCP2 is associated with decreased risk of obesity in middle‐aged humans. Nat Genet. 2001;28:178–183. doi: 10.1038/88911 [DOI] [PubMed] [Google Scholar]
- 34. Pietra GG, Capron F, Stewart S, Leone O, Humbert M, Robbins IM, Reid LM, Tuder RM. Pathologic assessment of vasculopathies in pulmonary hypertension. J Am Coll Cardiol. 2004;43:25S–32S. doi: 10.1016/j.jacc.2004.02.033 [DOI] [PubMed] [Google Scholar]
- 35. Pi J, Bai Y, Daniel KW, Liu D, Lyght O, Edelstein D, Brownlee M, Corkey BE, Collins S. Persistent oxidative stress due to absence of uncoupling protein 2 associated with impaired pancreatic beta‐cell function. Endocrinology. 2009;150:3040–3048. 10.1210/en.2008-1642 [DOI] [PMC free article] [PubMed] [Google Scholar]
- 36. Zhang CY, Baffy G, Perret P, Krauss S, Peroni O, Grujic D, Hagen T, Vidal‐Puig AJ, Boss O, Kim YB, et al. Uncoupling protein‐2 negatively regulates insulin secretion and is a major link between obesity, beta cell dysfunction, and type 2 diabetes. Cell. 2001;105:745–755 [DOI] [PubMed] [Google Scholar]
- 37. Petersen KF, Dufour S, Befroy D, Garcia R, Shulman GI. Impaired mitochondrial activity in the insulin‐resistant offspring of patients with type 2 diabetes. N Engl J Med. 2004;350:664–671. doi: 10.1056/NEJMoa031314 [DOI] [PMC free article] [PubMed] [Google Scholar]
- 38. Ryan JJ, Marsboom G, Fang YH, Toth PT, Morrow E, Luo N, Piao L, Hong Z, Ericson K, Zhang HJ, et al. PGC1alpha‐mediated mitofusin‐2 deficiency in female rats and humans with pulmonary arterial hypertension. Am J Respir Crit Care Med. 2013;187:865–878 [DOI] [PMC free article] [PubMed] [Google Scholar]
- 39. Archer SL. Mitochondrial dynamics–mitochondrial fission and fusion in human diseases. N Engl J Med. 2013;369:2236–2251. doi: 10.1056/NEJMra1215233 [DOI] [PubMed] [Google Scholar]
- 40. Michelakis ED, Hampl V, Nsair A, Wu X, Harry G, Haromy A, Gurtu R, Archer SL. Diversity in mitochondrial function explains differences in vascular oxygen sensing. Circ Res. 2002;90:1307–1315. doi: 10.1161/01.RES.0000024689.07590.C2 [DOI] [PubMed] [Google Scholar]
- 41. Jablonski RP, Kim S‐J, Cheresh P, Williams DB, Morales‐Nebreda L, Cheng Y, Yeldandi A, Bhorade S, Pardo A, Selman M, et al. SIRT3 deficiency promotes lung fibrosis by augmenting alveolar epithelial cell mitochondrial DNA damage and apoptosis. FASEB J. 2017;31:2520–2532. doi: 10.1096/fj.201601077R [DOI] [PMC free article] [PubMed] [Google Scholar]
Associated Data
This section collects any data citations, data availability statements, or supplementary materials included in this article.
Supplementary Materials
Figures S1–S9