Abstract
L1CAM is a transmembrane protein expressed on neurons that was presumed to be found on neuron-derived extracellular vesicles (NDEVs) in human biofluids. We developed a panel of single-molecule array assays to evaluate the use of L1CAM for NDEV isolation. We demonstrate that L1CAM is not associated with extracellular vesicles in human plasma or cerebrospinal fluid and therefore recommend against its use as a marker in NDEV isolation protocols.
Efforts to understand how the human brain functions are hampered partly due to the inability to perform brain biopsies on living individuals. Our current understanding of brain diseases relies mainly upon postmortem tissue analysis after neurodegeneration and cell death have already occurred. Therefore, fundamental questions about underlying biochemical processes of neurological and psychiatric disease still remain. Having access to proteomic and transcriptomic profiles of neurons and other brain cells in living human individuals would be an asset to our understanding of neuroscience.
One approach to learning about the living brain is to analyze extracellular vesicles (EVs). EVs, which are released from many cell types and are found in all biofluids, contain proteins and RNA from their cell of origin1. There has been excitement about capturing EVs released from neurons and characterizing their contents as a window into neurological processes. Over the past several years, a large number of studies have reported the immunocapture of putatively NDEVs and subsequent measurement of proteins and RNA implicated in neurodegenerative and psychiatric diseases. Almost all of these studies used the transmembrane protein L1CAM, a cell adhesion molecule implicated in neural development2, as a handle for EV capture (Supplementary Note 1). The choice of L1CAM was based on its known expression in neurons, its presence in plasma and the availability of high-affinity antibodies.
However, L1CAM may not be a good marker for NDEVs. First, L1CAM is expressed widely outside the brain, including on non-neuronal cells3. Furthermore, L1CAM exists in soluble forms3. It is therefore not safe to assume that L1CAM present in extracellular fluids is associated with vesicles; rather, this assumption must be validated. Currently, researchers who report protein measurements inside L1CAM-expressing EVs use antibodies to the L1CAM ectodomain. However, if L1CAM is cleaved or alternatively spliced in the cerebrospinal fluid (CSF) and plasma, then it is possible that soluble L1CAM is being captured rather than EVs. Here we develop both a framework and the necessary tools for evaluating whether a given protein is a good candidate for NDEV pulldown.
Because both cleaved and alternatively spliced forms of L1CAM exist, we evaluated whether L1CAM in biofluids is soluble or associated with EVs3. We fractionated plasma and CSF using size exclusion chromatography (SEC) and density gradient centrifugation (DGC) to separate EVs from soluble proteins. We hypothesized that, if L1CAM were predominantly associated with EVs, it would elute along with EV markers such as tetraspanins CD9, CD63 and CD81 (ref. 1). Alternatively, if L1CAM were predominantly a soluble protein, it would elute along with soluble proteins such as albumin (Fig. 1a). We first demonstrated that, when we subjected EVs isolated from conditioned medium of human induced pluripotent cell-derived neurons, L1CAM eluted in earlier fractions of SEC but a recombinant soluble L1CAM protein eluted in later fractions (Fig. 1b). Although there was some overlap at the tails, these distributions were distinct; and thus we can use these results to define which SEC fractions contain vesicle-associated proteins and which fractions contain soluble proteins.
Fig. 1 |. Method for evaluating whether L1CAM is soluble or associated with EVs in biofluids.
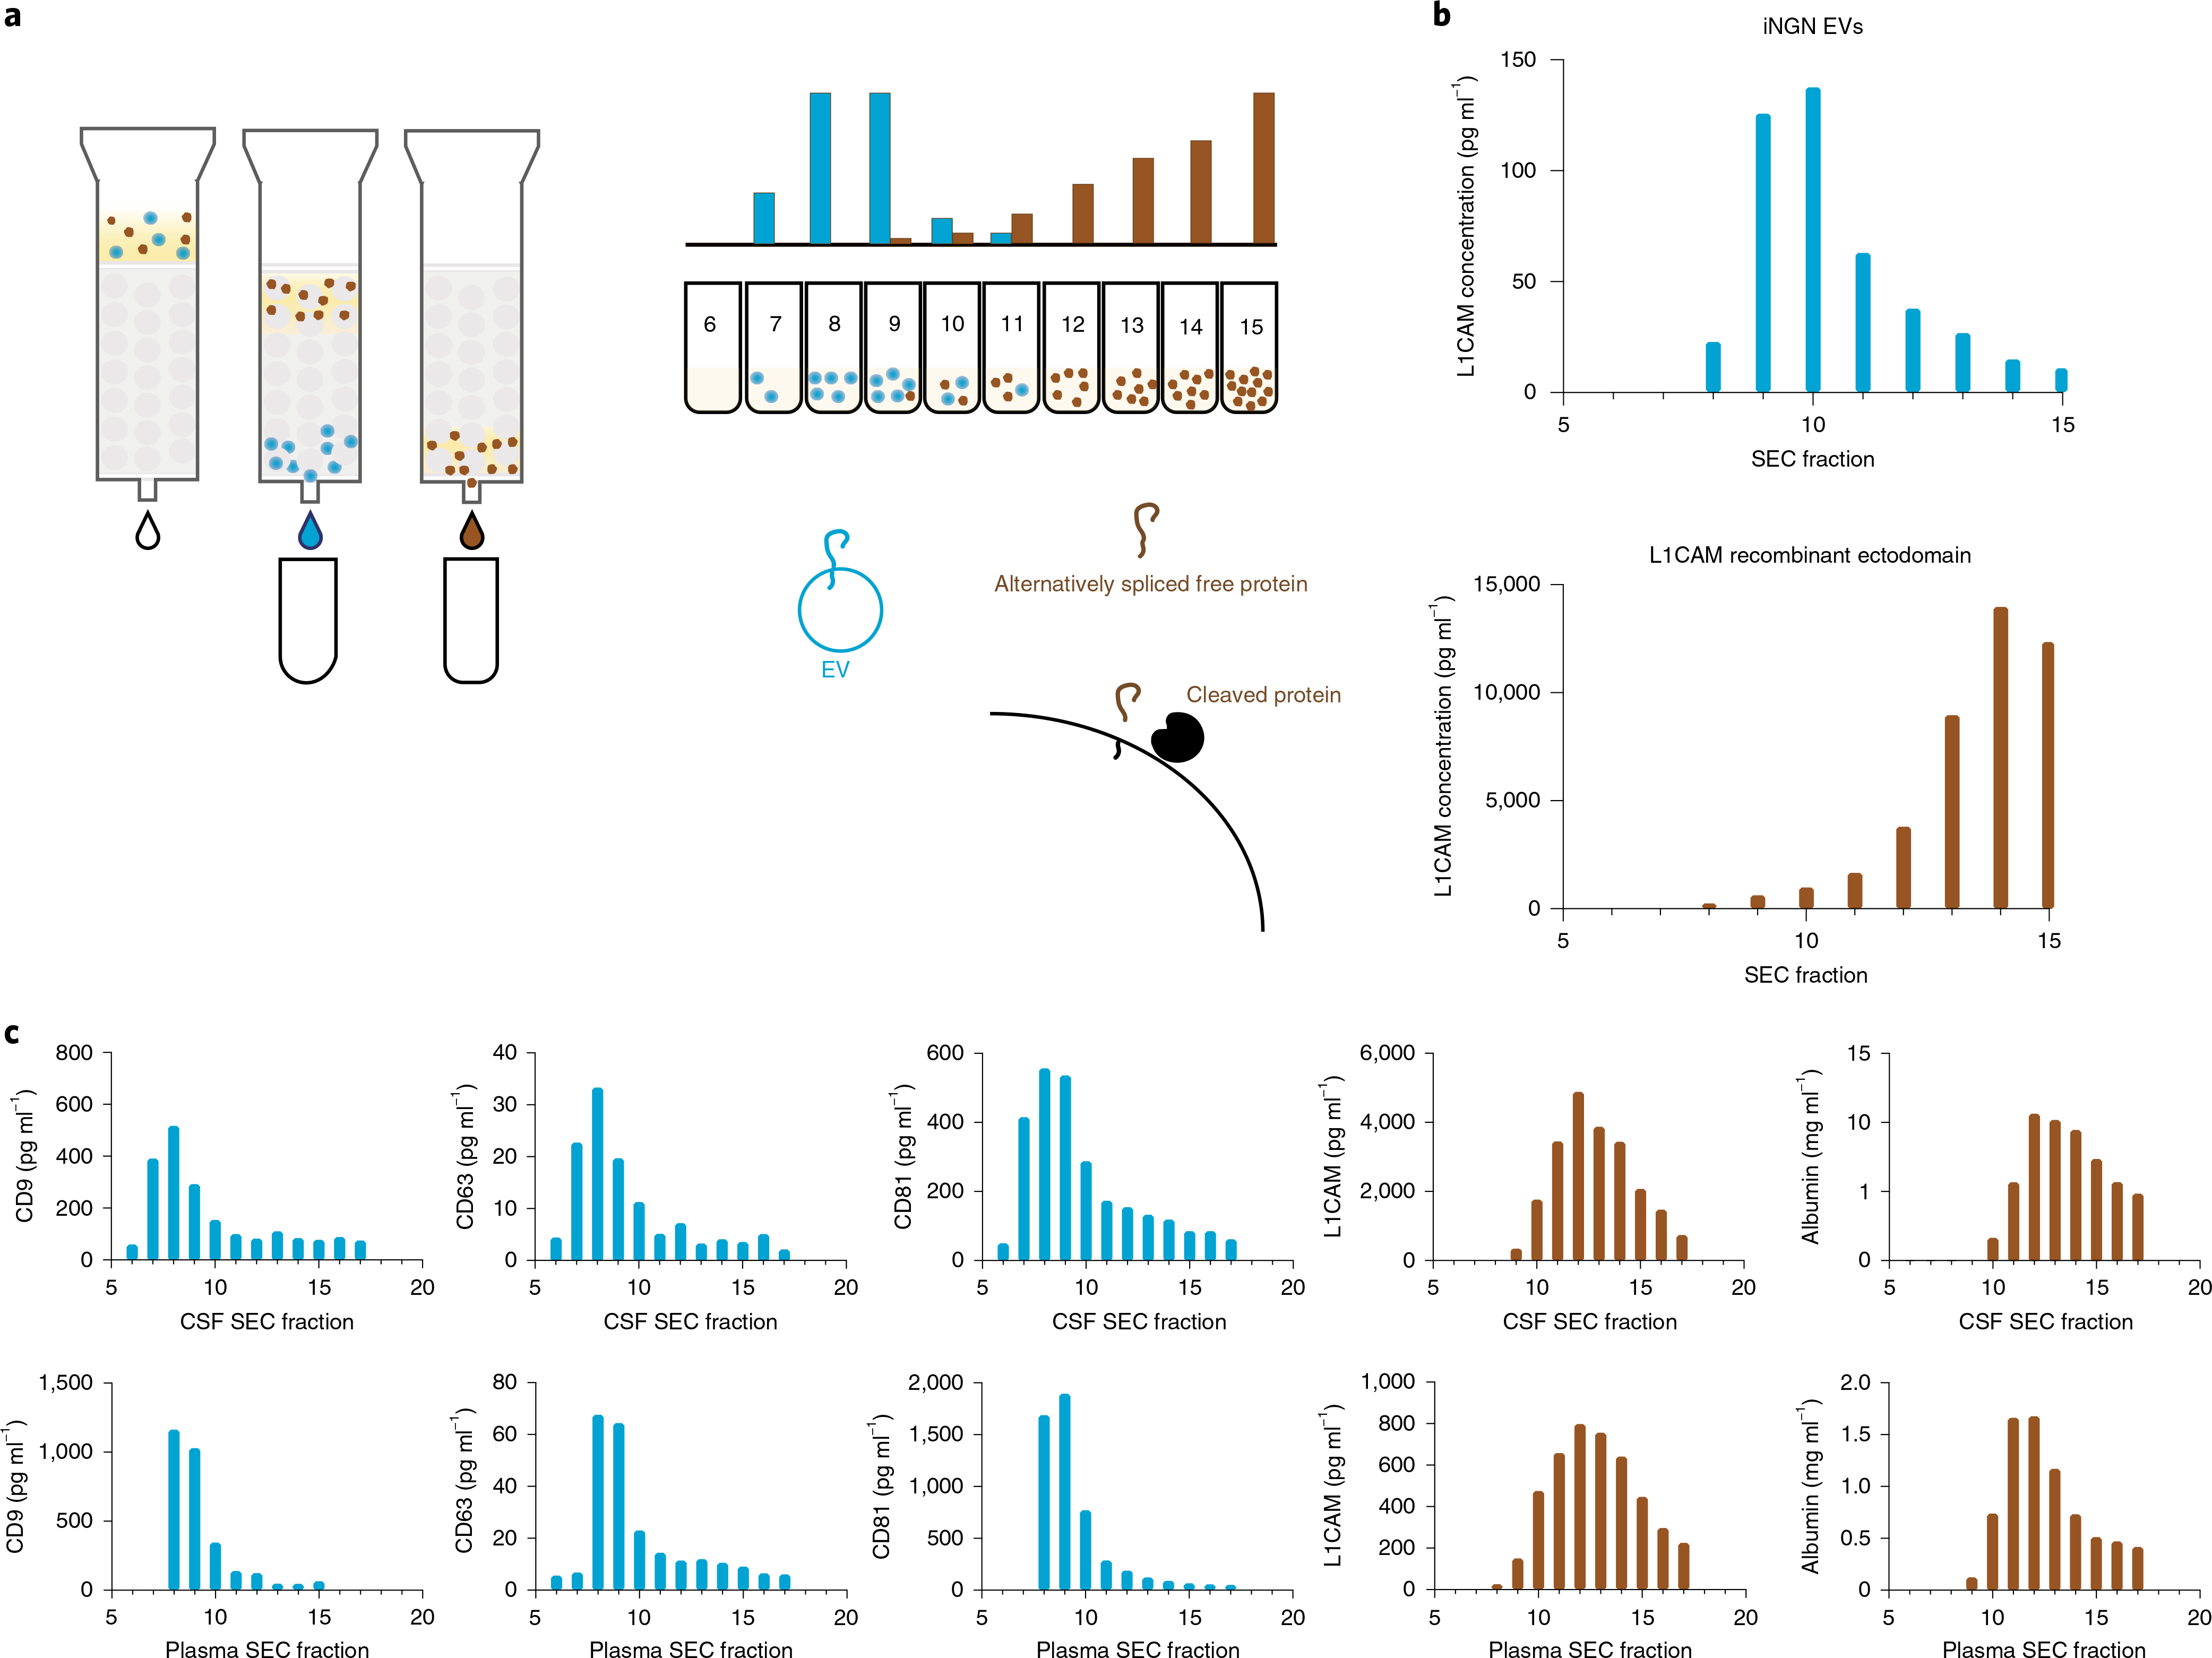
a, Schematic overview of an SEC experiment for evaluating whether L1CAM is associated with EVs. b, L1CAM concentration in SEC fractions after fractionation of EVs derived from iNGN cells expressing L1CAM (top) and after fractionation of soluble recombinant L1CAM protein (bottom). Data represent a single experiment in which two technical replicates were averaged. This experiment was conducted once. c, Simoa quantification of CD9, CD63, CD81, albumin and L1CAM levels in Sepharose 6B 10-ml SEC fractions of CSF (top) and plasma (bottom). Data represent a single experiment in which a single pooled sample was used, and two technical replicates were averaged. This experiment was conducted six times with biofluid samples from different sources, and the results were consistent.
Next, we investigated EVs in human CSF and plasma. To demonstrate that early SEC fractions (fractions 7–10) of these biofluids contained intact EVs, we performed proteinase protection assays (for programmed cell death 6-interacting protein ALIX, reported to be in the lumen of EVs) on these fractions and identified EVs by electron microscopy (Extended Data Figs. 1 and 2). Because EVs are present at low concentrations only in fractionated CSF and plasma, we used Simoa technology4 to establish high-sensitivity assays for EV markers (CD9, CD63 and CD81) as well as for L1CAM and albumin (Supplementary Figs. 1 and 2 and Supplementary Table 1).
To evaluate whether L1CAM is associated with EVs or behaves as a soluble protein, we used two complementary techniques, SEC and DGC5. When we fractionated CSF and plasma by SEC, we primarily detected tetraspanins in fractions 7–9, while L1CAM was present with a distribution similar to that of albumin in fractions 11–14 (Fig. 1c). When we fractionated CSF and plasma by DGC, we observed the same pattern, with tetraspanins eluting in different fractions than L1CAM and albumin: in CSF, tetraspanins eluted in fractions 5–10, while albumin and L1CAM eluted in fractions 1–5 (Fig. 2a). In plasma, tetraspanins eluted in fractions 7–11, while L1CAM, like albumin, eluted in fractions 1–6 (Fig. 2a). Thus, in both fractionation methods, L1CAM in the human biofluids that we analyzed behaves as a soluble protein, not as an EV-associated protein.
Fig. 2 |. DGC of CSF and plasma and analysis of L1CAM isoforms.
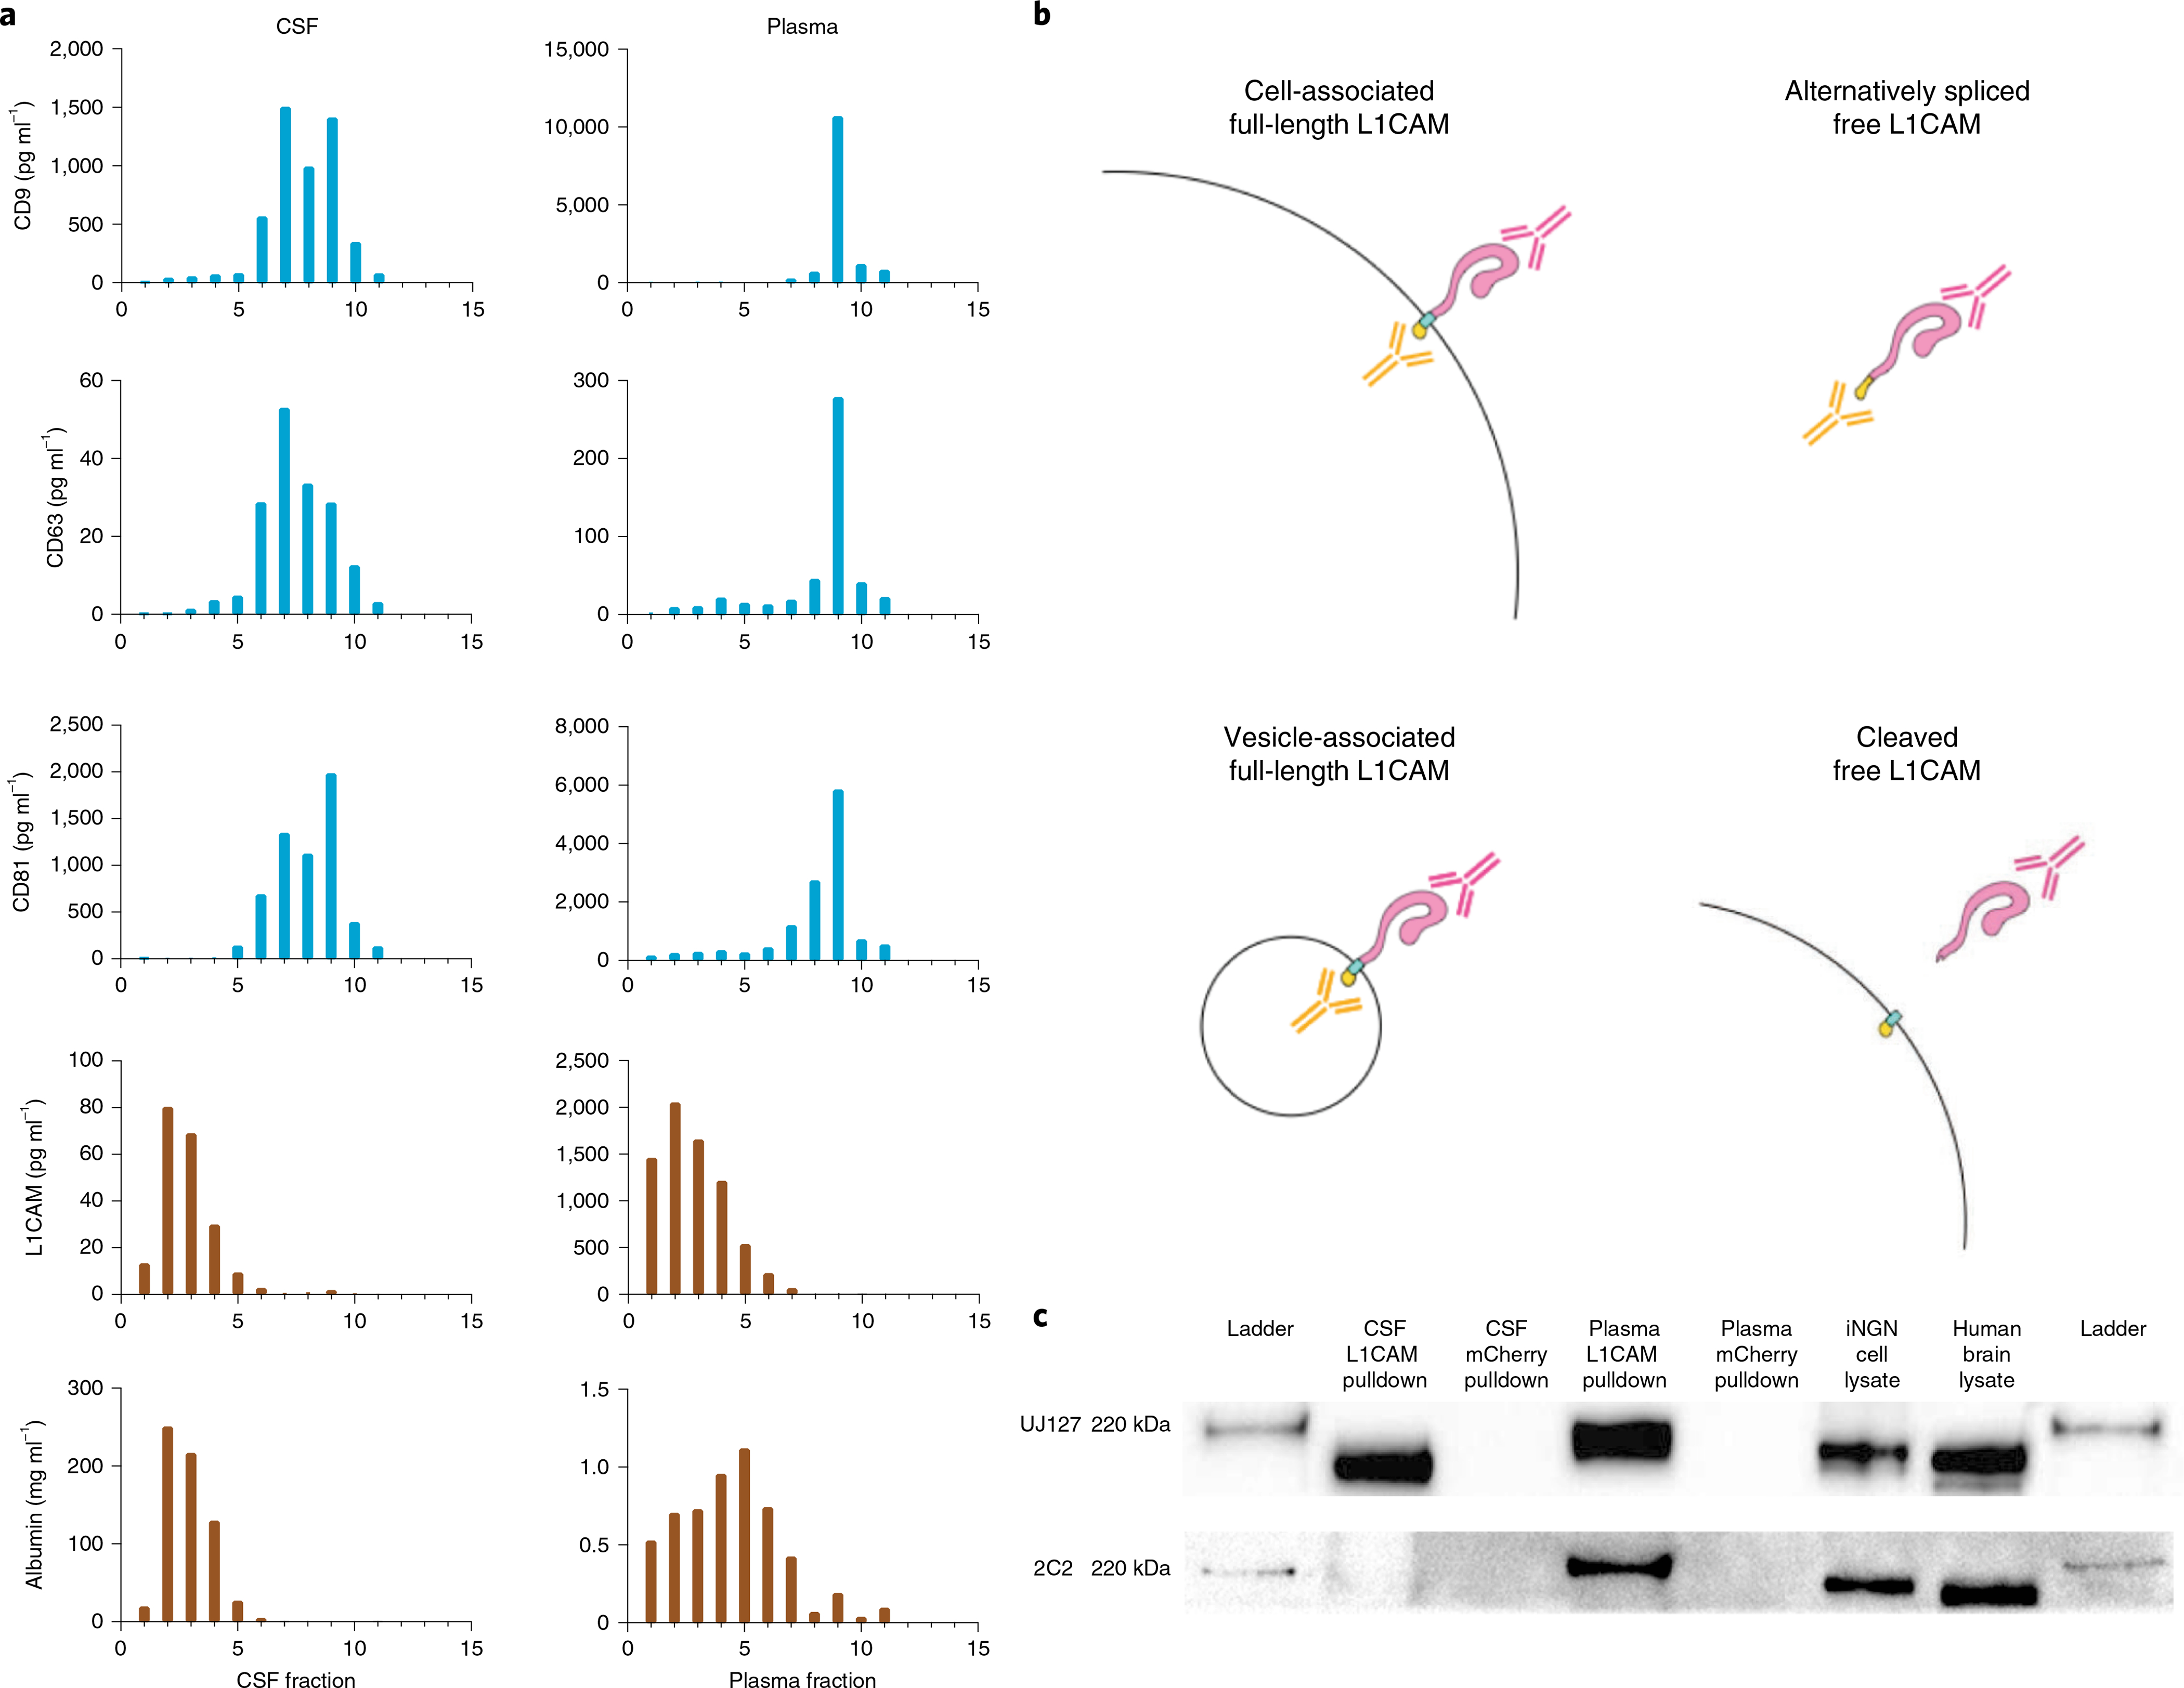
a, Simoa quantification of CD9, CD63, CD81, albumin and L1CAM levels in DGC fractions of CSF (left) and plasma (right). The density of fractions 1–11 were as follows in units of g ml−1: 1.012, 1.028, 1.045, 1.056, 1.065, 1.076, 1.097, 1.113, 1.138, 1.193 and 1.219. Data represent a single experiment in which a single pooled sample was used, and two technical replicates were averaged. This experiment was conducted twice with similar results. b, Schematic representation of putative L1CAM isoforms present in the human body. c, Western blotting of L1CAM immunocaptured in CSF and plasma using an antibody to the external domain of L1CAM (clone EPR23241-224). Staining was performed with one antibody to an external domain (clone UJ127) or one antibody to an internal domain (clone 2C2). This experiment was conducted twice with similar results.
Next, we investigated which isoforms of L1CAM could be detected in CSF and plasma. We hypothesized that the L1CAM ectodomain may be present as a soluble protein either because L1CAM present on cells may be cleaved by proteases such as ADAM10 or plasmin6,7 or because an isoform of L1CAM lacking a transmembrane domain may be produced by alternative splicing3. We expected that proteolytic cleavage of L1CAM would produce a molecule containing the extracellular domain but not its intracellular domain (Fig. 2b), while alternative splicing excluding specifically the transmembrane domain would produce a molecule containing both extracellular and intracellular domains as part of a soluble protein.
In pulldown experiments followed by western blotting, L1CAM immunocaptured from CSF presented as an approximately 200-kDa protein, which was recognized in a western blot only with an antibody specific to the external domain but not with an antibody specific to the internal domain. Conversely, L1CAM immunocaptured from plasma appeared as an approximately 220-kDa protein and could be detected in a western blot with both internal-domain- and external-domain-specific antibodies (Fig. 2c). Additionally, using mass spectrometry, we detected a peptide matching the cytoplasmic portion of L1CAM in plasma (Extended Data Fig. 3). Although we could not conclude conclusively whether soluble L1CAM is cleaved, alternatively spliced or both, our mass spectrometry and western blot results suggest that some proportion of soluble L1CAM in plasma is alternatively spliced to exclude the exon encoding the transmembrane domain3,6,7.
Sequence coding for the transmembrane domain of L1CAM is contained entirely in exon 25 (Extended Data Fig. 4). Skipping this exon leads to production of an L1CAM protein containing an endoplasmic reticulum signal sequence but no domain for retention in the plasma membrane; thus the protein is likely secreted into the extracellular medium. Expressed sequence tags provide support for the skipping of exon 25 in human endothelial cell lines3. We analyzed Genotype–Tissue Expression RNA-seq data across diverse human organs to investigate the L1CAM splicing status in other tissues8. Although the junction reads supporting inclusion of exon 25 generally outnumbered those supporting skipping, we did observe reads traversing the junction from exon 24 directly to exon 26 in a number of tissues, including the tibial artery (Extended Data Fig. 5). These reads in the tibial artery and other organs support the existence of an L1CAM isoform lacking its transmembrane domain (Extended Data Fig. 5 and Supplementary Table 2).
Finally, we sought to understand why prior publications had reported increased levels of cargo proteins such as α-synuclein in their EV samples isolated by capture with an anti-L1CAM antibody. We hypothesized that this may be caused by nonspecific binding of soluble α-synuclein in plasma to the anti-L1CAM antibody. To test this hypothesis, we performed an L1CAM-immunocapture experiment with the anti-L1CAM antibody used in prior studies and nonspecific mouse IgG control antibodies, but we performed the isolation on recombinant α-synuclein instead of on plasma9. In a Simoa assay, we found that three times more recombinant α-synuclein bound to the anti-L1CAM antibody than to the mouse IgG control (Extended Data Fig. 6), matching the enrichment of α-synuclein observed in prior work. This suggests that anti-L1CAM antibody-based EV immunocapture may be afflicted by nonspecific binding of soluble proteins to capture antibodies, highlighting the importance of performing rigorous controls to exclude this possibility.
In summary, we demonstrated that L1CAM is not associated with EVs in human CSF or plasma. Importantly, our work closely follows the minimal information for studies of extracellular vesicles 2018 guidelines to ensure proper characterization of EVs and reporting of experimental details10. Although L1CAM is canonically a surface protein in neurons, we conclude that the main forms of L1CAM in plasma and CSF are soluble, possibly generated by proteolytic cleavage or alternative splicing. These findings indicate that alternative NDEV markers are needed. We believe that the approach present herein to investigate L1CAM can be used to validate other putative cell-type-specific EV markers not only for NDEV immunocapture but also for immunocapture of EVs from other cell types. Despite our result for L1CAM, we remain optimistic regarding the potential for EVs to provide a window into the brain in accessible biofluids such as plasma11,12 and are currently searching for other markers to isolate bona fide NDEVs from the brain.
Methods
This work was not considered human research and was approved by the Partners IRB and the Harvard University IRB. Biosafety protocols were in compliance with regulations of the Wyss Institute and Brigham and Women’s Hospital.
Human sample handling.
Pre-aliquoted human plasma and CSF samples were ordered from BioIVT. For spike-and-recovery and dilution linearity experiments, individual CSF and plasma from BioIVT were used. For all other experiments, pooled CSF and plasma were used. Plasma or CSF was thawed at room temperature. Immediately after the sample had thawed, 100× Protease/ Phosphatase Inhibitor Cocktail (Cell Signaling Technology) was added at a final concentration of 1× to the sample. The sample was then centrifuged at 2,000g for 10 min. Next, the supernatant was centrifuged through a 0.45-μm Corning Costar Spin-X centrifuge tube filter (Sigma-Aldrich) at 2,000g for 10 min to eliminate any remaining cells or cell debris.
Simoa assays.
Simoa assays were performed according to the manufacturer’s instructions. Candidate capture antibodies were coupled to carboxylated paramagnetic beads from the Simoa Homebrew Assay Development kit (Quanterix) using EDC chemistry (Thermo Fisher Scientific). Candidate detection antibodies were conjugated to biotin using EZ-Link NHS-PEG4-Biotin (Thermo Fisher Scientific). Reagents were cross-tested for signal against the following recombinant proteins for CD9, CD63, CD81, L1CAM and albumin: ab152262 (Abcam), TP301733 (OriGene), CD81 OriGene TP317508 (OriGene), TP311601 (OriGene) and ab201876 (Abcam) on a Simoa HD-X Analyzer (Quanterix). The antibody pairs that gave the highest signal-to-background ratio were further validated by two means: first, plasma and CSF were serially diluted in sample buffer to demonstrate endogenous dilution linearity (Extended Data Fig. 3). Sample buffers used for each assay were as follows: CD9 (30% Quanterix Neuroplex 3A diluent and 70% Quanterix Sample and Detector Diluent), CD63 (Quanterix Diluent E), CD81 (Quanterix Diluent E), L1CAM (Quanterix Sample and Detector Diluent) and albumin (Quanterix Sample and Detector Diluent). Next, the recombinant protein used in the calibration curve was added to diluted plasma and CSF, using the respective assay diluent, at two different concentrations to determine whether spike and recovery was within 70–130% (Supplementary Table 1).
For CD9, CD63, CD81 and L1CAM assays, samples were incubated with immunocapture beads (25 μl) and biotinylated detection antibody (20 μl) for 35 min. Next, six washes were performed using System Wash Buffer 1 (Quanterix), and beads were resuspended in 100 μl streptavidin-labeled β-galactosidase (Quanterix) and incubated for 5 min. The concentrations of streptavidin-labeled β-galactosidase used for each assay were as follows: CD9 (120 pM), CD63 (120 pM), CD81 (150 pM), L1CAM (150 pM) and albumin (10 pM). An additional six washes were performed, and beads were resuspended in 25 μl resorufin β-d-galactopyranoside (Quanterix) before being loaded into the microwell array.
For the albumin assay, samples were incubated first with immunocapture beads (25 μl) for 15 min and then washed six times. Subsequently, 100 μl detection antibody was incubated with the beads for 5 min. Next, six washes were performed, and beads were resuspended in 100 μl streptavidin-labeled β-galactosidase (Quanterix) for a final 5-min incubation. An additional six washes were performed, and the beads were resuspended in 25 μl resorufin β-d-galactopyranoside (Quanterix) before being loaded into the microwell array.
Data collection was conducted using Excel version 16.47.1, while analysis and graphing were conducted using Prism version 8.4.3.
Plate-based enzyme-linked immunosorbent assay.
Simoa assays were transferred to a plate-based ELISA for comparison. Capture antibody was diluted in ELISA Coating Buffer (BioLegend) at a concentration of 4 μg ml−1, and a volume of 100 μl was coated per well on a Nunc MaxiSorp ELISA plate (BioLegend). Plates were incubated with capture antibody overnight at 4°C. Subsequently, the plate was washed three times with 200 μl PBST (0.5 ml Tween-20 in 1 l PBS). Sample was added to each well and incubated at room temperature for 3 h. The plate was again washed three times with 200 μl PBST. The corresponding detection antibody (100 μl) was added to the plate, which was left to incubate for 1 h. The detection antibody was then removed, and the plate was washed three times with 200 μl PBST. Streptavidin-labeled β-galactosidase (100 μl) from the Simoa Homebrew Assay Development kit (Quanterix) was then added, and the plate was incubated for 30 min. The plate was then washed five times with 200 μl PBST and incubated with 100 μl resorufin β-d-galactopyranoside, also from the Simoa Homebrew Assay Development kit (Quanterix), for 20 min in the dark. Plates were then imaged with a Tecan plate reader using Magellan version 7.2 software at excitation and emission wavelengths of 555 nm and 605 nm, respectively.
Preparation of custom size exclusion chromatography columns.
Sepharose CL-6B resin (GE Healthcare) was washed with PBS. Briefly, a volume of resin was washed with an equal volume of PBS in a glass jar and then placed at 4°C to let the resin settle completely (several hours or overnight). PBS was then poured off, and new PBS was again added for a total of three washes. Columns were prepared fresh on the day of use. Washed resin was poured into an Econo-Pac Chromatography column (Bio-Rad) to obtain a 10-ml bed volume. The column was allowed to drip out until the column was solid, at which time the top frit was placed securely at the top of the resin but without compression. PBS was then added at 1 ml above the frit until the sample was ready to be added.
Collection of size exclusion chromatography fractions.
Once prepared, all columns were washed with at least 20 ml PBS in the column. When the sample was ready to be loaded, the column was allowed to fully drip out, and, after last drop, plasma or CSF was added to the column. Immediately thereafter, 0.5-ml fractions were collected. As soon as the plasma or CSF completely passed through the frit, PBS was added to the top of the column 1 ml at a time. For plasma and CSF, fractions 6–19 were collected, while, for iNGN, fractions 6–15 were collected. For the comparison of Simoa, ELISA and western blot, one 0.5-ml sample was fractionated by SEC using an Izon qEVoriginal 35-nm column into 0.5-ml fractions (fractions 6–15). Each of the fractions was then divided evenly for use in the three techniques.
Western blotting.
Western blot.
For Extended Data Fig. 4, equal volumes of each SEC fraction were loaded on a Bolt 4–12% Bis-Tris Plus gel (Thermo Fisher Scientific) after adding Bolt LDS sample buffer (Thermo Fisher Scientific) and denaturing at 70°C for 10 min. The gel was run at 150 V for 60 min and then transferred onto a nitrocellulose membrane using the iBlot 2 Dry Blotting System (Thermo Fisher Scientific). The following primary antibodies were used for western blot at the corresponding dilutions in PBS with milk powder overnight at 4°C: MM2/57 for CD9 (MilliporeSigma) at 1:1,000, h5c6 for CD63 (BD Biosciences) at 1:1,000 and M38 for CD81 (Thermo Fisher Scientific) at 1:666. After three washes with PBST, anti-mouse IgG secondary antibody (Bethyl Laboratories) was added for 2 h in PBS with milk powder at 1:2,000. After three more washes with PBST, the SpectraQuant-HRP CL Spray chemiluminescent detection reagent (BridgePath Scientific) was used to develop western blots. Imaging was performed on the Sapphire Biomolecular Imager (Azure Biosystems).
Immunocapture and western blot.
For Fig. 2c, immunocapture of L1CAM from plasma and CSF was performed using the Dynabeads antibody coupling kit (Invitrogen, 14311D). Following the manufacturer’s instructions, either anti-L1CAM antibody (Abcam, ab272321) or anti-mCherry control antibody (Abcam, ab232341) were used. Four aliquots of 1 ml CSF or 0.375 ml plasma were incubated with beads at 4°C overnight with gentle rotation. Beads were washed four times with PBS and resuspended in LDS with reducing buffer. Immunocaptured plasma and CSF L1CAM as well as human brain lysate and iNGN cell lysate were loaded on a Bolt 4–12% Bis-Tris Plus gel (Thermo Fisher Scientific) after adding Bolt LDS sample buffer with reducing buffer (Thermo Fisher Scientific) and denaturing at 70°C for 10 min. The gel was run at 150 V for 120 min and then transferred onto a nitrocellulose membrane using the iBlot 2 Dry Blotting System (Thermo Fisher Scientific). The following primary antibodies were used for western blot at the corresponding dilutions in milk overnight at 4°C: UJ127 (Abcam) at 1:2,000 and 2C2 (Abcam) at 1:500. After three washes with PBST, anti-mouse cross IgG secondary antibody (Bethyl Laboratories) was added for 2 h in milk buffer at 1:2,000. After three more washes with PBST, SpectraQuant-HRP CL Spray chemiluminescent detection reagent (BridgePath Scientific) was used to develop western blots. Imaging was performed on the Sapphire Biomolecular Imager (Azure Biosystems).
Proteinase protection assay.
SEC was performed on 1 ml plasma, and fractions 7–10 were pooled. This solution (200 μl) was used for each of four conditions:
No treatment, 2-hincubation, lyse with 1% Triton X-100, 1-h incubation
Application of 100 μg proteinase K (Thermo Fisher), 2-h incubation, lyse with 1% Triton X-100, 1-h incubation
No treatment, 1-h delay, add PMSF to a final concentration of 2.5 mM for 1 h, lyse with 1% Triton X-100, 1-h incubation
Application of 100 μg proteinase K (Thermo Fisher), 1-h incubation, add PMSF to a final concentration of 2.5 mM for 1 h, lyse with 1% Triton X-100, 1-h incubation.
After the final incubation, each sample was diluted in Homebrew Sample Diluent (Quanterix) to a final volume of 800 μl and measured using Simoa assays for ALIX and albumin on the Quanterix HD-X instrument.
Density gradient.
For DGC, an OptiPrep (iodixanol) gradient was prepared using the following layers (from top to bottom): 2 ml 5%, 3 ml 10%, 3 ml 20%, 3 ml 40% layers. Each layer of OptiPrep (MilliporeSigma) was diluted in a solution of 0.25 M sucrose (MilliporeSigma) and Tris-EDTA, pH 7.4 (MilliporeSigma). The sample (1 ml) was loaded on top of the 5% fraction. Samples were centrifuged at 100,000 r.c.f. for 18 h at 4°C in 13.2-ml polypropylene tubes (Beckman Coulter). Fractions were removed from the top in 1-ml increments. To calculate the density of each fraction, 1 ml PBS was loaded on a gradient instead of sample. The refractive index of each fraction was measured with a refractometer after ultracentrifugation, and then density was calculated based on this measurement.
Electron microscopy.
Plasma fractions 9 and 12 from SEC using a 10-ml Sepharose CL-6B column were fixed in 2% paraformaldehyde and then stained with 2% uranyl formate. Samples were added to 400 mesh Formvar/Carbon Film Copper grids (Electron Microscopy Sciences), and liquid was wicked away using Whatman filter paper. Samples were imaged using a JEM-1400 120-kV transmission electron microscope (JEOL). Images were acquired using the AMT image capture engine V602 (Advanced Microscopy Techniques).
Mass spectrometry.
Excised gel bands around the size of 180–240 kDa were cut from a polyacrylamide gel and submitted for mass spectrometry analysis. Gel pieces were washed and dehydrated with acetonitrile, and then acetonitrile was removed. Gel pieces were dried in a Speed-Vac, and a modified in-gel trypsin procedure was performed13. Samples were then reconstituted in 5–10 μl HPLC solvent A (2.5% acetonitrile, 0.1% formic acid). A nanoscale reverse-phase HPLC capillary column was created by packing 2.6-μm C18 spherical silica beads into a fused silica capillary with a flame-drawn tip14. Each sample was loaded with a Famos autosampler (LC Packings) onto the column. Peptides were eluted with increasing concentrations of solvent B (97.5% acetonitrile, 0.1% formic acid), subjected to electrospray ionization and entered into an LTQ Orbitrap Velos Pro ion-trap mass spectrometer (Thermo Fisher Scientific). Peptide sequences were determined by matching information from protein databases with the fragmentation pattern acquired by the software program SEQUEST (Thermo Fisher Scientific)15.
iNGN extracellular-vesicle isolation.
Previously described iNGN cells were grown in mTeSR1 medium (Stemcell Technologies) on Matrigel (Corning)-coated plates. Doxycycline (Sigma-Aldrich) was diluted in PBS and added to MTeSR1 medium at a final concentration of 0.5 μg ml−1 to initiate differentiation. On day 4 after doxycycline addition, the medium was changed to Gibco DMEM with GlutaMAX (Thermo Fisher Scientific), supplemented with B-27 Serum-Free Supplement (Thermo Fisher Scientific) and Gibco penicillin–streptomycin (Thermo Fisher Scientific). On day 6, EVs were isolated by differential ultracentrifugation, as previously described16, and resuspended in PBS.
Splicing RNA-seq analysis.
For analysis of data from the Genotype–Tissue Expression database, preprocessed exon–exon junction read counts were obtained from the publicly available version 8 database (https://GTExportal.org). The read table was filtered to include only junctions falling within the body of L1CAM, and these counts were analyzed using custom Python scripts available upon request. Reads aligning to L1CAM (chrX:153,859,517-153,888,173) were visually examined using the Integrative Genomics Viewer17 to assess evidence for the inclusion or exclusion of exon 25.
Statistics and reproducibility.
Experiments included in the figures of this paper represent a single experiment. However, these experiments were reproduced multiple times by different operators using different biological samples, and the same results were observed. Specifically, the SEC results in Fig. 1 were replicated more than six times. The density gradient experiment as well as the western blot experiment in Fig. 2 were each replicated two times with similar results.
Reporting Summary.
Further information on research design is available in the Nature Research Reporting Summary linked to this article.
Extended Data
Extended Data Fig. 1 |. Proteinase protection assays.
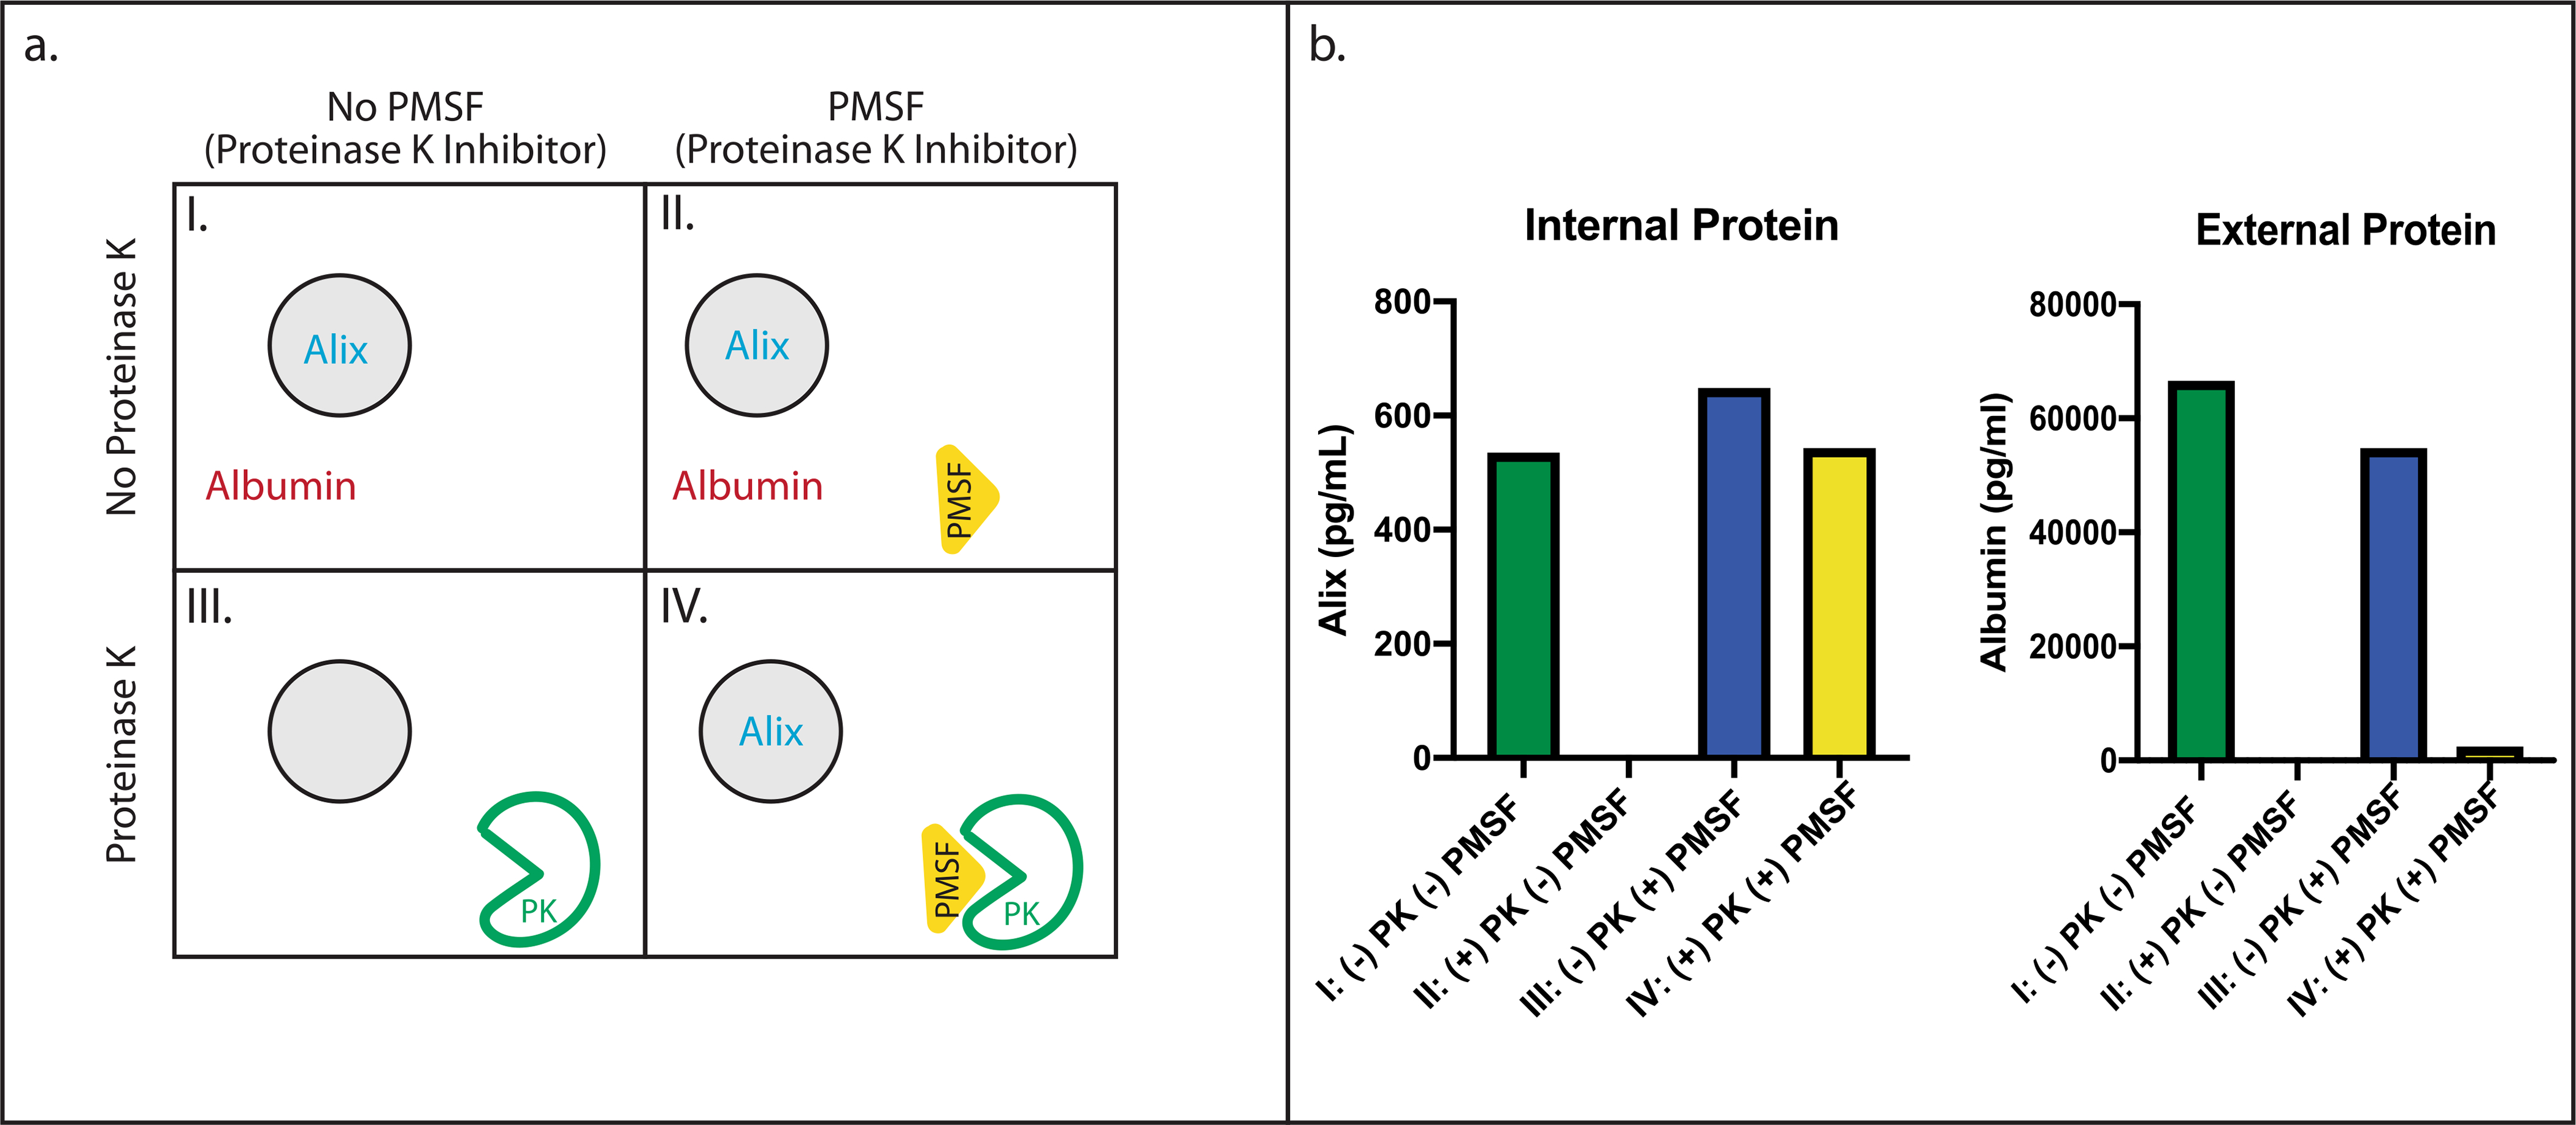
(a) Schematic overview of a Proteinase K protection assay analyzing the integrity of EVs after fractionation with SEC, using four different conditions: a No treatment, two-hour incubation, lyse with Triton X, one-hour incubation b Proteinase K application, two-hour incubation, lyse with Triton X, one-hour incubation. c No treatment, one-hour delay, add PMSF for one hour, lyse with Triton X, one-hour incubation. d Proteinase K application, one-hour incubation, add PMSF to inhibit Proteinase K for one hour, lyse with Triton X, one-hour incubation. (b) Alix and Albumin concentrations after the Proteinase K protection assay, as measured with Simoa. Data represent the average of two technical replicates of the Simoa assay measurements from a single experiment with one sample. This experiment was conducted 3 times with similar results.
Extended Data Fig. 2 |. Electron Microscopy of SEC fractions.
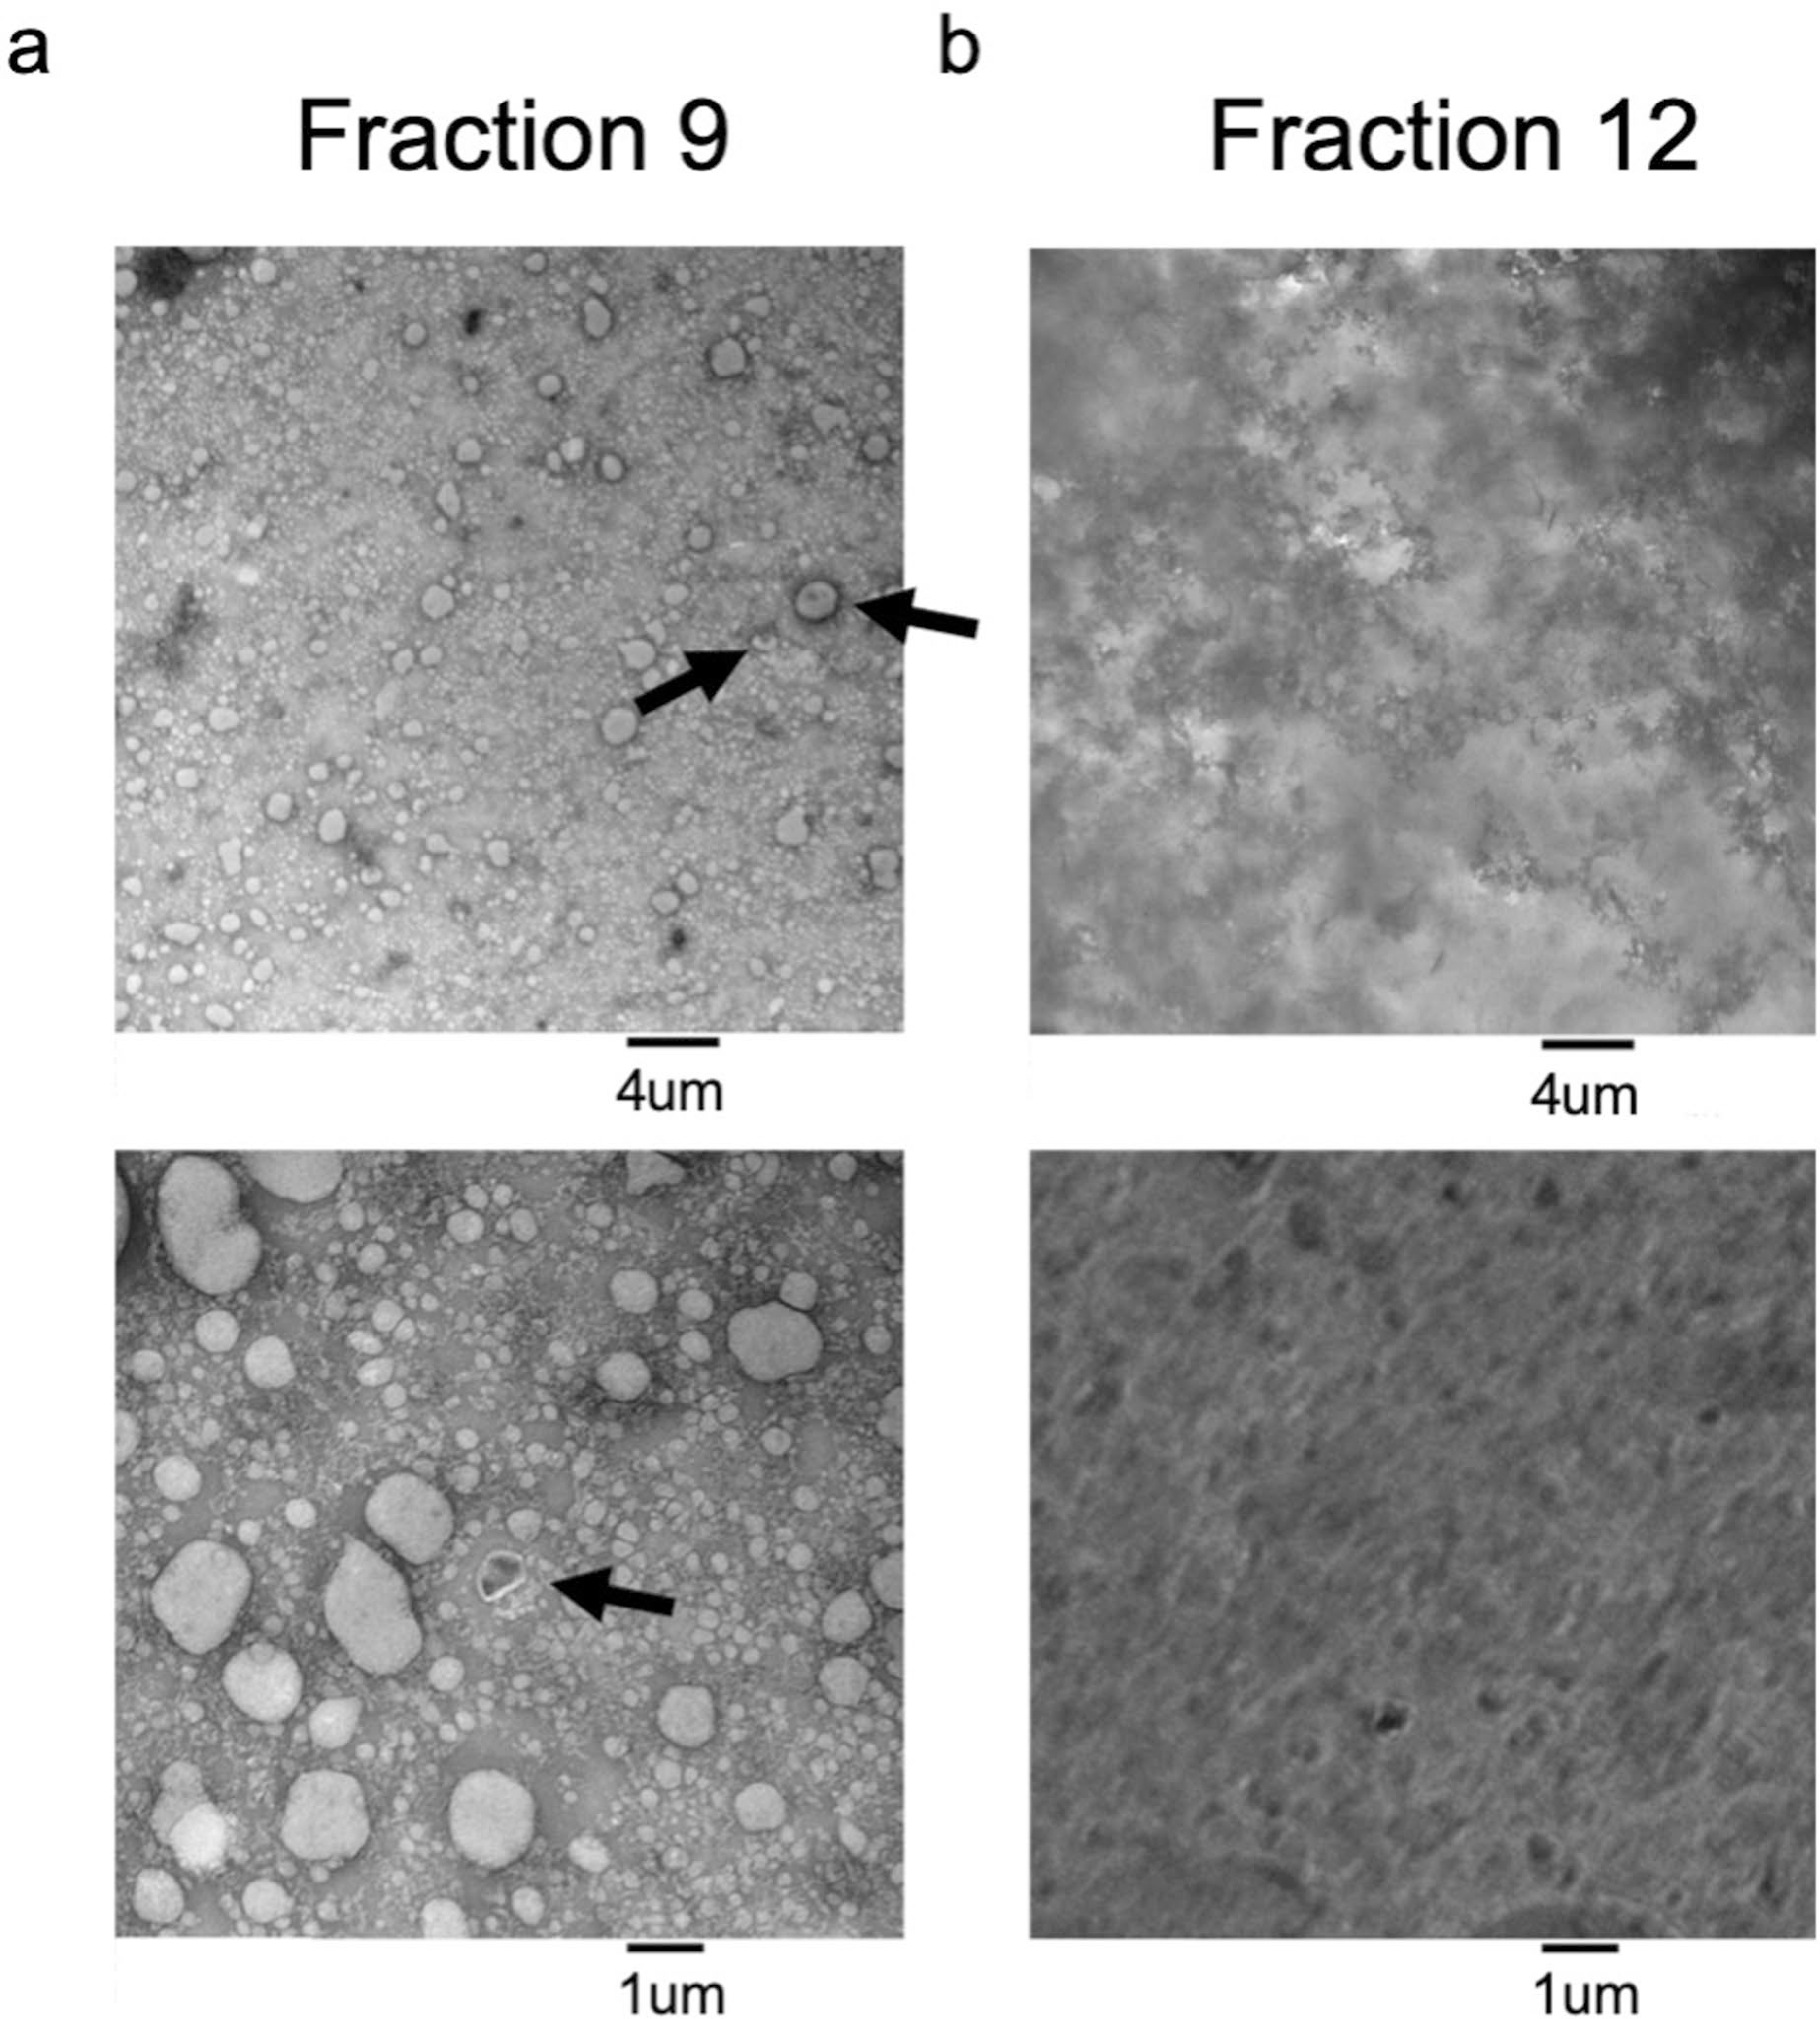
Transmission Electron Microscopy of a. Fraction 9 and b. Fraction 12 from plasma fractionated using SEC and negatively stained with uranyl formate. Representative images are shown at 6000× magnification (top) and 20,000× magnification (bottom). Arrows indicate ‘cup-shaped’ EVs. This experiment was conducted once.
Extended Data Fig. 3 |. Mass spectrometry of L1CAM immunocaptured from plasma.
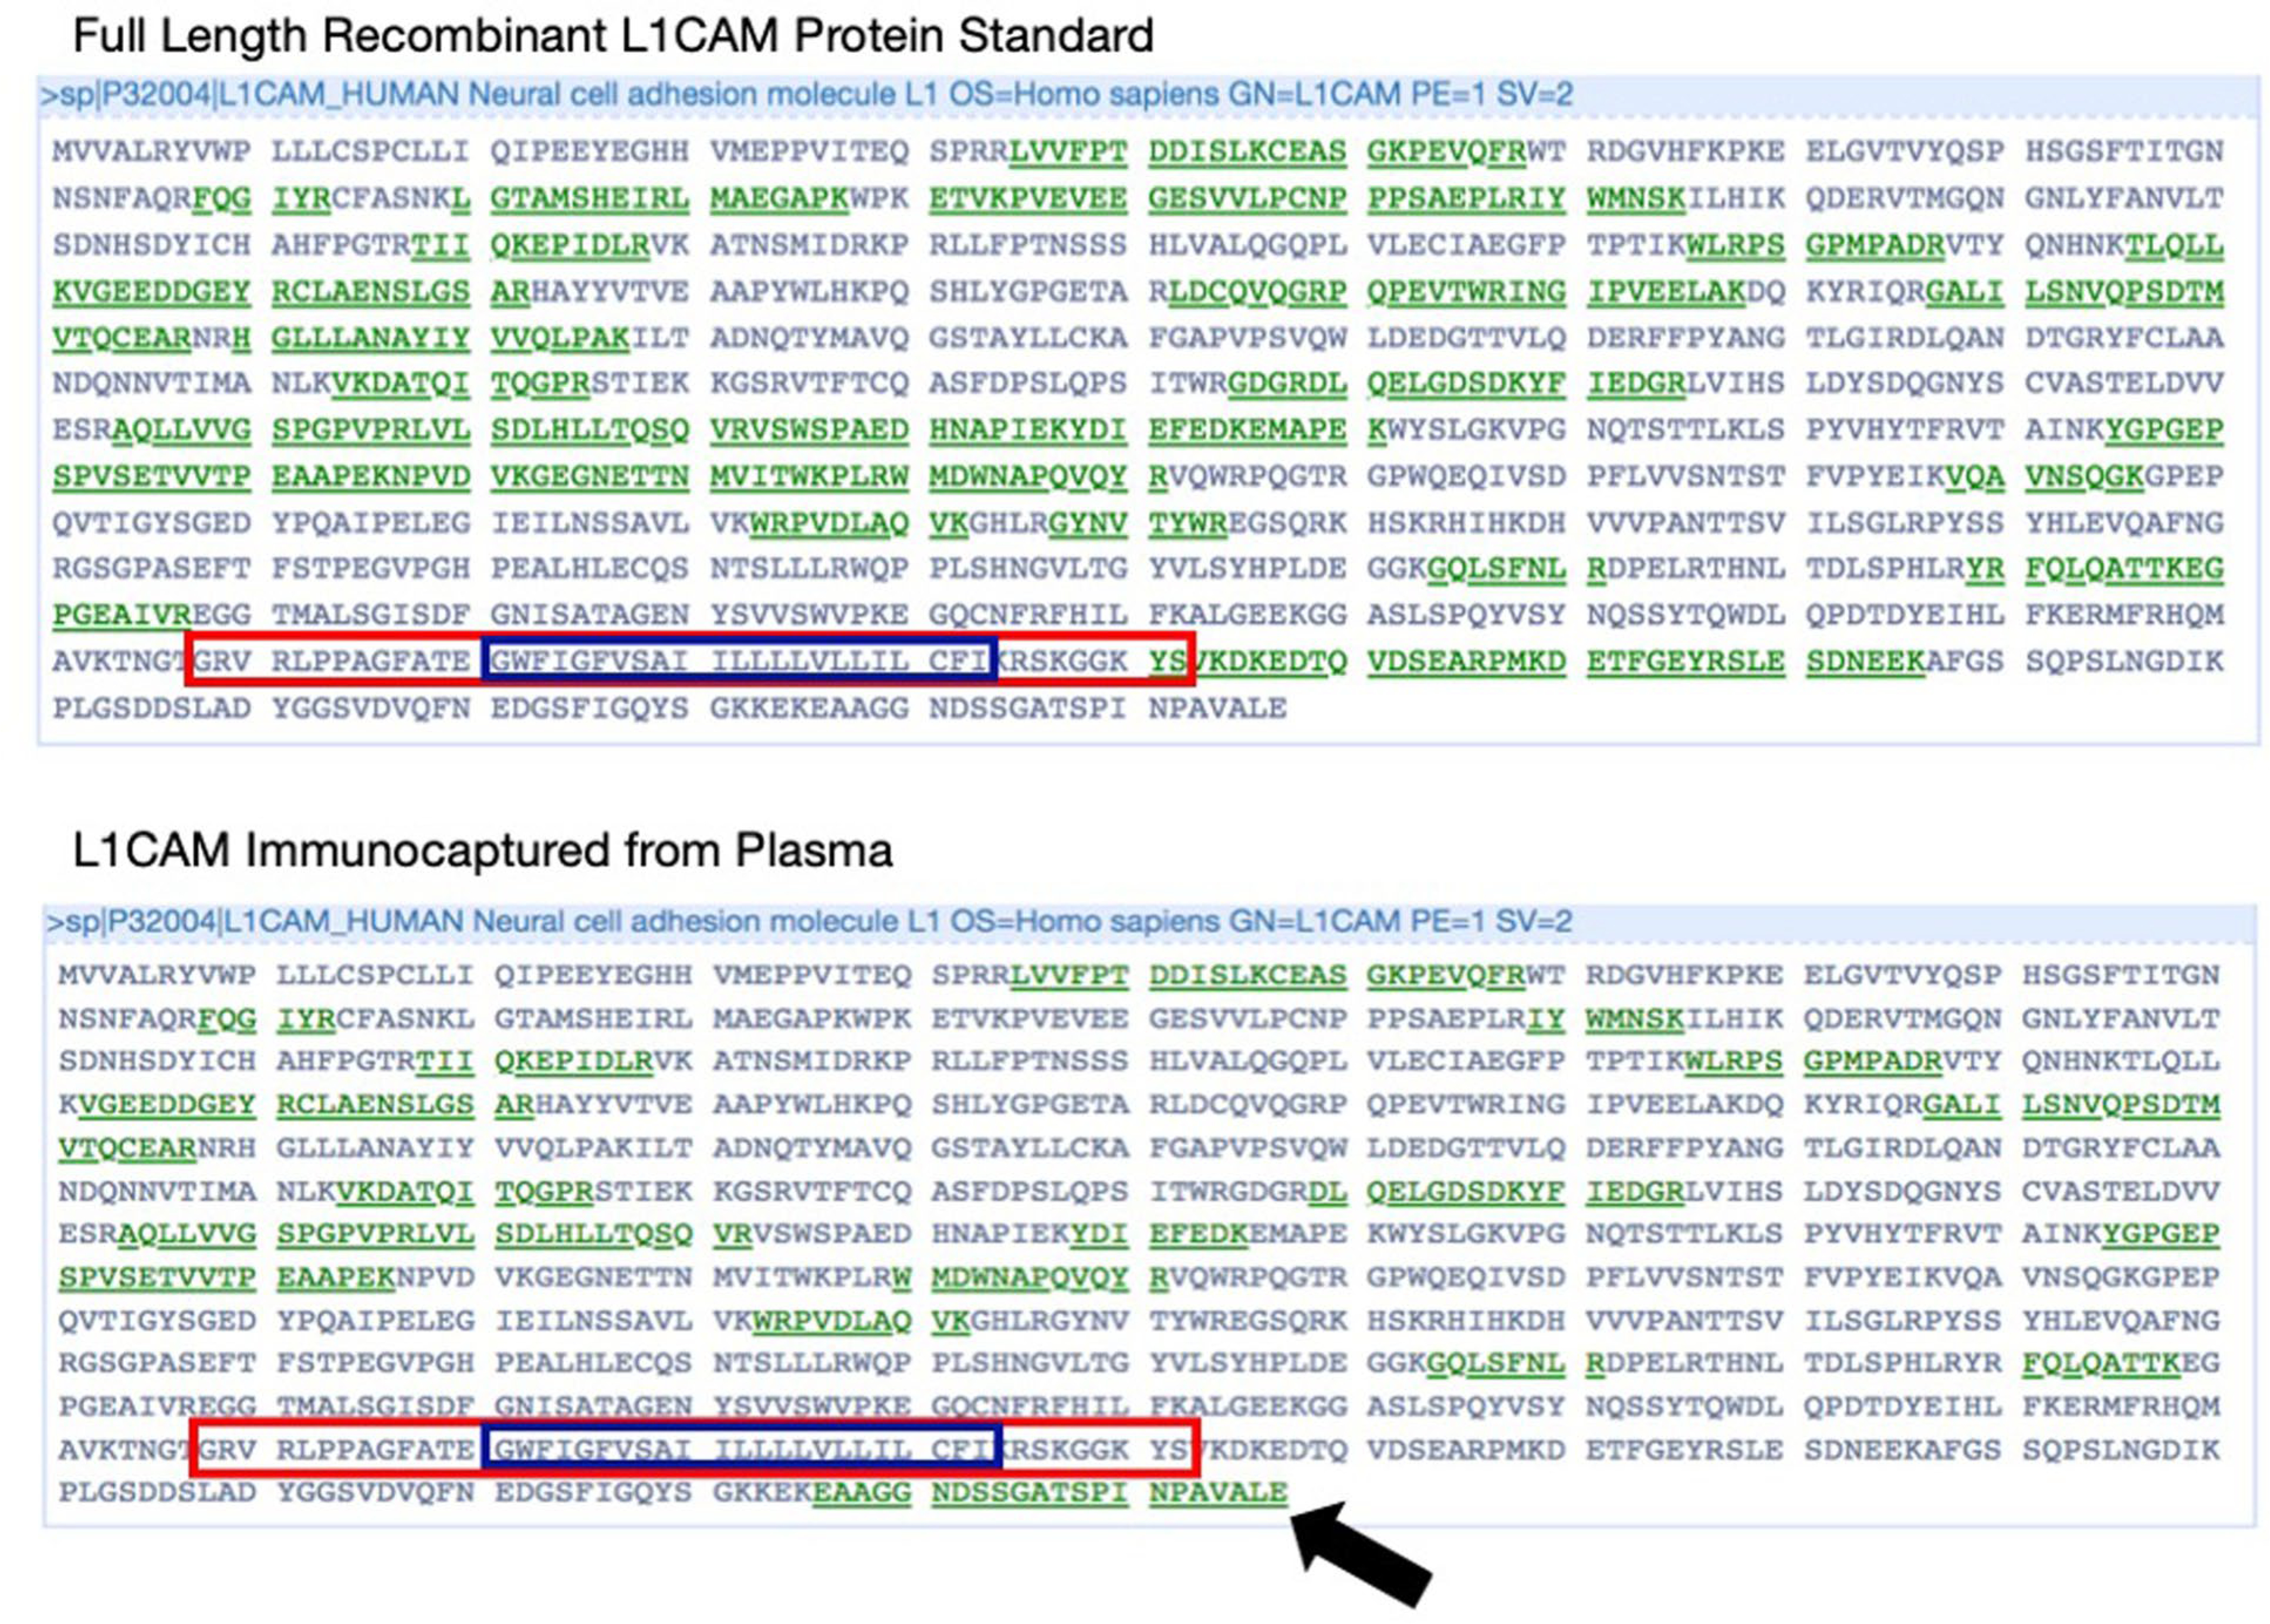
Mass spectrometry analysis shows peptides mapping to different parts of the L1CAM protein. Full length sequence of L1CAM displayed with peptides detected by mass spectrometry shown in green. Blue box indicates L1CAM transmembrane domain and red box indicates amino acid sequence encoded by Exon 25. Top: full length recombinant L1CAM protein standard shows peptides matching an isoform which includes Exon 25. Bottom: Mass Spectrometry of L1CAM immunocaptured from human plasma shows peptides matching the cytosolic domain at the C terminus (emphasized with black arrow). This experiment was conducted once.
Extended Data Fig. 4 |. Analysis of RNA-seq data for L1CAM.
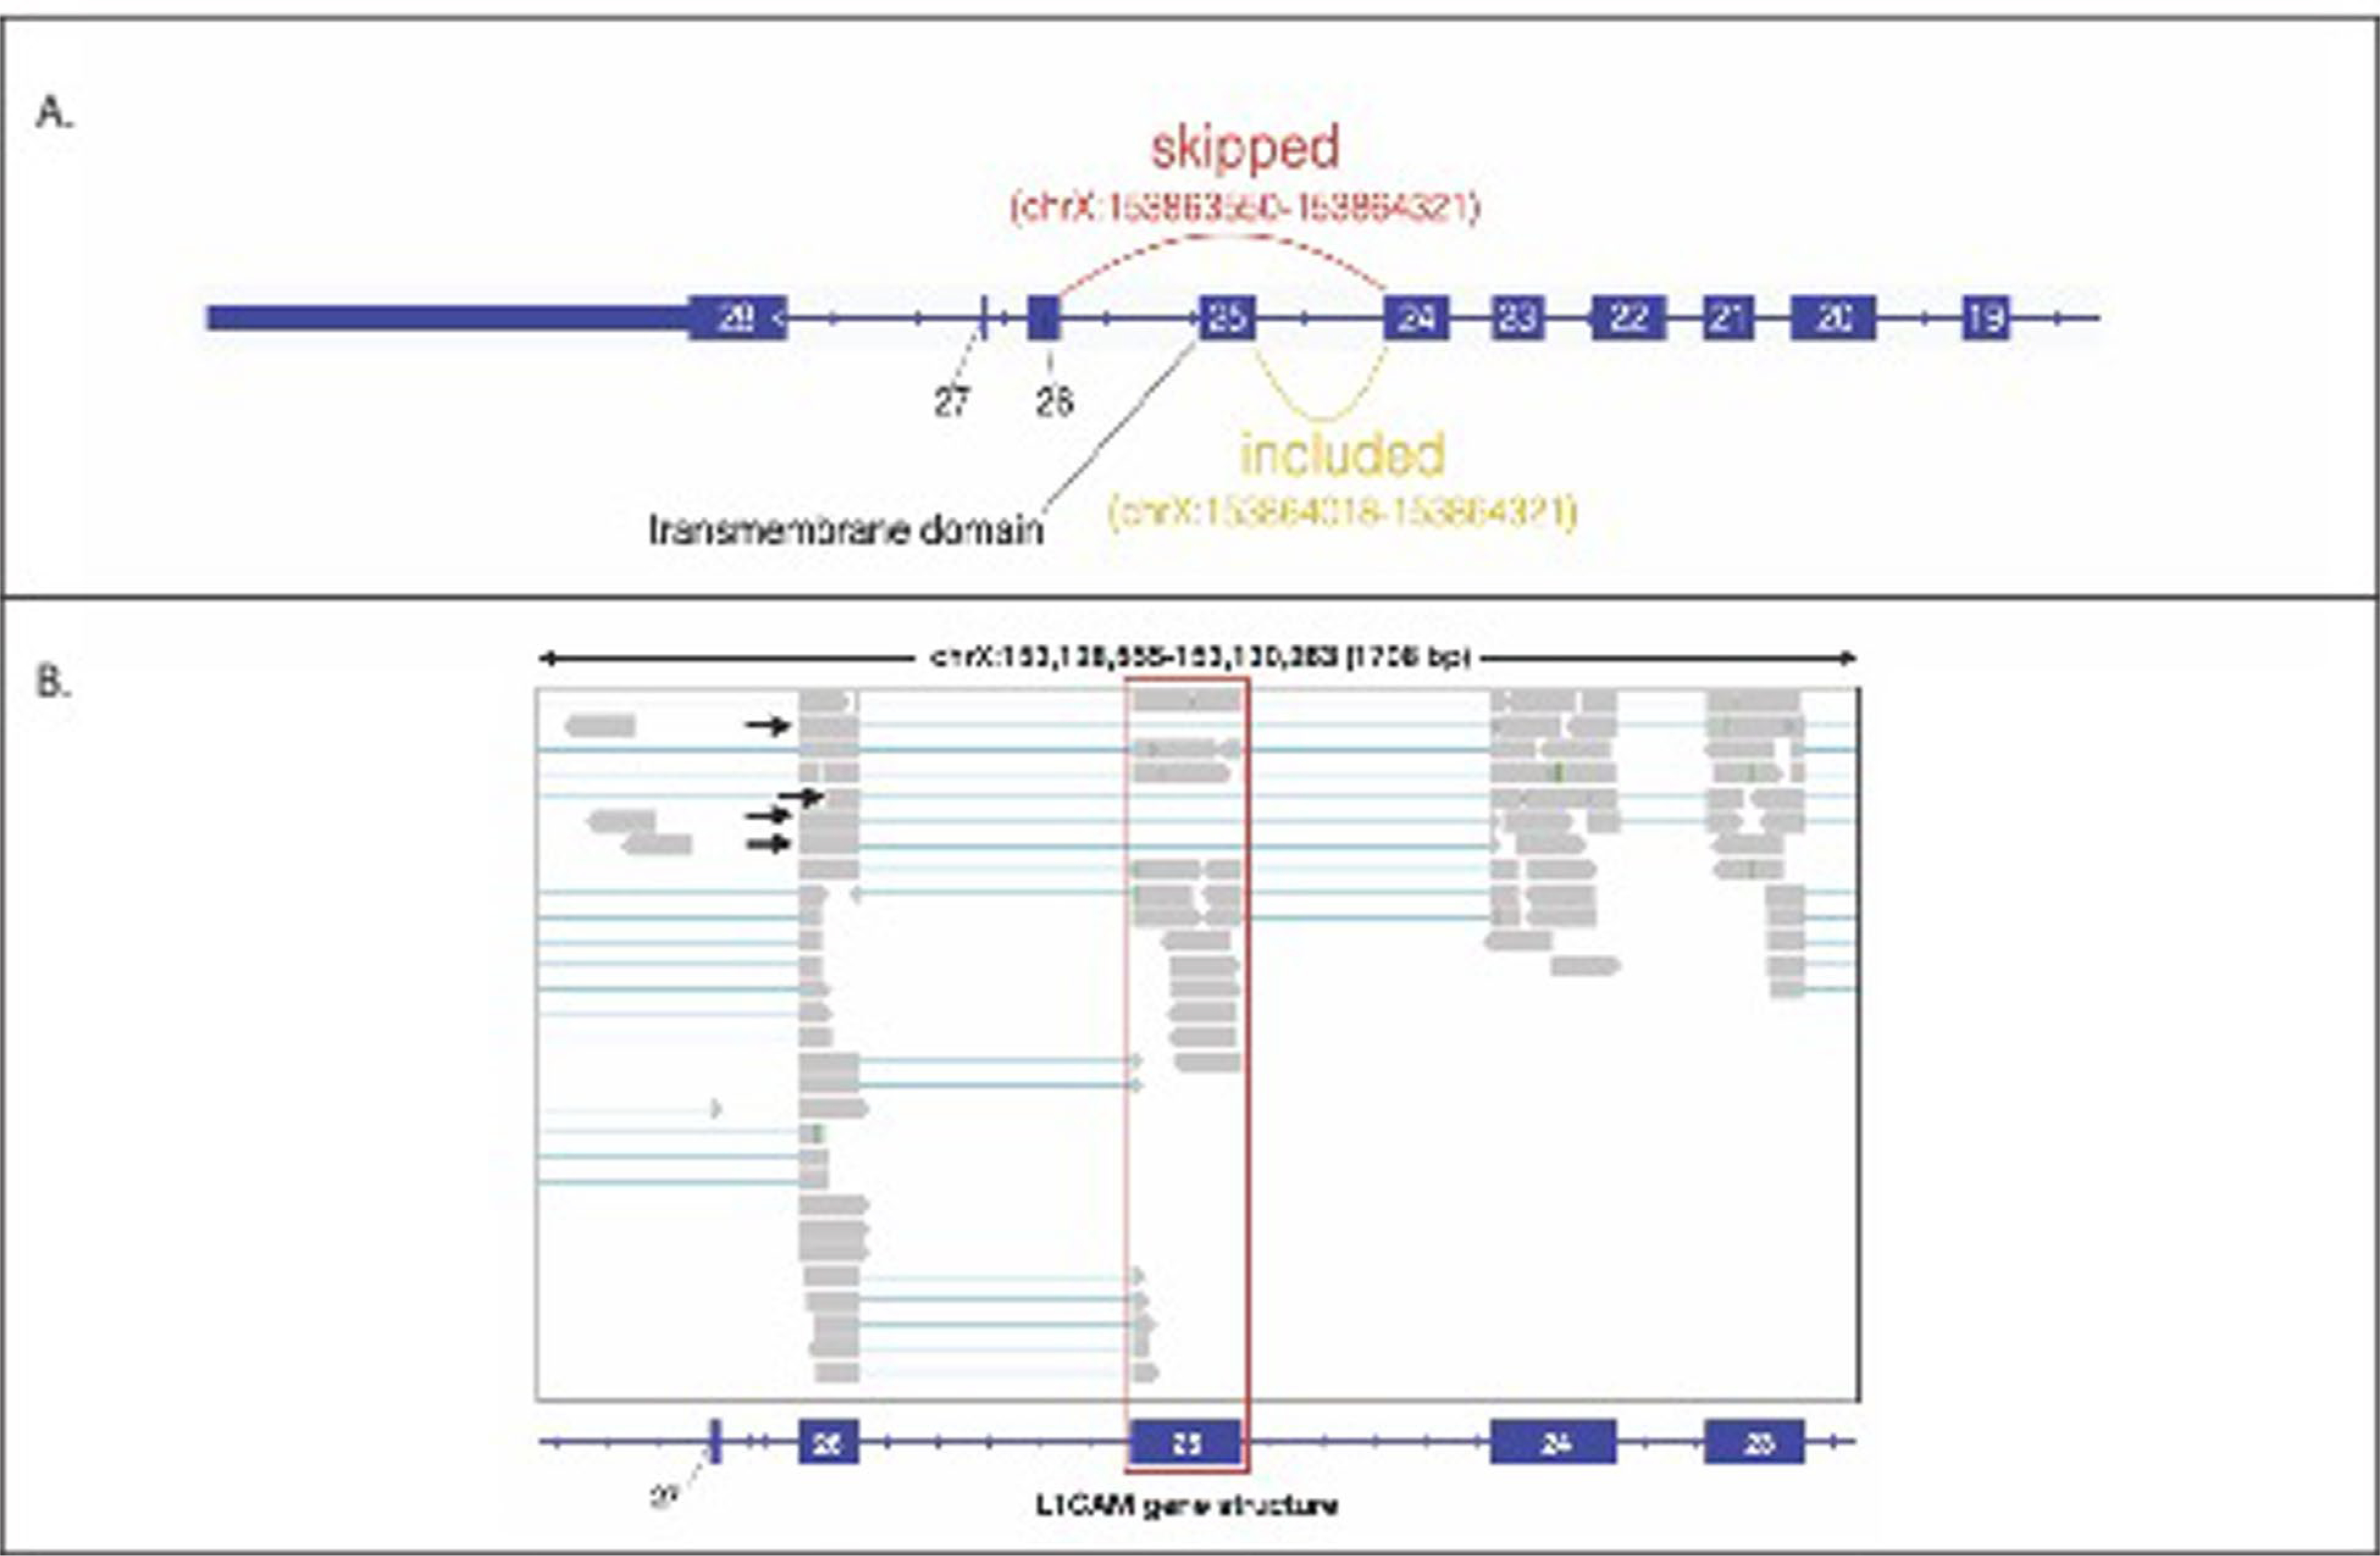
(a) L1CAM intro-exon gene structure including Exon 25, which contains the only transmembrane domain. Alternative splicing skipping Exon 25 (L1CAM isoform without a transmembrane domain) would lead to transcripts with an exon-exon junction across Exon 24 and Exon 26. (b) Reads from GTEx RNA-Seq data of human Tibial Artery loaded in Integrative Genome Browser (IGV) aligning to Exon 25 of L1CAM, which contain the transmembrane domain (highlighted in red). Aligned junction reads supporting the skipping of Exon 25 are indicated with black arrows.
Extended Data Fig. 5 |. Analysis of reads from GTEx RNA-Seq Data indicating Exon 25 skipping in alternative splicing of L1CAM.
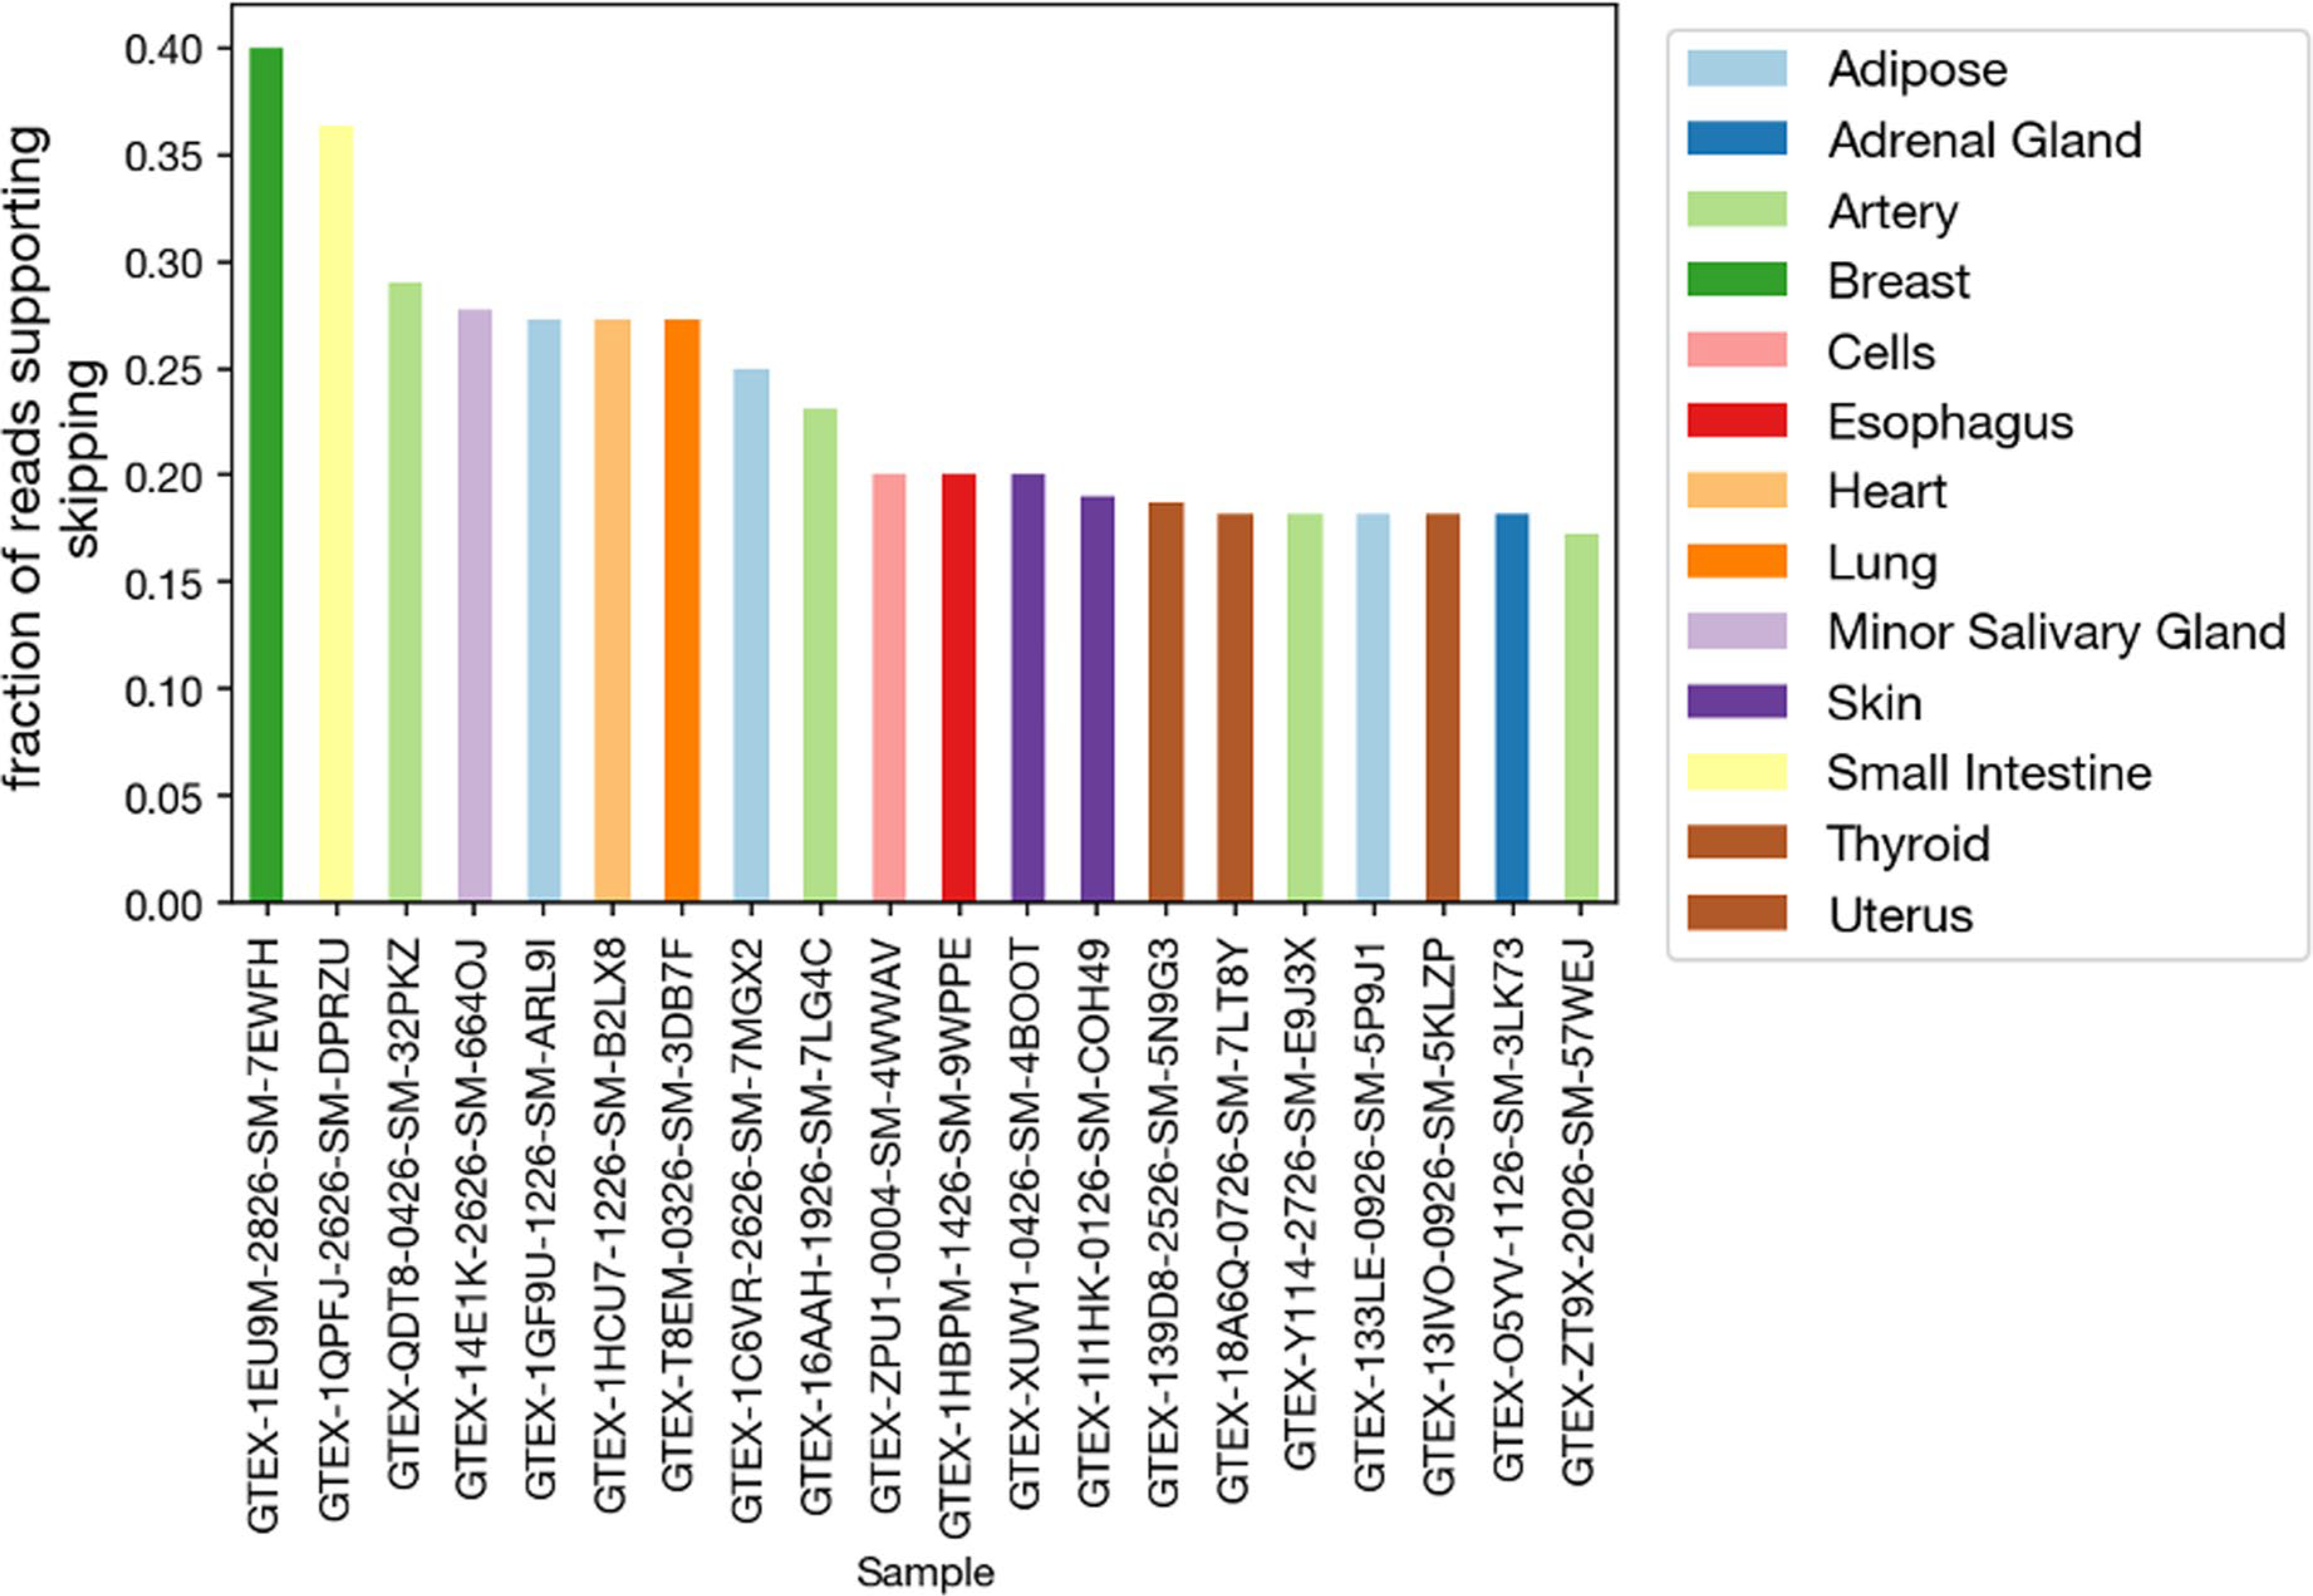
Fraction of reads mapping to L1CAM isoform supporting skipping of L1CAM Exon 25 (junction reads spanning Exon 24 and Exon 26) vs. inclusion of Exon 25 from RNA-Seq GTEx data of various human organs.
Extended Data Fig. 6 |. Affinity of L1CAM for recombinant alpha-synuclein.
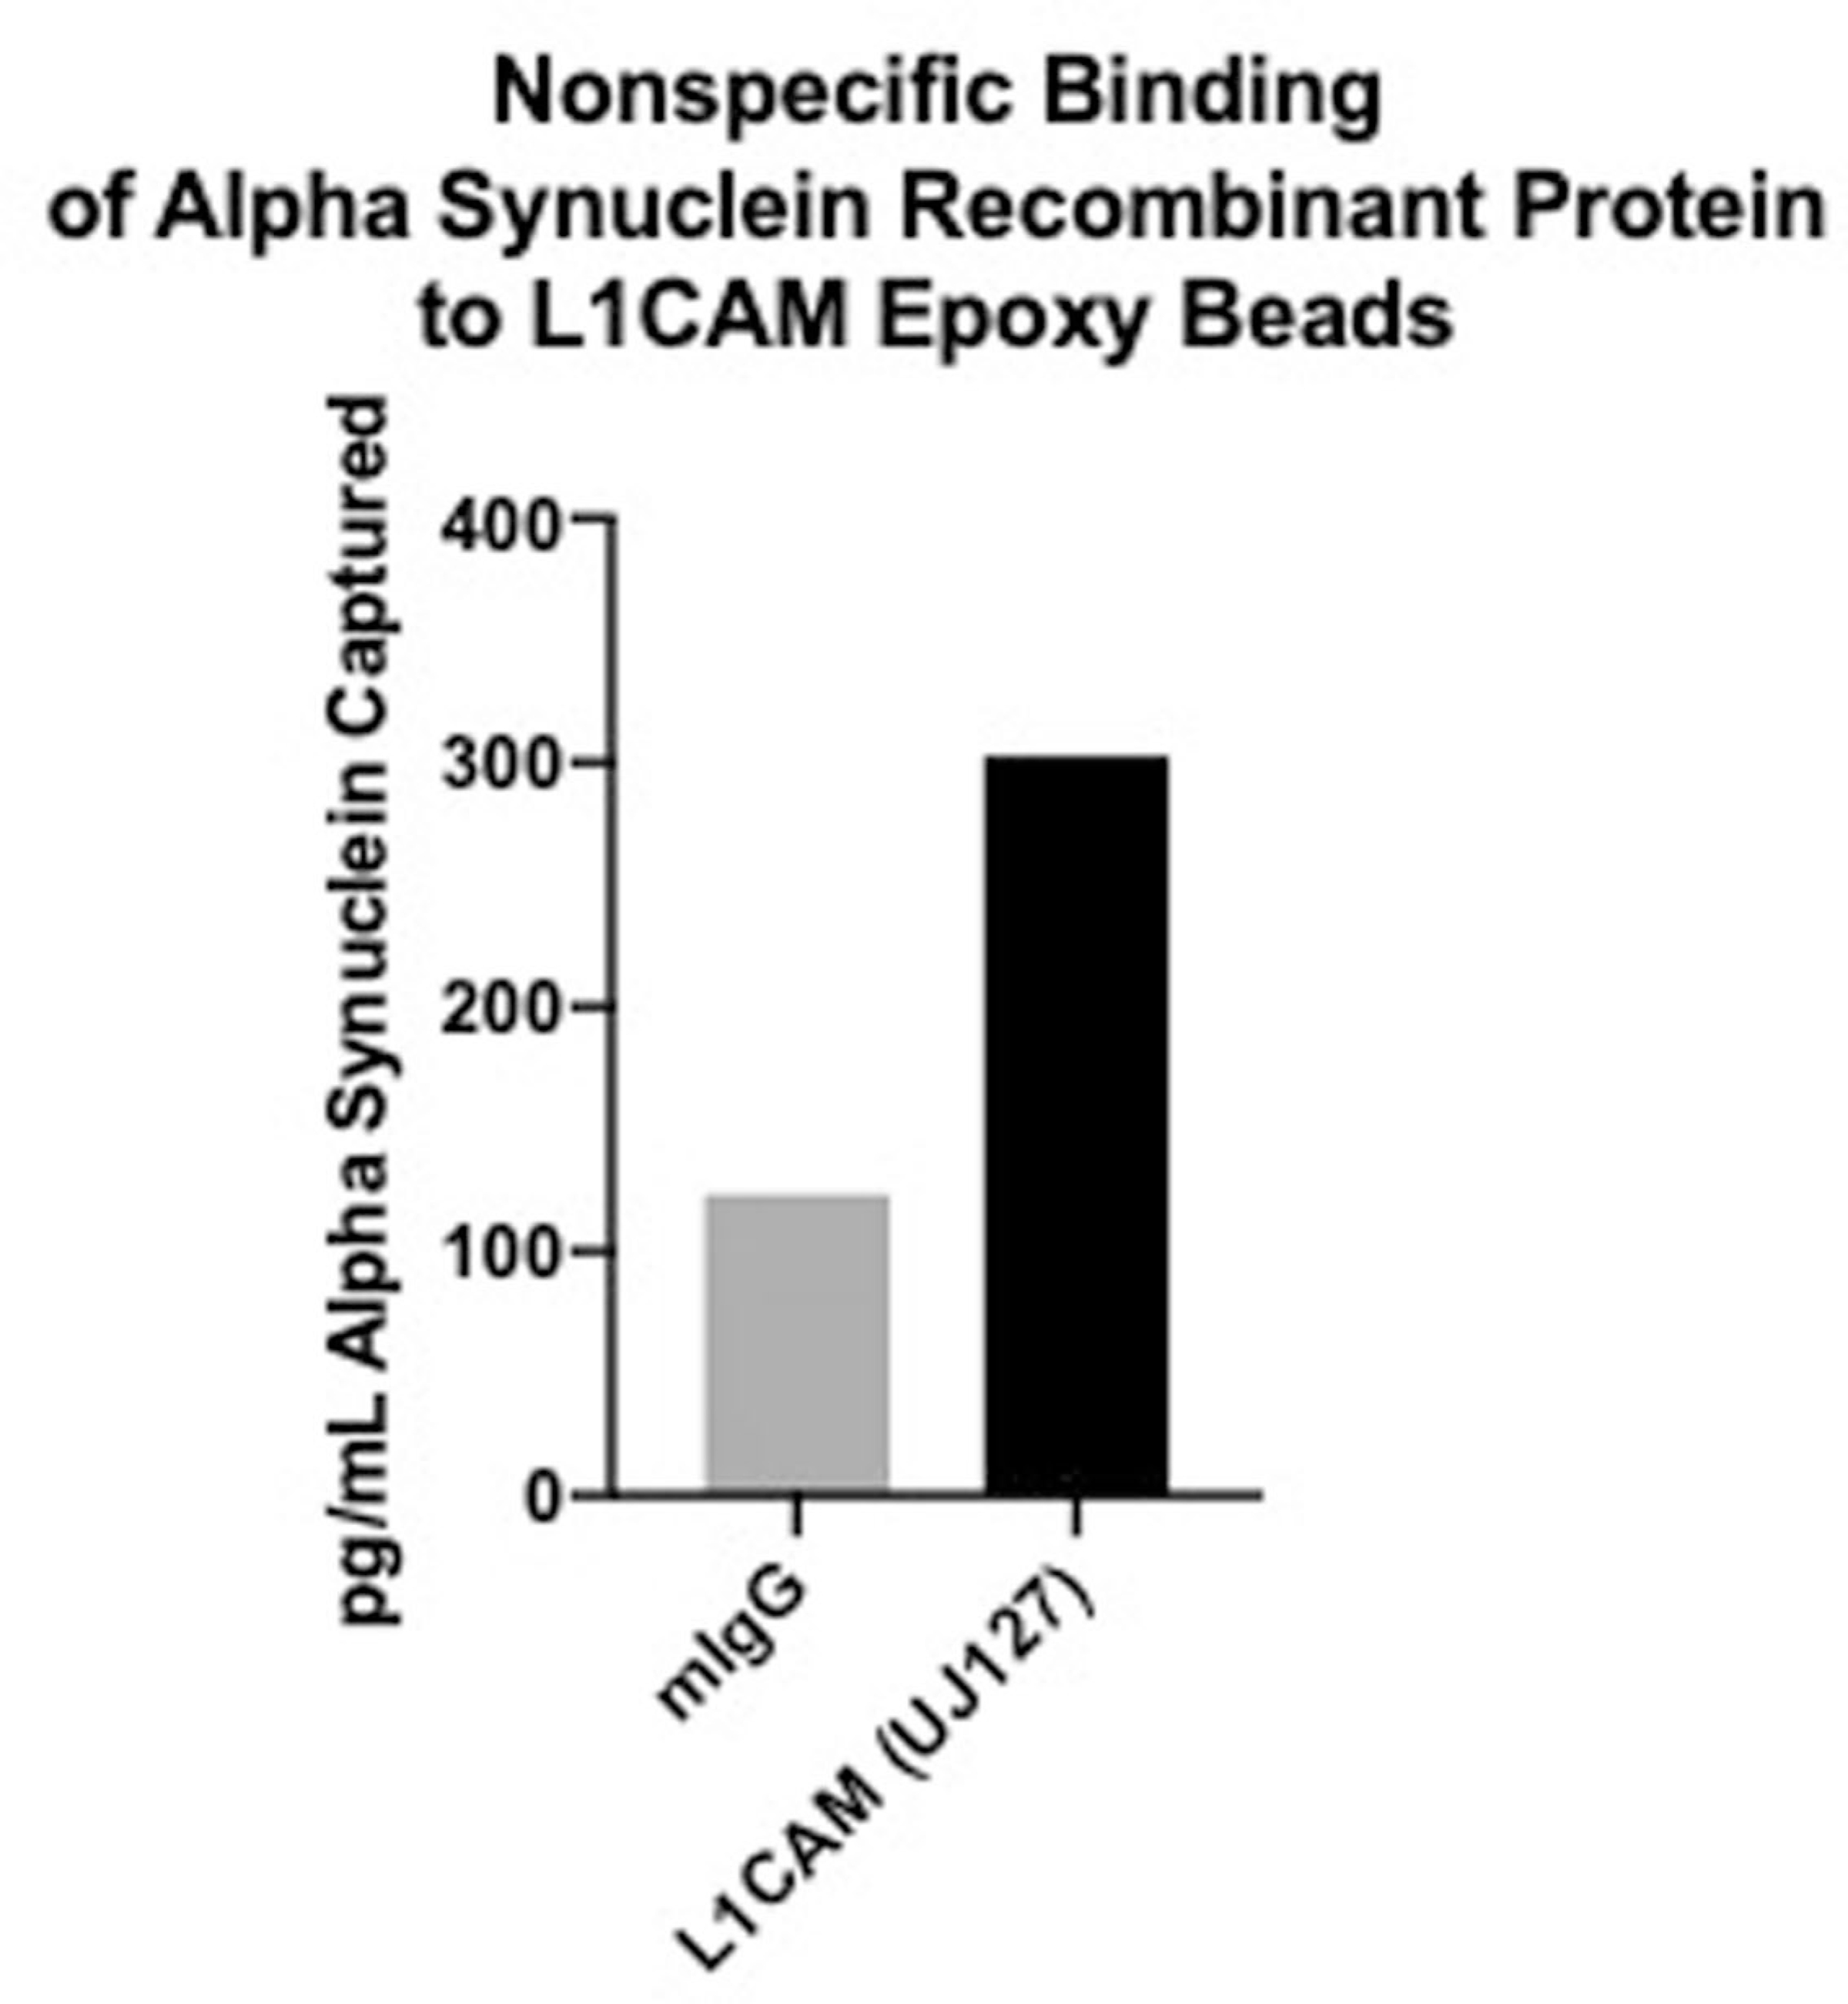
Concentration of Alpha Synuclein recombinant protein captured with control (mIgG) and L1CAM (UJ12) antibodies in a pull-down experiment. Data shown is the average of two technical replicates from a single experiment.
Supplementary Material
Acknowledgements
We thank A. Ng for help with stem cell differentiation and J. Van Deun for help with DGC. We also thank the Taplin Biological Mass Spectrometry Facility at Harvard Medical School and the Harvard Center for Mass Spectrometry for help with proteomic experiments. This work was supported by funding from the Chan Zuckerberg Initiative Neurodegeneration Challenge Network (to D.R.W., G.M.C., A.S.C.-P.), Good Ventures (to D.R.W.), the NIH Center for Excellence in Genomic Science (to G.M.C., RM1HG008525), the Howard Hughes Medical Institute (to A.R.) and the Klarman Cell Observatory (to A.R.). These funding agencies had no role in conceptualization, design, data collection, analysis, decision to publish or preparation of the manuscript.
Footnotes
Competing interests
D.R.W. is a founder and equity holder of Quanterix. A.R. is an SAB member of Thermo Fisher Scientific, Neogene Therapeutics, Asimov and Syros Pharmaceuticals. A.R. is a cofounder of and equity holder in Celsius Therapeutics and an equity holder in Immunitas. From 1 August 2020, A.R. is an employee of Genentech. G.M.C. is a founder, consultant or advisory board member to companies listed here: http://arep.med.harvard.edu/gmc/tech.html. These companies had no influence over any aspect of this research. We have filed intellectual property on methods for EV analysis and isolation. M.N., D.T.-O. and D.R.W. filed a provisional patent for the measurement of EVs using single-molecule arrays as described in this study. Additionally, D.T.-O., E.J.K.K., A.R. and G.M.C. filed intellectual property relating to the identification and use of new candidate markers for NDEV isolation.
Online content
Any methods, additional references, Nature Research reporting summaries, source data, extended data, supplementary information, acknowledgements, peer review information; details of author contributions and competing interests; and statements of data and code availability are available at https://doi.org/10.1038/s41592-021-01174-8.
Code availability
The custom Python code used in this study is available as Supplementary Software.
Additional information
Extended data is available for this paper at https://doi.org/10.1038/s41592-021-01174-8.
Supplementary information The online version contains supplementary material available at https://doi.org/10.1038/s41592-021-01174-8.
Peer review information Nina Vogt was the primary editor on this article and managed its editorial process and peer review in collaboration with the rest of the editorial team.
Reprints and permissions information is available at www.nature.com/reprints.
Data availability
The data supporting the findings of this study are available within the paper and its Extended Data files. Source data are provided with this paper.
References
- 1.Raposo G & Stoorvogel W Extracellular vesicles: exosomes, microvesicles, and friends. J. Cell Biol 200, 373–383 (2013). [DOI] [PMC free article] [PubMed] [Google Scholar]
- 2.Hlavin ML & Lemmon V Molecular structure and functional testing of human L1CAM: an interspecies comparison. Genomics 11, 416–423 (1991). [DOI] [PubMed] [Google Scholar]
- 3.Angiolini F et al. A novel L1CAM isoform with angiogenic activity generated by NOVA2-mediated alternative splicing. eLife 8, e44305 (2019). [DOI] [PMC free article] [PubMed] [Google Scholar]
- 4.Rissin DM et al. Single-molecule enzyme-linked immunosorbent assay detects serum proteins at subfemtomolar concentrations. Nat. Biotechnol 28, 595–599 (2010). [DOI] [PMC free article] [PubMed] [Google Scholar]
- 5.Lobb RJ et al. Optimized exosome isolation protocol for cell culture supernatant and human plasma. J. Extracell. Vesicles 4, 27031 (2015). [DOI] [PMC free article] [PubMed] [Google Scholar]
- 6.Mechtersheimer S et al. Ectodomain shedding of L1 adhesion molecule promotes cell migration by autocrine binding to integrins. J. Cell Biol 155, 661–673 (2001). [DOI] [PMC free article] [PubMed] [Google Scholar]
- 7.Zhou L et al. The neural cell adhesion molecules L1 and CHL1 are cleaved by BACE1 protease in vivo. J. Biol. Chem 287, 25927–25940 (2012). [DOI] [PMC free article] [PubMed] [Google Scholar]
- 8.Carithers LJ et al. A novel approach to high-quality postmortem tissue procurement: the GTEx project. Biopreserv. Biobank 13, 311–319 (2015). [DOI] [PMC free article] [PubMed] [Google Scholar]
- 9.Shi M et al. Plasma exosomal α-synuclein is likely CNS-derived and increased in Parkinson’s disease. Acta Neuropathol 128, 639–650 (2014). [DOI] [PMC free article] [PubMed] [Google Scholar]
- 10.Thery C et al. Minimal information for studies of extracellular vesicles 2018 (MISEV2018): a position statement of the International Society for Extracellular Vesicles and update of the MISEV2014 guidelines. J. Extracell. Vesicles 7, 1535750 (2018). [DOI] [PMC free article] [PubMed] [Google Scholar]
- 11.Thompson AG et al. Extracellular vesicles in neurodegenerative disease—pathogenesis to biomarkers. Nat. Rev. Neurol 12, 346–357 (2016). [DOI] [PubMed] [Google Scholar]
- 12.Shi M, Sheng L, Stewart T, Zabetian CP & Zhang J New windows into the brain: central nervous system-derived extracellular vesicles in blood. Prog. Neurobiol 175, 96–106 (2019). [DOI] [PMC free article] [PubMed] [Google Scholar]
- 13.Shevchenko A, Wilm M, Vorm O & Mann M Mass spectrometric sequencing of proteins from silver-stained polyacrylamide gels. Anal. Chem 68, 850–858 (1996). [DOI] [PubMed] [Google Scholar]
- 14.Peng J & Gygi SP Proteomics: the move to mixtures. J. Mass Spectrom 36, 1083–1091 (2001). [DOI] [PubMed] [Google Scholar]
- 15.Eng JK, McCormack AL & Yates JR An approach to correlate tandem mass spectral data of peptides with amino acid sequences in a protein database. J. Am. Soc. Mass Spectrom 5, 976–989 (1994). [DOI] [PubMed] [Google Scholar]
- 16.Busskamp V et al. Rapid neurogenesis through transcriptional activation in human stem cells. Mol. Syst. Biol 10, 760 (2014). [DOI] [PMC free article] [PubMed] [Google Scholar]
- 17.Thorvaldsdottir H, Robinson JT & Mesirov JP Integrative Genomics Viewer (IGV): high-performance genomics data visualization and exploration. Brief. Bioinform 14, 178–192 (2013). [DOI] [PMC free article] [PubMed] [Google Scholar]
Associated Data
This section collects any data citations, data availability statements, or supplementary materials included in this article.
Supplementary Materials
Data Availability Statement
The data supporting the findings of this study are available within the paper and its Extended Data files. Source data are provided with this paper.


