

Abstract
Background
Atrial fibrillation (AF) is the most common sustained cardiac arrhythmia. However, underlying molecular mechanisms are insufficiently understood. Previous studies suggested that microRNA (miRNA) dependent gene regulation plays an important role in the initiation and maintenance of AF. The 2‐pore‐domain potassium channel TASK‐1 (tandem of P domains in a weak inward rectifying K+ channel–related acid sensitive K+ channel 1) is an atrial‐specific ion channel that is upregulated in AF. Inhibition of TASK‐1 current prolongs the atrial action potential duration to similar levels as in patients with sinus rhythm. Here, we hypothesize that miRNAs might be responsible for the regulation of KCNK3 that encodes for TASK‐1.
Methods and Results
We selected miRNAs potentially regulating KCNK3 and studied their expression in atrial tissue samples obtained from patients with sinus rhythm, paroxysmal AF, or permanent/chronic AF. MiRNAs differentially expressed in AF were further investigated for their ability to regulate KCNK3 mRNA and TASK‐1 protein expression in human induced pluripotent stem cells, transfected with miRNA mimics or inhibitors. Thereby, we observed that miR‐34a increases TASK‐1 expression and current and further decreases the resting membrane potential of Xenopus laevis oocytes, heterologously expressing hTASK‐1. Finally, we investigated associations between miRNA expression in atrial tissues and clinical parameters of our patient cohort. A cluster containing AF stage, left ventricular end‐diastolic diameter, left ventricular end‐systolic diameter, left atrial diameter, atrial COL1A2 (collagen alpha‐2(I) chain), and TASK‐1 protein level was associated with increased expression of miR‐25, miR‐21, miR‐34a, miR‐23a, miR‐124, miR‐1, and miR‐29b as well as decreased expression of miR‐9 and miR‐485.
Conclusions
These results suggest an important pathophysiological involvement of miRNAs in the regulation of atrial expression of the TASK‐1 potassium channel in patients with atrial cardiomyopathy.
Keywords: atrial fibrillation, ion channel regulation, KCNK3, miRNA, TASK‐1
Subject Categories: Atrial Fibrillation, Electrophysiology, Translational Studies
Nonstandard Abbreviations and Acronyms
- APD
action potential duration
- cAF
chronic atrial fibrillation
- COL1A2
collagen alpha‐2(I) chain
- pAF
paroxysmal atrial fibrillation
- RMP
resting membrane potential
- SR
sinus rhythm
- TASK‐1
tandem of P domains in a weak inward rectifying K+ channel (TWIK)–related acid sensitive K+ channel 1
Clinical Perspective
What Is New?
Atrial fibrillation associated atrial remodeling is accompanied by distinct changes in atrial microRNA expression patterns.
MiR‐34a might regulate the expression of atrial TASK‐1 (tandem of P domains in a weak inward rectifying K+ channel [TWIK]–related acid sensitive K+ channel 1) channels that were recently described to contribute to initiation and maintenance of atrial fibrillation.
What Are the Clinical Implications?
The correlation of microRNA levels in the atrium with clinical parameters may suggest that subtypes of atrial fibrillation can be differentiated by analyzing microRNA expression.
Atrial fibrillation (AF) is the most common sustained cardiac arrhythmia with an increasing incidence because of demographic aging. 1 Over the past decades numerous aspects of structural and electrical remodeling processes within the atrial tissue of patients suffering from AF have been identified. Structural remodeling in the context of AF involves an increase of atrial fibrosis that results in ectopic electrical activity and increased conduction anisotropy within the atrial tissue. 2 , 3 Electrical remodeling describes alterations in the expression of cardiac ion channels that are causally linked to the shortening of the atrial action potential duration (APD) and effective refractory period or the disruption of atrial calcium homeostasis. 4 , 5 , 6 , 7 The combination of a shortened APD, effective refractory period, and an increased ectopic activity results in elevated susceptibility for AF.
Experimental studies have suggested that microRNAs (miRNA, miR) play an important role in the initiation and maintenance of cardiovascular diseases including AF. 8 MiRNAs are small, noncoding but highly conserved RNAs that regulate gene expression at the posttranscriptional level. After assembly of the RNA‐induced silencing complex, miRNA molecules can bind to a complementary sequence, usually located within the 3'‐untranslated regions of the targeted mRNA, thereby inhibiting its translation or inducing its degradation. 9 , 10 In AF, miRNAs are involved in electrical as well as structural remodeling. 11 It was shown that miR‐26 is involved in electrical remodeling. Increased expression of miR‐26 in AF resulted in augmented expression of KCNJ2 encoding for the Kir2.1 potassium channel. Thereby, the IK1 current was increased causing an enhanced vulnerability for AF in mice. 12 MiR‐21 is an example for the involvement of miRNAs in structural remodeling. Upregulation of miR‐21 in AF indirectly promotes fibrosis via downregulation of SPRY1, a negative regulator of profibrotic cellular signaling pathways. 13 , 14
Electrical remodeling in the form of APD and effective refractory period shortening represents a key feature of the pathological remodeling processes that occur in AF. Within the heart, TASK‐1 (tandem of P domains in a weak inward rectifying K+ channel [TWIK]–related acid sensitive K+ channel 1; K2P3.1) that is encoded by KCNK3 is involved in regulating cardiac conduction, repolarization, and the heart rate. 15 , 16 , 17 It belongs to the group of 2‐pore‐domain potassium channels that are responsible for a background “leak” potassium conductance modulating the cell’s resting membrane potential and cellular excitability. 18 It was shown that TASK‐1 expression is increased in patients with AF, resulting in shortened atrial APD. 5 , 19 TASK‐1 inhibition results in prolongation of the APD in atrial cardiomyocytes and was shown to restore shortened APDs of patients with a return to values observed in sinus rhythm (SR). 5 Owing to its atrial‐specific expression, TASK‐1 represents a promising drug target, lacking ventricular proarrhythmic side effects that often limit antiarrhythmic drug therapy. 19
The mechanisms responsible for the increased TASK‐1 expression in AF are not known. We hypothesized that miRNAs are responsible for the regulation of the KCNK3 gene, encoding for TASK‐1. We used bioinformatics prediction tools to select miRNAs potentially regulating KCNK3 and studied their expression in atrial tissue samples obtained from patients with SR, paroxysmal AF (pAF), or chronic AF (cAF). We selected miRNAs that were differentially expressed in AF and analyzed their involvement in regulating KCNK3 gene expression and TASK‐1 protein expression in human induced pluripotent stem cells (hiPSCs). Finally, we investigated associations between clinical parameters and miRNA expression in atrial tissue samples from patients with AF or SR.
Methods
The data that support the findings of this study (if not already provided with this article) are available from the corresponding author upon reasonable request.
Study Patients
Right atrial appendage samples were obtained from 61 patients (mean age 69.4±10 years; male/female 43/18) undergoing open heart surgery for aortocoronary bypass grafting or aortic valve replacement. Patients were stratified according to their rhythm status of either SR (n=23), pAF (n=21), or cAF (n=17). As TASK‐1 expression can be influenced by left ventricular dysfunction, the patient cohort was balanced for left ventricular ejection fraction. Furthermore, clinical baseline characteristics, medication, and laboratory diagnostics were assessed at the day of admission (Table). Two additional patients with SR were included for the analysis of circulating miR‐34a. The study protocol including human tissue samples was approved by the ethics committee of the Medical Faculty Heidelberg (grant number S–017/2013). Written informed consent was obtained from all individual participants by qualified medical personnel at least the day before surgery.
Table 1.
Baseline Characteristics of Study Patients
| SR (n=23) | pAF (n=21) | cAF (n=17) | |
|---|---|---|---|
| Demographics | |||
| Female sex, n (%) | 5 (21.7) | 9 (42.9) | 4 (23.5) |
| Age, y | 67.5±11.5 | 70.7±8.7 | 70±9.4 |
| Height, cm | 173.9±7.5 | 170.8±8.5 | 178.4±9.9* |
| Body weight, kg | 86.3±13.6 | 82.5±24.1 | 96.2±13.3 |
| Body mass index, kg/m2 | 28.6±4.4 | 28.3±8.8 | 30.4±4.8 |
| Smoker, n (%) | 10 (43.5) | 9 (42.9) | 8 (47.1) |
| Echocardiography | |||
| LV ejection fraction, % | 36.9±11.9 | 41.1±8.8 | 36.6±15.9 |
| LV end‐systolic diameter, mm | 37.6±13.7 | 36.9±9.3 | 47.6±7.2 |
| LV end‐diastolic diametr, mm | 51.8±16.3 | 50.2±8.6 | 57.2±7 |
| Septal wall, mm | 13.2±2.3 | 14.7±2.4 | 10.6±5.1 |
| Left atrial diameter, mm | 43.1±4.6 | 45.4±4.2 | 50±6.3 |
| Medical history, n (%) | |||
| CAD | 11 (47.8) | 11 (52.4) | 7 (41.2) |
| Myocardial infarction | 6 (26.1) | 9 (42.9) | 2 (11.8) |
| AVD | 4 (17.4) | 9 (42.9) | 6 (35.3) |
| Mitral valve disease | 0 (0) | 0 (0) | 1 (5.9) |
| CAD+AVD | 7 (30.4) | 1 (4.8)* | 3 (17.6) |
| LV assist device | 1 (4.3) | 0 (0) | 0 (0) |
| Hypertension | 23 (100) | 21 (100) | 16 (94.1) |
| Diabetes | 6 (26.1) | 9 (42.9) | 7 (41.2) |
| Chronic obstructive pulmonary disease | 0 (0) | 2 (9.5) | 4 (23.5) † |
| Concomitant medication, n (%) | |||
| Angiotensin‐converting enzyme inhibitor | 9 (39.1) | 10 (47.6) | 9 (52.9) |
| Angiotensin II receptor type 1‐antagonists | 4 (17.4) | 5 (23.8) | 3 (17.6) |
| Diuretics | 12 (52.2) | 13 (61.9) | 13 (76.5) |
| Statins | 17 (73.9) | 16 (76.2) | 12 (70.6) |
| Digitalis | 1 (4.3) | 1 (4.8) | 2 (11.8) |
| Amiodarone | 0 (0) | 1 (4.8) | 3 (17.6) |
AVD indicates aortic valve disease; CAD, coronary artery disease; cAF, chronic atrial fibrillation; LV, left ventricular; pAF, paroxysmal atrial fibrillation; and SR, sinus rhythm.
*P<0.05, versus pAF and † P<0.05 versus SR from ANOVA followed by Bonferroni multiple comparisons procedure for continuous variables and from Fisher exact test for categorical variables.
Isolation of Circulating miRNAs From Peripheral Blood Samples
Following 2 consecutive centrifugation steps, EDTA plasma samples were stored at −80 °C. Total RNA extraction from 200 µL EDTA plasma was performed using the miRNeasy Serum/Plasma Kit (Qiagen, Hilden, Germany), according to the manufacturer’s protocols. For more details see Data S1.
Real‐Time Quantitative Polymerase Chain Reaction and Western Blot Analysis
Expression analysis and quantification of miRNA levels was performed using the TaqMan real‐time quantitative polymerase chain reaction (RT‐qPCR) system (Applied Biosystems, Foster City, CA). 5 , 19 Immunoblotting was carried out as described earlier. 19 For a more detailed description please refer to Data S1.
Molecular Biology and Xenopus Oocyte Electrophysiology
Copy RNA was synthesized, using the mMESSAGE mMACHINE T7 Transcription Kit (Thermo Fisher Scientific, Waltham, MA) and injected into stages V and VI defolliculated Xenopus laevis oocytes as described earlier 20 and in Data S1.
Animal Studies
Studies involving animal experiments, performed on Xenopus laevis frogs have been reported according to the Animal Research: Reporting of In Vivo Experiments guidelines for reporting experiments involving animals 21 and the investigation conforms to the guide for the Care and Use of Laboratory Animals (National Institutes of Health Publication 85–23) and the Directive 2010/63/EU of the European Parliament. Approval has been granted by the local Animal Welfare Committee (reference number G165‐19).
Cell Culture and Maintenance of hiPSCs
HiPSCs were derived from healthy donors by the Stanford Cardiovascular Institute Biobank, directed by Joseph C. Wu, via episomal reprogramming using Sendai‐Virus and transferred to Timon Seeger using a material transfer agreement. The cells were differentiated to a cardiomyocyte‐like phenotype using established protocols. 22 , 23 After differentiation they were kept in RPMI 1640 medium (Gibco, Thermo Fisher Scientific) supplemented with B27 (Gibco, Thermo Fisher Scientific). On days 25 to 35 they were seeded for transfection in 24‐ and 48‐well culture plates (Sarstedt, Nürmbrecht, Germany).
Transfection of hiPSCs
Transient transfection of hiPSCs with microRNA mimics or inhibitors (Qiagen) was performed using Lipofectamin 3000 without P3000 reagent (Life Technologies, Carlsbad, CA) according to manufacturer’s instructions. Transfections in 24‐well plates were performed using 25 pmol miRNA inhibitor with 12.5 µL Lipofectamin 3000 and 2.5 pmol miRNA mimic with 1.25 µL Lipofectamin 3000. Transfections in 48‐well plates were performed using 10 pmol miRNA inhibitor with 5 µL Lipofectamin 3000 and 1 pmol miRNA mimic with 0.5 µL Lipofectamin 3000. Cells were harvested 48 hours after transfection.
Bioinformatical Methods
The bioinformatical screening approach for identification of miRNAs that theoretically interact with human KCNK3 mRNA was performed using the microRNA.org and TargetScan databases. The microRNA.org website uses the miRanda algorithm for target predictions. This algorithm is based on a comparison of the complementarity of miRNAs to 3'‐untranslated regions. The binding energy of the miRNA‐mRNA duplex structure, the evolutionary conservation of the entire target site, and its position within the 3'‐untranslated region are calculated and included in the final result, which is a weighted sum of match and mismatch values for base pairs and gap penalties. TargetScan predicts biological interactions of miRNAs and mRNAs by screening the 3'‐untranslated region of a mRNA for the presence of conserved 8mer, 7mer, and 6mer sites that match the seed region of the respective miRNA. In addition, sites with mismatches in the seed region that are compensated by conserved 3' pairing are also included. Finally, the predictions are ranked, based on targeting efficiency estimated from the cumulative weighted Context++ scores of the sites and their probability of conserved targeting. 24 , 25
Statistical Analysis
GraphPad Prism 9 (GraphPad Software Inc., La Jolla, CA), ImageJ software version 1.51f 26 , and Microsoft Excel (Microsoft, Redmond, WA) software was used for evaluating qPCR and Western blot data. Statistical evaluations and cluster analyses of experimental and clinical data were conducted using MATLAB (The MathWorks, Natick MA). First, measurements of miRNA and proteins were normalized to medians of SR samples in 2 batches of performed experiments with n1=31 (10 with SR) and n2=30 (13 with SR) samples. Paired and unpaired t tests (2‐tailed tests) were applied to compare the statistical significance of the results. P<0.05 was considered statistically significant. Spearman rank‐order correlation coefficients were calculated for miRNA expression levels, numeric or rank‐ordered clinical parameters and mRNA levels (COL1A2 [collagen alpha‐2(I) chain], DDR2 [discoidin domain‐containing receptor 2], S100A4 [S100 calcium‐binding protein A4], TASK‐1). To assess changes in miRNA expression due to presence of binary features, log2 fold changes were calculated for the presence versus absence of the feature. Groups with present or absent features were compared using 1‐way ANOVA. The Benjamini‐Hochberg method was applied to correct for multiple testing. Comparisons with P<0.05 after adjustment for multiple testing were denoted as significant. Comparisons with P<0.05 before adjustment that failed significance after correction for multiple testing were regarded as tendency toward an increase or decrease. Hierarchical cluster trees were created using the complete‐linkage clustering algorithm.
Results
Differential Expression of miRNAs in AF
To study the molecular mechanisms, underlying functional upregulation of TASK‐1 currents in patients with AF, the posttranscriptional regulation of KCNK3 was assessed in detail. A bioinformatical screening for miRNAs that theoretically interact with the human KCNK3 mRNA using the microRNA.org and TargetScan databases yielded 16 potential miRNA candidates (Figure 1, red). We further included 7 miRNAs (miR‐1, miR‐21, miR‐26a, miR‐29b, miR‐30a, miR‐31, miR‐133a) that were previously associated with AF (Figure 1, black). Expression of these 23 miRNAs was quantified in right atrial appendage samples from patients with SR (n=23), pAF (n=21), and cAF (n=17; Figure 1) using a TaqMan‐based qPCR approach. A pool of miR‐26b, U47, and RNU6B expression was used as internal control. Abundance of miR‐133a, miR‐1, miR‐125a, miR‐26a, miR‐30a, and miR‐21 was highest among the selected miRNA candidates, whereof only miR‐125 was not already described to be associated with AF. Besides miR‐125 the most frequent miRNAs predicted to interact with KCNK3 are miR‐23a, miR‐23b, miR‐28, and miR‐34a.
Figure 1. miRNA expression levels.

Relative expression levels of miRNAs normalized to the geometric mean of miR‐26b, U47, and RNU6B. For miRNAs indicated in red, interactions with KCNK3 were predicted. For miRNAs indicated in black, an involvement in the pathophysiology of atrial fibrillation was previously described. Data shown as median with min to max (n=61). miRNA indicates microRNA; and Rel., relative.
To assess AF‐associated regulation of these miRNAs, expression in patients with pAF or cAF was compared with controls with SR (Figure 2). Figure 2A illustrates clusters of miRNA fold changes in all patients relative to the median of patients with SR. A cluster of miRNAs with an AF‐related increase in expression was observed (miR‐31, miR‐21, miR‐124, miR‐34a, miR‐23a, miR‐29b, miR‐1, miR‐133a, miR‐202, miR‐449a; purple horizontal bar in Figure 2A).
Figure 2. Differently expressed miRNAs.

A, Heat map of miRNAs fold change (log2) relative to median of sinus rhythm. Values in red are more and in blue are less abundant. B and C, Fold change (log2) of miRNA expression in paroxysmal atrial fibrillation (n=21; B) and chronic atrial fibrillation (n=17; C) compared with SR samples (means; error bars, standard error; *, P<0.05; **, P<0.01; ***, P<0.001 from t test followed by Bonferroni correction for n=23 comparisons). (D and E) Log2 fold changes for pAF (D) and cAF (E) relative to SR and negative log10‐scaled P values of t tests (horizontal dashed line, P=0.01). (F) Differential expression of miRNAs in cAF relative to SR. Expression levels relative to housekeeping genes and absolute values of log2 fold changes were analyzed to assess which miRNAs are abundant as well as differentially expressed (red font, predicted interaction with KCNK3; black font, previously described association with AF; means of n=61 patients±SEM are indicated). AF indicates atrial fibrillation; cAF, chronic atrial fibrillation; miRNA, microRNA; pAF, paroxysmal atrial fibrillation; and SR, sinus rhythm.
In patients with pAF and cAF, expression of miR‐9, miR‐28, and miR‐485 was significantly reduced (Figure 2B through 2E). Furthermore, miR‐338 was significantly downregulated in cAF. Significant upregulation of miR‐23a, miR‐34a, miR‐29b, miR‐21, and miR‐124 was observed in patients with cAF (Figure 2C, 2E). To identify miRNAs with possible pathophysiological relevance for AF, we plotted the overall expression level of each miRNA against the absolute values of fold changes in cAF (Figure 2F). In this visualization, those miRNAs that were most abundant and differentially expressed appear in the upper right corner. Among the differentially expressed miRNAs with highest expression levels and predicted interactions with KCNK3 were miR‐9, miR‐23a, miR‐28, miR‐34a, and miR‐124. These candidates were selected for further analysis.
Correlations Between Expression of miRNAs and KCNK3
In right atrial appendage tissue samples obtained from patients with cAF, a significant upregulation of KCNK3 mRNA by 44.0% (P=0.0079 from t test) could be observed (Figure 3A). Tissue samples from patients with pAF showed a tendency toward higher KCNK3 expression that did not reach statistical significance (28.0%; P=0.088 from t test). This is consistent with previous reports of TASK‐1 upregulation in AF. 5 , 19 , 27 One would expect that binding of miRNA to its target mRNA causes decreased translation and degradation, resulting in downregulation of the respective target protein. Therefore, AF‐mediated downregulation of miRNA would cause KCNK3 upregulation. This was observed for miR‐9 (downregulation in cAF by 48.8%; P<0.0001 from t test; Figure 3B) and miR‐28 (downregulation in cAF by 30.1%; P=0.0030 from t test; Figure 3C). In contrast, an increased expression in cAF was observed for miR‐23a (upregulation in cAF by 82.0%; P<0.0001 from t test; Figure 3D), miR‐34a (upregulation in cAF by 67.8%; P<0.0001 from t test; Figure 3E) and miR‐124 (upregulation in cAF of 111.3%; P=0.0089 from t test; Figure 3F). Furthermore, a negative correlation of KCNK3 mRNA levels and the respective miRNA expression would be expected. However, no significant negative correlations between KCNK3 and miRNA levels were observed. Instead, miR‐23a was positively correlated with KCNK3 mRNA (Spearman ρ=0.43; P=0.0005; Figure 3G through 3K).
Figure 3. Effect of heart rhythm on expression of KCNK3 and selected miRNAs.

(A through F) miRNA and KCNK3 expression levels in sinus rhythm (n=23), paroxysmal atrial fibrillation (n=21), and chronic atrial fibrillation (n=17); miRNA measurements were normalized to the geometric mean of miR‐26b, U47, and RNU6B, KCNK3 measurements to IPO8; boxes: medians, 25%‐ and 75%‐percentiles; whiskers: minimal and maximal values; P values of 2‐tailed t tests with P<0.05, regarded as significant, are indicated. (G through K) Expression levels of KCNK3 relative to miRNA expression levels (n=61; r, p, Spearman rank order correlation coefficients and P values). cAF indicates chronic atrial fibrillation; miRNA, microRNA; pAF, paroxysmal atrial fibrillation; and SR, sinus rhythm.
MiRNA‐Mediated Regulation of TASK‐1 Expression in hiPSC
To further analyze possible regulation of KCNK3 mRNA and TASK‐1 protein expression by miR‐9, miR‐23a, miR‐28, miR‐34a, and miR‐124, hiPSC were transfected with mimics or inhibitors of the respective miRNAs and KCNK3 mRNA (Figure 4A and 4B) as well as TASK‐1 protein expression (Figure 4C through 4F) was assessed via qPCR and immunoblot. Following transfection of miR‐9, miR‐23a, miR‐28, miR‐34a, or miR‐124 inhibitors, a significant downregulation of KCNK3 mRNA by miR‐34a inhibitor (42.2%, n=5; P=0.0066 from t test) compared with control could be observed (Figure 4A). On TASK‐1 protein levels this effect could be confirmed (67.4%, n=5; P=0.0020 from t test), with further downregulations of TASK‐1 by miR‐9 (62.2%, n=5, P=0.0055 from t test), miR‐23a (67.1%, n=5, P=0.0023 from t test), and miR‐124 (76.6%, n=5, P=0.0013 from t test) inhibitors (Figure 4C, and 4E).
Figure 4. Expression of KCNK3 in transfected hiPSCs.

Human induced pluripotent stem cells (hiPSC) were transfected with miRNA mimics, inhibitors, or controls. Expression was measured by real‐time PCR (qPCR; A and B) or Western blot (C through F) 48 hours after transfection. qPCR data normalized to IPO8 expression after transfection with miRNA inhibitors (A) or miRNA mimics (B) with respective controls (n=1–6). Representative Western blots of inhibitors (C) and mimics (D). Human TASK‐1 (hTASK‐1) protein relative to GAPDH for miRNA inhibitors (E) or miRNA mimics (F) with respective controls (means of n=5; error bars, SEM; P values of 2‐tailed t tests with P<0.05, regarded as significant, are indicated). miRNA indicates microRNA; qPCR, quantitative polymerase chain reaction; Rel., relative; and TASK‐1, tandem of P domains in a weak inward rectifying K+ channel (TWIK)–related acid sensitive K+ channel 1.
After transfection with miR‐9, miR‐23a, miR‐28, miR‐34a, and miR‐124 mimics a significant downregulation of KCNK3 mRNA by miR‐9 (40.7%, n=6; P=0.00044 from t test), miR‐23a (38.9%, n=6; P=0.00028 from t test), and miR‐34a (37.8%, n=6; P=0.00034 from t test) was observed (Figure 4B); however, no significant effect on TASK‐1 protein levels could be seen with only a trend toward an upregulation for miR‐124 and miR‐9 (Figure 4D and 4F).
Effects of miRNA Mimics and Inhibitors on the TASK‐1 Current in Xenopus laevis Oocytes
To study the effects of the respective miRNA mimics or inhibitors on TASK‐1 channel functionality, the heterologous expression system of Xenopus laevis oocytes was employed. Following co‐injection of KCNK3 mRNA in addition to different miRNA mimics or inhibitors, resting membrane potential (RMP) and whole cell potassium currents were measured 24 to 72 hours after injection, using the 2‐electrode voltage‐clamp technique. Currents were evoked by application of the pulse protocol depicted from a holding potential of –80 mV and currents were quantified at the end of the +20 mV voltage pulse (Figure 5A through 5E). Upon co‐injection of KCNK3 mRNA with the miR‐34a inhibitor Xenopus laevis oocytes displayed significantly higher RMPs as compare to cells, treated with a control inhibitor (RMPmiR‐34a inh. –42.4±3.0 mV; RMPCtrl inh. –51.8±2.8 mV; n=21–24; P=0.026 from t test; Figure 5F and 5G). Outward potassium currents of cells, receiving the miR‐34a inhibitor, however, did not differ from cells with the control inhibitor (n=21–24; P=0.84; 026 from t tests; Figure 5A and 5C). Upon co‐injection of KCNK3 mRNA together with the miR‐34a mimic, a reduction in RMPs from –55.0±1.4 mV (control mimic) to –64.29±1.1 mV (miR‐34a mimic; n=24–28; P<0.0001 from t test) could be observed (Figure 5F and 5H). This was accompanied by higher TASK‐1 currents (control mimic: 1.82±0.14 µA; miR‐34a mimic: 2.49±0.24 µA; n=24–28; P=0.02 from t test; Figure 5A and 5B). No statistically significant changes in RMPs and potassium currents were observed after co‐injecting mimics or inhibitors of miR‐9, miR‐23a, miR‐28 or miR‐124 (Figure 5A, 5F).
Figure 5. TASK‐1 is regulated by miR‐34a.
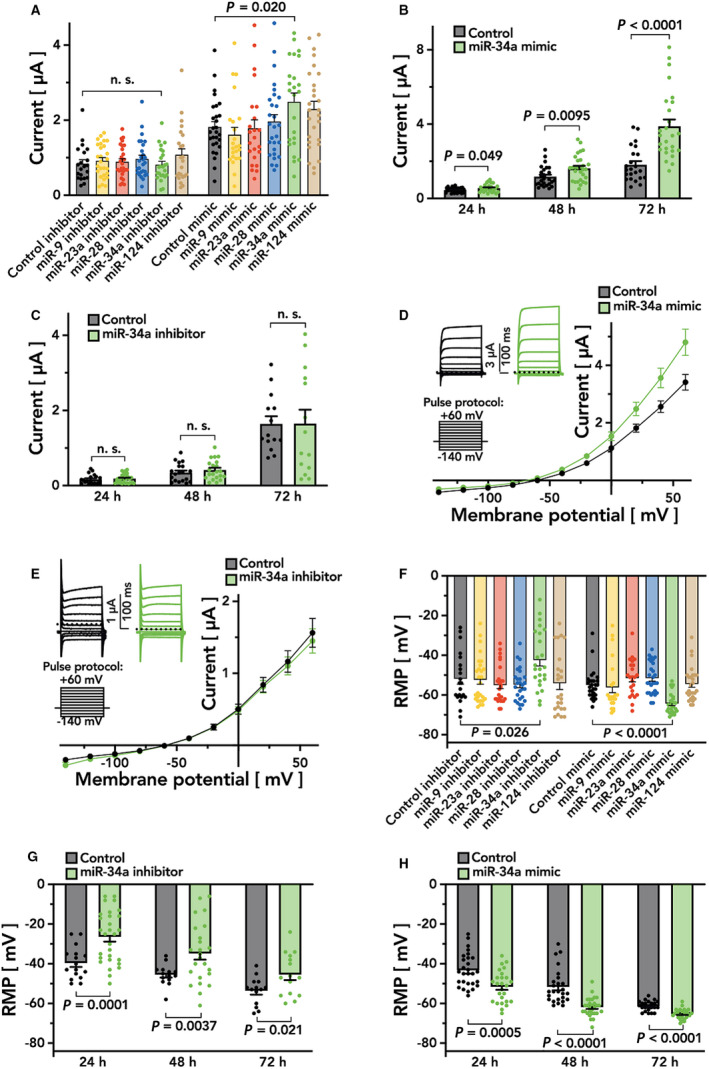
Effects of miRNA mimics and inhibitors on resting membrane potential (RMP) and transmembrane current in Xenopus laevis oocytes after co‐injection with TASK‐1 were quantified. A, Current measurements 48 hours after co‐injection of all tested miRNAs with TASK‐1 (means of n=21–28; error bars, SEM). (B and C) Current measurements 24–72 hours after co‐injection of TASK‐1 with miR‐34a mimic (B, green) or miR‐34a inhibitor (C, green) in comparison to controls (grey; means of n=14–29; error bars, SEM). (D and E) Current‐voltage‐relation 48 hours after co‐injection of TASK‐1 with miR‐34a mimic (D, green) or miR‐34a inhibitor (E, green) in comparison to controls (grey, n=21–28). (F) RMP measurements 48 hours after co‐injection of all tested miRNAs with TASK‐1 (n=21–28). (G and H) Measurements of RMP 24 to 72 hours after co‐injection of TASK‐1 with miR‐34a inhibitor (G, green) or miR‐34a mimic (H, green) in comparison to controls (grey, means of n=14–29; error bars, SEM; P<0.05 of 2‐tailed t tests were indicated). miRNA indicates microRNA; and TASK‐1, tandem of P domains in a weak inward rectifying K+ channel (TWIK)–related acid sensitive K+ channel 1.
Figure 5D and 5E depict the current‐voltage relationship of the respective TASK‐1 currents. A significant increase in TASK‐1 current can be observed upon co‐injection of KCNK3 mRNA and the miR‐34a mimic (Figure 5D) whereas application of the miR‐34a inhibitor did not results in significant current changes (Figure 5E). The effect of the miR‐34a mimic on the RMP could be observed to a similar extent at either 24, 48, or 72 hours after injection (Figure 5H), whereas a time‐dependent effect on outward potassium currents could be observed, showing a maximum at 72 hours after injection (Figure 5B). In a similar fashion, comparable effects of the miR‐34a inhibitor on the cell’s RMPs could be observed after 24, 48, and 72 hours (Figure 5G). Again, outward potassium currents did not differ between cells co‐injected with the miR‐34a inhibitor or a control inhibitor (Figure 5C).
Association and Cluster Analysis of miRNA Expression and Clinical Patient Characteristics
We further studied associations between miRNA expression and clinical parameters of our patient cohort. For these analyses, further miRNAs that were previously shown to be involved in AF remodeling were included (miR‐1, miR‐21, miR‐26a, miR‐29b, miR‐30a, miR‐31, and miR‐133a). 12 , 13 , 14 , 28 , 29 , 30 , 31 , 32 , 33 As some of these miRNAs are associated with structural remodeling and fibrosis, we also included COL1A2, DDR2, and S100A4 mRNA levels as genetic markers of fibrosis.
For continuous and rank‐ordered parameters, we performed hierarchical clustering of rank‐order correlation coefficients between miRNA expression levels and parameter values (Figure 6A). A group of parameters associated with myocardial dilatation and AF (left atrial diameter, left ventricular end‐diastolic diameter, left ventricular end‐systolic diameter, and AF stage) that further contained TASK‐1 and COL1A2 expression levels was associated with increased expression of miR‐25, miR‐21, miR‐34a, miR‐23a, miR‐124, miR‐1, and miR‐29b (as part of a cluster indicated in Figure 6A by a horizontal maroon and a vertical purple bar). Tendencies toward positive correlation in the same cluster were observed for miR‐31, miR‐449a, miR‐133a, miR‐23b, miR‐125b, and miR‐30a. These parameters were further associated with reduced expression of miR‐9 and miR‐485 (part of a cluster indicated by a horizontal blue and a vertical purple bar). In addition, tendencies toward negative correlation in this cluster of myocardial dilatation parameters were observed for miR‐26a, miR‐28, miR‐193a, miR‐338, and miR‐708. Furthermore, a significant negative correlation was observed between creatinine and miR‐193a. DDR2 was negatively correlated with miR‐34a and miR‐23a. The parameter DDR2 showed tendencies toward negative correlations with miR‐21, miR‐124, miR‐133a, miR‐1, miR‐29b, and miR‐23b and tendencies toward positive correlations with miR‐193a, miR‐9, and miR‐708.
Figure 6. Associations between clinical parameters and miRNA expression.

A, Clusters of rank‐order correlation coefficients (Spearman) for numeric or rank‐ordered parameters and miRNA expression. Dendrogram groups of miRNAs and clinical parameters are indicated by colored bars and grey separation lines (miRNA groups: maroon, orange, blue; parameter groups: purple, grey, yellow; grey squares, P<0.05; black squares, P<pcrit,BH=7.6⋅10‐4 from Benjamini‐Hochberg adjustment for multiple‐testing; (B) Clusters of log2 fold changes of miRNA expression dependent on presence vs absence of binary features (grey squares, P<0.05 from 1‐way ANOVA; black squares, P<pcrit,BH=2.2⋅10‐6 from Benjamini‐Hochberg adjustment for multiple‐testing; dendrogram groups are indicated by colored bars and grey separation lines. ACE indicates angiotensin‐converting enzyme; AF, atrial fibrillation; ALT/GPT, alanine transaminase/glutamic‐pyruvic transaminase; AST/GOT, aspartate transaminase/glutamic oxaloacetic transaminase; AT1, angiotensin II receptor type 1; AVR, aortic valve replacement; BMI, body mass index; CABG, coronary artery bypass graft; COL1A2, collagen alpha‐2(I) chain; COPD, chronic obstructive pulmonary disease; CRP, C‐reactive protein; DDR2, discoidin domain‐containing receptor 2; DOAC, direct oral anticoagulant drug; EDD, end‐diastolic diameter; ESD, end‐systolic diameter; GFR (CKD‐E), glomerular filtration rate from Chronic Kidney Epidemiology Collaboration formula; HCT, hydrochlorothiazide intake; MDRD, Modification of Diet in Renal Disease; GGT, gamma‐glutamyl transferase; LA; left atrium; LDH, lactate dehydrogenase; LV, left ventricle; LVEF, LV ejection fraction; MCH, mean corpuscular hemoglobin; MCHC, mean corpuscular hemoglobin concentration; MCV, mean corpuscular volume; miRNA, microRNA; PCI, percutaneous coronary intervention; RBC, red blood cell count; RDW‐CV, red cell distribution width coefficient of variation; S100A4, S100 calcium‐binding protein A4; and TASK‐1, tandem of P domains in a weak inward rectifying K+ channel (TWIK)–related acid sensitive K+ channel 1.
For binary clinical parameters, we clustered log2 fold changes of miRNA expression levels for presence of the respective attribute (Figure 6B). The association between antiplatelet drug intake and an increased expression of miR‐193a that was still significant following Benjamini‐Hochberg adjustment for multiple‐testing is indicated by a black square. Again, effects with P<0.05, indicated by grey squares, were regarded as tendency toward increased or decreased expression and used to describe groups of effects associated with several clinical parameters or miRNAs. Further, antiplatelet drug intake was associated with tendencies toward decreased expression of miR‐26a, miR‐708, and miR‐202. The parameter intake of hydrochlorothiazide showed tendencies toward decreases in expression of miR‐21, miR‐34a, and miR‐23a (also part of the cluster associated with myocardial dilatation parameters, Figure 6A) as well as a tendency toward increased expression of miR‐28. Moreover, a tendency toward increased expression of miR‐31 was observed for patients with intake of a direct oral anticoagulant or an angiotensin II receptor type 1 blocker. Presence of chronic obstructive pulmonary disease was associated with tendentially increased expression of miR‐21 and miR‐23a that was also positively correlated with AF stage. This seems coherent with the observed associations of miRNA expression with myocardial dilatation owing to the pathophysiological link between chronic obstructive pulmonary disease and right heart strain as well as dilatation.
Furthermore, clusters of correlation coefficients for miRNA expression indicated groups of miRNAs with similar expression characteristics (Figure S1). In particular, 4 groups of co‐expressed miRNAs were observed (I: miR‐1, miR‐21, miR‐23a, miR‐29b, miR‐31, miR‐34a, miR‐124, and miR‐133a; II: miR‐23b, miR‐25, miR‐125b, and miR‐874; III: miR‐9, miR‐26a, miR‐28, miR‐30a, miR‐193a, and miR‐338; and IV: miR‐202, miR‐215, miR‐449a, miR‐485, and miR‐708). Because previous investigations of electrical remodeling revealed links between AF and heart failure, we separately analyzed associations of these factors with miRNA expression by 2‐factor ANOVA (Figure S2). Whereas the factor “AF” showed significant associations for several miRNAs, no significant associations were observed for heart failure following correction for multiple testing. Only 1 significant interaction between AF and heart failure was observed for miR‐449a.
Collectively, correlations between miRNA expression and clinical parameters revealed a cluster of clinical parameters associated with myocardial dilatation in patients with AF. Parameters involved in myocardial dilatation showed significant correlations with a group of miRNAs comprising miR‐1, miR‐9, miR‐21, miR‐23a, miR‐25, miR‐29b, miR‐34a, miR‐124, and miR‐485.
An analysis of circulating miR‐34a in peripheral blood samples that were available from 16 individuals revealed significantly higher levels in patients with AF compared with controls with SR (n=5–11; P=0.028; Figure 7A). When patients with AF were substratified into pAF and cAF groups, there was a significant increase in circulating miR‐34a levels in the pAF group (n=5; P=0.0046; Figure 7B) whereas a trend was observed in the cAF group that failed to reach statistical significance (n=5–6; P=0.12; Figure 7B). With increasing atrial miR‐34a or KCNK3 levels, an increase in circulating miR‐34a in peripheral blood was found within the analyzed patients (Figure 7C and 7D).
Figure 7. Analysis of circulating miR‐34a levels.

A through D, Circulating miR‐34a level were analyzed from peripheral blood samples of SR (n=5, ie 3 patients from the study population and 2 additional matched SR controls), pAF (n=5 patients from the study population), and cAF (n=6 patients from the study population). Circulating levels of miR‐34a tended to be higher in patients with increased atrial miR‐34a tissue levels (C) or with increased atrial KCNK3 mRNA levels (D). Means of n=5–6 are presented relative to the internal standard miR‐16 (for circulating miR‐34a), the aforementioned pool (tissue levels of miR‐34a) or IPO8 (KCNK3); error bars, SEM; P values of 2‐tailed t tests with P<0.05, regarded as significant, are indicated. cAF indicates chronic atrial fibrillation; miRNA indicates microRNA; pAF, paroxysmal atrial fibrillation; and SR, sinus rhythm.
Discussion
The goal of this study was to gain insights into the mechanism responsible for upregulation of TASK‐1 expression associated with AF. To this end, we investigated a potential direct regulation of KCNK3 mRNA and therefore TASK‐1 protein by miRNAs in AF. We identified miRNAs that are abundantly expressed and strongly regulated by AF stages, validated associations with TASK‐1 expression by cellular electrophysiology experiments, and identified clusters of affected miRNAs and clinical parameters.
Several miRNAs of those predicted as direct regulators of KCNK3 mRNA were positively (miR‐23a, miR‐34a, and miR‐124) or negatively correlated with KCNK3 expression (miR‐9 and miR‐28) (see Table S1 for published knowledge of these miRNAs in the context of AF). Negative correlation of miRNA with its target mRNA is plausible because of miRNA‐mediated repression of translation and induction of mRNA degradation, whereas the expression of miRNA/mRNA pairs can be positively correlated as well. 34 , 35 , 36 This positive correlation was explained by regulatory networks that include feedback motifs. 36 , 37 , 38 In this case, an external stimulus results in increased transcription and mRNA expression, and a negative feedback mechanism could result in increased expression of the miRNA that inhibits the gene. This would result in a positive correlation between mRNA and miRNA levels. In other cases, miRNA/mRNA pairs can depend on the same transcription factor or can be part of the same transcriptional modules. 34 , 36 , 38 Further, a mechanism was described by which miRNAs can directly increase the translation of their target mRNAs through miRNA facilitated recruiting and binding of translation activating protein complexes. 39
Transfection of the miRNA candidates into hiPSCs followed by qPCR and Western blot analysis revealed significant effects. The inhibitors of the positively correlated miRNAs (miR‐23a, miR‐34a, and miR‐124) led to significant downregulation of TASK‐1 protein levels as their enhancing effect on the expression of TASK‐1 was abolished. For miR‐34 this effect was even visible on mRNA level. This could either be explained by the time between isolation and transfection. mRNA, after being degraded by miRNA, has already been restored but proteins take a longer time to be expressed, resulting in normal mRNA levels but decreased protein levels. Another possible explanation are feedback loops, leading to increased mRNA levels after reduction of protein levels. 40 , 41
In contrast to the inhibitors, the mimics of these miRNAs led to only a slight effect. On protein levels no significant change was observed, but a trend toward increased expression is seen for miR‐124 and normal expression levels for miR‐34a and miR‐23a compared with transfection control.
A regulatory effect of miR‐124 and miR‐34a on TASK‐1 has already been described in cells infected with HIV‐1. 42 There, a downregulation of TASK‐1 by miR‐124 and miR‐34a has been observed. Although this is in contrast to our data, it can be explained by the experimental setting. The regulatory network of the interaction between miRNA and mRNA is a highly complex system. HIV‐1 infection may influence this system, leading to different results compared with noninfected cells. Further, in human pulmonary artery smooth muscle cells the transfection with miR‐34a mimic led to a strong increase of TASK‐1 expression, which is in line with our observed results. 43
The negatively correlated miRNAs (miR‐9 and miR‐28) showed inconclusive results. Whereas miR‐9 led to an upregulation of TASK‐1, miR‐28 showed no change in expression. This effect is unexpected for a negatively correlated miRNA as the upregulation of the miRNA should lead to the downregulation of the affected protein. Therefore, an involvement of these miRNAs in the regulation of TASK‐1 expression is not likely.
To further validate our observations of changed expression levels in AF, correlation between miRNAs and KCNK3 and their significant effects on KCNK3 mRNA and TASK‐1 protein expression, electrophysiological experiments have been performed. Co‐expression of KCNK3 with miR‐34a resulted in increased TASK‐1 currents, confirming the already described upregulation of TASK‐1. Therefore, in line with our other data it can be concluded that miR‐34a positively regulates TASK‐1 expression in AF. Further, the RMP decrease by miR‐34a mimic and the RMP increase by miR‐34a inhibitor are consistent with a previous study that showed an RMP destabilization in response to TASK‐1 knockdown. 44
We found several miRNAs that were differentially expressed in AF and are therefore of interest for future research. In previous studies, reduced expression of miR‐9 has been associated with cardiac fibrosis and hypertrophy that may both play a role in cardiac remodeling in AF. 45 , 46 Similarly, miR‐23a has been shown to be prohypertrophic and to be regulated by the transcription factor NFATc3. 47 For miR‐34a a potential role in early electrophysiological remodeling in AF has been proposed via regulation of ankyrin‐B. 48 Also, miR‐34a is reported to be induced in the aging heart and to reduce cardiac contractile function by inducing DNA damage responses and telomere attrition. 49 Considering that AF is common in the aged population, miR‐34a upregulation might play a role in the pathogenesis of AF.
To investigate associations of miRNA expression with different clinical patient characteristics, we performed a cluster analysis that yielded a variety of correlations between miRNA expression and different clinical parameters. Most interestingly, the parameters left atrial diameter, left ventricular end‐systolic diameter, left ventricular end‐diastolic diameter, AF stage and expression of TASK‐1 and COL1A2 in atrial samples clustered with a group of miRNAs. This cluster is indicative of pathophysiological processes associated with dilatation and fibrosis that are closely linked to AF. Previously, the end‐systolic diameter and end‐diastolic diameter of the left ventricle as well as left atrial diameter were identified as strong predictors of AF. 50 In the future, analyzing transcriptional modules associated with these miRNAs could reveal pathways associated with the molecular pathology of AF. Known associations of miRNAs with AF could be confirmed (miR‐21, miR‐29b, and miR‐34a) and new associations with AF were identified (miR‐9, miR‐23a, miR‐485).
According to our analysis of miRNA‐expression in the atrial myocardium, indicators of myocardial dilatation (left atrial diameter, left ventricular end‐diastolic diameter, left ventricular end‐systolic diameter) grouped together with AF stage, TASK‐1 expression, and COL1A2, a marker of tissue fibrosis. It is interesting to note that these pathophysiologically reasonable associations were derived only from experimental measurements of miRNA expression. This suggests that miRNA expression changes are linked to the pathophysiological continuum of myocardial strain, dilatation, tissue fibrosis, and the appearance of AF. Functional links between miRNAs and cellular pathways involved in cell growth, inflammation, or differentiation are well characterized. Therefore, understanding associations between miRNA expression and clinical determinants of atrial cardiomyopathy is relevant for identifying links to underlying cellular processes that can be targeted using modulators of the involved cellular pathways.
In a small subgroup of the analyzed patient collective in which blood samples were available, it could be observed that miR‐34a levels circulating in peripheral blood were significantly upregulated in AF (Figure 7). Further studies on larger patient populations are, however, warranted to assess whether this indicates that atrial miR‐34a are released into the bloodstream, where they could serve as biomarkers of atrial cardiomyopathy. Nevertheless, the diagnostic value might be limited by the fact that altered levels of circulating miR‐34a have also been described in patients suffering from oncological diseases (Ewing sarcoma, acute myeloid leukemia, prostate cancer, or breast cancer), Alzheimer’s disease, or coronary heart disease. 51 , 52 , 53 , 54 , 55 , 56
Limitations
The sample size of this study is limited owing to restricted access to human tissue samples. Although, the present study cohort, containing 61 patients, is large compared with other studies that investigated changes in miRNA expression in AF, increasing our sample size would allow identifying associations between single clinical parameters and expression of miRNAs with higher statistical power. Another limitation is that tissue samples are restricted to the right atrial appendage. Therefore, it is possible that significant changes between the appendage and other parts of the atrium or the left atrium are not assessed. Some miRNA candidates were included in the analysis because of their predescribed association with atrial cardiomyopathy (miR‐1, miR‐21, miR‐26a, miR‐29b, miR‐30a, miR‐31, miR‐133a). In these cases, correlation of miRNA and TASK‐1 levels may also be explained solely by the shared association with AF. Furthermore, as the samples are from patients undergoing heart surgery, no healthy control group is available. The use of miRNA mimics and inhibitors is suitable for testing effects of miRNAs on specific target genes. However, results obtained via transient transfection with miRNA mimics and inhibitors have to be interpreted with caution, as they can have unspecific side effects on gene expression. Also, following transfection, they may be located in intracellular vesicles, and therefore not accessible for loading into Argonaute as functionally active miRNAs. 57 , 58
Conclusion
Taken together our results point towards an important pathophysiological involvement of miRNAs in regulating the expression of the TASK‑1 potassium channel in AF. Here, miR‐34a was identified to regulate the expression of atrial TASK‐1. The correlation of miRNA levels in the atrium with clinical parameters may suggest that subtypes of atrial fibrillation can be differentiated by analyzing miRNA expression. Further studies will validate the relevance of circulating miRNAs in predicting the presence of atrial cardiomyopathy.
Sources of Funding
This study was supported in part by research grants from the German Center for Cardiovascular Research (DZHK) (Excellence Grant to C.S.; Excellence Program: Postdoc Start‐up Grant to F.W.); from the German Cardiac Society (DGK) (Research Scholarship DGK082018 to F.W., Otto‐Hess Fellowship to F.W.); from the German Heart Foundation/German Foundation of Heart Research (F/15/18 to F.W., F/41/15 to C.S., Kaltenbach Scholarship to F.W. and A.B.); from the Joachim‐Herz Foundation (Addon‐Fellowship for Interdisciplinary Life Sciences to F.W.), and from the German Research Foundation (DFG) (SCHM 3358/1‐1 to C.S., and SFB 1425 to C.S.) and EKFS Fellowship to C.S.
Disclosure
The authors declare that the research was conducted in the absence of any commercial or financial relationships that could be construed as a potential conflict of interest.
Supporting information
Acknowledgments
We thank Sabine Höllriegel, Lisa Künstler, and Katrin Kupser for excellent technical support. The iPSC cells were kindly provided to T.S. by the Stanford Cardiovascular Institute Biobank.
F. Wiedmann and M. Kraft contributed equally.
For Sources of Funding and Disclosures, see page 14.
References
- 1. Chugh SS, Havmoeller R, Narayanan K, Singh D, Rienstra M, Benjamin EJ, Gillum RF, Kim Y‐H, McAnulty JH, Zheng Z‐J, et al. Worldwide epidemiology of atrial fibrillation: a Global Burden of Disease 2010 Study. Circulation. 2014;129:837–847. doi: 10.1161/CIRCULATIONAHA.113.005119 [DOI] [PMC free article] [PubMed] [Google Scholar]
- 2. Frustaci A, Chimenti C, Bellocci F, Morgante E, Russo MA, Maseri A. Histological substrate of atrial biopsies in patients with lone atrial fibrillation. Circulation. 1997;96:1180–1184. doi: 10.1161/01.CIR.96.4.1180 [DOI] [PubMed] [Google Scholar]
- 3. Xu J, Cui G, Esmailian F, Plunkett M, Marelli D, Ardehali A, Odim J, Laks H, Sen L. Atrial extracellular matrix remodelling and the maintenance of atrial fibrillation. Circulation. 2004;109:363–368. [DOI] [PubMed] [Google Scholar]
- 4. Dobrev D, Friedrich A, Voigt N, Jost N, Wettwer E, Christ T, Knaut M, Ravens U. The G protein‐gated potassium current IK, ACh is constitutively active in patients with chronic atrial fibrillation. Circulation. 2005;112:3697–3706. [DOI] [PubMed] [Google Scholar]
- 5. Schmidt C, Wiedmann F, Voigt N, Zhou XB, Heijman J, Lang S, Albert V, Kallenberg S, Ruhparwar A, Szabo G, et al. Upregulation of K2P3.1 K+ current causes action potential shortening in patients with chronic atrial fibrillation. Circulation. 2015;132:82–92. [DOI] [PubMed] [Google Scholar]
- 6. Voigt N, Heijman J, Wang Q, Chiang DY, Li N, Karck M, Wehrens XHT, Nattel S, Dobrev D. Cellular and molecular mechanisms of atrial arrhythmogenesis in patients with paroxysmal atrial fibrillation. Circulation. 2014;129:145–156. doi: 10.1161/CIRCULATIONAHA.113.006641 [DOI] [PMC free article] [PubMed] [Google Scholar]
- 7. Voigt N, Li N, Wang Q, Wang W, Trafford AW, Abu‐Taha I, Sun Q, Wieland T, Ravens U, Nattel S, et al. Enhanced sarcoplasmic reticulum Ca2+ leak and increased Na+‐Ca2+ exchanger function underlie delayed afterdepolarizations in patients with chronic atrial fibrillation. Circulation. 2012;125:2059–2070. [DOI] [PMC free article] [PubMed] [Google Scholar]
- 8. Poudel P, Xu Y, Cui Z, Sharma D, Tian B, Paudel S. Atrial fibrillation: recent advances in understanding the role of microRNAs in atrial remodelling with an electrophysiological overview. Cardiology. 2015;131:58–67. [DOI] [PubMed] [Google Scholar]
- 9. Bartel DP. MicroRNAs: genomics, biogenesis, mechanism, and function. Cell. 2004;116:281–297. doi: 10.1016/S0092-8674(04)00045-5 [DOI] [PubMed] [Google Scholar]
- 10. Filipowicz W, Bhattacharyya SN, Sonenberg N. Mechanisms of post‐transcriptional regulation by microRNAs: are the answers in sight? Nat Rev Genet. 2008;9:102–114. doi: 10.1038/nrg2290 [DOI] [PubMed] [Google Scholar]
- 11. Luo X, Yang B, Nattel S. MicroRNAs and atrial fibrillation: mechanisms and translational potential. Nat Rev Cardiol. 2015;12:80–90. doi: 10.1038/nrcardio.2014.178 [DOI] [PubMed] [Google Scholar]
- 12. Luo X, Pan Z, Shan H, Xiao J, Sun X, Wang N, Lin H, Xiao L, Maguy A, Qi X‐Y, et al. MicroRNA‐26 governs profibrillatory inward‐rectifier potassium current changes in atrial fibrillation. J Clin Invest. 2013;123:1939–1951. doi: 10.1172/JCI62185 [DOI] [PMC free article] [PubMed] [Google Scholar]
- 13. Adam O, Löhfelm B, Thum T, Gupta SK, Puhl SL, Schäfers HJ, Böhm M, Laufs U. Role of miR‐21 in the pathogenesis of atrial fibrosis. Basic Res Cardiol. 2012;107:278. doi: 10.1007/s00395-012-0278-0 [DOI] [PubMed] [Google Scholar]
- 14. Thum T, Gross C, Fiedler J, Fischer T, Kissler S, Bussen M, Galuppo P, Just S, Rottbauer W, Frantz S, et al. MicroRNA‐21 contributes to myocardial disease by stimulating MAP kinase signalling in fibroblasts. Nature. 2008;456:980–984. doi: 10.1038/nature07511 [DOI] [PubMed] [Google Scholar]
- 15. Decher N, Wemhöner K, Rinné S, Netter MF, Zuzarte M, Aller MI, Kaufmann SG, Li XT, Meuth SG, Daut J, et al. Knock‐out of the potassium channel TASK‐1 leads to a prolonged QT interval and a disturbed QRS complex. Cell Physiol Biochem. 2011;28:77–86. doi: 10.1159/000331715 [DOI] [PubMed] [Google Scholar]
- 16. Donner BC, Schullenberg M, Geduldig N, Huning A, Mersmann J, Zacharowski K, Kovacevic A, Decking U, Aller MI, Schmidt KG. Functional role of TASK‐1 in the heart: studies in TASK‐1‐deficient mice show prolonged cardiac repolarization and reduced heart rate variability. Basic Res Cardiol. 2011;106:75–87. doi: 10.1007/s00395-010-0128-x [DOI] [PubMed] [Google Scholar]
- 17. Skarsfeldt MA, Jepps TA, Bomholtz SH, Abildgaard L, Sørensen US, Gregers E, Svendsen JH, Diness JG, Grunnet M, Schmitt N, et al. pH‐dependent inhibition of K2P3.1 prolongs atrial refractoriness in whole hearts. Pflugers Arch. 2016;468:643–654. doi: 10.1007/s00424-015-1779-0 [DOI] [PubMed] [Google Scholar]
- 18. Feliciangeli S, Chatelain FC, Bichet D, Lesage F. The family of K2P channels: salient structural and functional properties. J Physiol. 2015;593:2587–2603. [DOI] [PMC free article] [PubMed] [Google Scholar]
- 19. Schmidt C, Wiedmann F, Zhou XB, Heijmann J, Voigt N, Ratte A, Lang S, Kallenberg SM, Campana C, Waymann A, et al. Inverse remodelling of K2P3.1 K+ channel expression and action potential duration in left ventricular dysfunction and atrial fibrillation: implications for patient‐specific antiarrhythmic drug therapy. Eur Heart J. 2017;38:1764–1774. [DOI] [PubMed] [Google Scholar]
- 20. Wiedmann F, Schlund D, Voigt N, Ratte A, Kraft M, Katus HA, Schmidt C. N‐glycosylation–dependent regulation of hK2P17.1 currents. Mol Biol Cell. 2019;30:1425–1436. [DOI] [PMC free article] [PubMed] [Google Scholar]
- 21. Percie du Sert N, Ahluwalia A, Alam S, Avey MT, Baker M, Browne WJ, Clark A, Cuthill IC, Dirnagl U, Emerson M, et al. Reporting animal research: explanation and elaboration for the ARRIVE guidelines 2.0. PLOS Biol. 2020;18:e3000411. doi: 10.1371/journal.pbio.3000411 [DOI] [PMC free article] [PubMed] [Google Scholar]
- 22. Burridge PW, Matsa E, Shukla P, Lin ZC, Jared M, Gold JD, Wu JC. Chemically defined and small molecule‐based generation of human cardiomyocytes. Nat Methods. 2014;11:855–860. [DOI] [PMC free article] [PubMed] [Google Scholar]
- 23. Lian X, Zhang J, Azarin SM, Zhu K, Hazeltine LB, Bao X, Hsiao C, Kamp TJ, Paecek SP. Directed cardiomyocyte differentiation from human pluripotent stem cells by modulating Wnt/β‐catenin signaling under fully defined conditions. Nat Protoc. 2013;8:162–175. doi: 10.1038/nprot.2012.150 [DOI] [PMC free article] [PubMed] [Google Scholar]
- 24. Agarwal V, Bell GW, Nam JW, Bartel DP. Predicting effective microRNA target sites in mammalian mRNAs. eLife. 2015;4:e05005. [DOI] [PMC free article] [PubMed] [Google Scholar]
- 25. Betel D, Wilson M, Gabow A, Marks DS, Sander C. The microRNA.org resource: targets and expression. Nucleic Acids Res. 2008;36:D149–D153. doi: 10.1093/nar/gkm995 [DOI] [PMC free article] [PubMed] [Google Scholar]
- 26. Schneider CA, Rasband WS, Eliceiri KW. NIH Image to ImageJ: 25 years of image analysis. Nat Methods. 2012;9:671–675. doi: 10.1038/nmeth.2089 [DOI] [PMC free article] [PubMed] [Google Scholar]
- 27. Limberg SH, Netter MF, Rolfes C, Rinné S, Schlichthörl G, Zuzarte M, Vassiliou T, Moosdorf R, Wulf H, Daut J, et al. TASK‐1 channels may modulate action potential duration of human atrial cardiomyocytes. Cell Physiol Biochem. 2011;28:613–624. doi: 10.1159/000335757 [DOI] [PMC free article] [PubMed] [Google Scholar]
- 28. Cardin S, Guasch E, Luo X, Naud P, Le Quang K, Shi Y, Tardif JC, Comtois P, Nattel S. Role for MicroRNA‐21 in atrial profibrillatory fibrotic remodelling associated with experimental postinfarction heart failure. Circ Arrhythm Electrophysiol. 2012;5:1027–1035. [DOI] [PubMed] [Google Scholar]
- 29. Dawson K, Wakili R, Ördög B, Clauss S, Chen YU, Iwasaki Y, Voigt N, Qi XY, Sinner MF, Dobrev D, et al. MicroRNA29: a mechanistic contributor and potential biomarker in atrial fibrillation. Circulation. 2013;127:1466–1475. doi: 10.1161/CIRCULATIONAHA.112.001207 [DOI] [PubMed] [Google Scholar]
- 30. Duisters RF, Tijsen AJ, Schroen B, Leenders JJ, Lentink V, van der Made I, Herias V, van Leeuwen RE, Schellings MW, Barenbrug P, et al. miR‐133 and miR‐30 regulate connective tissue growth factor: implications for a role of microRNAs in myocardial matrix remodelling. Circ Res. 2009;104:170–178. doi: 10.1161/CIRCRESAHA.108.182535 [DOI] [PubMed] [Google Scholar]
- 31. Girmatsion Z, Biliczki P, Bonauer A, Wimmer‐Greinecker G, Scherer M, Moritz A, Bukowska A, Goette A, Nattel S, Hohnloser SH, et al. Changes in microRNA‐1 expression and IK1 up‐regulation in human atrial fibrillation. Heart Rhythm. 2009;6:1802–1809. doi: 10.1016/j.hrthm.2009.08.035 [DOI] [PubMed] [Google Scholar]
- 32. Li H, Li S, Yu B, Liu S. Expression of miR‐133 and miR‐30 in chronic atrial fibrillation in canines. Mol Med Rep. 2012;5:1457–1460. doi: 10.3892/mmr.2012.831 [DOI] [PubMed] [Google Scholar]
- 33. Reilly SN, Liu X, Carnicer R, Recalde A, Muszkiewicz A, Jayaram R, Carena MC, Wijesurendra R, Stefanini M, Surdo NC, et al. Up‐regulation of miR‐31 in human atrial fibrillation begets the arrhythmia by depleting dystrophin and neuronal nitric oxide synthase. Sci Transl Med. 2016;8:340ra74. doi: 10.1126/scitranslmed.aac4296 [DOI] [PMC free article] [PubMed] [Google Scholar]
- 34. Nunez YO, Truitt JM, Gorini G, Ponomareva ON, Blednov YA, Harris RA, Mayfield RD. Positively correlated miRNA‐mRNA regulatory networks in mouse frontal cortex during early stages of alcohol dependence. BMC Genom. 2013;14:1–21. doi: 10.1186/1471-2164-14-725 [DOI] [PMC free article] [PubMed] [Google Scholar]
- 35. Nunez‐Iglesias J, Liu CC, Morgan TE, Finch CE, Zhou XJ. Joint genome‐wide profiling of miRNA and mRNA expression in Alzheimer’s disease cortex reveals altered miRNA regulation. PLoS One. 2010;5:e8898. doi: 10.1371/journal.pone.0008898 [DOI] [PMC free article] [PubMed] [Google Scholar]
- 36. Sun J, Gong X, Purow B, Zhao Z. Uncovering microRNA and transcription factor mediated regulatory networks in glioblastoma. PLoS Comput Biol. 2012;8:e1002488. doi: 10.1371/journal.pcbi.1002488 [DOI] [PMC free article] [PubMed] [Google Scholar]
- 37. Inui M, Martello G, Piccolo S. MicroRNA control of signal transduction. Nat Rev Mol Cell Biol. 2010;11:252–263. doi: 10.1038/nrm2868 [DOI] [PubMed] [Google Scholar]
- 38. Martinez NJ, Ow MC, Barrasa MI, Hammell M, Sequerra R, Doucette‐Stamm L, Roth FP, Ambros VR, Walhout AJ. A C. elegans genome‐scale microRNA network contains composite feedback motifs with high flux capacity. Genes Dev. 2008;22:2535–2549. [DOI] [PMC free article] [PubMed] [Google Scholar]
- 39. Vasudevan S, Tong Y, Steitz JA. Switching from repression to activation: microRNAs can up‐regulate translation. Science. 2007;318:1931–1934. doi: 10.1126/science.1149460 [DOI] [PubMed] [Google Scholar]
- 40. Krishna S, Andersson AM, Semsey S, Sneppen K. Structure and function of negative feedback loops at the interface of genetic and metabolic networks. Nucleic Acids Res. 2006;34:2455–2462. doi: 10.1093/nar/gkl140 [DOI] [PMC free article] [PubMed] [Google Scholar]
- 41. Mitrophanov AY, Groisman EA. Positive feedback in cellular control systems. BioEssays. 2008;30:542–555. doi: 10.1002/bies.20769 [DOI] [PMC free article] [PubMed] [Google Scholar]
- 42. Farberov L, Herzig E, Modai S, Isakov O, Hizi A, Shomron N. MicroRNA‐mediated regulation of p21 and TASK1 cellular restriction factors enhances HIV‐1 infection. J Cell Sci. 2015;128:1607–1616. [DOI] [PMC free article] [PubMed] [Google Scholar]
- 43. Wang P, Xu J, Hou Z, Wang F, Song Y, Wang J, Zhu H, Jin H. miRNA‐34a promotes proliferation of human pulmonary artery smooth muscle cells by targeting PDGFRA. Cell Prolif. 2016;49:484–493. doi: 10.1111/cpr.12265 [DOI] [PMC free article] [PubMed] [Google Scholar]
- 44. Olschewski A, Li Y, Tang BI, Hanze Jörg, Eul B, Bohle RM, Wilhelm J, Morty RE, Brau ME, Weir EK, et al. Impact of TASK‐1 in human pulmonary artery smooth muscle cells. Circ Res. 2006;98:1072–1080. doi: 10.1161/01.RES.0000219677.12988.e9 [DOI] [PubMed] [Google Scholar]
- 45. Jin X, Yu LL, Yu CX. Effect of miR‐9 on myocardial fibrosis in rats via TGF‐β1/Smads signaling pathway. Eur Rev Med Pharmacol Sci. 2019;23:7083–7088. [DOI] [PubMed] [Google Scholar]
- 46. Wang K, Long B, Zhou J, Li PF. miR‐9 and NFATc3 regulate myocardin in cardiac hypertrophy. J Biol Chem. 2010;285:11903–11912. doi: 10.1074/jbc.M109.098004 [DOI] [PMC free article] [PubMed] [Google Scholar]
- 47. Lin Z, Murtaza I, Wang K, Jiao J, Gao J, Li PF. miR‐23a functions downstream of NFATc3 to regulate cardiac hypertrophy. Proc Natl Acad Sci USA. 2009;106:12103–12108. doi: 10.1073/pnas.0811371106 [DOI] [PMC free article] [PubMed] [Google Scholar]
- 48. Zhu Y, Feng Z, Cheng W, Xiao Y. MicroRNA‐34a mediates atrial fibrillation through regulation of Ankyrin‐B expression. Mol Med Rep. 2018;17:8457–8465. doi: 10.3892/mmr.2018.8873 [DOI] [PubMed] [Google Scholar]
- 49. Boon RA, Iekushi K, Lechner S, Seeger T, Fischer A, Heydt S, Kaluza D, Tréguer K, Carmona G, Bonauer A, et al. MicroRNA‐34a regulates cardiac ageing and function. Nature. 2013;495:107–110. doi: 10.1038/nature11919 [DOI] [PubMed] [Google Scholar]
- 50. Schmidt C, Benda S, Kraft P, Wiedmann F, Pleger S, Büscher A, Thomas D, Wachter R, Schmid C, Eils R, et al. Prospective multicentric validation of a novel prediction model for paroxysmal atrial fibrillation. Clin Res Cardiol. 2020;110:868–876. doi: 10.1007/s00392-020-01773-z [DOI] [PMC free article] [PubMed] [Google Scholar]
- 51. Sciandra M, De Feo A, Parra A, Landuzzi L, Lollini P‐L, Manara MC, Mattia G, Pontecorvi G, Baricordi C, Guerzoni C, et al. Circulating miR34a levels as a potential biomarker in the follow‐up of Ewing sarcoma. J Cell Commun Signal. 2020;14:335–347. doi: 10.1007/s12079-020-00567-2 [DOI] [PMC free article] [PubMed] [Google Scholar]
- 52. Kassem NM, Makar WS, Kassem HA, Talima S, Tarek M, Hesham H, El‐Desouky MA. Circulating miR‐34a and miR‐125b as promising non invasive biomarkers in Egyptian locally advanced breast cancer patients. Asian Pac J Cancer Prev. 2019;20:2749–2755. doi: 10.31557/APJCP.2019.20.9.2749 [DOI] [PMC free article] [PubMed] [Google Scholar]
- 53. Huang Y, Zou Y, Lin L, Ma X, Chen H. Identification of serum miR‐34a as a potential biomarker in acute myeloid leukemia. Cancer Biomark. 2018;22:799–805. doi: 10.3233/CBM-181381 [DOI] [PubMed] [Google Scholar]
- 54. Corcoran C, Rani S, O'Driscoll L. Mir‐34a is an intracellular and exosomal predictive biomarker for response to docetaxel with clinical relevance to prostate cancer progression. Prostate. 2014;74:1320–1334. doi: 10.1002/pros.22848 [DOI] [PubMed] [Google Scholar]
- 55. Han H, Qu G, Han C, Wang Y, Sun T, Li F, Wang J, Luo S. MiR‐34a, miR‐21 and miR‐23a as potential biomarkers for coronary artery disease: a pilot microarray study and confirmation in a 32 patient cohort. Exp Mol Med. 2015;47:e138. doi: 10.1038/emm.2014.81 [DOI] [PMC free article] [PubMed] [Google Scholar]
- 56. Cosín‐Tomás M, Antonell A, Lladó A, Alcolea D, Fortea J, Ezquerra M, Lleó A, Martí MJ, Pallàs M, Sanchez‐Valle R, et al. Plasma miR‐34a‐5p and miR‐545‐3p as early biomarkers of Alzheimer's disease: potential and limitations. Mol Neurobiol. 2017;54:5550–5562. doi: 10.1007/s12035-016-0088-8 [DOI] [PubMed] [Google Scholar]
- 57. Søkilde R, Newie I, Persson H, Borg Å, Rovira C. Passenger strand loading in overexpression experiments using microRNA mimics. RNA Biol. 2015;12:787–791. doi: 10.1080/15476286.2015.1020270 [DOI] [PMC free article] [PubMed] [Google Scholar]
- 58. Thomson DW, Bracken CP, Szubert JM, Goodall GJ. On measuring miRNAs after transient transfection of mimics or antisense inhibitors. PLoS One. 2013;8:e55214. doi: 10.1371/journal.pone.0055214 [DOI] [PMC free article] [PubMed] [Google Scholar]
- 59. Lu Y, Hou S, Huang D, Luo X, Zhang J, Chen J, Xu W. Expression profile analysis of circulating microRNAs and their effects on ion channels in Chinese atrial fibrillation patients. Int J Clin Exp Med. 2015;8:845–853. [PMC free article] [PubMed] [Google Scholar]
- 60. Liu T, Zhong S, Rao F, Xue Y, Qi Z, Wu S. Catheter ablation restores decreased plasma miR‐409‐3p and miR‐432 in atrial fibrillation patients. Ep Europace. 2016;18:92–99. doi: 10.1093/europace/euu366 [DOI] [PubMed] [Google Scholar]
- 61. Feldman A, Moreira DAR, Gun C, Wang HTL, Hirata MH, de Freitas GJ, Leite GGS, Farsky P. Analysis of Circulating miR‐1, miR‐23a, and miR‐26a in atrial fibrillation patients undergoing coronary bypass artery grafting surgery. Ann Hum Genet. 2017;81:99–105. doi: 10.1111/ahg.12188 [DOI] [PubMed] [Google Scholar]
- 62. Slagsvold KH, Johnsen AB, Rognmo Ø, Høydal MA, Wisløff U, Wahba A. Mitochondrial respiration and microRNA expression in right and left atrium of patients with atrial fibrillation. Physiol Genomics. 2014;46:505–511. doi: 10.1152/physiolgenomics.00042.2014 [DOI] [PubMed] [Google Scholar]
- 63. McManus DD, Lin H, Tanriverdi K, Quercio M, Yin X, Larson MG, Ellinor PT, Levy D, Freedman JE, Benjamin EJ. Relations between circulating microRNAs and atrial fibrillation: data from the Framingham offspring study. Heart Rhythm. 2014;11:663–669. doi: 10.1016/j.hrthm.2014.01.018 [DOI] [PMC free article] [PubMed] [Google Scholar]
Associated Data
This section collects any data citations, data availability statements, or supplementary materials included in this article.