

Abstract
Background
Social risk factors influence rehospitalization rates yet are challenging to incorporate into prediction models. Integration of social risk factors using natural language processing (NLP) and machine learning could improve risk prediction of 30‐day readmission following an acute myocardial infarction.
Methods and Results
Patients were enrolled into derivation and validation cohorts. The derivation cohort included inpatient discharges from Vanderbilt University Medical Center between January 1, 2007, and December 31, 2016, with a primary diagnosis of acute myocardial infarction, who were discharged alive, and not transferred from another facility. The validation cohort included patients from Dartmouth‐Hitchcock Health Center between April 2, 2011, and December 31, 2016, meeting the same eligibility criteria described above. Data from both sites were linked to Centers for Medicare & Medicaid Services administrative data to supplement 30‐day hospital readmissions. Clinical notes from each cohort were extracted, and an NLP model was deployed, counting mentions of 7 social risk factors. Five machine learning models were run using clinical and NLP‐derived variables. Model discrimination and calibration were assessed, and receiver operating characteristic comparison analyses were performed. The 30‐day rehospitalization rates among the derivation (n=6165) and validation (n=4024) cohorts were 15.1% (n=934) and 10.2% (n=412), respectively. The derivation models demonstrated no statistical improvement in model performance with the addition of the selected NLP‐derived social risk factors.
Conclusions
Social risk factors extracted using NLP did not significantly improve 30‐day readmission prediction among hospitalized patients with acute myocardial infarction. Alternative methods are needed to capture social risk factors.
Keywords: electronic health records, machine learning, myocardial infarction, natural language processing, patient readmission
Subject Categories: Cardiovascular Disease, Quality and Outcomes, Coronary Artery Disease, Epidemiology
Nonstandard Abbreviations and Acronyms
- DHMC
Dartmouth‐Hitchcock Medical Center
- EN
elastic net
- LASSO
least absolute shrinkage and selection operator
- ML
machine learning
- NSRF
natural language processing–derived social risk factors (main effects)
- OMOP
Observational Medical Outcomes Partnership
- RF
random forest
- SCD
structured clinical data
- VIF
variance inflation factor
- VUMC
Vanderbilt University Medical Center
Clinical Perspective
What Is New?
Integrating social risk factors by using natural language processing and machine learning, did not offer material improvements in predicting 30‐day readmission following an acute myocardial infarction.
What Are the Clinical Implications?
Given the importance of social risk factors, alternative methods for integrating these variables are needed when generating prediction tools evaluating risk for 30‐day hospital readmission among patients with acute myocardial infarction.
Every year, >635 000 people in the United States experience their first acute myocardial infarction (AMI). 1 Over 1 in 10 patients will be rehospitalized within 30 days of discharge. 1 For older patients, those aged ≥65 years, almost 1 in 5 patients will be rehospitalized within 30 days. 2 In addition, rehospitalization rates are higher in hospitals that serve poorer patients. 3 Because readmission risk is higher among certain populations, health systems and providers need a way to identify patients at increased risk for readmission to test different strategies to improve outcomes and reduce costs. 4 , 5 Prior prediction models experienced limited discrimination, with area under the curve values ranging from 0.63 to 0.75, did not leverage the wealth of patient data generated by an AMI hospitalization, and lack portability because of interhospital data collection variability. 6 , 7 , 8 , 9 In addition, social risk factors are rarely included in readmission prediction models, despite their established role in health outcomes and hospital readmissions. 5 , 10 , 11 , 12 , 13
Improving prediction model accuracy is an important step toward reducing unnecessary readmissions and improving outcomes. 14 , 15 Recent studies suggest that broadly applied strategies to reduce readmission rates do not work. 16 , 17 Heterogeneity among the at‐risk group may explain these results, and more targeted interventions based on accurate models may lead to more successful strategies. Computational advances allow us to ascertain structured and unstructured textual data from clinical documentation that were previously difficult to extract, including social risk factors (eg, medication adherence, homelessness, and at‐home support). 13 , 18 These factors have promise for improving risk prediction, dependent on successful data ascertainment. 3 , 4 Moreover, social risk factors are disproportionately seen among vulnerable and high‐need populations, a group that experiences higher risk for readmissions. 3 , 5 Therefore, integration of social risk factors into prediction models may be especially valuable for addressing readmission disparities. The overall goal of this study was to improve on prior AMI 30‐day readmission models by incorporating data available from the electronic health record (EHR) using a common data model, machine learning (ML) computational methods, and incorporating social risk factors by using natural language processing (NLP) on clinical documents.
Methods
To ensure compliance with the Centers for Medicare & Medicaid Services, data collected for this study cannot be shared without appropriate regulatory provisions. Analytic methods and study materials are available from the corresponding author on reasonable request. This study was conducted at Vanderbilt University Medical Center (VUMC), a large tertiary care academic hospital in Nashville, TN, that serves a catchment area of 9 surrounding states. Dartmouth‐Hitchcock Medical Center (DHMC) is a tertiary care facility serving New Hampshire and 3 neighboring states. VUMC served as the derivation cohort, whereas DHMC was the validation cohort. Cohort derivation and inclusion criteria are described elsewhere. 6 Briefly, patients hospitalized at VUMC with a primary diagnosis of AMI and discharged alive between January 1, 2007, and December 31, 2016, were included in the cohort (n=6165). A separate cohort of hospitalized patients discharged between March 2, 2011, and December 31, 2016, from DHMC was included as the validation cohort. Nonindex AMI hospitalizations were excluded (VUMC=4241, and DHMC=2617) to ensure 1 hospitalization per patient. Moreover, patients who died before discharge were also excluded (VUMC=327, and DHMC=244). The final cohort was 6165 VUMC and 4024 DHMC unique patients. VUMC and DHMC cohorts were linked to Medicare inpatient Medicare Provider Analysis and Review claims data to supplement 30‐day readmissions following index hospitalization. Social security numbers were used to match clinical data to Medicare Provider Analysis and Review claims, with a match rate of 73.7% and 76.4% for VUMC and DHMC, respectively.
Deriving NLP Variables
An NLP model was deployed on the clinical notes for patients with AMI. Methods related to this NLP programming model are described elsewhere. 13 Briefly, the rule‐based NLP tool, Moonstone, was applied to a corpus of clinical notes dated between the index AMI hospitalization and 30 days after discharge of the AMI cohorts at both sites. All notes were processed for 7 measures of social risk, mapping to the following classifications: living alone, instrumental support, medication noncompliance (called medication compliance), impaired activity of daily living (ADL) or impaired instrumental activities of daily living, medical condition affecting ADL/instrumental activities of daily living, dementia, and depression. The assertion value of each social risk factor classification was also determined. In other words, the NLP output was included for each social risk factor recognized, whether it was positively asserted, negatively asserted, or expressed as uncertain (eg “the patient’s brother was uncertain whether she stilled lives alone”). Performance metrics for Moonstone include 0.83, 0.74, and 0.78 for precision, recall, and F1 measure, respectively. 13 Definitions for each social risk factor classification are found in Table S1. The social risk factor data derived by Moonstone's processing of all notes in both facilities’ corpora was rolled up to the encounter level, denoting a presence or absence of a social risk factor for each classification. All social risk factor mentions recognized by Moonstone were collected by classification and assertion value per document, such that each document was represented as a series of counts per the combined classification+assertion value, and all notes documented per each hospitalization per patient (using unique encounter identifiers) were aggregated in the same manner. We assumed that social risk factors were not present if the NLP system extracted none. Univariate analysis was used to identify the strongest attribute status for each of the 7 NLP‐derived social risk factors, which were retained as candidate predictors for model development. Pairwise interactions were generated between the 7 NLP‐derived social risk factor variables and structured clinical data variables. Backward step logistic regression was used to identify variables to retain in subsequent modeling.
Structured Clinical Data Candidate Predictors
Main effect predictors and definitions are available in Table S2. These include 4 demographic variables, 9 medication orders, 86 administrative variables, 9 composite score variables, and 33 laboratory results. Second‐order terms were evaluated using forward and backward stepwise logistic regression, with α=0.10, as a threshold for retaining the interaction term. Second‐order interaction terms were included in parametric models. Nonparametric models can inherently evaluate higher‐order relationships. All candidate predictors generated at VUMC were replicated at DHMC.
Outcome
The main outcome of interest was all‐cause 30‐day hospital readmission. Readmission was defined as an observation or acute inpatient hospitalization within 30 days from the index AMI discharge, excluding rehabilitation admissions, nursing home admissions, or scheduled admissions for surgeries or procedures (Centers for Medicare & Medicaid Services definition). Hospital administrative databases were used to derive the dates and causes of readmission, including the admitting hospital state and surrounding state inpatient data sets and Medicare claims. This assured complete ascertainment of 30‐day readmissions. Outcome derivation was the same at VUMC and DHMC.
Missing Values
The final analytic file contained 26 clinical variables with missing values at VUMC and DHMC. Percentage missingness of these variables is available in Table S3. Multiple imputation was used to address missing data. When missing data are assumed to be random and confined to predictor variables, multiple imputation provides robust results. 19 Moreover, multiple imputation is considered superior to using a missing category indicator among nonrandomized studies. 20 Except for laboratory variables, null data within the EHR were considered not present in the analytical file. For laboratory variables, 20 imputed data sets were generated in SAS using Markov chain Monte Carlo methods, assuming all imputed variables had a multivariate normal distribution. 21 Having 20 data sets ensures sufficient uncertainly about missing value estimates to have confidence about the variables’ influence on the outcome. With sufficiently large samples, this method provides reliable estimates, even if the assumption of normality is not fully met. 9
The final analytic data files at VUMC and DHMC contained a total of 325 variables, including 134 clinical main effects, 7 NLP‐derived social risk factors (main effects), 85 second‐order clinical terms, 98 second‐order NLP‐derived social risk factors, and 1 outcome. Information on variables is available in Table S2. Each site contained 20 imputed data files with 123 300 observations at VUMC and 80 480 observations at DHMC. The final files were imported into R 3.6.0 for ML development.
Model Definition
Models were run on 3 unique data sets and then scored on the same set of data from the external validation cohort. The first contained structured clinical data (SCD) only. The second contained SCD and NLP‐derived social risk factors (NSRF; NSRF+SCD). The third contained NSRF main effects only. The following methods were used in the development and scoring of all 3 models.
Model Development
Five ML models were developed and included parametric (elastic net [EN], least absolute shrinkage and selection operator [LASSO], and ridge regression) and nonparametric models (random forest [RF] and gradient boosting machines). These models were chosen to provide a balance between model complexity and interpretability. Although EN, LASSO, and ridge regression offer the ease of model interpretability and understanding, their ability to characterize complex relationships between variables is limited. RF and gradient boosting, on the other hand, are well suited to characterize nonlinear relationships; however, their model outputs (eg, variable weights) offer interpretability challenge. Developing and validating models from both families provides a comprehensive approach to identifying the model that best characterizes the data. Default and optimized (ie, tuned) hyperparameter settings for each model were run. Optimized hyperparameters were identified using a random grid search on key hyperparameters of each model using the caret package in R with 10‐fold cross‐validation. Default and optimized hyperparameters for each of the models are available in Tables S4 through S6. Before deploying each ML model, the final analytic data file was randomly split into 0.80 training set and 0.20 testing set in each of the 20 imputed data sets. Parametric models were developed in R using the glmnet and caret packages. 22 Nonparametric models used the randomForest and gbm packages. 23 , 24
Model Assessment and Scoring
Each model was trained using 10‐fold cross‐validation on the full training set with 5 repeats. Model performance was then determined using the full hold‐out test set. The area under the receiver operating characteristic curve (AUROC) and 95% CIs were calculated from the test set for each imputed data set (1–20) for each model. The AUROC and 95% CIs were pooled across all imputed files using Rubin’s indexes to generate a single metric for each distinct ML model. 21 Calibration was assessed using calibration curve belts and percentage of calibration (proportion of predictions where the calibration belt crossed the 1.0 line) for each model on the training and test data sets. 25 Last, the pooled Brier score was assessed, which is a global metric that combines discrimination and calibration performance. 26 Once ML models were deployed on VUMC derivation cohort, scoring was performed using the DHMC validation cohort. The models were scored on the full DHMC data set, using models with default and optimized hyperparameters. Model discrimination was assessed with pooled AUROCs and 95% CIs. In addition, calibration was evaluated with calibration curve belts and percentage of calibration, following methods previously described.
Statistical Analysis: Model Comparisons
Univariate and bivariate logistic regression models were run to generate unadjusted associations between each NSRF variable and the outcome. Adjusted associations for each NSRF variable were determined using the best performing parametric and nonparametric models. For nonparametric models, the coefficient equivalent was outputted (ie, variable or relative importance).
Using Delong’s receiver operating characteristic comparison analysis, the AUROC from the 5 models using SCD only was compared with those using SCD+NSRF. In addition, AUROCs from the 5 models using SCD only were compared with those using NSRF main effects only. The AUROC, SE, test statistics, and 95% CIs were pooled across imputed files in accordance with Rubin’s indexes. 21 This was done for the models developed on VUMC data along with the scored models. Discrimination and calibration were used to evaluate differences between models using SCD only and those using SCD+NSRF.
We followed Transparent Reporting of a multivariable prediction model for Individual Prognosis Or Diagnosis guidelines for transparent reporting of multivariable prediction models for individual prognosis. 27 This study was approved by the VUMC and DHMC institutional review boards under expedited review with a waiver of informed consent. Co–first authors had full access to the data and take full responsibility for their integrity and analysis.
NLP and Structured Data Collinearity Assessment
To determine if variables from SCD served as surrogates for NSRF, variance inflation factor (VIF) analysis was used. Briefly, VIF analysis evaluates multicollinearity present within a model by measuring the variance of a full model relative to the variance of a model with a single parameter. 28 To begin, a LASSO model was run using all possible predictors as features. The 47 features selected from the LASSO model along with all NSRF variables not selected by the LASSO model were used in a multiple logistic regression model. Within this model, 7 variables were removed because of matrix singularity issues, likely attributable to multicollinearity. Once removed, the multiple logistic regression model was rerun and VIF analysis was implemented. In total, we tested 32 structured clinical variables and second‐order terms against 103 NSRF (main effects and second‐order terms).
Results
Among 6165 patients, 934 (15.1%) were readmitted within 30 days, 4138 (67.1%) were men, 1020 (16.5%) were Black and other people of color, and most were non‐Hispanic ethnicity (Table 1). Among 4024 DHMC patients, 412 (10.2%) were readmitted within 30 days, 1440 (35.8%) were women, and most were non‐Hispanic ethnicity and White race. Low cell thresholds limited specific release of race and ethnicity data. Table 1 and Table S7 provide additional patient characteristics at each site.
Table 1.
Characteristics for 6195 Patients Hospitalized at VUMC With a Primary Diagnosis of AMI (Derivation Cohort)
| Characteristic | Readmission, % (n=934) | Nonreadmission, % (n=5231) |
|---|---|---|
| Sex | ||
| Men | 63.5 (n=593) | 67.8 (n=3545) |
| Women | 36.5 (n=341) | 32.2 (n=1686) |
| Race | ||
| White | 83.7 (n=782) | 83.4 (n=4363) |
| Black | 10.8 (n=101) | 9.4 (n=492) |
| Other § | 5.5 (n=51) | 7.2 (n=376) |
| Comorbidities | ||
| Arrhythmia | 21.0 (n=197) | 12.7 (n=666) |
| Anemia | 17.0 (n=160) | 8.2 (n=430) |
| Hypertension | 38.3 (n=358) | 30.2 (n=1580) |
| COPD | 4.5 (n=42) | 2.9 (n=150) |
| CKD | 16.0 (n=149) | 6.7 (n=353) |
| Tobacco use | 6.2 (n=58) | 4.7 (n=246) |
| Depression | 6.9 (n=64) | 4.1 (n=217) |
| CAD | 10.3 (n=96) | 10.1 (n=528) |
| CHF | 21.2 (n=198) | 11.5 (n=599) |
| Dementia | 2.6 (n=24) | 1.9 (n=101) |
| Cardiac arrest | 5.7 (n=53) | 5.1 (n=269) |
| STEMI | 48.2 (n=450) | 50.7 (n=2651) |
| Heart failure during hospitalization | 53.2 (n=497) | 35.8 (n=1871) |
| Ischemia during hospitalization | 17.0 (n=159) | 11.5 (n=600) |
| Histories | ||
| AMI | 24.0 (n=224) | 21.4 (n=1122) |
| Peripheral vascular disease | 21.2 (n=198) | 12.4 (n=647) |
| Angina | 15.2 (n=142) | 11.0 (n=575) |
| Unstable angina | 24.4 (n=228) | 19.9 (n=1042) |
| Hypertension | 51.1 (n=477) | 42.8 (n=2241) |
| Depression | 12.8 (n=120) | 10.2 (n=535) |
| Discharge location | ||
| Home | 78.1 (n=729) | 89.3 (n=4671) |
| Health facility | 21.9 (n=205) | 10.7 (n=560) |
| Mean continuous scores | ||
| Age, y | 67.78 (SD=13.04) | 63.22 (SD=12.99) |
| LACE score* | 5.71 (SD=2.35) | 4.67 (SD=2.0) |
| GRACE score † | 141.06 (SD=33.3) | 129.55 (SD=33.18) |
| HOSPITAL score ‡ | 3.42 (SD=1.65) | 2.63 (SD=1.58) |
| Charlson Deyo score | 1.19 (SD=1.86) | 0.75 (SD=1.46) |
| Length of stay, d | 7.47 (SD= 5.64) | 5.67 (SD=5.06) |
AMI indicates acute myocardial infarction; CAD, coronary artery disease; CHF, congestive heart failure; CKD, chronic kidney disease; COPD, chronic obstructive pulmonary disease; STEMI, ST‐segment–elevation myocardial infarction; and VUMC, Vanderbilt University Medical Center.
LACE indicates length of stay, acuity of admission, comorbidity of the patient (measured with the Charlson comorbidity index score), and emergency department use (measured as the number of visits in the 6 months before admission). Possible score range is 1 to 19.
GRACE indicates Global Registry of Acute Coronary Events; possible score is 1 to 372 points.
HOSPITAL score indicates hemoglobin levels at discharge, discharge from an oncology service, sodium level at discharge, procedure during the index admission, index type of admission, number of admissions during the past 12 months, and length of stay. Possible score range is 0 to 13.
Other includes all racial groups other than White and Black.
NLP Results From Moonstone
Moonstone was deployed on clinical notes from 93 670 VUMC patients and 119 000 DHMC patients. There were 46 123 total mentions of any social risk factor at VUMC and 232 034 at DHMC. The social risk factor with the most frequent mentions at VUMC and DHMC was impaired ADL (30 223 and 106 006, respectively), and the least frequent mention at both sites was medication compliance (429 and 4862, respectively). Instrumental any and impaired ADL/instrumental activities of daily living position were the 2 most prevalent NSRF variables across both sites (Table S8). The prevalence of nearly all NSRF variables was higher at DHMC when compared with VUMC. Positive univariate and bivariate associations between NSRF variables were identified at both sites (Table 2).
Table 2.
Univariate, Bivariate, and Adjusted Relationships of NSRF and 30‐Day Readmission Following an AMI Among Derivation and Validation Cohorts
| Variable | Unadjusted odds ratio | Outcome, N (%) | Nonoutcome, N (%) | Adjusted variable importance* | Adjusted coefficient † |
|---|---|---|---|---|---|
| VUMC derivation cohort (n=6195) | |||||
| Dementia positive | 2.920 ‡ | 114 (2.2) ‡ | 57 (6.1) | 4.450 | 0.128 |
| Depression any | 1.770 ‡ | 591 (11.3) | 172 (18.4) | 5.600 | 0.051 |
| Impaired ADL/IADL any | 2.400 * | 1276 (24.4) ‡ | 408 (43.7) | 7.020 | 0.033 |
| Instrumental support any | 2.200 ‡ | 1692 (32.3) ‡ | 479 (51.3) | 7.310 | 0.034 |
| Living alone uncertain | 2.940 ‡ | 626 (12.0) ‡ | 267 (28.6) | 8.910 | 0.082 |
| Medical condition positive | 2.440 ‡ | 1257 (24.0) ‡ | 407 (43.6) | 8.060 | 0.040 |
| Medication compliance any | 1.280 | 258 (4.9) ‡ | 58 (6.2) | 3.440 | −0.002 |
| DHMC validation cohort (n=4024) | |||||
| Dementia positive | 1.800 ‡ | 274 (7.6) ‡ | 53 (12.9) | 4.450 | 0.128 |
| Depression any | 1.220 | 1337 (37.0) ‡ | 172 (41.7) | 5.600 | 0.051 |
| Impaired ADL/IADL any ‡ | 1.630 ‡ | 2163 (59.9) ‡ | 292 (70.9) | 7.020 | 0.033 |
| Instrumental support any | 1.330 | 3040 (84.2) ‡ | 361 (87.6) | 7.310 | 0.034 |
| Living alone uncertain | 1.620 ‡ | 260 (7.2) ‡ | 46 (11.2) | 8.910 | 0.082 |
| Medical condition positive | 2.020 ‡ | 1195 (33.1) * | 206 (50.0) | 8.060 | 0.040 |
| Medication compliance any | 1.300 ‡ | 2153 (59.6) ‡ | 271 (65.8) | 3.440 | −0.002 |
ADL indicates activity of daily living; AMI, acute myocardial infarction; DHMC, Dartmouth‐Hitchcock Medical Center; IADL, instrumental activity of daily living; NLP, natural language processing; and VUMC, Vanderbilt University Medical Center.
Pooled variable importance from best‐performing nonparametric model in derivation cohort.
Pooled coefficients from best‐performing parametric model in derivation cohort.
Statistically significant at P<0.05.
For models including SCD only, the testing set AUROC was between 0.681 and 0.705 (Table 3). For models run on SCD+NSRF, the testing set AUROC was between 0.654 and 0.703 (Table 3). Finally, for models run on NSRF main effects only, the testing set AUROC was between 0.519 and 0.629 (Table 3). Among models run on SCD only along with models run on SCD+NSRF, the best performing EN, LASSO, ridge regression, and gradient boosting models occurred with default hyperparameters, and the best performing RF models occurred with optimized hyperparameters. For models run on NSRF main effects only, the best performing models for EN, LASSO, ridge regression, and RF occurred with default hyperparameters. Among the validation cohort, the best performing models occurred with optimized hyperparameters for those using SCD only along with those using SCD+NSRF. Best performing models among the validation cohort for those using NSRF main effects only occurred with default hyperparameters for LASSO, EN, and RF.
Table 3.
ROC Comparison Analysis of Pooled AUROC Calculated on Test Set at VUMC for 5 ML Models, Scored on DHMC, Run on SCD Only, NSRF Only, and SCD+NSRF
| Model | AUC SCD only | AUC NSRF only | AUC SCD+NSRF | Z statistic SCD vs NSRF only | Z statistic SCD only vs SCD+NSRF | 95% CI SCD vs NSRF only | 95% CI SCD only vs SCD+NSRF |
|---|---|---|---|---|---|---|---|
| VUMC models | |||||||
| RF default test | 0.683 | 0.526 | 0.696 | 6.493 | −0.537 | −0.222 to −0.094 | −0.071 to 0.097 |
| RF optimized test | 0.686 | 0.519 | 0.703 | 7.211 | −0.546 | −0.230 to −0.105 | −0.067 to 0.099 |
| GB default test | 0.705 | 0.629 | 0.691 | 2.505 | 0.499 | −0.146 to −0.007 | −0.085 to 0.055 |
| GB optimized test | 0.673 | 0.628 | 0.654 | 1.475 | 0.657 | −0.121 to 0.030 | −0.098 to 0.058 |
| EN default test | 0.695 | 0.626 | 0.699 | 2.192 | −0.216 | −0.147 to 0.009 | −0.092 to 0.100 |
| EN optimized test | 0.682 | 0.612 | 0.692 | 2.367 | −0.326 | −0.153 to 0.0124 | −0.068 to 0.087 |
| RR default test | 0.696 | 0.626 | 0.704 | 2.218 | −0.328 | −0.150 to 0.009 | −0.137 to 0.153 |
| RR optimized test | 0.692 | 0.629 | 0.703 | 2.077 | −0.387 | −0.138 to 0.012 | −0.060 to 0.082 |
| LASSO default test | 0.695 | 0.626 | 0.699 | 2.184 | −0.223 | −0.148 to 0.009 | −0.094 to 0.102 |
| LASSO optimized test | 0.681 | 0.605 | 0.691 | 2.598 | −0.326 | −0.162 to 0.010 | −0.069 to 0.088 |
| Models scored on DHMC | |||||||
| RF default | 0.603 | 0.543 | 0.609 | 3.120 | −0.464 | −0.118 to −0.001 | −0.040 to 0.054 |
| RF optimized | 0.608 | 0.535 | 0.614 | 3.950 | −0.679 | −0.125 to −0.022 | −0.040 to 0.048 |
| GB default | 0.630 | 0.586 | 0.634 | 2.480 | −0.462 | −0.093 to 0.004 | −0.044 to 0.053 |
| GB optimized | 0.606 | 0.586 | 0.595 | 1.053 | 0.664 | −0.095 to 0.056 | −0.117 to 0.096 |
| EN default | 0.527 | 0.589 | 0.520 | −3.170 | 0.004 | −0.034 to 0.158 | −0.099 to 0.085 |
| EN optimized | 0.655 | 0.584 | 0.572 | 4.424 | 5.259 | −0.193 to 0.051 | −0.202 to 0.036 |
| RR default | 0.541 | 0.590 | 0.518 | −2.676 | 0.896 | −0.092 to 0.188 | −0.159 to 0.111 |
| RR optimized | 0.558 | 0.600 | 0.528 | −2.566 | 1.529 | −0.058 to 0.141 | −0.133 to 0.072 |
| LASSO default | 0.528 | 0.590 | 0.520 | −3.125 | 0.134 | −0.033 to 0.155 | −0.098 to 0.080 |
| LASSO optimized | 0.595 | 0.576 | 0.578 | 1.182 | 0.686 | −0.195 to 0.157 | −0.178 to 0.145 |
AUCs can decrease when variables (eg, natural language processing) are added to a model, especially if the AUC is based on a validation sample and the additional variables have no additional discriminatory ability. AUC indicates area under the curve; AUROC, area under the ROC curve; DHMC, Dartmouth‐Hitchcock Medical Center; EN, elastic net; GB, gradient boosting; LASSO, least absolute shrinkage and selection operator; ML, machine learning; NSRF, natural language processing–derived social risk factors (main effects); RF, random forest; ROC, receiver operating characteristic; RR, ridge regression; SCD, structured clinical data; and VUMC, Vanderbilt University Medical Center.
The AUROCs were statistically similar between models using SCD only and models using SCD+NSRF (Table 3). The trend was similar among the validation cohort. However, statistically significant differences in testing AUROC were found between models run using SCD only compared with models using NSRF main effects only (Table 3). This trend was also seen among the validation cohort.
Sensitivity, specificity, precision, and F1 metrics were calculated from the models with the highest area under the curve for SCD, NLP only, and SCD+NSRF (Table 4). SCD and SCD+NSRF models had extremely high specificity, at the cost of a low sensitivity and modest F1 measure. The NLP only models were more balanced between sensitivity and specificity. More important, metrics presented in Table 4 can vary based on the threshold cutoff value, which offers flexibility to optimize the desired metric. 6
Table 4.
Additional Pooled Metrics From Best‐Performing Models From VUMC, Scored on DHMC, Run on SCD Only, NSRF Only, and SCD+NSRF
| Variable | VUMC models* | Models score on DHMC* | ||||
|---|---|---|---|---|---|---|
| SCD only | NSRF only | SCD+NSRF | SCD only | NSRF only | SCD+NSRF | |
| Sensitivity | 0.021 | 0.513 | 0.026 | 0.012 | 0.375 | 0.003 |
| Specificity | 0.992 | 0.708 | 0.994 | 0.984 | 0.765 | 0.999 |
| Precision | 0.306 | 0.238 | 0.426 | 0.081 | 0.154 | 0.228 |
| F1 | 0.039 | 0.325 | 0.050 | 0.021 | 0.218 | 0.005 |
SCD and SCD+NSRF used 0.5 cutoff. NSRF only used third quartile cutoff. DHMC indicates Dartmouth‐Hitchcock Medical Center; NSRF, natural language processing–derived social risk factors (main effects); SCD, structured clinical data; and VUMC, Vanderbilt University Medical Center.
Best‐performing models by area under the curve.
Calibration assessment occurred on VUMC testing data for models using SCD only and models using SCD+NSRF. The best‐performing model using SCD only was LASSO, which had the highest percentage of calibrated observations (31.64%) (Figure 1). The best‐performing model using SCD+NSRF was gradient boosting (38.99%) (Figure). Among the validation cohort, the best performing model using SCD only was LASSO (17%), and calibration among all models using SCD+NSRF was <1%.
Figure 1. Percentage calibrated for test on Vanderbilt University Medical Center (VUMC) using structured clinical data (SCD) only and SCD with natural language processing–derived social risk factors (main effects) (NSRF), scored on Dartmouth‐Hitchcock Medical Center (DHMC).
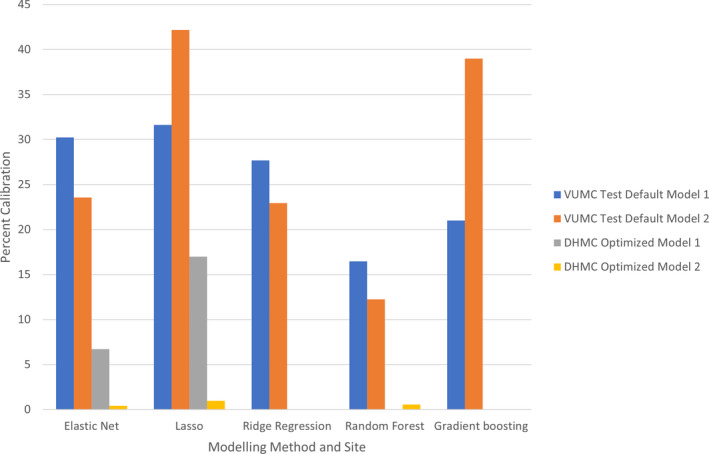
Bars represent the percentage of aligned risk predictions. Model 1, SCD. Model 2, SCD+NSRF. Default, models with untuned hyperparameters. Optimized, models with tuned hyperparameters. LASSO indicates least absolute shrinkage and selection operator.
Results of VIF analysis are available in Table S9. Before VIF analysis, 7 variables were removed because of matrix singularity issues, likely a product of multicollinearity. VIF identified multicollinearity between some SCD variables and NSRF variables, with 66 above the threshold of 4, suggesting significant collinearity, and 39 above the threshold of 10, illustrating severe multicollinearity.
Discussion
We report on NSRF using the NLP toolkit Moonstone to evaluate the clinical utility of the selected social risk factors against EHR SCD using the Observational Medical Outcome Partnership (OMOP) common data model to improve the prediction of 30‐day readmission after AMI. Most NSRF had univariate and bivariate associations with 30‐day readmission, but they were attenuated when adjusted for SCD. This trend was seen among derivation and validation cohorts. All models at the validation site experienced a decrease in calibration, likely a product of variance in textual documentation between sites. Despite using a variety of ML models capable of characterizing complex relationships, the addition of NSRF to an existing clinical risk model using a standardized common data model (OMOP) did not improve the ability to predict 30‐day readmissions following an AMI.
This study represents a “null” result. Null findings are critically important and underemphasized, especially in the field of NLP, ML, and predictive analytics. 29 One interpretation of these findings is that social risk factors do not influence outcomes in AMI. Given the large body of evidence to suggest otherwise, an alternative interpretation is that Moonstone relies on clinician documentation, which is highly variable and biased. 30 , 31 One could hypothesize that social risk factor documentation is more biased (eg, older patients are more likely to be asked about ADLs compared with younger patients) than other data, such as blood pressure or chest pain. Alternatively, the set of social risk factors selected for this study may have been insufficient to predict readmission. On the basis of findings from the NLP development, one could also hypothesize that the documentation of some social risk factors may not be prevalent enough to influence the models. As data depth and breadth grow, one must consider that a null value in the data does not equate to absent, and key exposures should probably be captured systematically for all patients.
Social risk factors and, more broadly, social determinants of health clearly influence health outcomes and disparities. 32 However, prior results are mixed with respect to inclusion of social risk variables to supplement clinical prediction models. In a matched case‐control study, Wasfy et al saw an improvement in predicting percutaneous coronary intervention–related readmissions when social support factors (eg, homelessness, need for medical interpreter, and anxiety described by clinician) were included with other clinical risk factors (eg, medical history, emergency department use, and medications). 33 When social stability and low socioeconomic status variables were added to readmission models for heart failure, Amarasingham et al found improvement in predictive performance when compared with other risk models relying solely on clinical data. 34 Frizzell et al used ML, with ≈250 clinical variables, and concluded that the variables were important, but they did not significantly contribute to model improvement, suggesting the presence of important nonclinical variables. 9
The use of NLP to derive social risk factors also yields mixed results. Craig and Gillman created an all‐cause 30‐day readmission model using deep learning and NLP, which generated a C‐statistic (0.70) comparable to other published models, documenting the predictive value of unstructured text. 35 Navathe et al used an NLP tool to extract social risk factors from physician notes; and when used in conjunction with clinical data from the EHR, the tool improved risk prediction for readmission models. 5 In contrast, Wray et al found no improvement in model performance when NLP‐derived social risk variables were added to their readmission model. 36 However, the group did find significant univariate relationships between the NLP‐derived variables and readmission, suggesting that structured variables acted as surrogates for the NLP‐derived variables. 36
To investigate possible reasons for a lack of model improvement when NSRF were added to SCD, 2 separate subgroup analyses were conducted. The first one investigated the operationalization of NSRF variables, and the second explored multicollinearity between variables from NSRF and variables from SCD. The first subgroup analysis evaluated differences in model performance when NSRF variable expression was altered. Namely, the model performance was tested when (1) missingness operationalization was changed and when (2) NSRF variables were expressed as binary versus ordinal. Model performance across these different permutations was similar, and the best performing model occurred when NSRF variables collapsed missing values into “0” and when the variables were expressed as binary (ie, how NSRF variables were operationalized in the results presented herein).
We were able to detect multicollinearity between some SCD and NSRF variables. Given these findings along with some predictive capacity by the NSRF variables alone, and no significant increase in predictive power when these variables were added, suggests that these sets of variables contain similar information related to predicting 30‐day readmission. The information overlap between these variables may explain the lack of model improvement when NSRF variables were added to models with SCD.
There are several limitations to consider. Although the data used in the prediction models were mapped from EHR SCD to a common data model (OMOP), multiple imputation and second‐order term derivation were 2 preprocessing strategies that would require replication if deployed elsewhere. In addition, patients aged <65 years or those receiving Medicare fee for service did not have complete ascertainment of 30‐day readmissions, and the patient population in the validation cohort was predominantly White race. Moreover, small variations between retrospective EHR data and real‐time production data (attributable to iterative cleaning by business and clinical operations) may require surveillance and possibly recalibration of the model during implementation to the clinical environment. Beyond model implementation, the NSRF used in this study were limited to 7 constructs. By limiting specific constructs a priori, the NLP tool may fail to capture other important risk factors for readmission, such as alcohol abuse, anxiety, or fail risk. 5 Given our cohort of 6165 patients, 934 of whom had the outcome, and using a training/test partition of 80/20, we had 80% power to detect an improvement of 0.04 in AUROC (using DeLong’s test) between models with and without NLP features (eg, 0.66–0.70). There were data quality limitations at DHMC (external validation site), whereby candidate predictor variables readily available at the primary VUMC site could not be populated from DHMC EHR. This, in turn, limited the number of candidate predictors for the VUMC models and impacted model performance and variables at the DHMC external validation site, resulting in reduced model performance. Even though OMOP was developed at the external site, DHMC, based on the primary site, VUMC, using standardized variable definitions and code sharing, there were differences in EHR mappings that limited the availability of data at DHMC. 6
The externally validated approach leveraged high‐quality SCD elements with near real‐time extraction through a common data model (OMOP). The addition of NLP parsers into the OMOP pipeline for prediction adds additional complexity with potentially limited value. Recent NLP approaches included feature generation in neural network architectures that are completely data driven but lack clinical interpretability. In the case of social risk factors, interpretability may be critical, as the users need to know where to direct their efforts. A standardized approach to capture social risk factors is preferred, just as we collect vital signs and laboratory values in standardized ways, and is recently being incorporated into many EHR systems in response to meaningful use requirements. 37 Although the use of International Classification of Diseases, Tenth Revision (ICD‐10), Z codes for documenting social determinants of health are poorly used, recent research identified value in using census bureau data in Centers for Medicare & Medicaid Services readmission models. 32 , 38 These methods hold promise for integrating standardized measures of social risk in prediction models.
In conclusion, NSRF factors did not improve the performance of models predicting 30‐day readmission following AMI when curated into clinically meaningful variables. Although NSRF maintain independent univariate associations with 30‐day readmission, they do not improve model performance when added to SCD from the EHR. Subgroup analysis suggests possible overlap in the information contained with NSRF and SCD from the EHR, suggesting the need to enhance existing NLP tools or consider alternative measures of social support. These findings suggest that fundamentally different approaches to data acquisition, model development, and NLP approaches are needed to further improve the prediction of risk of 30‐day readmission.
Sources of Funding
This study was supported by National Heart, Lung, and Blood Institute (NHLBI) grant R01HL130828 (principal investigators: Drs Brown, Chapman, and Matheny). Dr Shah is supported in part by NHLBI K08HL136850.
Disclosures
Dr Brown reported receiving grants from the National Institutes of Health (NIH), National Heart, Lung, and Blood Institute (NHLBI), and National Institute of Diabetes and Digestive and Kidney Diseases during the conduct of the study. Dr Ricket received partial funding from T32 training grant (T32 LM012204) through the National Library of Medicine of the NIH. Dr Matheny reported receiving grants from the NIH/NHLBI during the conduct of the study. Dr Shah reported receiving grants from the NIH/NHLBI, personal fees from the American College of Cardiology, and other fees from Women As One. Dr Stabler reported receiving grants from the NIH during the conduct of the study. Dr Dorn reported receiving grants from the NIH during the conduct of the study. Dr Bray reported receiving grants from the NIH during the conduct of the study. Dr Chapman reported receiving grants from NIH during the conduct of the study, personal fees from IBM consultancy, and nonfinancial support from the Health Fidelity scientific board, outside the submitted work. The remaining authors have no disclosures to report.
Supporting information
Tables S1–S9
Acknowledgments
Sharon Davis, PhD (Department of Biomedical Informatics, Vanderbilt University Medical Center), allowed the analytic team to reuse some of her statistical programming for use in this study that was developed for another publication.
J.R. Brown and I.M. Ricket are co‐first authors.
Supplemental Materials for this article is available at https://www.ahajournals.org/doi/suppl/10.1161/JAHA.121.024198
For Sources of Funding and Disclosures, see page 10.
References
- 1. Mozaffarian D, Benjamin EJ, Go AS, Arnett DK, Blaha MJ, Cushman M, de Ferranti S, Després J‐P, Fullerton HJ, Howard VJ, et al. Executive summary: heart disease and stroke statistics—2015 update. Circulation. 2015;131:434–441. doi: 10.1161/cir.0000000000000157 [DOI] [PubMed] [Google Scholar]
- 2. Khera R, Jain S, Pandey A, Agusala V, Kumbhani DJ, Das SR, Berry JD, de Lemos JA, Girotra S. Comparison of readmission rates after acute myocardial infarction in 3 patient age groups (18 to 44, 45 to 64, and >/=65 years) in the United States. Am J Cardiol. 2017;120:1761–1767. doi: 10.1016/j.amjcard.2017.07.081 [DOI] [PMC free article] [PubMed] [Google Scholar]
- 3. Bernheim SM, Parzynski CS, Horwitz L, Lin Z, Araas MJ, Ross JS, Drye EE, Suter LG, Normand SL, Krumholz HM. Accounting for patients' socioeconomic status does not change hospital readmission rates. Health Aff (Millwood). 2016;35:1461–1470. doi: 10.1377/hlthaff.2015.0394 [DOI] [PMC free article] [PubMed] [Google Scholar]
- 4. Wasfy JH, Bhambhani V, Healy EW, Choirat C, Dominici F, Wadhera RK, Shen C, Wang Y, Yeh RW, et al. Relative effects of the hospital readmissions reduction program on hospitals that serve poorer patients. Med Care. 2019;57:968–976. doi: 10.1097/MLR.0000000000001207 [DOI] [PMC free article] [PubMed] [Google Scholar]
- 5. Navathe AS, Zhong F, Lei VJ, Chang FY, Sordo M, Topaz M, Navathe SB, Rocha RA, Zhou L. Hospital readmission and social risk factors identified from physician notes. Health Serv Res. 2018;53:1110–1136. doi: 10.1111/1475-6773.12670 [DOI] [PMC free article] [PubMed] [Google Scholar]
- 6. Matheny ME, Ricket I, Goodrich CA, Shah RU, Stabler ME, Perkins AM, Dorn C, Denton J, Bray BE, Gouripeddi R, et al. Development of electronic health record‐based prediction models for 30‐day readmission risk among patients hospitalized for acute myocardial infarction. JAMA Netw Open. 2021;4:e2035782. doi: 10.1001/jamanetworkopen.2020.35782 [DOI] [PMC free article] [PubMed] [Google Scholar]
- 7. Keenan PS, Normand S‐L, Lin Z, Drye EE, Bhat KR, Ross JS, Schuur JD, Stauffer BD, Bernheim SM, Epstein AJ, et al. An administrative claims measure suitable for profiling hospital performance on the basis of 30‐day all‐cause readmission rates among patients with heart failure. Circ Cardiovasc Qual Outcomes. 2008;1:29–37. doi: 10.1161/CIRCOUTCOMES.108.802686 [DOI] [PubMed] [Google Scholar]
- 8. Krumholz HM, Zhenqiu L, Drye EE, Desai MM, Han LF, Rapp MT, Mattera JA, Normand ST. An administrative claims measure suitable for profiling hospital performance based on 30‐day all‐cause readmission rates among patients with acute myocardial infarction. Circ Cardiovasc Qual Outcomes. 2011;4:243–252. doi: 10.1161/CIRCOUTCOMES [DOI] [PMC free article] [PubMed] [Google Scholar]
- 9. Frizzell JD, Liang LI, Schulte PJ, Yancy CW, Heidenreich PA, Hernandez AF, Bhatt DL, Fonarow GC, Laskey WK, et al. Prediction of 30‐day all cause readmissions in patients hospitalized for heart failure: comparison of machine learning and other statistical approaches. JAMA Netw Open. 2017;2:204–209. doi: 10.1001/jamacardio.2016.3956 [DOI] [PubMed] [Google Scholar]
- 10. Hu J, Gonsahn MD, Nerenz DR. Socioeconomic status and readmissions: evidence from an urban teaching hospital. Health Aff (Millwood). 2014;33:778–785. doi: 10.1377/hlthaff.2013.0816 [DOI] [PubMed] [Google Scholar]
- 11. Joynt K, Jha AK. Who has higher readmission rates for heart failure, and why? Implications for efforts to improve care using financial incentives. Circ Cardiovasc Qual Outcomes. 2011;4:53–59. doi: 10.1161/CIRCOUTCOMES.110.950964 [DOI] [PMC free article] [PubMed] [Google Scholar]
- 12. Kind AJ, Jencks S, Brock J, Yu M, Bartels C, Ehlenbach W, Greenberg C, Smith M. Neighborhood socioeconomic disadvantage and 30‐day rehospitalization: a retrospective cohort study. Ann Intern Med. 2014;161:765–774. doi: 10.7326/M13-2946 [DOI] [PMC free article] [PubMed] [Google Scholar]
- 13. Reeves R, Christensen L, Brown JR, Conway M, Levis M, Globbel G, Shah R, Goodrich C, Ricket I, Minter F, et al. Adaptation of an NLP system to a new healthcare environment to identify social determinants of health. J Biomed Inform. 2021;120: doi: 10.1016/j.jbi.2021.103851 [DOI] [PMC free article] [PubMed] [Google Scholar]
- 14. Kappen TH, van Klei WA, van Wolfswinkel L, Kalkman CJ, Vergouwe Y, Moons KGM. Evaluating the impact of prediction models: lessons learned, challenges, and recommendations. Diagn Progn Res. 2018;2:11. doi: 10.1186/s41512-018-0033-6 [DOI] [PMC free article] [PubMed] [Google Scholar]
- 15. Shipe ME, Deppen SA, Farjah F, Grogan EL. Developing prediction models for clinical use using logistic regression: an overview. J Thorac Dis. 2019;11:S574–S584. doi: 10.21037/jtd.2019.01.25 [DOI] [PMC free article] [PubMed] [Google Scholar]
- 16. Kripalani S, Theobald CN, Anctil B, Vasilevskis EE. Reducing hospital readmission rates: current strategies and future directions. Annu Rev Med. 2014;65:471–485. doi: 10.1146/annurev-med-022613-090415 [DOI] [PMC free article] [PubMed] [Google Scholar]
- 17. Warchol SJ, Monestime JP, Mayer RW, Chien WW. Strategies to reduce hospital readmission rates in a non‐Medicaid‐expansion state. Perspect Health Inf Manag. 2019;16:1–20. [PMC free article] [PubMed] [Google Scholar]
- 18. Morgan DJ, Bame B, Zimand P, Dooley P, Thom KA, Harris AD, Bentzen S, Ettinger W, Garrett‐Ray SD, Tracy JK, et al. Assessment of machine learning vs standard prediction rules for predicting hospital readmissions. JAMA Netw Open. 2019;2:e190348. doi: 10.1001/jamanetworkopen.2019.0348 [DOI] [PMC free article] [PubMed] [Google Scholar]
- 19. Pedersen AB, Mikkelsen EM, Cronin‐Fenton D, Kristensen NR, Pham TM, Pedersen L, Petersen I. Missing data and multiple imputation in clinical epidemiological research. Clin Epidemiol. 2017;9:157–166. doi: 10.2147/CLEP.S129785 [DOI] [PMC free article] [PubMed] [Google Scholar]
- 20. Groenwold RH, White IW, Donder RT, Carpenter JR, Altman DG, Moons KGM. Missing covariate data in clinical research: when and when not to use the missing‐indicator method for analysis. CMAJ. 2012;184:1265–1269. doi: 10.1503/cmaj.110977/-/DC1 [DOI] [PMC free article] [PubMed] [Google Scholar]
- 21. Yuan YC. Multiple imputation for missing data: concepts and new development (version 9.0). Stat Data Anal. 2000;267‐25:1–13. [Google Scholar]
- 22. Kuhn M. Building predictive models in R using the caret Package. J Stat Softw. 2008;28:1–26.27774042 [Google Scholar]
- 23. Ridgeway G. Generalized boosted models: a guide to the GBM package. CRAN. 2007;1–15. [Google Scholar]
- 24. Liaw AWM. Classification and regression by random forest. R News. 2002;2:18–22. [Google Scholar]
- 25. Nattino G, Finazzi S, Bertolini G. A new calibration test and a reappraisal of the calibration belt for the assessment of prediction models based on dichotomous outcomes. Stat Med. 2014;33:2390–2407. doi: 10.1002/sim.6100 [DOI] [PubMed] [Google Scholar]
- 26. Gerds TA, van de Wiel MA Confidence scores for predictions models. Biom J. 2011;53:259–274. doi: 10.1002/bimj.201000157 [DOI] [PubMed] [Google Scholar]
- 27. Collins GS, Reitsma JB, Altman DG, Moons KG. Transparent reporting of a multivariable prediction model for individual prognosis or diagnosis (TRIPOD): the TRIPOD statement. BMJ. 2015;350:g7594. doi: 10.1136/bmj.g7594 [DOI] [PubMed] [Google Scholar]
- 28. James G, Witten D, Hastie T, Tibshirani R. An Introduction to Statistical Learning. Springer; 2013. [Google Scholar]
- 29. Nallamothu BK, Schultz J, Petty S. True negatives: disseminating research on null, inconclusive, and confirmatory findings in cardiovascular science. Circ Cardiovasc Qual Outcomes. 2020;13:e007448. doi: 10.1161/CIRCOUTCOMES.120.007448 [DOI] [PMC free article] [PubMed] [Google Scholar]
- 30. Chapman EN, Kaatz A, Carnes M. Physicians and implicit bias: how doctors may unwittingly perpetuate health care disparities. J Gen Intern Med. 2013;28:1504–1510. doi: 10.1007/s11606-013-2441-1 [DOI] [PMC free article] [PubMed] [Google Scholar]
- 31. Shah RU. We don’t need more data, we need the right data. Circulation. 2020;142:197–198. doi: 10.1161/CIRCULATIONAHA.120.045968 [DOI] [PMC free article] [PubMed] [Google Scholar]
- 32. Baker MC, Alberti PM, Tsao TY, Fluegge K, Howland RE, Haberman M. Social determinants matter for hospital readmission policy: insights from New York City. Health Aff (Millwood). 2021;40:645–654. doi: 10.1377/hlthaff.2020.01742 [DOI] [PubMed] [Google Scholar]
- 33. Wasfy JH, Singal G, O'Brien C, Blumenthal DM, Kennedy KF, Strom JB, Spertus JA, Mauri L, Normand SL, Yeh RW. Enhancing the prediction of 30‐day readmission after percutaneous coronary intervention using data extracted by querying of the electronic health record. Circ Cardiovasc Qual Outcomes. 2015;8:477–485. doi: 10.1161/CIRCOUTCOMES.115.001855 [DOI] [PubMed] [Google Scholar]
- 34. Amarasingham R, Moore BJ, Tabak YP, Drazner MH, Clark CA, Zhang S, Gary Reed W, Swanson TS, Ma Y, Halm EA. An automated model to identify heart failure patients at risk for 30‐day readmission or death using electronic medical record data. Med Care. 2010;48:981–988. doi: 10.1097/MLR.0b013e3181ef60d9 [DOI] [PubMed] [Google Scholar]
- 35. Craig E, Gillman D, Arias C. Predicting readmisson risk from doctors’ notes. arXiv. 2017. 1711.10663v2 [Google Scholar]
- 36. Wray CM, Vali M, Walter LC, Christensen L, Abdelrahman S, Chapman W, Keyhani S. Examining the interfacility variation of social determinants of health in the veterans health administration. Fed Pract. 2021;38:15–19. doi: 10.12788/fp.0080 [DOI] [PMC free article] [PubMed] [Google Scholar]
- 37. Venzon A, Le TB, Kim K. Capturing social health data in electronic systems: a systematic review. Comp Inform Nurs. 2019:2:90–98. [DOI] [PubMed] [Google Scholar]
- 38. Truong HP, Luke AA, Hammond G, Wadhera RK, Reidhead M, Joynt Maddox KE. Utilization of social determinants of health ICD‐10 Z‐codes among hospitalized patients in the United States. Med Care. 2016–2017;2020:1037–1043. doi: 10.1097/MLR.0000000000001418 [DOI] [PMC free article] [PubMed] [Google Scholar]
Associated Data
This section collects any data citations, data availability statements, or supplementary materials included in this article.
Supplementary Materials
Tables S1–S9