

Abstract
Background
Studies have reported the use of photoplethysmography signals to detect atrial fibrillation; however, the use of photoplethysmography signals in classifying multiclass arrhythmias has rarely been reported. Our study investigated the feasibility of using photoplethysmography signals and a deep convolutional neural network to classify multiclass arrhythmia types.
Methods and Results
ECG and photoplethysmography signals were collected simultaneously from a group of patients who underwent radiofrequency ablation for arrhythmias. A deep convolutional neural network was developed to classify multiple rhythms based on 10‐second photoplethysmography waveforms. Classification performance was evaluated by calculating the area under the microaverage receiver operating characteristic curve, overall accuracy, sensitivity, specificity, and positive and negative predictive values against annotations on the rhythm of arrhythmias provided by 2 cardiologists consulting the ECG results. A total of 228 patients were included; 118 217 pairs of 10‐second photoplethysmography and ECG waveforms were used. When validated against an independent test data set (23 384 photoplethysmography waveforms from 45 patients), the DCNN achieved an overall accuracy of 85.0% for 6 rhythm types (sinus rhythm, premature ventricular contraction, premature atrial contraction, ventricular tachycardia, supraventricular tachycardia, and atrial fibrillation); the microaverage area under the microaverage receiver operating characteristic curve was 0.978; the average sensitivity, specificity, and positive and negative predictive values were 75.8%, 96.9%, 75.2%, and 97.0%, respectively.
Conclusions
This study demonstrated the feasibility of classifying multiclass arrhythmias from photoplethysmography signals using deep learning techniques. The approach is attractive for population‐based screening and may hold promise for the long‐term surveillance and management of arrhythmia.
Registration
URL: www.chictr.org.cn. Identifier: ChiCTR2000031170.
Keywords: arrhythmias, deep convolutional neural networks, photoplethysmography
Subject Categories: Machine Learning, Clinical Studies, Arrhythmias
Nonstandard Abbreviations and Acronyms
- DCNN
deep convolutional neural network
- ML
machine learning
- RFCA
radiofrequency catheter ablation
- SR
sinus rhythm
- SVT
supraventricular tachycardia
Clinical Perspective
What Is New?
The proposed end‐to‐end deep convolutional neural network model can triage photoplethysmography segments into sinus rhythm, premature ventricular contraction, premature atrial contraction, ventricular tachycardia, supraventricular tachycardia, and atrial fibrillation, with an overall accuracy of 85.0% (95% CI, 84.6%–85.4%).
Our findings indicate that it is feasible to detect multiple arrhythmias from photoplethysmography signals with deep learning techniques.
What Are the Clinical Implications?
A photoplethysmography‐based approach to detect multiple arrhythmias is attractive for large‐scale screening and has the potential to be helpful for the long‐term and real‐time monitoring of arrhythmia because of its convenience and real‐time nature.
Studies are needed to improve the accuracy of the proposed model and evaluate the performance of the model on data sets collected with wearable devices in nonhospital settings.
Arrhythmias affect the quality of life of tens of millions of people worldwide, with as many as one‐quarter of Americans over 40 years old developing cardiac arrhythmias. 1 Arrhythmias are associated with high risks of stroke, 2 heart failure, 3 and even sudden cardiac death. More than 80% of sudden cardiac deaths are reportedly closely related to cardiac arrhythmias, and these deaths account for half of all deaths caused by heart diseases. 4 However, some types of arrhythmias result in no symptoms, hindering timely detection in clinical settings. 5
The conventional tools used to diagnose an arrhythmia include a 12‐lead ECG and 24‐hour Holter monitoring. 6 , 7 , 8 However, ECG‐based recorders are burdensome and inconvenient for patients because electrodes must be attached to the body. Unobtrusive and convenient methods for arrhythmia detection and monitoring would greatly promote the prevention and management of arrhythmia‐related complications. 9
Photoplethysmography is an emerging technology that offers a simple, inexpensive, and unobtrusive means to monitor the vascular system continuously. 10 Several photoplethysmography‐based methods have been used for arrhythmia detection and have yielded promising results in previous studies. 11 , 12 , 13 , 14 , 15 , 16 , 17 , 18 Such published photoplethysmography‐based detectors have focused on the discrimination of atrial fibrillation (AF). 19 By contrast, studies on detecting and classifying multiple arrhythmia types based on photoplethysmography signals have been few. Because different types of arrhythmias pose various risks to patients and require different clinical attention and intervention, accurately distinguishing the types would facilitate arrhythmia management. 20
To evaluate the accuracy of classifying multiple types of arrhythmias from photoplethysmography, we developed and validated a deep convolutional neural network (DCNN) for detecting and classifying multiple rhythm classes from raw photoplethysmography waveforms by using clinical annotations of rhythm based on ECG as the reference standard.
Methods
Data Availability Statement
The validation set, test set, and code used in this study have been made publicly available at GitHub (https://github.com/zdzdliu/PPGArrhythmiaDetection). The training data are not available to other researchers.
Study Design
Between March 2020 and March 2021, patients with arrhythmia receiving radiofrequency catheter ablation (RFCA) at Fuwai Hospital, Chinese Academy of Medical Sciences, were recruited. The inclusion criteria for this study were (1) preoperative recording of arrhythmias, such as AF, premature atrial contraction (PAC), premature ventricular contraction (PVC), ventricular tachycardia (VT), and supraventricular tachycardia (SVT); (2) presence of indications for treatment with RFCA; (3) consent for RFCA; (4) patients without malignant tumors, severe organic heart diseases, or severe arterial stenosis; (5) intraoperative ECG and photoplethysmography signals collected using a multiparameter monitoring system. The exclusion criteria were (1) intraoperative detachment of an ECG electrode or photoplethysmography sensor and (2) recording time lasting <10 minutes. We have mastered the indications for RFCA based on the knowledge of guidelines and personal experiences. 21 , 22 , 23 For AF (either paroxysmal AF or persistent AF), PAC, PVC, and VT, we performed RFCA in patients who were symptomatic when antiarrhythmic medications were ineffective, intolerant, or not desired by the patient. For SVT, we conducted RFCA in patients with symptomatic episodes. A multiparameter monitoring system (BeneVision N12; Shenzhen Mindray Bio‐Medical Electronics) with simple 5‐lead ECG wiring and a fingertip photoplethysmography sensor was used to collect ECG and photoplethysmography data. Three lead ECG signals (I, II, and V) were used for the analysis, because they basically reflect the 3‐dimensional vector of cardiac electrical conduction. The patient was in the supine position, and the sampling frequency used was 250 Hz. Informed consent was obtained from all patients who fulfilled the inclusion criteria. Clinical characteristics were abstracted from participants’ electronic medical records. This study was approved by the Ethics Committee of Fuwai Hospital (approval number 2019‐1239). The protocol was registered with the number ChiCTR2000031170 at www.chictr.org.cn.
Signal Preprocessing and Data Analysis
The collected signals were first preprocessed and then used for algorithm development, as illustrated in Figure 1. The raw ECG and photoplethysmography recordings were downsampled from 250 to 100 Hz and then bandpass filtered from 0.5 to 50 Hz and from 0.5 to 10 Hz, respectively. After being filtered, each ECG and photoplethysmography recording was split into 10‐second‐long nonoverlapping segments. The length of 10 seconds was chosen because it is large enough to identify a rhythm type and its promising results for classifying arrhythmias in the previous study. 8 Subsequently, each 10‐second photoplethysmography segment was normalized to ensure the segments all had the same scale. Normalized photoplethysmography segments corrupted by artifacts were removed using the signal quality evaluation algorithm proposed by Selvaraj et al. 24 Photoplethysmography segments with a noisy ECG reference were also excluded from the analysis because no annotation could be made based on the reference data. Subsequently, all remaining 10‐second ECG segments with sufficient signal quality were reviewed and annotated by 2 cardiologists blinded to the photoplethysmography results and each other’s diagnosis based on the standardized ECG criteria. 25 Finally, all photoplethysmography segments were labeled following the diagnosis from the corresponding ECG.
Figure 1. Overall structure of proposed method for detecting multiple arrhythmia types including signal acquisition, signal preprocessing, and algorithm development.
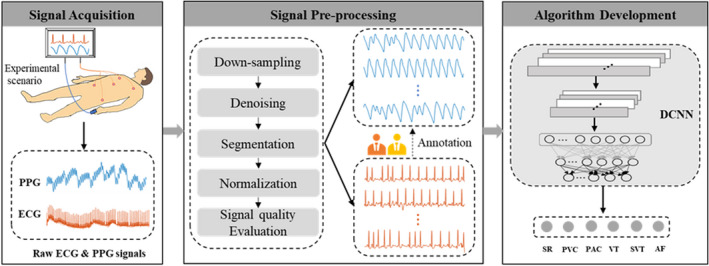
AF indicates atrial fibrillation; DCNN, deep convolutional neural network; PAC, premature atrial contraction; PPG, photoplethysmography; PVC, premature ventricular contraction; SR, sinus rhythm; SVT, supraventricular tachycardia; and VT, ventricular tachycardia.
Algorithm Development and Training
To detect multiple arrhythmia types from the photoplethysmography signals, we developed a DCNN model based on the popular convolutional neural network architecture VGGNet‐16. 26 This architecture was selected because of its simple structure and powerful data representation ability. Because the traditional VGGNet‐16 is designed for 2‐dimensional image classification, we have modified it appropriately to accommodate the 1‐dimensional input signal of this study. Details of the changes to the conventional VGGNet‐16 are presented in Data S1. After adjustments, the architecture used for the DCNN model comprised 13 one‐dimensional convolutional layers, 5 one‐dimensional max‐pooling layers, and 2 fully connected layers, as illustrated in Figure 2A. The specific structure, settings, and parameters of the DCNN model are summarized in Table S1. There are 1 496 102 trainable parameters in the model, requiring only about 5.71 MB of memory. The DCNN model accepted a 10‐second photoplethysmography segment as its input and output a label prediction of one of the target classes.
Figure 2. Architecture, development, and evaluation of the DCNN for classification of multiple arrhythmia types.
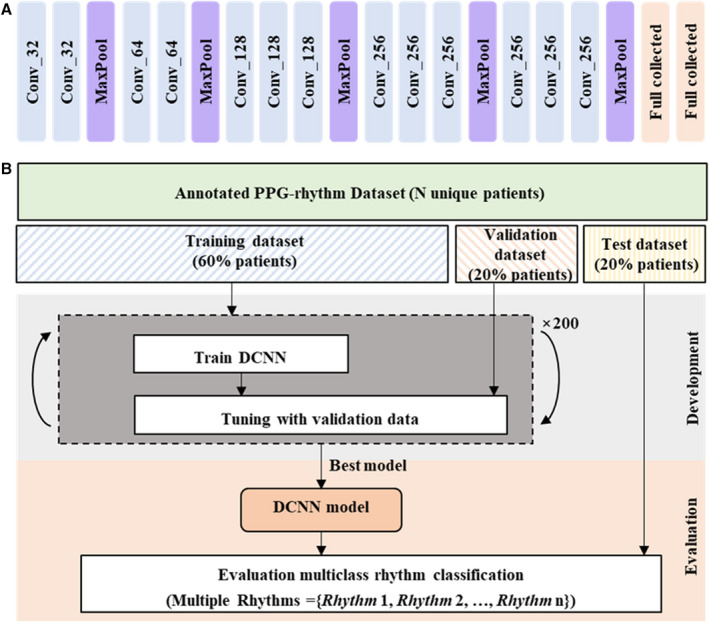
A, The DCNN model has 13 one‐dimensional convolutional layers, 5 one‐dimensional max‐pooling layers, and 2 fully connected layers. B, Workflow illustrating the data sets used to train, tune, and evaluate the DCNN model. The symbol expressed as Conv_k represents a 1‐dimensional convolution layer with k number of filters; for example, Conv_32 denotes a 1‐dimensional convolution layer with 32 filters. DCNN indicates deep convolutional neural network; MaxPool, max‐pooling; and PPG, photoplethysmography.
The procedure for training, tuning, and evaluating the model is illustrated in Figure 2B. All patients’ data were randomly partitioned into independent training, validation, and test data sets in the ratio 6:2:2. The training subset was used to train our DCNN model over 200 epochs. The model with optimal performance on the validation subset was saved and used for further evaluation with the test subset.
Statistical Analysis
Continuous variables with normal distribution were expressed as mean±SD and compared using the t test. Nonnormally distributed continuous data were expressed as median (interquartile range) and compared using the Mann‐Whitney test. Categorical variables were expressed as numbers (percentages) and compared using χ2 or Fisher exact tests as appropriate. To verify the performance of the proposed DCNN model, traditional machine learning (ML)‐based models, which rely on explicit rules and handcrafted features derived from interbeat intervals sequence and photoplethysmography waveforms, were used for comparison. Specifically, 17 handcrafted features and 4 ML algorithms (artificial neural network, random forest, k‐nearest neighbors, and support vector machine) that have been used for photoplethysmography‐based arrhythmia detection were used to develop the ML‐based detectors, as shown in Figure S1. Each ML‐based detector was trained and evaluated on the same training and test data sets as the DCNN model. A brief description of the ML‐based detectors and the handcrafted features they rely on is available in Data S2.
For each arrhythmia detector, receiver operating characteristic curves were first generated for each rhythm to be detected, and a microaverage receiver operating characteristic curve was then created. The area under the microaverage receiver operating characteristic curve and its corresponding 95% CI were computed and compared for all arrhythmia detectors using the DeLong test. 27 Sensitivity, specificity, positive predictive value, negative predictive value (NPV), and overall accuracy were also calculated for each detector, along with the corresponding 95% CI.
All statistical tests in this study were 2‐sided, and P<0.05 was considered statistically significant. SPSS version 21.0 (IBM) and Python version 3.8.8 were used for data analysis.
Visualization of the Proposed DCNN
To improve the understanding of the DCNN’s decisions, we used t‐distributed stochastic neighbor embedding and guided gradient‐weighted class activation mapping techniques for visual explanations. The t‐distributed stochastic neighbor embedding technique is a nonlinear dimensionality reduction technique well suited for embedding high‐dimensional data for visualization in a low‐dimensional space. 28 The guided gradient‐weighted class activation mapping combines fine‐grained guided backpropagation and gradient‐weighted class activation mapping. It produces a high‐resolution class‐discriminative heatmap from the final convolutional layer. 29 In this study, the features automatically learned from the various layers of the DCNN were mapped into 2‐dimensional space using t‐distributed stochastic neighbor embedding. The heat map produced using guided gradient‐weighted class activation mapping was superimposed over the photoplethysmography waveforms to highlight the regions in the photoplethysmography waveforms that were important to the DCNN for predicting a rhythm category.
Results
Study Population
Two hundred forty‐two patients with arrhythmia who met the inclusion criteria were enrolled in this study (Figure S2). Of the enrolled patients, 14 were excluded because of detachment of an ECG electrode (N=5) or photoplethysmography sensor (N=3) or because their recordings lasted <10 minutes (N=6). Two hundred twenty‐eight pairs of photoplethysmography and ECG recordings were obtained from the consenting patients (N=228; 1 recording for each patient). The 228 photoplethysmography recordings were divided into 158 355 10‐second photoplethysmography segments; 127 562 of these were retained, whereas another 30 793 (19.4%) were removed because of their poor signal quality or the poor signal quality of their ECG reference data. Among the 127 562 clean photoplethysmography segments, 118 217 (92.7%) were labeled as having a definite rhythm by the 2 cardiologists. The remaining segments were unclassified, because the 2 cardiologists could not provide the correct category.
Specifically, the segments numbered the following for each label: 38 081 for sinus rhythm (SR), 11 372 for PVC, 11 248 for PAC, 5783 for VT (3 or more consecutive PVCs at a rate of >100 beats per minute), 12 539 for SVT (3 or more consecutive PACs at a rate of >100 beats per minute), and 39 194 for AF. To train the model accurately, we removed unclassified segments. Consequently, 228 recordings with 118 217 clean 10‐second photoplethysmography segments collected from 228 patients (age, 52.3±11.3 years; 133 men) were retained in the final analysis. Each segment has only 1 identified rhythm type. Of the remaining 228 patients, we randomly separated 60% (N=137) into the training set, 20% (N=46) into the validation set, and 20% (N=45) into the test set. The segments included in the training, validation, and test sets were 71 390, 23 443, and 23 384, respectively. The baseline characteristics (Table 1) and the distribution of rhythm classes (Figure 3) were similar among the 3 data sets. Examples of 10‐second synchronous I‐lead ECG and photoplethysmography signal segments for various rhythm types are presented in Figure S3.
Table 1.
Baseline Characteristics of the Patients Included in the Study
| All patients, N=228 | Training set, N=137 | Validation set, N=46 | P value* | Test set, N=45 | P value † | |
|---|---|---|---|---|---|---|
| Age, y | 52.3±11.3 | 53.1±10.3 | 52.0±13.3 | 0.576 | 50.4±12.1 | 0.141 |
| Men, n (%) | 133 (58.3) | 88 (62.2) | 24 (52.2) | 0.146 | 21 (46.7) | 0.037 |
| BMI, kg/m2 | 25.5±2.9 | 25.5±2.4 | 25.3±3.2 | 0.701 | 25.5±4.0 | 0.958 |
| SBP, mm Hg | 130.4±14.8 | 130.3±12.6 | 132.8±21.4 | 0.344 | 127.9±12.8 | 0.273 |
| DBP, mm Hg | 82.5±10.2 | 82.9±9.3 | 82.9±14.4 | 0.967 | 80.8±7.4 | 0.187 |
| CHA2DS2‐VASc score | 1.0 (0.0–2.0) | 1.0 (0.0–2.0) | 1.0 (1.0–3.0) | 0.404 | 1.0 (0.3–2.0) | 0.805 |
| Hypertension, n (%) | 38 (16.7) | 20 (14.6) | 12 (26.1) | 0.076 | 6 (13.3) | 0.833 |
Continuous variables are given as mean±SD or median (interquartile range). Categorical variables are given as n (percent). CHA2DS2‐VASc score: heart failure=1 point; hypertension=1 point; age ≥75 years=2 points; diabetes=1 point; stroke=2 points; vascular disease=1 point; age between 65 and 74 years=1 point; gender (women)=1 point. BMI indicates body mass index; DBP, diastolic blood pressure; and SBP, systolic blood pressure.
P value was obtained by comparison of the training and validation sets.
P value was obtained by comparison of the training and test sets.
Figure 3. Distribution of rhythm types across data sets.
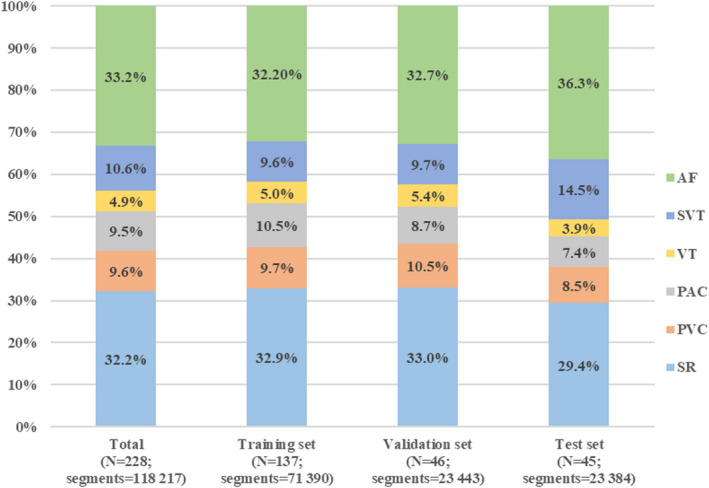
AF indicates atrial fibrillation; PAC, premature atrial contraction; PVC, premature ventricular contraction; SR, sinus rhythm; SVT, supraventricular tachycardia; and VT, ventricular tachycardia.
Multiclass Rhythm Classification
The performance of the DCNN in identifying multiple rhythms in the test set is summarized in Table 2; the corresponding confusion matrix and microaverage receiver operating characteristic results are provided in Figures 4A and 4B, respectively. The DCNN distinguished 6 rhythm types, SR, PVC, PAC, VT, SVT, and AF, in the photoplethysmography waveforms at an overall accuracy of 85.0% (95% CI, 84.6%–85.4%). Specifically, the average sensitivity, specificity, positive predictive value, and NPV for these 6 rhythm types were 75.8% (95% CI, 74.2%–77.4%), 96.9% (95% CI, 96.7%–97.1%), 75.2% (95% CI, 73.7%–76.8%), and 97.0% (95% CI, 96.4%–97.6%), respectively.
Table 2.
Performance of the Deep Convolutional Neural Network for Classification of 6 Rhythms in the Test Set
| Value, % (95% CI) | ||||
|---|---|---|---|---|
| Sensitivity | Specificity | PPV | NPV | |
| SR | 95.6 (95.2–96.2) | 98.8 (98.6–98.9) | 97.0 (96.6–97.4) | 98.2 (97.9–98.5) |
| PVC | 68.5 (66.4–70.5) | 98.0 (97.9–98.2) | 76.1 (74.3–78.2) | 97.1 (96.5–97.8) |
| PAC | 55.5 (53.2–57.9) | 97.0 (96.8–97.2) | 59.9 (57.5–62.3) | 96.5 (95.6–97.3) |
| VT | 72.7 (69.8–75.6) | 96.4 (96.1–96.6) | 44.9 (42.3–47.4) | 98.9 (97.9–99.8) |
| SVT | 68.0 (66.5–69.6) | 97.8 (97.6–98.1) | 84.1 (82.9–85.6) | 94.2 (97.9–95.3) |
| AF | 94.4 (93.9–94.9) | 93.4 (93.0–93.8) | 89.1 (88.4–89.7) | 96.7 (96.2–97.2) |
| Average | 75.8 (74.2–77.4)* | 96.9 (96.7–97.1)* | 75.2 (73.7–76.8)* | 97.0 (96.4–97.6)* |
| Overall accuracy | 85.0 (84.6–85.4)* | |||
AF indicates atrial fibrillation; NPV, negative predictive value; PAC, premature atrial contraction; PPV, positive predictive value; PVC, premature ventricular contraction; SR, sinus rhythm; SVT, supraventricular tachycardia; and VT, ventricular tachycardia.
Significance level at 0.05.
Figure 4. Results of the confusion matrix and ROC curves.
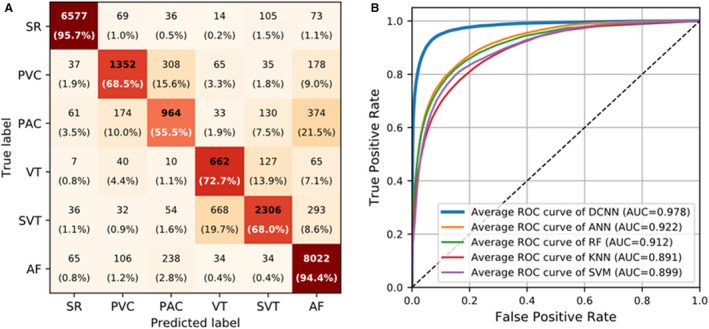
A, Confusion matrix with numbers and relative percentages to evaluate the performance of the DCNN for 6‐rhythm discrimination. B, Microaverage ROC curves of the DCNN and ML‐based detectors for 6‐rhythm discrimination. In (A), rows represent the categories given by the reference standard, and columns represent the categories predicted by the DCNN. Percentages were calculated by normalizing the results horizontally. AF indicates atrial fibrillation; ANN, artificial neural network; AUC, area under the ROC curve; DCNN, deep convolutional neural network; KNN, k‐nearest neighbors; PAC, premature atrial contraction; PVC, premature ventricular contraction; RF, random forest; ROC, receiver operating characteristic; SR, sinus rhythm; SVM, support vector machine; SVT, supraventricular tachycardia; and VT, ventricular tachycardia.
According to the classification results of the 6 rhythms, the performances of the DCNN model in classifying 4 rhythms and 2 rhythms were further evaluated. For the classification of the 4 rhythms, PVC and PAC were considered as one category, and VT and SVT were considered as another category, whereas for the classification of the 2 rhythms, PVC, PAC, VT, SVT, and AF were considered as the same class (ie, non‐SR). The overall accuracy and average sensitivity of the DCNN increased to 90.4% (95% CI, 90.1%–90.9%) and 88.2% (95% CI, 87.4%–89.1%) when classifying the 4 rhythms (Table S2) and to 97.8% (95% CI, 97.7%–98.0%) and 97.2% (95% CI, 96.9%–97.5%) when classifying the 2 rhythms (Table S3).
Table 3 shows a comparison of the performance of DCNN and conventional ML‐based detectors in terms of overall accuracy and average sensitivity, specificity, positive predictive value, and NPV for the classification of 6 rhythms on the same test set. The detailed performance of the ML‐based detectors for each rhythm type is summarized in Table S4. As indicated in Table 3, the ML‐based detector obtained using the artificial neural network algorithm had the highest performance among the ML‐based detectors in all evaluation metrics. Still, it did not perform as well as the DCNN did. The DCNN model outperformed the best ML‐based model (the artificial neural network–based model) by 15.6%, 22.1%, 3.8%, 19.2%, and 3.3% in overall accuracy and average sensitivity, specificity, positive predictive value, and NPV, respectively. Moreover, the area under the microaverage receiver operating characteristic curve of the DCNN was 0.978 (95% CI, 0.975–0.979), significantly higher than those of all ML‐based detectors (area under the microaverage receiver operating characteristic curve, 0.891–0.922; P<0.001; Figure 4B).
Table 3.
DCNN Performance for Classification of Multiple Rhythms Versus Several Machine Learning–Based Arrhythmia Classifiers
| Value, % (95% CI) | |||||
|---|---|---|---|---|---|
| Method | Average sensitivity | Average specificity | Average PPV | Average NPV | Overall accuracy |
| ML based | |||||
| ANN | 53.7 (52.0–55.3) | 93.1 (92.8–93.4) | 56.0 (53.9–58.0) | 93.7 (92.8–94.6) | 69.4 (68.9–70.1) |
| RF | 51.8 (50.1–53.5) | 92.8 (92.4–93.1) | 53.9 (52.0–55.9) | 93.3 (92.4–94.2) | 67.9 (67.3–68.5) |
| KNN | 41.7 (40.2–43.1) | 91.2 (90.9–91.6) | 49.8 (47.1–52.4) | 92.4 (91.4–93.3) | 63.2 (62.6–63.8) |
| SVM | 44.9 (43.4–46.3) | 91.9 (91.5–92.2) | 53.7 (50.7–56.8) | 92.9 (92.0–93.8) | 65.6 (65.0–66.2) |
| DCNN | 75.8 (74.2–77.4)* | 96.9 (96.7–97.1)* | 75.2 (73.7–76.8)* | 97.0 (96.4–97.6)* | 85.0 (84.6–85.4)* |
ANN indicates artificial neural network; DCNN, deep convolutional neural network; KNN, k‐nearest neighbors; ML, machine learning; NPV, negative predictive value; PPV, positive predictive value; RF, random forest; and SVM, support vector machine.
Significance level at 0.05.
Visualization of Learned Features
Figure 5 presents the t‐distributed stochastic neighbor embedding visualizations of features learned from the various layers of the DCNN. In Figure 5, each point represents a photoplethysmography waveform mapped from the output features of a specific hidden layer in the DCNN into 2 dimensions. Points that belong to the same rhythm category are clustered. To balance the samples for a clearer display, we randomly selected 900 segments from each rhythm class (5400 in total) in the test set as a presentation data set and visualized the output features obtained at some representative layers (second, fourth, seventh, and 13th convolutional layers) of the DCNN. As illustrated in Figure 5, the degree of feature discrimination increased considerably overall with the depth of the DCNN.
Figure 5. t‐SNE visualizations of learned features from representative layers in the DCNN: (A) second, (B) fourth, (C) seventh, and (D) 13th convolutional layers.
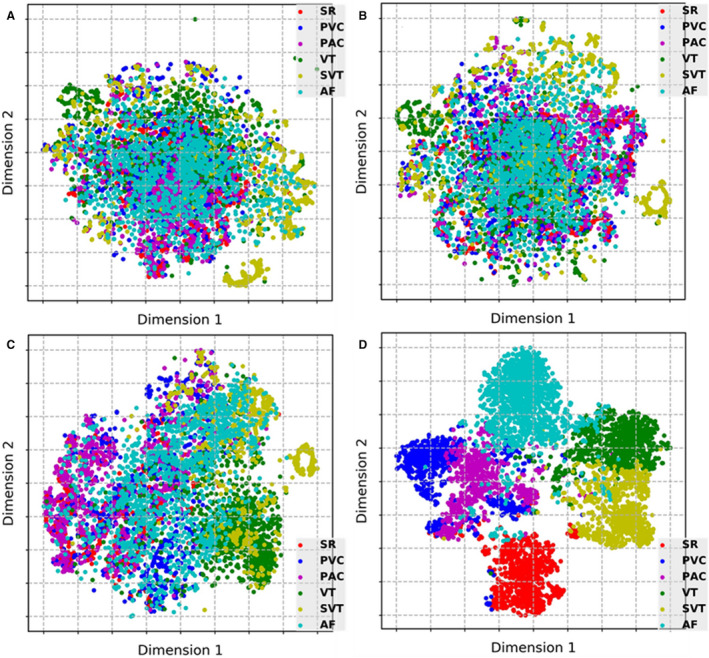
AF indicates atrial fibrillation; DCNN, deep convolutional neural network; PAC, premature atrial contraction; PVC, premature ventricular contraction; SR, sinus rhythm; SVT, supraventricular tachycardia; t‐SNE, t‐distributed stochastic neighbor embedding; and VT, ventricular tachycardia.
Figure 6 illustrates examples of using the guided gradient‐weighted class activation mapping approach to visualize crucial regions within the photoplethysmography signals that enabled the DCNN to predict a specific rhythm category. The I‐lead ECG signals corresponding to the photoplethysmography are also shown. The darker color in Figure 6 indicates greater importance and a more significant contribution for the predicated category. The patterns specific to each rhythm have a larger attention weight. Specifically, the highlights of photoplethysmography in the cases of SR and AF were mainly focused on the positions of peaks that reflect the regularity of a pulse in waveforms. In the PVC and PAC cases, the waves with premature contractions appeared to be strongly highlighted. In the VT and SVT cases, the strongly highlighted waves were concentrated in consecutive PVC and PAC events that indicate the occurrence of VT and SVT.
Figure 6. Examples of PPG waveforms with a Guided Grad‐CAM visualization showing crucial regions for the DCNN to predict a certain triage category: (A) sinus rhythm, (B) premature ventricular contraction, (C) premature atrial contraction, (D) ventricular tachycardia, (E) supraventricular tachycardia, and (F) atrial fibrillation. In each panel, the I‐lead ECG waveform corresponding to the PPG is also shown.
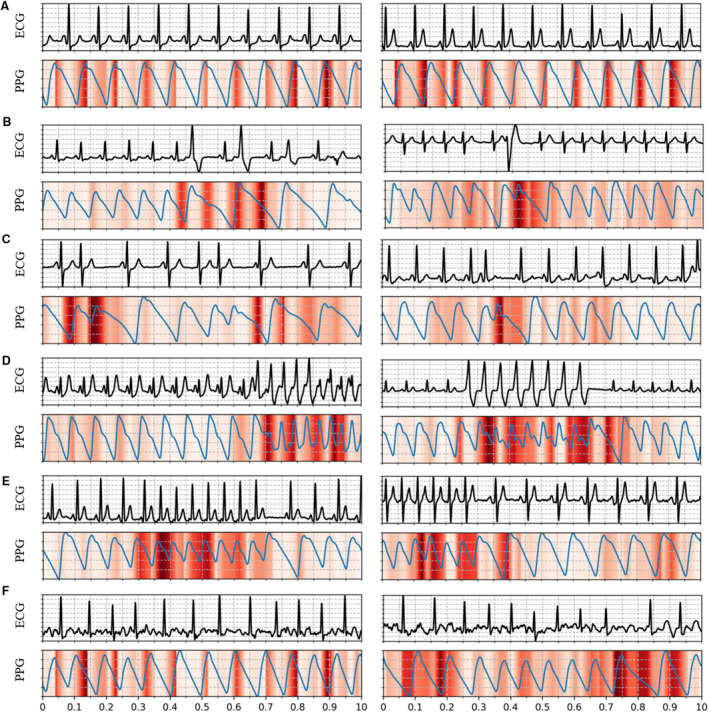
DCNN indicates deep convolutional neural network; Guided Grad‐CAM: guided gradient‐weighted class activation mapping; and PPG, photoplethysmography.
Discussion
This study validated the use of a deep learning‐based approach to detect multiple rhythms from raw fingertip photoplethysmography waveforms obtained in a controlled hospital setting. We demonstrated that the DCNN performs well in diagnosing multiple types of rhythms based on photoplethysmography signals. Using ECG‐based annotations as the reference, the DCNN achieved an overall accuracy of 85.0% in classifying 6 types of rhythms (5 arrhythmias included) from photoplethysmography signals and performed better than state‐of‐the‐art nondeep learning methods using handcrafted features. Our study indicated the feasibility of using a deep learning algorithm to detect multiple types of arrhythmias from photoplethysmography signals.
Previous Studies on Detection of Multiple Arrhythmia Types from Photoplethysmography Signals
Previous studies have used ML or deep learning techniques to detect arrhythmias from photoplethysmography signals. The ML‐based solutions for arrhythmia detection from photoplethysmography signals involve calculating handcrafted features from a sequence of interbeat intervals and the photoplethysmography waveform. For instance, McManus et al proposed a linear detection algorithm that combined 2 statistical features calculated from the interbeat intervals sequences and achieved an accuracy of 96.8% in distinguishing AF versus SR from photoplethysmography signals. 13 Sološenko et al investigated a feed‐forward artificial neural network framework with 6 photoplethysmography features as inputs for discriminating PVC from SR in photoplethysmography signals and obtained a sensitivity of 98% and specificity of 98%. 14 Polanía et al used a support vector machine algorithm that combines frequency‐domain and nonlinear dynamics features extracted from the interbeat intervals series and pulse amplitude information of photoplethysmography signals to distinguish between different arrhythmia types. 15 Experimental results on 2 subjects showed that their proposed method identified PVC and VT from SR and PAC in photoplethysmography signals with 96.0% and 93.9% accuracy, respectively. These ML‐based studies, however, have mainly focused on the discrimination between 2 rhythm types. Limited attention has been paid to the detection of multiple arrhythmia types.
In recent years, deep learning techniques, represented by DCNN, have achieved great success in computer vision. 30 These techniques simplify the feature extraction process (ie, automatically learn features from the original signal without the help of feature engineering) and provide an end‐to‐end solution for disease classification. 19 With deep learning, solving the problem of detecting multiple types of arrhythmias from photoplethysmography signals is promising. Poh et al proposed a convolutional neural network architecture with 6 dense blocks to detect noise, SR, ectopy rhythm, and AF from photoplethysmography signals and reported an overall accuracy of 96.1%. 16 Aliamiri et al developed a hybrid convolutional neural network and recurrent neural network model for noise, AF, and non‐AF segment classification on the basis of photoplethysmography signals and achieved a >99% area under the curve for AF detection. 17 However, these studies did not validate the performance of their model in detecting more types of arrhythmias from photoplethysmography signals.
This study developed a deep learning model based on VGGNet‐16 to detect multiple arrhythmia types from photoplethysmography signals. Our results revealed that our model significantly outperformed the ML‐based models in detecting multiple rhythms from photoplethysmography signals. More importantly, we achieved an overall accuracy of 85.0% in classifying 5 types of arrhythmias (PVC, PAC, VT, SVT, and AF) and SR, thus validating the feasibility of detecting several arrhythmias through photoplethysmography signals.
Results of Multiple Arrhythmia Detection Based on Photoplethysmography in Our Study
PVC and PAC are similar premature heartbeats that disrupt the regular heart rhythm. Because of their distinctive waveform morphologies in the ECG, PVC and PAC can be well detected by ECG data. However, because of the absence of ECG QRS‐ and P‐wave information in the photoplethysmography, PVC and PAC (or VT and SVT) have similar patterns in the photoplethysmography waveforms, as shown in Figure 6. These similar patterns make it difficult to use photoplethysmography to distinguish PVC from PAC and thus VT from SVT. Therefore, PVC and PAC were usually regarded as 1 class to be detected in previous photoplethysmography‐based studies to obtain high accuracy. 12 , 16 Our study found that the DCNN model showed a relatively low accuracy in detecting PVC, PAC, VT, and SVT compared with detecting SR and AF. Overall, 15.6% of PVCs and 21.5% of PACs were misidentified as PACs and AFs, respectively; 13.9% of VTs and 19.7% of SVTs were misclassified as SVTs and VTs, respectively; accounting for the first false‐negative results of PVCs, PACs, VTs, and SVTs, as shown in Figure 4A. Therefore, the model must be improved before clinical implementation. However, the present results are consistent with previous findings that ectopic rhythms are the main reason for false results when using photoplethysmography arrhythmia detection. 16 , 18
Notably, the main issue for a screening tool is to have a high sensitivity value. The average sensitivity of the DCNN model for detecting 6 rhythms was 75.8% (Table 2) and then improved to 88.2% (Table S3) and 97.2% (Table S4) for detecting 4 and 2 rhythms, respectively. However, the algorithm exhibited high specificity and NPV across all categories regardless of the number of rhythm types to be detected. High specificity and NPV, which can prevent causing needless angst in patients and reduce the costs of follow‐up investigations, are also essential for a large‐scale screening tool. 31
As the most common cardiac arrhythmia, AF is one of the critical types identified by various arrhythmia detection methods. Compared with other studies that focused only on the determination of AF, 12 , 13 , 17 , 18 more types of arrhythmias were included in our study. Moreover, even with a high burden of ectopic rhythms (ie, the segments of PVC, PAC, VT, and SVT [a group of rhythms that severely interfere with AF detection] accounted for 34.6% of the total segments, as shown in Figure 3), the DCNN revealed high accuracy (94.4% sensitivity and 93.4% specificity) in discriminating AF from photoplethysmography signals, implying the higher robustness of our model.
Clinical Application Prospect
The approach of this study has several potential clinical applications. First, the photoplethysmography‐based approach offers a patient‐friendly and convenient solution for arrhythmia detection. Although traditional ECG monitors are common and easily accessible in the clinic, the measurement of ECG signals requires electrodes to be attached to the body, resulting in discomfort and poor patient compliance, especially after wearing the device for a long time (eg, 24‐hour Holter). Photoplethysmography measurement devices, however, can be worn more comfortably, because no additional accessories (eg, electrodes) are needed, making them more appealing and accessible to patients.
Second, photoplethysmography provides an unobtrusive method for continuous monitoring of arrhythmias in daily life. Although current ECG‐based wearable devices can facilitate the measurement of ECG by reducing the number of electrodes, these devices still require active patient participation during implementation (eg, watch‐based ECG monitors need users to place their fingers on the peripheral electrodes), resulting in the inability to monitor ECG continuously. Moreover, some patients with asymptomatic arrhythmias (eg, asymptomatic AF) may not take the initiative to measure their ECG, thus affecting the timely detection of arrhythmias. In contrast, photoplethysmography‐based wearable devices enable long‐term and real‐time measurements of photoplethysmography without disturbing the patients and without requiring their compliance, thus ensuring continuous monitoring of the cardiac rhythm.
Third, photoplethysmography may be used for the prejudgment of arrhythmias before ECG makes the final diagnosis. Today, several wearable devices have integrated both ECG and photoplethysmography sensors. During daily monitoring with these wearable devices, if the users actively measure the ECG after receiving an alert of an abnormal cardiac rhythm detected by the photoplethysmography, it will reduce the incidence of missed detection of irregular rhythms and allow for a precise diagnosis based on the ECG.
Limitations
This study has several limitations. First, to prevent any additional increase in time taken or cost incurred, we used a simple 5‐lead ECG wire instead of a formal 12‐lead ECG wire, and only 3‐lead ECG signals (I, II, and V) were used for analysis. The reliance on 3‐lead ECG signals to generate a reference diagnosis may produce false results. However, the 3‐lead ECG signals (I, II, and V) reflected the 3‐dimensional vector of cardiac electrical conduction and were reviewed by 2 cardiologists. Second, all photoplethysmography and ECG recordings were obtained using a commercial multiparameter monitor under controlled hospital conditions. The performance of the proposed DCNN has not been validated on photoplethysmography data sets collected from wearable devices used in everyday life. However, given the generalizability of the deep learning algorithm, the hardware used to acquire photoplethysmography signals is unlikely to affect the accuracy of the DCNN, provided the photoplethysmography recordings input to the model are of sufficient resolution and signal quality. Additionally, the DCNN only requires a photoplethysmography segment as short as 10 seconds, making it easy to obtain noise‐free waveforms. Third, the primary arrhythmias included in this study were AF, SVT, VT, PAC, and PVC. Slow arrhythmias were not included in this study. Fourth, this was a single‐center study with no additional independent test sets collected from other centers. Last, the model’s accuracy for detecting PAC, PVC, SVT, and VT needs to be further improved. In the future, a multicenter study with a larger sample and arrhythmia type is required to develop a more accurate model. Furthermore, a test on photoplethysmography data sets collected using wearable devices in an unsupervised home setting is needed to reveal the performance of the proposed DCNN for multiclass arrhythmias detection.
Conclusions
This study evaluated the feasibility of using a deep learning algorithm to classify multiple arrhythmia types from photoplethysmography signals. Our results suggest that the proposed DCNN can, with high accuracy, classify photoplethysmography signals of 10‐second duration into those indicating SR, PVC, PAC, VT, SVT, and AF. The convenience of the photoplethysmography method supports a potential step toward developing a cost‐effective tool for large‐scale arrhythmia screening in nonhospital settings.
Source of Funding
This study was supported in part by the Strategic Priority Chinese Academy of Sciences Project (XDB38040200), in part by the National Natural Science Foundation of China (U1913210, 81901834, and 62073310), in part by the Guangdong Basic and Applied Basic Research Foundation (2020A1515010654), and in part by the Basic Research Project of Shenzhen (JCYJ20180703145202065).
Disclosures
None.
Supporting information
Acknowledgments
This article was edited by Wallace Academic Editing.
Supplementary Material for this article is available at https://www.ahajournals.org/doi/suppl/10.1161/JAHA.121.023555
For Sources of Funding and Disclosures, see page 12.
Contributor Information
Min Tang, Email: doctortangminfw@163.com.
Fen Miao, Email: fen.miao@siat.ac.cn.
References
- 1. Lloyd‐Jones DM, Wang TJ, Leip EP, Larson MG, Levy D, Vasan RS, D’Agostino RB, Massaro JM, Beiser A, Wolf PA, et al. Lifetime risk for development of atrial fibrillation: the framingham heart study. Circulation. 2004;110:1042–1046. doi: 10.1161/01.CIR.0000140263.20897.42 [DOI] [PubMed] [Google Scholar]
- 2. Wolf PA, Dawber TR, Thomas HE, Kannel WB. Epidemiologic assessment of chronic atrial fibrillation and risk of stroke: the fiamingham study. Neurology. 1978;28:973. doi: 10.1212/WNL.28.10.973 [DOI] [PubMed] [Google Scholar]
- 3. Wang TJ, Larson MG, Levy D, Vasan RS, Leip EP, Wolf PA, D’Agostino RB, Murabito JM, Kannel WB, Benjamin EJ. Temporal relations of atrial fibrillation and congestive heart failure and their joint influence on mortality: the framingham heart study. Circulation. 2003;107:2920–2925. doi: 10.1161/01.CIR.0000072767.89944.6E [DOI] [PubMed] [Google Scholar]
- 4. Mehra R. Global public health problem of sudden cardiac death. J Electrocardiol. 2007;40:S118–S122. doi: 10.1016/j.jelectrocard.2007.06.023 [DOI] [PubMed] [Google Scholar]
- 5. Schmidt C, Kisselbach J, Schweizer PA, Katus HA, Thomas D. The pathology and treatment of cardiac arrhythmias: focus on atrial fibrillation. Vasc Health Risk Manag. 2011;7:193. [DOI] [PMC free article] [PubMed] [Google Scholar]
- 6. Wang R, Fan J, Li Y. Deep multi‐scale fusion neural network for multi‐class arrhythmia detection. IEEE J Biomed Health Inform. 2020;24:2461–2472. doi: 10.1109/JBHI.2020.2981526 [DOI] [PubMed] [Google Scholar]
- 7. Yao Q, Wang R, Fan X, Liu J, Li Y. Multi‐class arrhythmia detection from 12‐lead varied‐length ECG using attention‐based time‐incremental convolutional neural network. Information Fusion. 2020;53:174–182. doi: 10.1016/j.inffus.2019.06.024 [DOI] [Google Scholar]
- 8. Fan X, Yao Q, Cai Y, Miao F, Sun F, Li Y. Multiscaled fusion of deep convolutional neural networks for screening atrial fibrillation from single lead short ECG recordings. IEEE J Biomed Health Inform. 2018;22:1744–1753. doi: 10.1109/JBHI.2018.2858789 [DOI] [PubMed] [Google Scholar]
- 9. Benjamin EJ, Chen P‐S, Bild DE, Mascette AM, Albert CM, Alonso A, Calkins H, Connolly SJ, Curtis AB, Darbar D, et al. Prevention of atrial fibrillation: report from a national heart, lung, and blood institute workshop. Circulation. 2009;119:606–618. doi: 10.1161/CIRCULATIONAHA.108.825380 [DOI] [PMC free article] [PubMed] [Google Scholar]
- 10. Allen J. Photoplethysmography and its application in clinical physiological measurement. Physiol Meas. 2007;28:R1. doi: 10.1088/0967-3334/28/3/R01 [DOI] [PubMed] [Google Scholar]
- 11. Chan PH, Wong CK, Poh YC, Pun L, Leung WWC, Wong YF, Wong MMY, Poh MZ, Chu DWS, Siu CW. Diagnostic performance of a smartphone‐based photoplethysmographic application for atrial fibrillation screening in a primary care setting. J Am Heart Assoc. 2016;5:e003428. doi: 10.1161/JAHA.116.003428 [DOI] [PMC free article] [PubMed] [Google Scholar]
- 12. Bonomi AG, Schipper F, Eerikäinen LM, Margarito J, van Dinther R, Muesch G, de Morree HM, Aarts RM, Babaeizadeh S, McManus DD, et al. Atrial fibrillation detection using a novel cardiac ambulatory monitor based on photo‐plethysmography at the wrist. J Am Heart Assoc. 2018;7:e009351. doi: 10.1161/JAHA.118.009351 [DOI] [PMC free article] [PubMed] [Google Scholar]
- 13. McManus DD, Lee J, Maitas O, Esa N, Pidikiti R, Carlucci A, Harrington J, Mick E, Chon KH. A novel application for the detection of an irregular pulse using an iphone 4s in patients with atrial fibrillation. Heart Rhythm. 2013;10:315–319. doi: 10.1016/j.hrthm.2012.12.001 [DOI] [PMC free article] [PubMed] [Google Scholar]
- 14. Sološenko A, Petrėnas A, Marozas V. Photoplethysmography‐based method for automatic detection of premature ventricular contractions. IEEE Trans Biomed Circuits Syst. 2015;9:662–669. doi: 10.1109/TBCAS.2015.2477437 [DOI] [PubMed] [Google Scholar]
- 15. Polanía LF, Mestha LK, Huang DT, Couderc J‐P. Method for classifying cardiac arrhythmias using photoplethysmography. 2015 37th Annual International Conference of the IEEE Engineering in Medicine and Biology Society (EMBC). 2015:6574‐6577 [DOI] [PubMed]
- 16. Poh M‐Z, Poh YC, Chan P‐H, Wong C‐K, Pun L, Leung WW‐C, Wong Y‐F, Wong MM‐Y, Chu DW‐S, Siu C‐W. Diagnostic assessment of a deep learning system for detecting atrial fibrillation in pulse waveforms. Heart. 2018;104:1921–1928. doi: 10.1136/heartjnl-2018-313147 [DOI] [PubMed] [Google Scholar]
- 17. Aliamiri A, Shen Y. Deep learning based atrial fibrillation detection using wearable photoplethysmography sensor. IEEE EMBS International Conference on Biomedical & Health Informatics (BHI). 2018;2018:442–445. [Google Scholar]
- 18. Kwon S, Hong J, Choi E‐K, Lee E, Hostallero DE, Kang WJ, Lee B, Jeong E‐R, Koo B‐K, Oh S, et al. Deep learning approaches to detect atrial fibrillation using photoplethysmographic signals: Algorithms development study. JMIR mHealth and uHealth. 2019;7:e12770. doi: 10.2196/12770 [DOI] [PMC free article] [PubMed] [Google Scholar]
- 19. Pereira T, Tran N, Gadhoumi K, Pelter MM, Do DH, Lee RJ, Colorado R, Meisel K, Hu X. Photoplethysmography based atrial fibrillation detection: a review. NPJ Digital Medicine. 2020;3:1–12. doi: 10.1038/s41746-019-0207-9 [DOI] [PMC free article] [PubMed] [Google Scholar]
- 20. Fu D‐G. Cardiac arrhythmias: diagnosis, symptoms, and treatments. Cell Biochem Biophys. 2015;73:291–296. doi: 10.1007/s12013-015-0626-4 [DOI] [PubMed] [Google Scholar]
- 21. Hindricks G, Potpara T, Dagres N, Arbelo E, Bax JJ, Blomström‐Lundqvist C, Boriani G, Castella M, Dan GA, Dilaveris PE, et al. 2020 esc guidelines for the diagnosis and management of atrial fibrillation developed in collaboration with the European association of cardio‐thoracic surgery (eacts). Eur Heart J. 2021;42:373–498. doi: 10.1093/eurheartj/ehaa612 [DOI] [PubMed] [Google Scholar]
- 22. Al‐Khatib SM, Stevenson WG, Ackerman MJ, Bryant WJ, Callans DJ, Curtis AB, Deal BJ, Dickfeld T, Field ME, Fonarow GC, et al. 2017 aha/acc/hrs guideline for management of patients with ventricular arrhythmias and the prevention of sudden cardiac death: Executive summary: a report of the American college of cardiology/American heart association task force on clinical practice guidelines and the heart rhythm society. Circulation. 2018;138:e210–e271. doi: 10.1161/CIR.0000000000000548 [DOI] [PubMed] [Google Scholar]
- 23. Brugada J, Katritsis DG, Arbelo E, Arribas F, Bax JJ, Blomström‐Lundqvist C, Calkins H, Corrado D, Deftereos SG, Diller G‐P, et al. 2019 esc guidelines for the management of patients with supraventricular tachycardiathe task force for the management of patients with supraventricular tachycardia of the european society of cardiology (esc). Eur Heart J. 2020;41:655–720. doi: 10.1093/eurheartj/ehz467 [DOI] [PubMed] [Google Scholar]
- 24. Selvaraj N, Mendelson Y, Shelley KH, Silverman DG, Chon KH. Statistical approach for the detection of motion/noise artifacts in photoplethysmogram. Annual International Conference of the IEEE Engineering in Medicine and Biology Society. 2011;2011:4972–4975. [DOI] [PubMed] [Google Scholar]
- 25. Issa ZF, Miller JM, Zipes DP. Clinical arrhythmology and electrophysiology: a companion to braunwald's heart disease. In: Elsevier Health Sciences. Philadelphia, PA: Saunders Elsevier; 2009. [Google Scholar]
- 26. Simonyan K, Zisserman A. Very deep convolutional networks for large‐scale image recognition. arXiv. Preprint posted online September 4, 2014. doi: 10.48550/arXiv.1409.1556 [DOI] [Google Scholar]
- 27. DeLong ER, DeLong DM, Clarke‐Pearson DL. Comparing the areas under two or more correlated receiver operating characteristic curves: a nonparametric approach. Biometrics. 1988;837–845. doi: 10.2307/2531595 [DOI] [PubMed] [Google Scholar]
- 28. Van der Maaten L, Hinton G. Visualizing data using t‐sne. J Mach Learn Res. 2008;9:2579–2605. [Google Scholar]
- 29. Selvaraju RR, Cogswell M, Das A, Vedantam R, Parikh D, Grad‐cam BD. Grad‐cam: visual explanations from deep networks via gradient‐based localization. In: Proceedings of the IEEE international conference on computer vision ; 2017:618–626. doi: 10.1109/ICCV.2017.74 [DOI]
- 30. Khan A, Sohail A, Zahoora U, Qureshi AS. A survey of the recent architectures of deep convolutional neural networks. Artif Intell Rev. 2020;53:5455–5516. doi: 10.1007/s10462-020-09825-6 [DOI] [Google Scholar]
- 31. Altman DG. Practical Statistics for Medical Research. 1st ed. New York: Chapman & Hall/CRC; 1990. doi: 10.1201/9780429258589 [DOI] [Google Scholar]
- 32. Eerikäinen LM, Bonomi AG, Schipper F, Dekker LR, de Morree HM, Vullings R, Aarts RM. Detecting atrial fibrillation and atrial flutter in daily life using photoplethysmography data. IEEE J Biomed Health Inform. 2019;24:1610–1618. doi: 10.1109/JBHI.2019.2950574 [DOI] [PubMed] [Google Scholar]
- 33. Tateno K, Glass L. Automatic detection of atrial fibrillation using the coefficient of variation and density histograms of rr and δrr intervals. Med Biol Eng Compu. 2001;39:664–671. doi: 10.1007/BF02345439 [DOI] [PubMed] [Google Scholar]
- 34. Lake DE, Moorman JR. Accurate estimation of entropy in very short physiological time series: the problem of atrial fibrillation detection in implanted ventricular devices. Am J of Physiol‐Heart Circul Physiol. 2011;300:H319–H325. doi: 10.1152/ajpheart.00561.2010 [DOI] [PubMed] [Google Scholar]
- 35. Sarkar S, Ritscher D, Mehra R. A detector for a chronic implantable atrial tachyarrhythmia monitor. IEEE Trans Biomed Eng. 2008;55:1219–1224. doi: 10.1109/TBME.2007.903707 [DOI] [PubMed] [Google Scholar]
- 36. Corino VD, Laureanti R, Ferranti L, Scarpini G, Lombardi F, Mainardi LT. Detection of atrial fibrillation episodes using a wristband device. Physiol Meas. 2017;38:787. doi: 10.1088/1361-6579/aa5dd7 [DOI] [PubMed] [Google Scholar]
- 37. Pedregosa F, Varoquaux G, Gramfort A, Michel V, Thirion B, Grisel O, Blondel M, Prettenhofer P, Weiss R, Scikit‐learn DV. Machine learning in python. J Mach Lear Res. 2011;12:2825–2830. [Google Scholar]
- 38. Namdari A, Li Z. A review of entropy measures for uncertainty quantification of stochastic processes. Adv Mech Eng. 2019;11:1687814019857350. doi: 10.1177/1687814019857350 [DOI] [Google Scholar]
- 39. Krivoshei L, Weber S, Burkard T, Maseli A, Brasier N, Kühne M, Conen D, Huebner T, Seeck A, Eckstein J. Smart detection of atrial fibrillation. EP Europace. 2017;19:753–757. [DOI] [PMC free article] [PubMed] [Google Scholar]
- 40. Kugiumtzis D, Tsimpiris A. Measures of analysis of time series (mats): a matlab toolkit for computation of multiple measures on time series data bases. arXiv. Preprint posted online 9, Feb 2010. doi: 10.48550/arXiv.1002.1940 [DOI] [Google Scholar]
Associated Data
This section collects any data citations, data availability statements, or supplementary materials included in this article.
Supplementary Materials
Data Availability Statement
The validation set, test set, and code used in this study have been made publicly available at GitHub (https://github.com/zdzdliu/PPGArrhythmiaDetection). The training data are not available to other researchers.