Abstract
As an environmentally friendly and low-cost adsorbent, biochar has great potential in wastewater treatment. This study investigated biochar derived from Platanus orientalis L. leaves (PLB) activated by KOH in terms of its capacity and reusability to adsorb p-nitrophenol (PNP). PLB had a large specific surface area and total pore volume, and exhibits good PNP removal with a maximal adsorption capacity of 622.73 mg g−1 at 298 K. Batch experiments showed that PLB had a high PNP adsorption capacity under acidic conditions. Experimental results were well described by the pseudo-second-order kinetic model and the Langmuir adsorption isotherm model. The thermodynamic study showed that PNP adsorption was a spontaneously exothermic process, and increasing temperature was not conducive to adsorption. In addition, PNP adsorption was mainly attributed to hydrophobic interaction. The regeneration experiment showed that PLB had good reusability. After the fifth regeneration, the adsorption capacity of PLB still reached 557.05 mg g−1. The deactivation of oxygen-containing functional groups and pore blockage were the causes for the decrease in adsorption capacity of the recycled PLB. Moreover, the biochar showed good adsorption efficiency and reusability, thereby suggesting its potential to serve as an efficient PNP adsorbent for wastewater treatment.
As an environmentally friendly and low-cost adsorbent, biochar has great potential in wastewater treatment.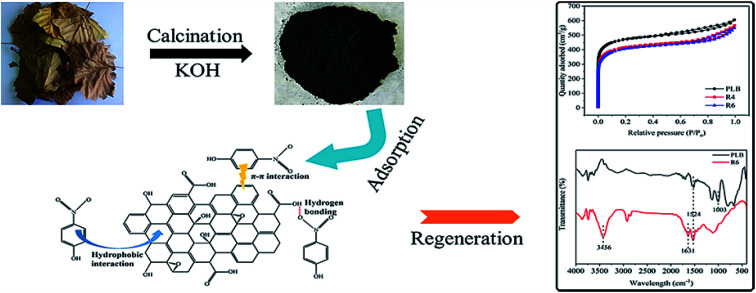
1. Introduction
As a common aromatic compound, p-nitrophenol (PNP) is used extensively in the production of fine and speciality chemicals, such as pesticides, medicines and petrochemicals.1,2 PNP is a refractory pollutant and highly poisonous to the environment, and is listed as a priority pollutant due to the conjugation of its hydroxyl and nitro groups with the benzene ring.3 Long-term exposure to low PNP concentrations can have a serious impact on human health, such as methemoglobinemia, liver and kidney damage, and other diseases.4,5 In addition, PNP can enter the soil and groundwater with the discharge of industrial and agricultural wastewater, which results in serious environmental problems. Therefore, PNP removal from industrial and agricultural effluents is urgent. At present, many removal methods, such as extraction,6 oxidation,7 biodegradation,8 adsorption,9–11 and photodegradation,12 have been used to remove PNP from wastewater. Among these methods, adsorption by an appropriate adsorbent has shown excellent effect of PNP removal.
Carbon materials have received considerable attention in PNP removal due to their surface functional groups and well-developed porosity,13 which can be produced from all types of carbon-containing substances, including biomass waste,14 coal,15,16 β-cyclodextrin,17 resin,18 and petroleum waste.19 Among these materials, the preparation of biomass carbon materials is attractive in terms of cost and environmental management, including pollutant and solid waste treatments. In the past few years, many biomass carbon materials have been prepared to remove PNP from wastewater. For example, Fe/Zn biochar made from sawdust with a maximal PNP adsorption capacity of 170.0 mg g−1 showed good adsorption performance compared with P–biochar, Zn–biochar and Fe–biochar.20 Zheng et al.21 found that microalgal biochars prepared from Chlorella sp. Cha-01 showed higher PNP adsorption capability (204.8 mg g−1) than two other types of microalgal biochars. Various efforts have been undertaken to remove PNP with biochar. On this basis, it is still necessary to actively explore a technology that has a wider source of raw materials and a more simplified preparation process to further improve the adsorption capacity. In this research, Platanus orientalis L. (Platanus) leaves, with the advantage of easy availability and large quantity, were used to prepare biochar for wastewater treatment.
The activation of biomass plays a crucial role in the improvement of porosity and specific surface area. Chemical activation is widely used because of its short activation time, low activation temperature and simple control process. In addition, there will be gases or compounds generated in the reaction between activator and biomass during the chemical activation process, and the porous structure of biochar will be formed after leaching.22 For the preparation of high porosity and large specific surface area biochars, researchers have investigated many chemical activation agents, such as KOH, NaOH, K2CO3, ZnCl2, H3PO4 and H2SO4, etc.23,24 Among these available activation agents, KOH is more suitable for making biochar with high microporosity, and the prepared biochar has a larger specific surface area.24–26 Hence, KOH was selected as activation agent.
In addition, the extent of adsorbent regeneration is important in adsorption due to its low cost and sustainability. Common regeneration techniques of carbon materials in industries are based on thermal and chemical methods.27 Thermal regeneration is a widely used method, but it has several drawbacks, such as high energy consumption, high cost and significant deterioration of the pore structure.28 By contrast, chemical regeneration usually leads to zero carbon attrition, which results in high recovery of adsorption capacities.29 Alkali is a type of traditional chemical reagent used in the regeneration of carbon materials. The adsorption capacity of regenerated carbon materials by alkali solution will decrease,30 but the causes for the decline are not well investigated. Thus, considerable research should be conducted to determine the causes of the reduction of the adsorption capacity of chemical-recycled biochars.
In this study, Platanus leaves were used as the precursor in preparing carbon materials (PLB) through KOH chemical activation to minimize the energy consumption during biochar preparation. The biochar was characterized to explain its physicochemical properties and illustrate its adsorption characteristics for PNP. The kinetics, isothermal adsorption and thermodynamics were evaluated to explain the adsorption mechanism. In addition, the reproducibility and causes for the decrease in PNP adsorption of the chemical-recycled biochar were investigated.
2. Materials and methods
2.1. Materials
The leaves were collected and thoroughly washed to remove the attached soils and plant residues, and then they were dried in an oven and ground into powder. The powder was mixed with KOH (activating agent) at an impregnation ratio of 1 : 1 (g KOH : g leaves powder) in a certain amount of distilled water. The mixture was oscillated to a homogeneous phase and dried in the oven for several hours at 80 °C, and then transferred to porcelain boats and heated in a tube furnace under a N2 flow. The heating procedure was abided by the following stages at a heating rate of 5 °C min−1: first at 450 °C for 30 min, second at 650 °C for 30 min, and finally at 800 °C for 1 h.31 After cooling to room temperature, the resulting mixture was washed with diluted HCl, and then cleaned with boiled distilled water until the pH of the filtrate became neutral. Moreover, the final product was dried and marked as PLB. The leaves biochar was prepared with the same pyrolysis procedures and labeled was marked as LB.
2.2. Characterization methods
The surface morphology of the biochar was characterized by using a scanning electron microscope (SEM, Regulus8220, Japan). A Fourier transform infrared spectrometer (FTIR, IRAffinity-1S WL, Shimadzu Corporation, Japan) was used to show the functional groups presented on the biochar surface in wave number ranging from 4000 cm−1 to 400 cm−1. The chemical composition and element states of the biochar surface were identified through X-ray photoelectron spectroscopy (XPS, Escalab 250Xi, USA). Nitrogen adsorption–desorption isotherm measurement was performed by using a volumetric adsorption analyzer (JW-BK300C, JWGB SCI. & TECH., Beijing) at 77 K. The specific surface area calculated by using Brunauer–Emmett–Teller (BET) method, and the pore size distributions evaluated by using Horvath–Kawazoe and Barrett–Joyner–Halenda models for micropores and mesopores, respectively.
The point of zero charge (pHPZC) of PLB was determined using 0.1 M NaCl at pH 2, 4, 6, 8, 10, and 12, and the pH values were adjusted with 0.1 M HCl and 0.1 M NaOH. Each NaCl (20 mL) with different values of pH was mixed with 0.02 g of PLB, and the mixture was stirred for 24 h. After standing for 30 min, the pH of the supernatant was measured. The pHPZC value was obtained from a plot of the supernatant pH (pHf) against the initial pH value (pHi).32
2.3. Adsorption experiments
Various batch experiments investigated the effects of pH, PLB dosage, reaction time, initial PNP concentration, and system temperature on PNP adsorption. To evaluate the pH effect, 20 mL of PNP solution (300 mg L−1) and 20 mg of PLB were mixed. The pH was adjusted with 0.1 M HCl or 0.1 M NaOH. Then, the mixture was sealed and oscillated at a constant speed of 150 rpm in a reciprocating oscillator (THZ-82, Hualin Industrial Co., Ltd. Shanghai) at 298 K. After filtration, the PNP concentration in the filtrate was measured by a UV spectrophotometer (723PC, Phoenix Optical Instrument Co., Ltd. Shanghai) at a wavelength of 317 nm. The removal efficiency (ω) and the amounts of PNP adsorbed (q, mg g−1) on PLB were calculated using eqn (1) and (2).
| ω (%) = (C0 − Ct)/C0 × 100% | 1 |
| q = (C0 − Ct) × V/m | 2 |
where C0 (mg L−1) and Ct (mg L−1) represent PNP concentrations in the solution at initial and time t, respectively. V (L) is the volume of the solution, and m (g) is the weight of PLB. An optimum pH condition was selected on the basis of the results to conduct other experiments.
The effect of PLB dosage on the removal of PNP was conducted by adding various amounts (0.010–0.035 g) of PLB into PNP solution (300 mg L−1, pH = 3) at a constant speed of 150 rpm at 298 K for 240 min. To evaluate the reaction time effect, the mixture was sealed and oscillated at a constant speed of 150 rpm at 298 K for 10–720 min before filtration. The experiment procedure and other conditions were the same as the study on pH effect. Different initial concentrations of PNP and reaction temperature were assessed in conducting the adsorption isotherm and thermodynamic studies. The mixture of 20 mg PLB and 20 mL PNP with different concentrations (100 mg L−1 to 2000 mg L−1, pH = 3) was oscillated at desired temperatures (298, 313, and 328 K) at a speed of 150 rpm and reaction time of 180 min. The experiment procedure and other conditions were the same as the study on pH effect.
2.4. Regeneration experiment
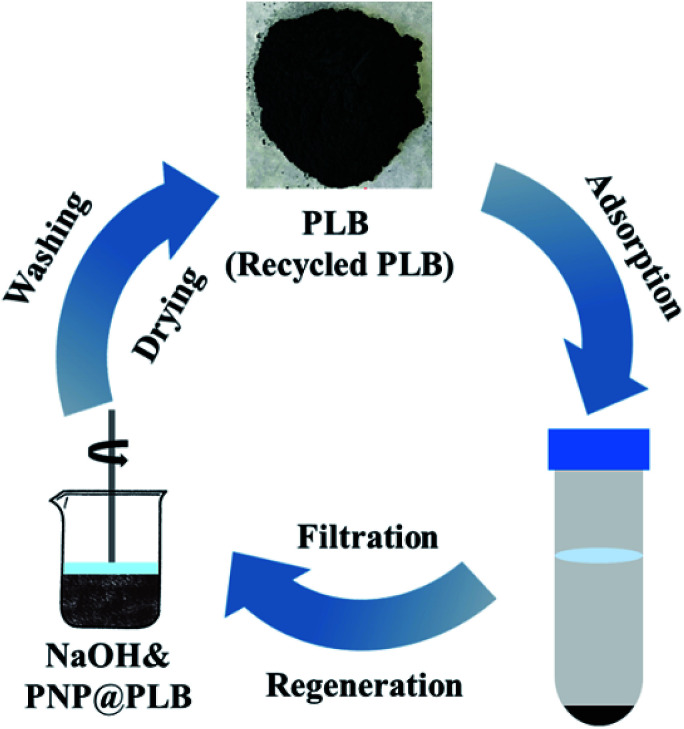
The solid–liquid (PLB and PNP solutions) ratio was set to 1 (g L−1), with an initial PNP concentration of 1800 mg L−1. The adsorption reached equilibrium after 3 h at 298 K with a shaking speed of 150 rpm. The equilibrium concentration was measured, and the PLB was separated from the solution with a filter (0.22 μm). The collected PLB was washed several times with 1 M NaOH and distilled water until neutral. After drying at 80 °C, the recycled biochar was used for the next adsorption process (Fig. 1). In total, 7 times of biochar regeneration with the original biochar (PLB) were performed to determine the adsorption capacity of PNP. Moreover, the first generation of recycled biochar was denoted as R1, and the next six generations were noted as R2, R3, R4, R5, R6, and R7, respectively. Several typical generations, such as PLB, R4, and R6 for the textural parameters and PLB and R6 for the FTIR spectra, were used and analyzed the causes of decline in adsorption capacity after regeneration.
Fig. 1. The demonstration of the adsorption and regeneration process of PLB.
2.5. Statistical analysis
The figures for pH effect on PNP removal rate and the recycle times on adsorption effect presented the mean value of triplicate, and statistical analyses (ANOVA) and LSD test for mean comparisons were conducted in SPSS 17.0. Differences at P ≤ 0.05 were considered significant.
3. Results and discussion
3.1. Characterizations of biochar
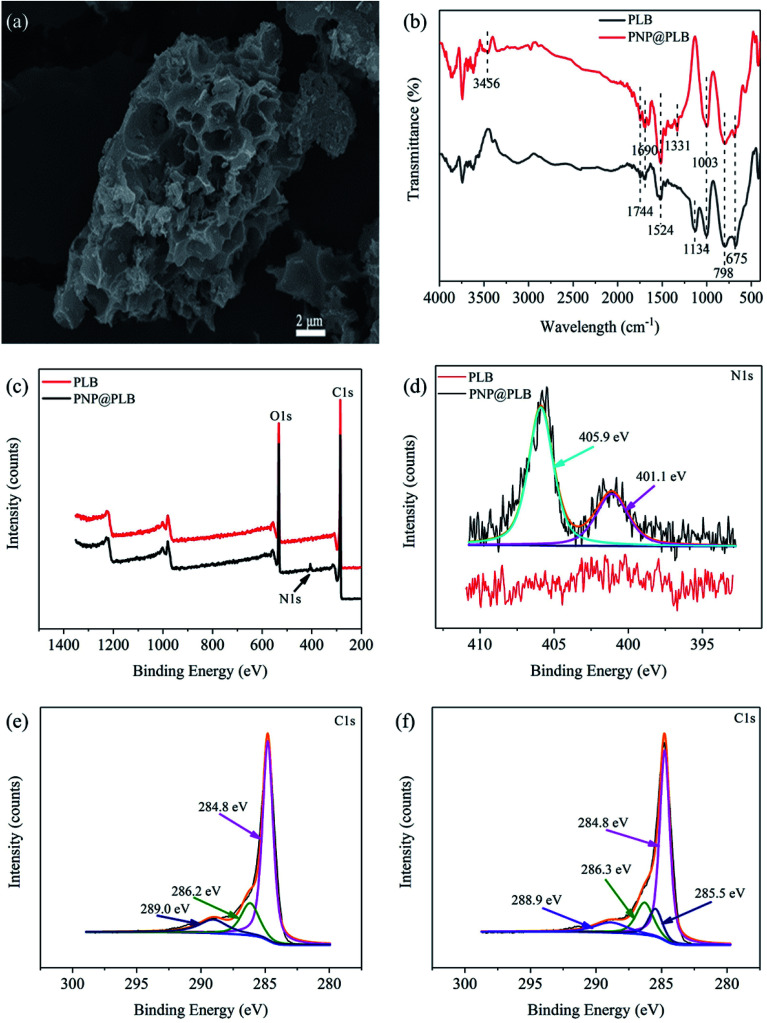
The leaf-based biochar prepared in this study had a porous structure (Fig. 2a), which could be explained by the following reaction (eqn. (3)–(8)) of KOH with the leaf powder during pyrolysis:33,34
| 6KOH + 2C → 2K + 3H2 + 2K2CO3 | 3 |
| K2CO3 + C → K2O + 2CO | 4 |
| K2CO3 → K2O + CO2 | 5 |
| 2K + CO2 → K2O + CO | 6 |
| K2CO3 + 2C → 2K + 3CO | 7 |
| CO2 + C → 2CO | 8 |
Fig. 2. SEM image of PLB (a), The FTIR spectra of PLB and PNP@PLB (b), the XPS spectra of PLB and PNP@PLB (c), N 1s XPS spectra of PNP@PLB (d), C 1s XPS spectra of PLB (e) and PNP@PLB (f).
Hydrogen, carbon monoxide, potassium vapor, and carbon dioxide were generated during sintering, which resulted in a large number of pores on the biochar surface. In addition, K2CO3 and other compounds were washed away with diluted HCl and the micropores formed on biochar. Therefore, this process increased the specific surface area and pore volume of the biochar, which can be beneficial for PNP adsorption.
The FTIR spectra of PLB and PLB after PNP adsorption (PNP@PLB) were shown in Fig. 2b. The bands of PLB at 1744 cm−1 and 1690 cm−1 were the C O stretching vibration, and the band at 1524 cm−1 was the aromatic C C stretching vibration.35 The band at 1134 cm−1 might have contributions from C–O telescopic vibration in ester group, ether group, aliphatic ether and carboxylic acid groups. Moreover, the band at 1003 cm−1 could be assigned to O–H bending vibration in alcoholic, phenolic and carboxylic acid groups. These results indicated that PLB surface existed some oxygen-containing functional groups of –OH, –COOH and –C–O–C. The peaks of the ring C–H vibrations appeared at 798 cm−1 and 675 cm−1.36 The broad band of PNP@PLB at 3456 cm−1 was related to the O–H stretching vibration peak of phenolic hydroxyl.37 The band of the symmetrical stretching vibration of aromatic –NO2 appeared at 1331 cm−1.38 In addition, no peak was observed at 1134 cm−1 of PNP@PLB compared to PLB, which might be attributed to the hydrogen bonding between the oxygen-containing functional groups of PLB and PNP. The FTIR spectra of PNP showed the broad band at 3321 cm−1 was related to the O–H stretching vibration peak, and the peak at 1218 cm−1 was related to the aromatic –NO2.39 The peaks at 3321 and 1218 cm−1 shifted to 3456 and 1331 cm−1 of PNP@PLB, respectively, which indicated the hydrogen bonding between PNP and PLB.32 These characteristics indicated the successful adsorption of PNP molecules on PLB through hydrogen bonding between the hydroxyl groups or carboxyl groups on PLB and the hydroxyl, nitro groups of PNP.
The XPS spectra of PLB and PNP@PLB were shown in Fig. 2c–f. The survey scan spectra of PLB and PNP@PLB demonstrated the existence of O 1s and C 1s, and a new peak corresponding to N 1s was generated in PNP@PLB (Fig. 2c). Two new peaks at 401.1 eV and 405.9 eV, which corresponded to C–N and nitro group,40,41 were generated in the N 1s spectra of PNP@PLB (Fig. 2d). The C 1s spectra of PLB (Fig. 2e) could be fitted into three peaks, including 284.8 eV (C–C), 286.2 eV (C–O), and 289.0 eV (O C–O).42 The peaks of C–C, C–O, and O C–O remained essentially unchanged in the C 1s spectra of PNP@PLB (Fig. 2f), with a new peak generated at 285.5 eV (C–N) compared with that of PLB.43 These observations confirmed the PNP adsorption on PLB, which was consistent with the discussion in the FTIR analysis.
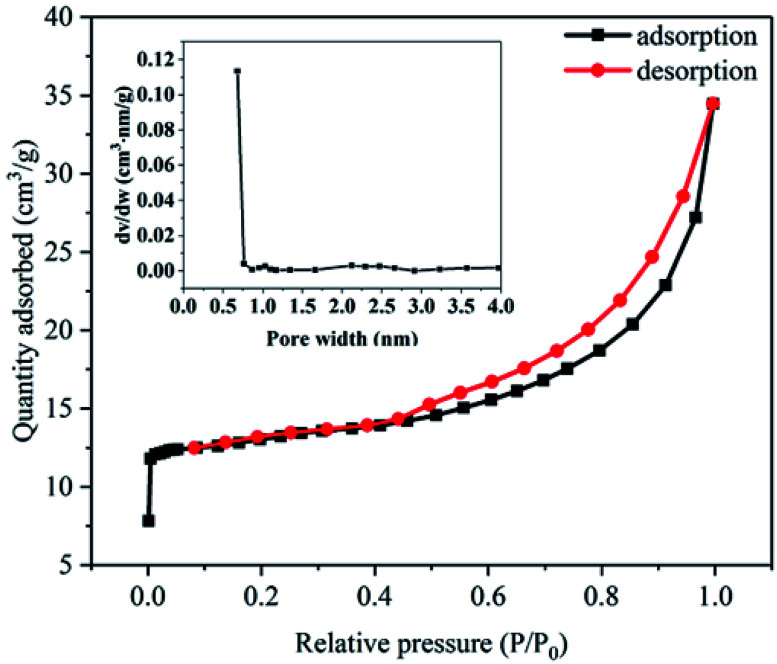
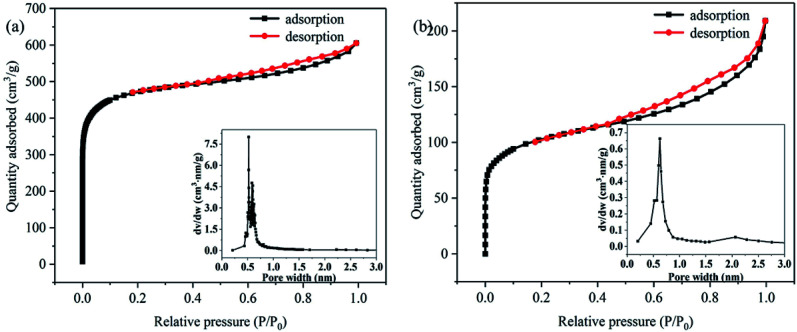
Adsorption/desorption isotherm analysis showed that LB, PLB and PNP@PLB exhibited a type-IV isotherm (Fig. 3 and Fig. 4a and b, respectively). The curves rapidly increased at low relative pressure, which demonstrated the existence of micropores. Moreover, hysteresis loops could be found at medium relative pressure, indicating the presence of mesopores.44 The most probable apertures of LB, PLB and PLB@PNP were 0.68 nm, 0.60 nm and 0.45 nm, as shown in the insets. In addition, the average pore diameters of LB, PLB and PLB@PNP were 3.91 nm, 2.23 nm and 2.24 nm, respectively. Table 1 showed that the BET surface area and the total pore volume of LB were 52.05 m2 g−1 and 0.05 cm3 g−1, which were 1792.38 m2 g−1 and 0.94 cm3 g−1 for PLB, respectively. The activation process greatly improved the specific surface area and pore volume of biochar, and provided more adsorption sites for the removal of PNP. Hence, PLB was selected as adsorbent to conduct adsorption experiments. In addition, the proportion of micropore surface area and micropore volume reached to 88.27% and 75.53%, causing micropores greatly improved the BET surface area of PLB. Furthermore, compared with the PLB, the BET surface area and micropores volume of PNP@PLB remarkably changed, whereas macropores and mesopores only showed a slight change. This indicated that the micropores played a major role in PNP adsorption, and the macropores and mesopores had a minor effect. These results indicated that the proportion of micropores in biochar had the better PNP adsorption.
Fig. 3. N2 adsorption/desorption isotherm of LB, the inset is the corresponding pore size distribution.
Fig. 4. N2 adsorption/desorption isotherm of PLB (a) and PNP@PLB (b), the inset is the corresponding pore size distribution.
The textural parameters of LB, PLB and PLB after PNP adsorption (PNP@PLB).
| Carbon material | S BET a (m2 g−1) | S mic b (m2 g−1) | S mac&mes c (m2 g−1) | V tot d (cm3 g−1) | V mic e (cm3 g−1) | V mac&mes f (cm3 g−1) |
|---|---|---|---|---|---|---|
| LB | 52.05 | 42.25 | 9.80 | 0.05 | 0.02 | 0.03 |
| PLB | 1792.38 | 1582.13 | 210.25 | 0.94 | 0.71 | 0.23 |
| PNP@PLB | 375.75 | 261.32 | 114.43 | 0.33 | 0.15 | 0.18 |
S BET: BET surface area.
S mic: micropore surface area.
S mac&mes: macropore and mesopore surface area.
V tot: total pore volume.
V mic: micropore volume.
V mac&mes: macropore and mesopore volume.
3.2. Effect of pH on PNP adsorption
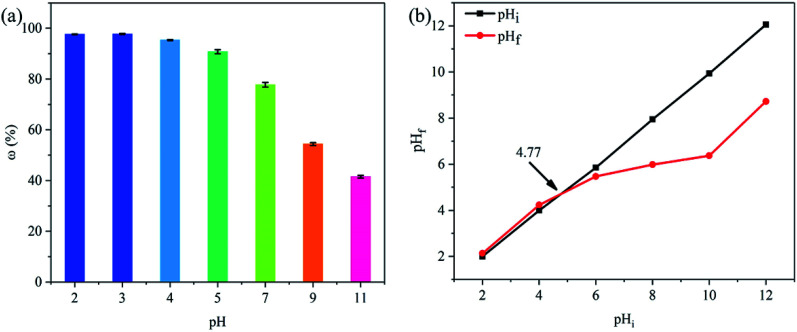
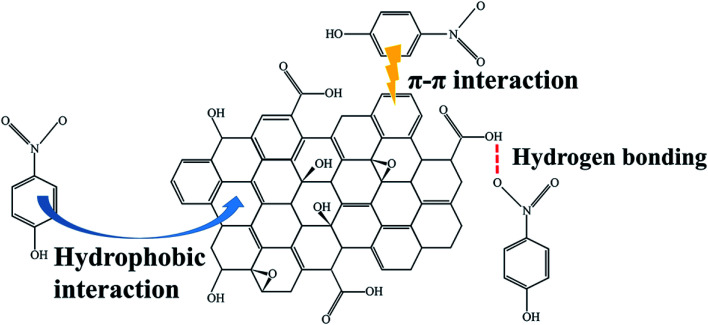
The removal efficiency of PNP decreased with the increase of pH, and the highest point was occurred at pH 3 (Fig. 5a). On this basis, other adsorption and regeneration experiments were conducted with optimized pH of PNP at 3. At low pH condition, PNP in the solution mainly existed in a molecular form, and PNP removal might be ascribed to the hydrogen bond, hydrophobic interaction, and π–π interaction.45 From Fig. 5b, pHPZC was approximately 4.77, which was higher than the optimized pH for PNP adsorption, illustrating that the main interaction between PNP and PLB were not hydrogen bonding. In addition, the electron acceptor –NO2 of PNP and the small amount of oxygen-containing functional groups on the PLB surface reduced the electron density of aromatic ring and basal planes, which led to a weak π–π interaction.46 These observations suggested that PNP adsorption on PLB was mainly attributed to hydrophobic interaction. However, the removal rate sharply decreased at high pH condition. The reason was that the surface charge of the biochar was negative when pH was higher than pHPZC, and considerable PNPs were ionized as the pH increased. Thus, electrostatic repulsion occurred between the surface of PLB and PNP ions, resulting in a sharp decrease.
Fig. 5. Effect of initial pH of PNP removal efficiency (a), determination of the pHPZC for PLB via pH drift method (b).
3.3. Effect of PLB dosage on PNP adsorption
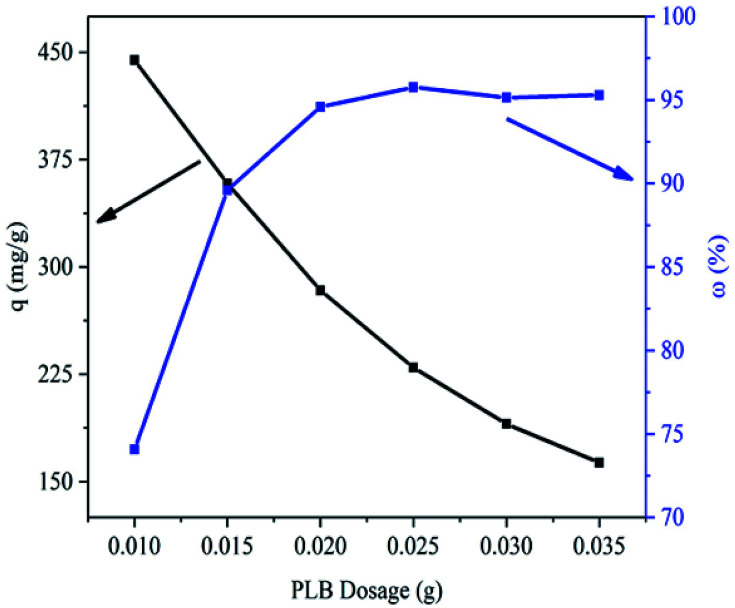
Fig. 6 showed that the removal efficiency of PNP obviously increased when the PLB dosage ranged from 0.01 to 0.02 g. As the PLB dosage increased, the increase of adsorption sites caused the increase of adsorption efficiency. Subsequently, the removal efficiency maintained basically unchanged when the PLB dosage ranged from 0.02 to 0.035 g. This may be related to the adsorbent aggregation. The adsorption capacity of PNP decreased from 444.46 to 163.34 mg g−1 when the PLB dosage ranged from 0.01 to 0.035 g. According to as the factor of cost, adsorption capacity and removal rate, the optimum dosage of PLB was selected to be 0.02 g.
Fig. 6. Effect of PLB dosage (0.010–0.035 g) on PNP removal.
3.4. Adsorption kinetics
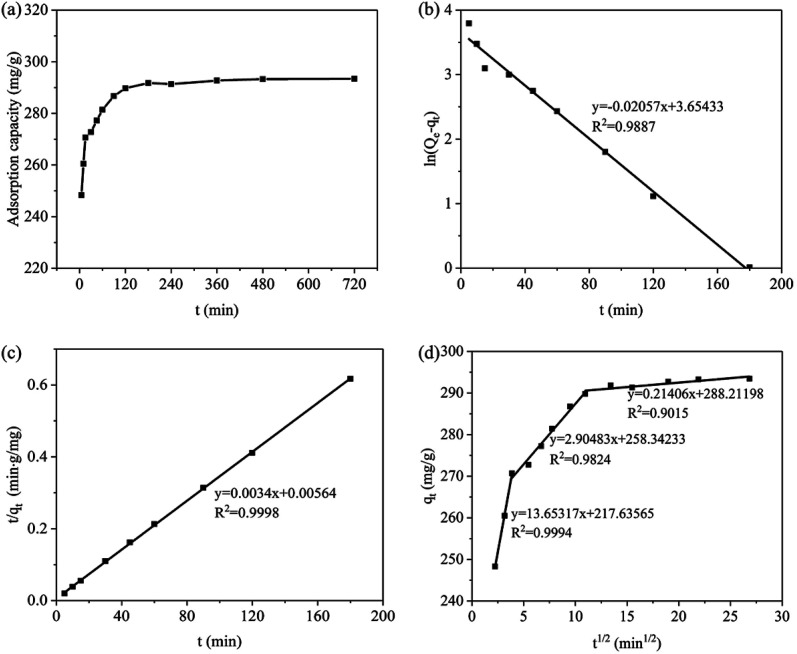
Fig. 7a showed that the adsorption capacity of PNP rapidly increased within 5 min. And the adsorption capacity remarkably increased with the extension time of 180 min, adsorption capacity of 291.80 mg g−1, and removal rate of 97.27%. Subsequently, the adsorption capacity approximately leveled off, which indicated the adsorption experiment reached equilibrium at 180 min.
Fig. 7. Effect of reaction time on PNP adsorption (a); Pseudo-first-order kinetic model (b); Pseudo-second-order kinetic model (c); Intra-particle diffusion model (d).
Adsorption kinetics is a fundamental aspect for evaluating the adsorption process. The kinetic models for PNP adsorption on PNP were investigated by using pseudo-first-order kinetic (9) and pseudo-second-order kinetic models (10),47 and the diffusion mechanism was described by using an intra-particle diffusion model (11).48
| ln(qe − qt) = ln qe − K1t | 9 |
| t/qt = 1/(K2q2e) + t/qe | 10 |
| qt = Kidt1/2 + Ci | 11 |
where qe (mg g−1) is the amount of PNP adsorbed at equilibrium, and qt (mg g−1) represents the amount of PNP adsorbed at time t (min). K1 (min−1) and K2 (g (min mg)−1) are the rate constants for the pseudo-first and pseudo-second order adsorption kinetic models, respectively. Kid (mg (g−1 min−1/2)) is the diffusion rate constant, and Ci is a constant related to the boundary layer thickness.
The correlation coefficients of the dynamic model for PNP adsorption on PLB were obtained from Fig. 7b and c, and Table 2 listed the dynamic fitting parameters. The correlation coefficient showed that the experimental data fitted better with the pseudo-second-order kinetic model (R2 = 0.9998) than with the pseudo-first-order kinetic model (R2 = 0.9887). In addition, the adsorption capacity calculated from the pseudo-second-order kinetic model (qe2,cal = 294.12 mg g−1) was approximately consistent with qe,exp, which were considerably higher than that calculated from the pseudo-first-order kinetic equation (qe1,cal = 38.64 mg g−1). Therefore, PNP adsorption followed the pseudo-second-order kinetic model.
Adsorption kinetic parameters of PNP adsorbed on PLB.
| Model | Parameter | |
|---|---|---|
| q e,exp (mg g−1) | 292.81 | |
| Pseudo-first-order kinetics model | q e1,cal (mg g−1) | 38.64 |
| K 1 (min−1) | 0.0206 | |
| R 2 | 0.9887 | |
| Pseudo-second-order kinetics model | q e2,cal (mg g−1) | 294.12 |
| K 2 (g (min−1 mg−1)) | 0.0021 | |
| R 2 | 0.9998 | |
| Intra-particle diffusion model | K 1d (mg (g−1 min−1/2)) | 13.6532 |
| K 2d (mg (g−1 min−1/2)) | 2.9048 | |
| K 3d (mg (g−1 min−1/2)) | 0.2141 | |
Fig. 7d showed that PNP adsorption could be described by three linear sections, indicating the occurrence of multiple stages during adsorption. In the first stage, the adsorption mainly occurred on the external surface, where approximately 90% of PNP molecules were adsorbed from the solution to the external surface. In the second stage, the adsorption reaction rate decreased, and the PNP molecules on the external surface diffused into PLB pores as the adsorption process progresses. In the last stage, the adsorption reaction reached equilibrium.
3.5. Adsorption isotherm and thermodynamic studies
Three adsorption isotherms (Langmuir, Freundlich, and Temkin models) were used to investigate the reaction behavior between the PNP molecules and PLB. The Langmuir isotherm model assumes that the adsorbate molecules form a monolayer on adsorbents with homogeneous surface, and Freundlich isotherm model describes a multilayer adsorption on heterogeneous surfaces.49 The Temkin model has a factor that reveals the interaction between the adsorbate and adsorbent.45 The equations of Langmuir (12), Freundlich (13), and Temkin models (14) are expressed as follows:35,50
| qe = qmKLCe/(1 + KLCe) | 12 |
| qe = KFCe1/n | 13 |
| qe = B ln KT + B ln Ce | 14 |
where qm (mg g−1) is the maximum adsorption capacity; Ce (mg L−1) is the equilibrium concentration of the solution; and n is the empirical index. KL (L mg−1) and KF are the indicators of adsorption capacity for Langmuir and Freundlich models, respectively. B and KT (g L−1) are the parameters of Temkin model.
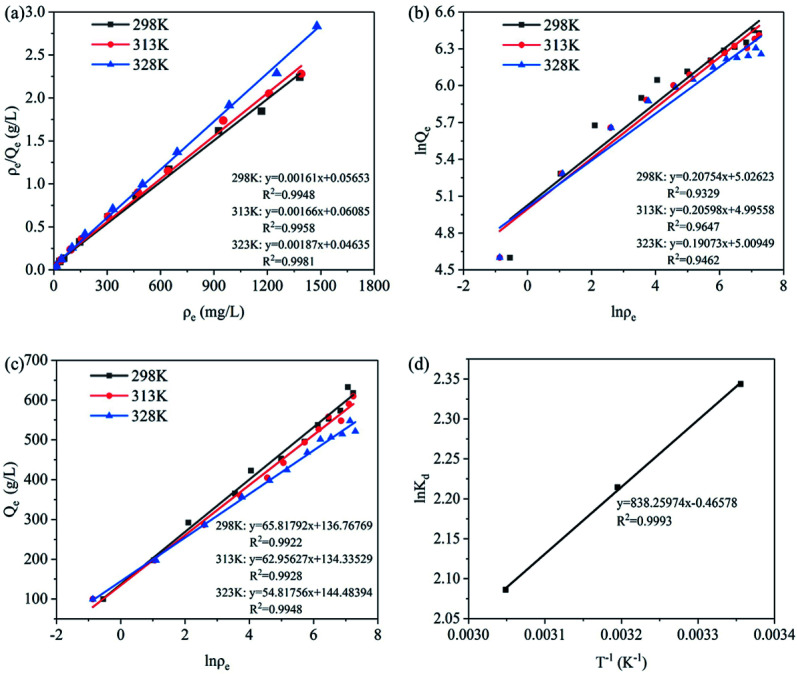
Fig. 8a–c showed the linear fitting of the isothermal adsorption models of PNP on PLB. Table 3 showed the fitting results of isothermal adsorption equations. The correlation coefficients of Langmuir isotherm adsorption model (R2 = 0.9948–0.9981) were higher than those of Freundlich isotherm adsorption model (R2 = 0.9329–0.9647) and Temkin isotherm adsorption model (R2 = 0.9922–0.9948), and the difference of qm,cal and qm,exp was small. Thus, the PNP adsorption on PLB was more consistent with the Langmuir isotherm adsorption model in the range of the experimental concentration, suggesting that the PNP adsorption on PLB occurred in a monolayer. In addition, Table 3 showed that the maximum adsorption was affected by reaction temperature. As the temperature increased from 298 K to 328 K, the adsorption capacity of PNP decreased from 622.73 mg g−1 to 547.68 mg g−1. Thus, the adsorption process was an exothermic reaction, and increased the temperature could be unprofitable for adsorption.
Fig. 8. Linear fitting of the isothermal adsorption models of PNP on PLB: Langmuir isothermal adsorption model (a), Freundlich isothermal adsorption model (b), and Temkin isothermal adsorption model (c); ln Kdvs. T−1 for PNP adsorption on PLB (d).
Parameters of Langmuir, Freundlich and Temkin model for the PNP adsorption on PLB.
| Model | Temperature | |||
|---|---|---|---|---|
| 298 K | 313 K | 328 K | ||
| Langmuir | q m,exp (mg g−1) | 622.73 | 590.09 | 547.68 |
| q m,cal (mg g−1) | 621.12 | 602.41 | 534.76 | |
| K L (L mg−1) | 0.0285 | 0.0273 | 0.0403 | |
| R 2 | 0.9948 | 0.9958 | 0.9981 | |
| R L | 0.0191 | 0.0199 | 0.0136 | |
| Freundlich | 1/n | 0.2075 | 0.2060 | 0.1907 |
| K F | 152.36 | 147.76 | 149.83 | |
| R 2 | 0.9329 | 0.9647 | 0.9462 | |
| Temkin | K T (g L−1) | 7.998 | 8.447 | 13.953 |
| B | 65.8179 | 62.9563 | 54.8176 | |
| R 2 | 0.9922 | 0.9928 | 0.9948 | |
In addition, an essential factor of Langmuir isotherm is separation factor (RL), which could be used to confirm whether adsorption is favorable. RL is expressed as follows:51
| RL = 1/(1 + KLC0) | 15 |
where KL represents the Langmuir adsorption isotherm constant, and C0 (mg L−1) represents the maximum concentration of adsorbate in the original solution before adsorption treatment. RL reveals the adsorption tendency: unfavorable (RL > 1), favorable (0 < RL < 1), and linear (RL = 1).52 The smaller the RL had the greater affinity between the adsorbent and adsorbate.53 In this study, RL values were between 0 and 1 (Table 3), indicating that the adsorption reaction proceeded favorably, and the affinity between PNP and PLB was strong.
To investigate the effect of temperature on adsorption, the thermodynamics of adsorption processes were estimated by using eqn (16)–(19):54
| ΔG = −RT ln Kd | 16 |
| ΔG = ΔH − TΔS | 17 |
| Kd = qe/Ce | 18 |
| ln Kd = ΔS/R − ΔH/RT | 19 |
where R (J (mol−1 K−1)) is the gas constant with the value of 8.314, T (K) is the absolute temperature, and Kd (L g−1) is the adsorption equilibrium constant.
The correlation coefficient of the thermodynamic study was obtained from Fig. 8d. Table 4 illustrated that ΔH was negative, confirming that PNP adsorption was an exothermic process and in agreement with the results from Table 3. ΔH value could be divided into physical adsorption (2.1–20.9 kJ mol−1) and chemical adsorption (20.9–418.4 kJ mol−1).55 In this experiment, ΔH (6.969 kJ mol−1) was relatively small, indicating that no strong force (such as chemical bond force) existed in adsorption, and the main participating forces might be π–π interaction, hydrogen bonding force, and hydrophobic interaction. This was consistent with the discussion in Section 3.2. In addition, the value of ΔS was negative, indicating that the activity of PNP after adsorption on PLB was limited, and the arrangement between molecules became orderly, then the degree of chaos was reduced. Therefore, PNP adsorption on PLB was an entropy reduction process. Furthermore, ΔG with a negative value, which embodied the adsorption driving force, indicated that the adsorption process was spontaneous. Then the adsorption was unfavorable at high temperature, because the absolute value of ΔG decreased with the increase of temperature, suggesting that adsorption was unfavorable at high temperature.
Thermodynamic parameters for PNP adsorption on PLB.
| T (K) | ΔG (kJ mol−1) | ΔH (kJ mol−1) | ΔS (J (mol−1 K−1)) | R 2 |
|---|---|---|---|---|
| 298 | −5.811 | −6.969 | −3.872 | 0.9993 |
| 313 | −5.752 | |||
| 328 | −5.694 |
3.6. Adsorption mechanism
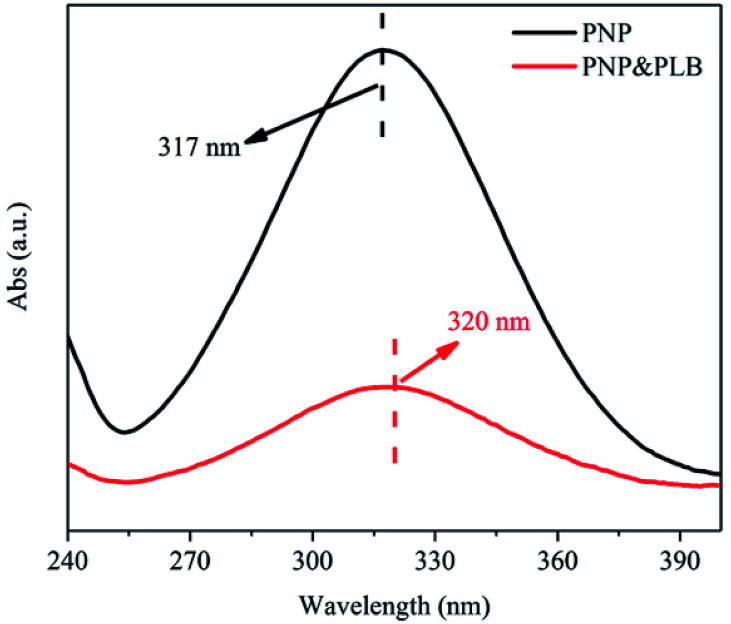
The PLB provided a larger specific surface area and abundant pores, thus there existed enough hydrophobic sites for PNP adsorption by hydrophobic interaction.45 In addition, based on the FTIR analysis of PLB, there existed some functional groups on the PLB, such as ether groups, hydroxyl groups, aromatic rings and carboxyl groups. These functional groups may offer additional sites for PNP removal, which through hydrogen bonding between the hydroxyl groups or carboxyl groups on PLB and the hydroxyl, nitro groups of PNP, and through π–π interaction between the aromatic rings on PLB and PNP. The UV adsorption spectra confirmed the π–π interaction between PNP and PLB (Fig. 9). The main adsorption peak of PNP was presented at 317 nm, and the peak shifted from 317 nm to 320 nm as PLB was added. The red-shift of the main adsorption peak indicated that there existed π–π interaction between PNP and PLB.56 However, the π electrons from the basal planes of PLB could be removed by the carboxyl groups, which led to a weaker π–π interaction.35 Furthermore, if the hydrogen bonding was the main interaction, the pH of the maximum PNP adsorption capacity should be around pHPZC.20 Consequently, the optimized pH was lower than pHPZC, causing PNP adsorption on PLB was mainly attributed to hydrophobic interaction. Therefore, the adsorption mechanism of PNP on PLB was presented in Fig. 10.
Fig. 9. The UV adsorption spectra of PNP and mixed solution (PNP&PLB).
Fig. 10. Schematic diagram for the adsorption mechanism of PNP on PLB.
3.7. Regeneration
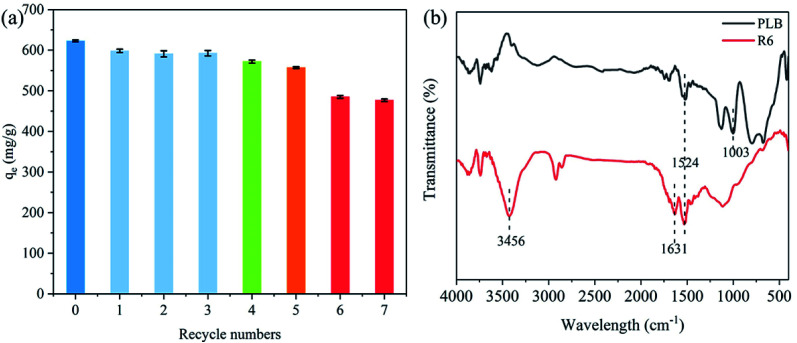
Fig. 11a showed the PNP adsorption capacity of each recycled generation. The adsorption capacity initially decreased from 622.73 mg g−1 (original biochar) to 571.98 mg g−1 (R4). Then, PLB still performed high adsorption capacity for the fifth regeneration (557.05 mg g−1), and the adsorption capacity was approximately 90% of the original biochar. Nevertheless, the PNP adsorption had a sharp decline to 485.01 mg g−1 as the number of regenerations increased, leading to a decrease in adsorption capacity (78% of the original biochar).
Fig. 11. The relationship between recycle numbers and adsorption capacity (a); The FTIR spectra of PLB and the sixth regeneration PLB (R6) (b).
The textural parameters and FTIR spectra were analyzed to determine the causes for the decrease in adsorption capacity after regeneration. Table 5 showed that the micropores pore volume of R4 and R6 were similar but small compared with that of PLB. These results suggested that the blockage of PLB's micropores could be a cause for the decrease in adsorption capacity of the recycled biochar. However, the substantial drop for R6 could not be explained. There may be other reasons that affect the adsorption capacity of recycled biochar. Fig. 11b showed that the band at 3456 cm−1 of R6 was related to the O–H stretching vibration peak of phenolic hydroxyl, and the bands at 1631 cm−1 and 1524 cm−1 was the aromatic C C stretching vibration,38 respectively. This indicated that some PNP molecules blocked the pores and could not be washed away by NaOH and distilled water during the regeneration process. In addition, the band at 1003 cm−1 of R6 disappeared compared with that of PLB (Fig. 11b), indicating that hydroxyl groups and carboxyl groups were deactivated during the cleaning process. This might be the reason for the significant decrease in the adsorption of the recycled biochar. Therefore, these results indicated that a part of the micropores on the biochar was gradually blocked with each regeneration, and the deactivation of oxygen-containing functional groups became the main cause after several times of regeneration.
The textural parameters of original PLB and recycled PLB (R4 and R6).
| Carbon material | Pore volume, (cm3 g−1) | ||
|---|---|---|---|
| V tot | V mac&mes | V mic | |
| PLB | 0.94 | 0.23 | 0.71 |
| R4 | 0.88 | 0.26 | 0.62 |
| R6 | 0.85 | 0.25 | 0.60 |
4. Conclusions
In this research, Platanus leaves were successfully produced into a biochar with good adsorption capacity and high reusability. The biochar had a well-developed porous structure with large specific surface area (1792.38 m2 g−1). There were oxygen-containing functional groups such as –OH, –COOH and –C–O–C on the biochar surface, which were beneficial to the adsorption of PNP. Furthermore, the study on adsorption mechanism indicated that PNP adsorption was mainly attributed to hydrophobic interaction, followed by the role of hydrogen bonding and π–π interaction. In adsorption process, PNP adsorption on PLB was a spontaneous exothermic reaction which was more in line with pseudo-secondary kinetic model and Langmuir model, and the maximum adsorption capacity for PNP was 622.73 mg g−1 at 298 K. In regeneration process, the adsorption capacity of PLB still reached 485.01 mg g−1 after the seven regenerations. In addition, pore blockage and deactivation of oxygen functional groups could be the causes for the decrease in PNP adsorption of the recycled biochar.
Conflicts of interest
There are no conflicts to declare.
Supplementary Material
Acknowledgments
This work was supported by the Key Research and Development Plan of Shandong Province (grant no. 2017GGX202010); the Higher Education Science and Technology Project of Shandong Province (grant no. J18KA023); the International Cooperation Research Project of Qilu University of Technology (grant no. QLUTGJHZ2018003) and the Project Supported by the Foundation of State Key Laboratory of Biobased Material and Green Papermaking, Qilu University of Technology, Shandong Academy of Sciences (Grant No. ZZ20190108).
References
- Yang J. Pan B. Li H. Liao S. Zhang D. Wu M. Xing B. Environ. Sci. Technol. 2015;50:694–700. doi: 10.1021/acs.est.5b04042. [DOI] [PubMed] [Google Scholar]
- Bae S. Gim S. Kim H. Hanna K. Appl. Catal., B. 2016;182:541–549. doi: 10.1016/j.apcatb.2015.10.006. [DOI] [Google Scholar]
- Shi C. Li Y. Feng H. Jia S. Xue R. Li G. Wang G. Chem. Res. Chin. Univ. 2018;34:39–43. doi: 10.1007/s40242-017-7245-0. [DOI] [Google Scholar]
- Xue G. Gao M. Gu Z. Luo Z. Hu Z. Chem. Eng. J. 2013;218:223–231. doi: 10.1016/j.cej.2012.12.045. [DOI] [Google Scholar]
- Sun Y. Zhou J. Cai W. Zhao R. Yuan J. Appl. Surf. Sci. 2015;349:897–903. doi: 10.1016/j.apsusc.2015.05.041. [DOI] [Google Scholar]
- Yu P. Chang Z. Ma Y. Wang S. Cao H. Chao H. Liu H. Sep. Purif. Technol. 2009;70:199–206. doi: 10.1016/j.seppur.2009.09.016. [DOI] [Google Scholar]
- Rodrigues C. S. Borges R. A. Lima V. N. Madeira L. M. J. Environ. Manage. 2018;206:774–785. doi: 10.1016/j.jenvman.2017.11.032. [DOI] [PubMed] [Google Scholar]
- Subashchandrabose S. R. Venkateswarlu K. Krishnan K. Naidu R. Lockington R. Megharaj M. J. Hazard. Mater. 2017;347:176–183. doi: 10.1016/j.jhazmat.2017.12.063. [DOI] [PubMed] [Google Scholar]
- Wang X. Zhao C. Huang J. J. Nanosci. Nanotechnol. 2013;13:2218–2223. doi: 10.1166/jnn.2013.7098. [DOI] [PubMed] [Google Scholar]
- Dos A. S. Viante M. F. Pochapski D. J. Downs A. J. Almeida C. J. Hazard. Mater. 2018;355:136–144. doi: 10.1016/j.jhazmat.2018.02.041. [DOI] [PubMed] [Google Scholar]
- Chen T. Liu F. Ling C. Gao J. Xu C. Li L. Li A. Environ. Sci. Technol. 2013;47:13652–13660. doi: 10.1021/es4028875. [DOI] [PubMed] [Google Scholar]
- Yang L. Luo S. Li Y. Xiao Y. Kang Q. Cai Q. Environ. Sci. Technol. 2010;44:7641–7646. doi: 10.1021/es101711k. [DOI] [PubMed] [Google Scholar]
- Guo Z. Fan J. Zhang J. Kang Y. Liu H. Jiang L. Zhang C. J. Taiwan Inst. Chem. Eng. 2016;58:290–296. doi: 10.1016/j.jtice.2015.05.041. [DOI] [Google Scholar]
- Guo Z. Xu L. Liu C. Sun F. Kang Y. Liang S. Desalin. Water Treat. 2016;57:21957–21967. doi: 10.1080/19443994.2015.1127782. [DOI] [Google Scholar]
- Li W. Gong X. Wang K. Zhang X. Fan W. Bioresour. Technol. 2014;165:166–173. doi: 10.1016/j.biortech.2014.02.069. [DOI] [PubMed] [Google Scholar]
- Gong X. Li W. Zhang D. Fan W. Zhang X. Int. Biodeterior. Biodegrad. 2015;102:256–264. doi: 10.1016/j.ibiod.2015.01.007. [DOI] [Google Scholar]
- Zolfaghari G. Chem. Eng. J. 2016;283:1424–1434. doi: 10.1016/j.cej.2015.08.110. [DOI] [Google Scholar]
- Nakagawa K. Mukai S. Tamura K. Tamon H. Chem. Eng. Res. Des. 2007;85:1331–1337. doi: 10.1205/cherd06119. [DOI] [Google Scholar]
- Rambabu N. Azargohar R. Dalai A. Adjaye J. Fuel Process. Technol. 2013;106:501–510. doi: 10.1016/j.fuproc.2012.09.019. [DOI] [Google Scholar]
- Wang P. Tang L. Wei X. Zeng G. Zhou Y. Deng Y. Wang J. Xie Z. Fang W. Appl. Surf. Sci. 2017;392:391–401. doi: 10.1016/j.apsusc.2016.09.052. [DOI] [Google Scholar]
- Zheng H. Guo W. Li S. Chen Y. Wu Q. Feng X. Yin R. Ho S. Ren N. Chang J. Bioresour. Technol. 2017;244:1456–1464. doi: 10.1016/j.biortech.2017.05.025. [DOI] [PubMed] [Google Scholar]
- Sajjadi B. Zubatiuk T. Leszczynska D. Leszczynski J. Chen W. Y. Rev. Chem. Eng. 2019;35:777–815. [Google Scholar]
- Peñas-Garzón M. Gómez-Avilés A. Bedia J. Rodriguez J. J. Belver C. Materials. 2019;12:378. doi: 10.3390/ma12030378. [DOI] [PMC free article] [PubMed] [Google Scholar]
- Deng H. Li G. Yang H. Tang J. Tang J. Chem. Eng. J. 2010;163:373–381. doi: 10.1016/j.cej.2010.08.019. [DOI] [Google Scholar]
- Gao Y. Xu S. Yue Q. Wu Y. Gao B. J. Taiwan Inst. Chem. Eng. 2016;61:327–335. doi: 10.1016/j.jtice.2015.12.023. [DOI] [Google Scholar]
- Li J. Han K. Li S. J. Mater. Sci.: Mater. Electron. 2018;29:8480–8491. doi: 10.1007/s10854-018-8861-2. [DOI] [Google Scholar]
- Li Q. Qi Y. Gao C. J. Cleaner Prod. 2015;86:424–431. doi: 10.1016/j.jclepro.2014.08.008. [DOI] [Google Scholar]
- El Gamal M. Mousa H. A. El-Naas M. H. Zacharia R. Judd S. Sep. Purif. Technol. 2018;197:345–359. doi: 10.1016/j.seppur.2018.01.015. [DOI] [Google Scholar]
- Lu P. Lin H. Yu W. Chern J. J. Taiwan Inst. Chem. Eng. 2011;42:305–311. doi: 10.1016/j.jtice.2010.06.001. [DOI] [Google Scholar]
- Bhomick P. C. Supong A. Baruah M. Pongener C. Sinha D. Sustainable Chem. Pharm. 2018;10:41–49. doi: 10.1016/j.scp.2018.09.001. [DOI] [Google Scholar]
- Ma H. Liu Z. Wang X. Zhang C. Jiang R. J. Renewable Sustainable Energy. 2017;9:044105. doi: 10.1063/1.4997019. [DOI] [Google Scholar]
- Bastami T. R. Entezari M. H. Chem. Eng. J. 2012;210:510–519. doi: 10.1016/j.cej.2012.08.011. [DOI] [Google Scholar]
- Ma H. Chen Z. Wang X. Liu Z. Liu X. J. Renewable Sustainable Energy. 2019;11:024102. doi: 10.1063/1.5063676. [DOI] [Google Scholar]
- Wu Y. Cao J. Zhao X. Hao Z. Zhuang Q. Zhu J. Wang X. Wei X. Electrochim. Acta. 2017;252:397–407. doi: 10.1016/j.electacta.2017.08.176. [DOI] [Google Scholar]
- Fisal A. Daud W. M. A. W. Ahmad M. A. Radzi R. Chem. Eng. J. 2011;178:461–467. doi: 10.1016/j.cej.2011.10.044. [DOI] [Google Scholar]
- Sadeek S. A. Negm N. A. Hefni H. H. Wahab M. M. A. Int. J. Biol. Macromol. 2015;81:400–409. doi: 10.1016/j.ijbiomac.2015.08.031. [DOI] [PubMed] [Google Scholar]
- Kong J. Yue Q. Huang L. Gao Y. Sun Y. Gao B. Li Q. Wang Y. Chem. Eng. J. 2013;221:62–71. doi: 10.1016/j.cej.2013.02.021. [DOI] [Google Scholar]
- Lai B. Zhang Y. Chen Z. Yang P. Zhou Y. Wang J. Appl. Catal., B. 2014;144:816–830. doi: 10.1016/j.apcatb.2013.08.020. [DOI] [Google Scholar]
- Khan I. M. Ahmad A. J. Mol. Struct. 2010;977:189–196. doi: 10.1016/j.molstruc.2010.05.031. [DOI] [Google Scholar]
- Yang G. Jiang H. Water Res. 2014;48:396–405. doi: 10.1016/j.watres.2013.09.050. [DOI] [PubMed] [Google Scholar]
- Thommes M. Kaneko K. Neimark A. V. Olivier J. P. Rodriguez-Reinoso F. Rouquerol J. Sing K. S. Pure Appl. Chem. 2015;87:1051–1069. [Google Scholar]
- Ershov S. Khelifa F. Dubois P. Snyders R. ACS Appl. Mater. Interfaces. 2013;5:4216–4223. doi: 10.1021/am400406a. [DOI] [PubMed] [Google Scholar]
- Liu W. Zeng F. Jiang H. Zhang X. Chem. Eng. J. 2011;170:21–28. doi: 10.1016/j.cej.2011.03.020. [DOI] [Google Scholar]
- Tang L. Tang J. Zeng G. Yang G. Xie X. Zhou Y. Pang Y. Fang Y. Wang J. Xiong W. Appl. Surf. Sci. 2015;333:220–228. doi: 10.1016/j.apsusc.2015.02.025. [DOI] [Google Scholar]
- Zhou Y. Liu X. Tang L. Zhang F. Zeng G. Peng X. Luo L. Deng Y. Pang Y. Zhang J. J. Hazard. Mater. 2017;333:80–87. doi: 10.1016/j.jhazmat.2017.03.031. [DOI] [PubMed] [Google Scholar]
- Dąbrowski A. Podkościelny P. Hubicki Z. Barczak M. Chemosphere. 2005;58:1049–1070. doi: 10.1016/j.chemosphere.2004.09.067. [DOI] [PubMed] [Google Scholar]
- Rao P. Sun Z. Zhang W. Yao W. Wang L. Ding G. RSC Adv. 2015;5:89545–89551. doi: 10.1039/C5RA12039J. [DOI] [Google Scholar]
- Ma H. Yang J. Gao X. Liu Z. Liu X. Xu Z. J. Hazard. Mater. 2019;369:550–560. doi: 10.1016/j.jhazmat.2019.02.063. [DOI] [PubMed] [Google Scholar]
- Nourmoradi H. Avazpour M. Ghasemian N. Heidari M. Moradnejadi K. Khodarahmi F. Javaheri M. Moghadam F. M. J. Taiwan Inst. Chem. Eng. 2016;59:244–251. doi: 10.1016/j.jtice.2015.07.030. [DOI] [Google Scholar]
- Ünlü N. Ersoz M. J. Hazard. Mater. 2006;136:272–280. doi: 10.1016/j.jhazmat.2005.12.013. [DOI] [PubMed] [Google Scholar]
- Dutta D. P. Venugopalan R. Chopade S. ChemistrySelect. 2017;2:3878–3888. doi: 10.1002/slct.201700135. [DOI] [Google Scholar]
- Martins A. C. Pezoti O. Cazetta A. L. Bedin K. C. Yamazaki D. A. Bandoch G. F. Asefa T. Visentainer J. V. Almeida V. C. Chem. Eng. J. 2015;260:291–299. doi: 10.1016/j.cej.2014.09.017. [DOI] [Google Scholar]
- Li K. Li P. Cai J. Xiao S. Yang H. Li A. Chemosphere. 2016;154:310–318. doi: 10.1016/j.chemosphere.2016.03.100. [DOI] [PubMed] [Google Scholar]
- Fil B. A. Part. Sci. Technol. 2016;34:118–126. doi: 10.1080/02726351.2015.1052122. [DOI] [Google Scholar]
- Sun C. Li C. Wang C. Qu R. Niu Y. Geng H. Chem. Eng. J. 2012;200–202:291–299. doi: 10.1016/j.cej.2012.06.007. [DOI] [Google Scholar]
- Wei Y. Xia Y. J. Environ. Sci. Water Resour. 2019;5:577–584. doi: 10.1039/C8EW00835C. [DOI] [Google Scholar]


