Abstract
Despite the advances in modern medicine, antibiotic resistance is a persistent and growing threat to the world. Thus, the discovery and development of novel antibiotics have become crucial to combat multi-drug resistant pathogens. The goal of our research is to discover a small molecular peptide that can disrupt the synthesis of new ribosomes. Using the phage display technique, we have discovered a 7-mer peptide that binds to the second strand of 16S h34 RNA with a dissociation constant in the low micromolar range. Binding of the peptide alters RNA structure and inhibits the binding of the ribosomal RNA small subunit methyltransferase C (RsmC) enzyme that methylates the exocyclic amine of G1207. The addition of this peptide also increases the lag phase of bacterial growth. Introduction of chemical modifications to increase the binding affinity of the peptide to RNA, its uptake and stability can further improve the efficacy of the peptide as an antibiotic agent against pathogenic bacteria.
Discovery of a novel heptapeptide that disrupts RNA–RNA and RNA–protein interactions in bacterial ribosome.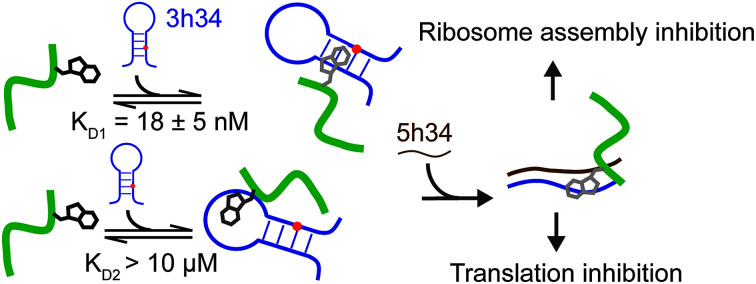
1. Introduction
Growing antibiotic resistance is a global concern, where multi-drug resistant pathogenic bacterial infections have caused millions of deaths every year. Thousands of patient deaths in the US have occurred despite prescribing more than a million doses of antibiotics.1 The discovery of both novel antibacterial targets and novel classes of antibacterial agents is essential to combat the ever-growing antibiotic-resistant bacterial strains.
The bacterial ribosome is an attractive target for the development of antibacterial agents due to its functional importance in protein biosynthesis and higher cellular abundance. Many of the known classes of antibiotics bind to intact ribosomes and inhibit bacterial translation initiation, elongation, and termination.2–4 Much like translation inhibition, ribosome biogenesis can also be an attractive target for antibacterial agents. Many studies have shown the accumulation of ribosome assembly intermediates in the presence of antibiotics.5–7 This observation suggests that these antibiotics likely inhibit ribosome assembly by disrupting specific RNA–RNA and RNA–protein interactions that occur during ribosome assembly. It should also be noted that the accumulation of assembly intermediates could arise from the depletion of ribosomal protein pool as a direct result of translation inhibition.8 Efforts to discover potential antibacterial agents that target ribosome assembly is hampered by the lack of mechanistic evidence for ribosome assembly inhibition by known antibacterial agents. However, unlike translation inhibition, ribosome assembly inhibition is irreversible.9 Non-productive assembly intermediates that are accumulated due to ribosome biogenesis inhibition will eventually get processed by various RNases and proteases.9
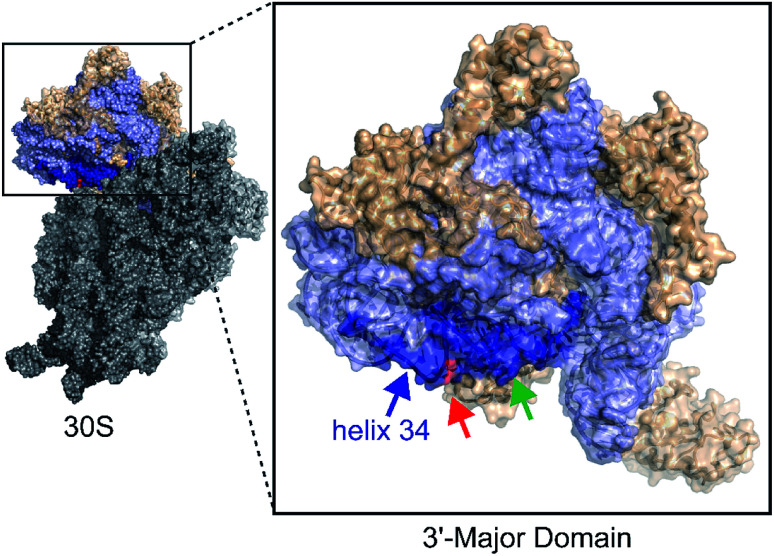
Similar to translation, there are multiple methods for inhibiting bacterial ribosome biogenesis. Disruption of various RNA–protein interactions of ribosomal RNA (rRNA) with ribosomal proteins (r-proteins), assembly factors, and modification enzymes can cause assembly inhibition. We used bacterial ribosome small subunit helix 34 as the target for developing antibacterial agents. 16S helix 34 (h34) is located in the 30S 3′-major-domain and is comprised of two RNA strands, the “first strand” (5h34, 1047–1065, standard E. coli nucleotide numbering), and “second strand” (3h34, 1191–1210) separated by 16S helices 35–40 (Fig. 1).10,11 Helix 34 forms various critical RNA–RNA contacts with mRNA and A-site bound tRNA as well as RNA–protein contacts with r-proteins (S3, S10, and S14),11–13 and rRNA modification enzyme RsmC.14
Fig. 1. The 3′-major domain makes up the head of the 30S ribosome. Protein and rRNA shown in wheat and light blue space filled ribbon structures, respectively. The m2G1207 (red) nucleotide is located in the 16S helix 34 (dark blue) (PDB ID: 2I2P). The green arrow indicates tetracycline binding site.
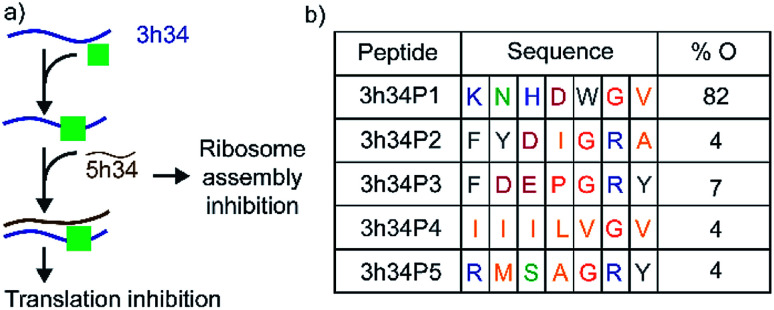
Transverse (G to C/U) mutations at position 1207 of 16S helix 34 are known to be lethal to bacteria, whereas the inverse mutation is phenotypically silent.15 This result suggests that maintaining structural integrity through base-pairing of G1207 with C1051 may be crucial for the survival of bacteria. During bacterial ribosome biogenesis, assembly of ribosomal proteins co-occurs with the transcription of rRNA.16–18 Transcription of 5h34 strand precedes 3h34 strand. Accurate and fast annealing of helix 34 strands is critical for the assembly of late binding proteins such as S3. We hypothesized that small molecules that bind to 3h34 could disrupt the formation of native 16S helix 34 duplex during ribosome biogenesis, thus cause toxicity to bacteria (Fig. 2a). Interestingly, several known antibiotics such as negamycin and tetracycline bind to 16S helix 34.19–21 Tetracycline-class of antibiotics bind to the base of h34 and inhibit translation initiation and termination.22,23 Besides, these antibiotics belonging to this class can influence translation fidelity by disrupting RNA–RNA contacts between helix 34 and the A-site-bound tRNA.22,24 Disrupting 16S helix 34 by inhibitors can eventually alter RNA–RNA contacts with A-site-bound tRNA, therefore lead to translation inhibition.
Fig. 2. (a) 16S helix 34 is a target for antibacterial agents. Perturbation of helix 34 structure can be lethal to bacteria. (b) Sequences and percentage occurrence (% O) of peptides selected that bind to target RNA at the end of third biopanning are shown. Blue, green, pink, grey, orange, and yellow colored fonts represent positively charged, polar, negatively-charged, aromatic hydrophobic, conformationally unique, and non-polar amino acids, respectively.
2. Materials and methods
2.1. RNA preparations and quantification
Chemically synthesized RNA oligonucleotides used in these experiments (sequences are shown in Table S1†) were purchased from either Integrated DNA Technologies (IDT) or Horizon Dharmacon Inc. RNA oligonucleotides, 3h34 and 5h34, were purchased from IDT in the 2′-deprotected form, whereas 3h34F1, 3h34F2, 3h34M1, and 3h34M2 RNA oligonucleotides were purchased from Dharmacon as stable 2′-ACE protected form. These RNAs were dissolved in 100 μL of TE buffer (1 M Tris–HCl pH 7.5 and 0.5 M EDTA pH 8.0). For PAGE purification, these RNA oligonucleotide solutions were mixed with denaturing gel loading dye. Samples were then incubated at 90 °C for 2 minutes for complete denaturation and loaded immediately to 16% denaturing polyacrylamide gels. Samples were electrophoresed for 1.5–2 h at 15 W per gel. Gel bands corresponding to RNA oligonucleotides were visualized by UV shadowing. Shorter failure products from chemical synthesis of RNA oligonucleotides were not observed (for any helix 34 model RNAs) under UV shadowing. Full-length RNA oligonucleotides were extracted into 2–3 mL of TEN buffer (10 mM Tris–HCl at pH 7.5, 1 mM Na2EDTA at pH 8.0, 250 mM NaCl) from corresponding gel bands using the freeze–thaw method. Concentrating and buffer exchanging of eluted RNAs were carried out using Pierce™ Protein Concentrator PES, 3k MWCO. RNA oligonucleotides were then deprotected (as needed) by incubating at 60 °C for 30 minutes in 2′-deprotection buffer (100 mM acetic acid pH 3.8 adjusted with TEMED, provided by Dharmacon). Deprotected RNA oligonucleotides were dried completely in Vacufuge. Dried samples were stored at −20 °C and dissolved in the appropriate volume of TE buffer when needed. The concentrations of the purified RNA oligonucleotide samples were calculated using measured absorbance at A260 (Thermo Scientific NanoDrop One). Extinction coefficients for all RNA oligonucleotides were obtained from IDT oligoanalyzer software. RNA oligonucleotides were aliquoted in a small volume of working solution and stored at −20 °C for future use. Fluorescently-labeled 3h34-cy3 RNA oligonucleotide (HPLC purified by manufacturer) was purchased from IDT with a Cyanine3 (Cy3) dye conjugated at the 5′-end.
Similarly, 3h34-Cy3 RNA was dissolved in an appropriate volume of TE buffer, and concentration was measured as mentioned above. The purity of purified RNA oligonucleotides was confirmed by denaturing gel electrophoresis (as described above) of 5′-radiolabeled (32P) RNA oligonucleotides (using polynucleotide kinase end labeling standard protocol). Denaturing gels were dried (using gel dryer model 583 Bio-Rad equipped with gel-master gel dryer vacuum system) and exposed to intensifying screens overnight prior to obtaining autoradiograph using Typhoon FLA 9500. Only a single band was observed in gels for all helix 34 model RNA oligonucleotides tested, indicating their high purity.
2.2. Screening of peptide library to discover peptides binding to 3h34 RNA
Ph.D.-7 phage display library (New England Biolabs) was used to identify peptides that bind to 3h34 RNA. Biopanning and titering were carried out using the manufacturer suggested protocol with slight adjustments suggested by Lamichhane et al. (Fig. S1a†).25 HPLC purified target RNA biotinylated at 5′-end {5′-biotin-r(CCGUCAAGUCAUCAUGGCCC)-3′} was purchased from Integrated DNA Technologies (IDT). Biotinylated target RNA (50 nM) was incubated with 10 μL of the phage pool. In each biopanning cycle, approximately 1011 plaque-forming units (pfu μL−1) were used. Phages were incubated with target RNA in 200 μL of TBST at ambient temperature for 20 min. For each biopanning, 0.5 mg of streptavidin-coated magnetic beads (Dynabeads M-280 Streptavidin, Invitrogen) was washed twice with 1 mL of TBST washing buffer (50 mM Tris–HCl; pH 7.5, 150 mM NaCl with 0.1% Tween-20). The phage-target RNA solution was then mixed with washed magnetic beads followed by the incubation for 15 minutes at ambient temperature. Magnetic beads were pulled down using the magnetic separator (Promega) before removing the supernatant with unbound phages. Phage-RNA complexes were subject to several rounds of washing, as shown in ESI Table S2,† to remove unbound phages. Phages bound to RNA were then eluted using 1 mL of glycine elution buffer (0.2 M glycine-HCl; pH 2.2, 1 mg mL−1 bovine serum albumin) and immediately neutralized by adding 150 μL of 1 M Tris–HCl, pH 9.1. A small fraction of the eluate (10 μL) was titered on LB/IPTG/Xgal plates (Fig. S1b†). The remaining eluate was amplified by infection of E. coli ER2738 (20 mL of culture). Amplified phages were titered again (Fig. S1c†) to determine the number of available titers (shown in Table S3†). During the second biopanning cycle, amplified phages from the first biopanning cycle were preselected against magnetic beads, streptavidin, tips, and tubes as a negative selection. Magnetic beads with any non-specifically bound phages were pelleted down. Supernatant with unbound phages was then incubated with tRNA (5 μg mL−1) to eliminate phages binding non-specifically to RNAs, followed by the incubation with biotinylated target RNA (20 min at ambient temperature). This mixture is then incubated with freshly washed magnetic beads. In the third biopanning cycle, phages were counter selected against 5h34 RNA (50 nM) before the addition of biotinylated target RNA. RNA was immobilized, washed, and titered using the same protocol as described previously. The stringency in the washing steps was increased in each biopanning cycle by increasing the concentration of Tween-20 and the number of washings as given in Table S2.† At the end of each biopanning, the eluted phages were amplified. Phage DNA was extracted after the amplification of single plaque isolated from a titered plate of each biopanning. The region of phage DNA that encodes randomized heptapeptide sequence was amplified by PCR using manufactures suggested forward and reverse primers (5′-GCAATTCCTTTAGTGGTACCTTTC-3′ and 5′-CCCTCATAGTTAGCGTAACG-3′), respectively. Amplified DNA was then purified using the GFX PCR DNA and Gel Band Purification Kit (GE Healthcare). The size and the purity of DNA fragments were tested using 1% agarose gel electrophoresis (Fig. S1d†). Concentrations of purified phage DNA fragments in ng μL−1 were determined (Thermo scientific Nanodrop One) before sending for Sanger sequencing (GenScript Inc.). DNA sequences were analyzed using bioinformatics software and tools {Codon Code aligner, Reverse Complement tool, translate tool from ExPaSy (Bioinformatics Resource Portal), and Clustal Omega (EMBL-EBI, the European Bioinformatics Institute)}.
2.3. Tryptophan fluorescence change experiment
Tryptophan fluorescence change experiments were carried out to confirm the binding of the peptide sequence to helix 34 model RNAs. Chemically synthesized 3h34P1 heptapeptide (KNHDWGV) was purchased from Sigma-Aldrich Corp. Working solutions of 3h34P1 were prepared by dissolving the peptide in HK50 buffer (80 mM Hepes; pH 7.6, 50 mM KCl). Purified helix 34 model RNA oligonucleotides (0–22.5 μM) were titrated onto 0.1 μM of peptide P1 in HK50 buffer. At each step of titration, tryptophan fluorescence (320–400 nm wavelength) was measured followed by excitation at 280 nm using a PTI QM-400 fluorimeter (Horiba Scientific). All titrations were performed at 30 °C. Fluorescence intensity at 350 nm wavelength was used to calculate the fraction fluorescence change using eqn (1)
| Fraction fluorescence change, FC = (F0 − Fx)/F0. | 1 |
F0 and Fx in eqn (1) are fluorescence intensities at 0 μM and x μM concentrations of RNA oligonucleotides, respectively. All the titrations were duplicated, and the average of the fraction fluorescence was plotted against RNA concentrations used. Least square fitting of RNA titration curves were performed in Origin (2015 Academic version) using either eqn (2)
| FC = A/(1 + KD/[RNA]) | 2 |
or eqn (3)
| FC = (A1/(1 + KD1/[RNA])) + (A2/(1 + KD2/[RNA])) | 3 |
to obtain equilibrium dissociation constants of various RNA–peptide complexes. Eqn (2) and (3) are derived from the equation for single binding isotherm assuming one or two mutually exclusive binding events of RNA to the peptide. In eqn (3), A1 and A2 represent total fluorescence change observed for light and tight RNA–peptide complexes, respectively, at complete saturation. KD1 and KD2 are the respective equilibrium dissociation constants.
2.4. Protein overexpression, purification, and fluorescence labeling
Overexpression plasmid (pCA24N) for the ribosomal RNA small subunit methyltransferase C (RsmC) protein was purchased from National BioResource Project: E. coli (NIG, Japan) (ASKA collection).26 The plasmid was transformed into BL21 E. coli expression strains using standard protocols suggested by the manufacturer. An overnight culture (10 mL) of E. coli containing the overexpression plasmid was inoculated in 1 L of LB media with 10 μg mL−1 chloramphenicol. Cells were grown at 37 °C with constant shaking (200 rpm) until OD600 reached approximately 0.4. Overexpression of RsmC was induced by adding 1 mM IPTG followed by incubation of cells at 37 °C for another 3 h. Bacterial cells were harvested by centrifugation at 8000 rpm for 15 min at 4 °C, and the cell pellets were stored in −80 °C freezer until its use (up to 3 months).
Bacterial cell pellets were resuspended in Buffer C (Buffer A with protease inhibitor) and lysed by sonication. Cell debris was separated by centrifugation, and the supernatant was equilibrated with Buffer A (20 mM Hepes pH 7.6, 1 M KCl) by dialysis. The supernatant was then loaded onto a Ni-NTA column for affinity purification (using AKTA start). Protein RsmC was eluted out with Buffer E {20% Buffer B (20 mM Hepes pH 7.6, 1 M KCl, 1 M Imidazole) and 80% Buffer A} after washing with Buffer D (1% Buffer B and 99% Buffer A) to remove proteins that are bound to Ni-NTA non-specifically. Purified protein was finally dialyzed against the storage buffer (20 mM Hepes pH 6.5, 1 M KCl, and six mM β-mercaptoethanol). Aliquots (1 mL) of protein solution were snap-freeze and stored at −80 °C. The concentration of purified protein was determined by measuring the absorbance at 280 nm wavelength and the extinction coefficient of the protein RsmC. The concentration was compared using the Bradford assay. The N-terminal of protein RsmC was fluorescently labeled by incubating RsmC with 5 molar excess of Cyanine5 (Cy5) dye linked to mono-reactive NHS ester as described previously.27 Free dyes were removed by using the affinity chromatography as described above. The labeled protein was dialyzed against a final storage buffer. SDS-PAGE confirmed the purity of both unlabeled and labeled proteins. Approximately 10 μL aliquots of labeled protein were snap-freeze and stored at −80 °C in a light-tight box until future use.
2.5. FRET-based inhibition assay
Cy3-labeled RNA (3h34-Cy3, 5 nM) was pre-incubated with various concentrations (0–10 μM) of 3h34P1 peptide in HK50 buffer at 30 °C for 10 minutes. Protein RsmC-Cy5 labeled with acceptor dye, Cy5 (100 nM) was then added to each sample containing the RNA–peptide complexes. Samples were incubated for 10 minutes at 30 °C. The fluorescence emission (550–700 nm) followed by excitation of FRET donor at 532 nm was measured in PTI QM-400 fluorimeter (Horiba Scientific). FRET efficiency was calculated for various concentrations of peptide P1 using eqn (4)
| EFRET = (ID − IDA)/ID; | 4 |
ID = intensity of donor, IDA = intensity of donor in the presence of acceptor. Results from biological triplicates were averaged.
2.6. Circular dichroism (CD) spectroscopy
CD spectra of the target RNA 3h34 in the presence of various concentrations of 3h34P1 peptide were accumulated using a JASCO J-810 spectropolarimeter connected to a Julabo F 25 water bath for temperature regulation. The RNA sample was prepared in 5 μM concentration in CD buffer (50 mM KCl, 20 mM Na cacodylate, 0.5 mM EDTA, pH 7.6 adjusted with 1 M HCl).28 CD spectra of RNA samples were obtained from 320–200 nm wavelength. CD spectra at various peptide concentrations (0 to 40 μM) were obtained. All the experiments were carried out in duplicate to show the consistency of the results.
2.7. Electrophoretic mobility gel-shift assay
EMSA was carried out by adding an increasing concentration of complementary 5h34 RNA (0–120 nM) to 2 nM of 3h34 RNA (radiolabeled with 32P isotope at the 5′-end) in annealing buffer (HK50) and incubated at 37 °C for 10 min. These annealing reactions were performed both in the presence (10 μM) and the absence of P1. Strand annealing reactions were then quenched by adding 5× gel loading buffer and immediately loaded onto a 10% non-denaturing polyacrylamide-THEM3 (340 mM Tris-base, 660 mM HEPES, 1 mM EDTA and 3 mM MgCl2) gel for electrophoresis at 15 W per gel for ∼1.5 h. Gels were dried and exposed to an intensifying screen overnight. Radiographs of these gels were obtained using Typhoon FLA 9500 (GE Healthcare), and gel-bands were quantified using ImageJ (1.48v) software. Eqn (5)
| Fraction of duplex, F = IB/(IB + IU); | 5 |
IB = intensity of duplex species, IU = intensity of free species was used to calculate the fraction of duplex that was plotted against [5h34]. Equilibrium dissociation constants for helix 34 duplex formation in presence and absence of the peptide (P1) were calculated by non-linear curve fitting using eqn (6)
| F = A/(1 + (KD/[5h34])); | 6 |
A = total fraction of duplex (asymptote), KD = equilibrium dissociation constant, [5h34] = concentration of 5h34 RNA in Origin (2015 Academic version) software.
2.8. Antibacterial micro-titer plate assay
Defects in bacterial (E. coli; dlacZ Delta M15 Delta(lacZYA-argF) U169 recA1 endA1 hsdR17(rK-mK+) supE44 thi-1 gyrA96 relA1) growth in the presence of the peptide was tested. Various concentrations (0 to 50 μM) of the peptide were added to 200 μL of overnight, diluted bacterial culture (0.05 absorbance at 600 nm wavelength) in a Co-star 96 well micro-titer plate. Absorbance was recorded at different time intervals up to 24 hours with a SpectraMax4 spectrometer. All the experiments were carried out in triplicates. The average of absorbance values was plotted against time (minutes), and the sigmoidal growth curve was fitted to eqn (7)
| A600 = A/(1 + exp{(4 × u × (L − t)/A) + 2)}; | 7 |
A600 = absorbance at 600 nm, A = maximum absorbance at 600 nm, u = growth rate, L = lag time, and t = time derived based on logistic model,29 and the growth parameters were obtained. The experiments were carried out at 30, 37, and 42 °C to study the effect of temperature on the peptide dependent bacterial growth defects.
3. Results and discussion
3.1. Discovery of peptides that bind specifically to a strand of 16S helix 34
In our study, the phage display method was used to discover peptides that specifically bind to 16S helix 34 RNA. Phage display is an attractive method used extensively to identify small peptides that bind to various classes of biomolecules.30,31 Many previous studies have successfully used phage display libraries to discover peptide sequences that bind favorably to various functional RNAs.25,32–37 This research was aimed at discovering peptides that can inhibit bacterial translation by targeting both ribosome assembly and translation elongation. An M13 phage library purchased from New England Biolab (Ph.D.-7) was used in screening against the second strand of 16S h34 rRNA (3h34, nts 1191–1210) that also contains the methylation site (G1207) of RsmC enzyme. This M13 phage library contained 100 copies of 109 different phages that contained a randomized 7-mer peptide sequence fused to the N-terminus of their pIII minor coat proteins via a Gly–Gly–Gly linker. Several rounds of biopanning were performed under increasing stringency in removing non-specifically bound phages, as shown in Table S2.† Similarly, counter selections were performed against various competitor RNAs during each biopanning cycle. After three biopanning cycles, the phage pool was found to be enriched with phages with several unique peptide sequences (Fig. 2b). A vast majority (82%) of the selected phages at the end of the third biopanning cycle had 3h34P1 peptide (KNHDWGV) displayed on them (Fig. 2b). Amino acids that are most likely to be present in an RNA-binding protein sequence is observed in all the enriched peptides except 3h34P4. The aromatic tryptophan side chain present in P1 can be easily intercalated between two adjacent RNA bases, whereas positively charged amino acid side chains most likely interact with negatively-charged RNA sugar-phosphate backbone.38–40
3.2. The selected peptide binds to target RNA with nanomolar binding affinity
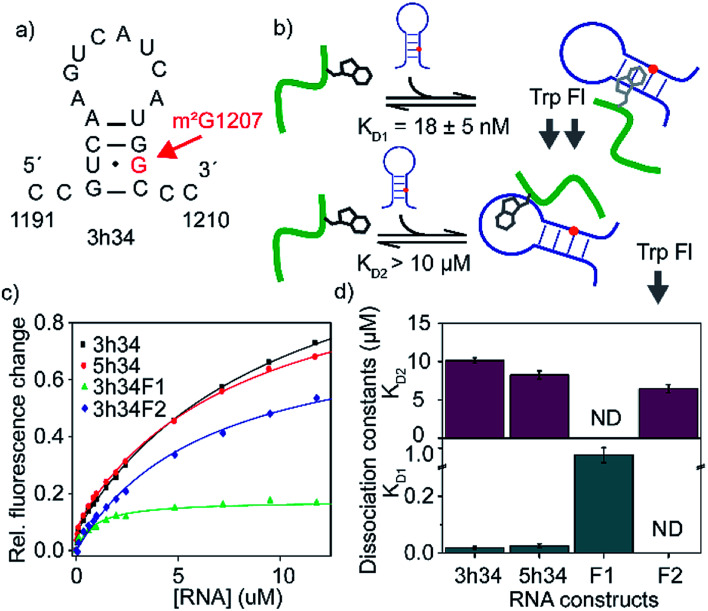
The binding affinity of an inhibitor to its target is a crucial determinant of its efficacy and its inhibitory role. For many known antibiotics, equilibrium dissociation constants fall in sub-micromolar to low-micromolar concentration range.41,42 Fluorescence-based titration experiments were performed to confirm the binding of P1 to target 3h34 RNA with high binding affinity. We expected that the tryptophan side chain in P1 could intercalate between two RNA bases causing a decrease in tryptophan fluorescence. With the addition of 3h34 RNA (20 μM) onto P1 (0.1 μM) in HK50 buffer, an approximately 80% decrease in fluorescence was observed (Fig. 3c). Interestingly, titration data agrees well with a model that assumes two mutually independent binding events for P1 to its target RNA (Fig. 3b and S2 ESI†). The equilibrium dissociation constant for the binding of P1 high-affinity binding site (KD1) on 3h34 was found to be 18 ± 5 nM, whereas a KD2 > 10 μM was observed for the binding of P1 to low-affinity binding site (Fig. 3d). The overall change of tryptophan fluorescence at saturation was also found to be different when P1 bind to these two binding sites (Fig. S3 ESI†), perhaps due to the different degree of intercalation observed at each binding site. It is possible that P1 can independently bind to the stem and the loop regions of 3h34 RNA hairpin. Next, the two halves of 3h34 (3h34F1: nts 1191–1200 and 3h34F2: nts 1201–1210) were titrated against the peptide to narrow down the binding sites of P1. A model with a single RNA binding mode for P1 was sufficient to interpret titration results of helix 34 RNA fragments, 3h34F1 and 3h34F2 (Fig. 3c). A ten-fold higher KD1 was observed for the binding of P1 to 3h34F1 (Fig. 3d). P1 may prefer to bind to the stem of predicted (Mfold, confirmed by UV thermal melting) hairpin structure of 3h34 compared to the single-stranded sequence (Fig. 3a). Unexpectedly, P1 also bound to 5h34 RNA with a similar binding affinity to 3h34 RNA. Both 3h34 and 5h34 RNAs share some sequence similarity (such as UGGC sequence) that could favorably accommodate P1. Besides, we noted that the majority of phages counter selected against 5h34 RNA displaying P1 sequence. However, it is also possible that P1-displaying phages were already in higher abundance after amplification of biopanning cycle 3 eluate. Control experiments performed using several scrambled or unrelated RNA sequences showed less than 10% quenching in tryptophan fluorescence (Fig. S4 ESI†), suggesting a higher binding specificity of P1 to 16S helix 34 RNAs.
Fig. 3. (a) Predicted secondary structure of 3h34 model RNA is shown. (b) Schematic representation of RNA binding model of P1. The model assumes mutually exclusive binding of P1 close to either the methylation site or the hairpin loop. (c) The fraction of tryptophan fluorescence change is plotted against RNA concentrations used. Titration experiments are duplicated and results are averaged. (d) Equilibrium dissociation constants for various RNA–P1 complexes are obtained by least square fitting of titration curves to a modified binding isotherm equation. Top and bottom panels show KDs for lighter and tighter P1-RNA complexes, respectively. The 3h34F1 and 3h34F2 RNAs were fitted to the single binding isotherm.
3.3. Binding of P1 induces structural changes in the target RNA
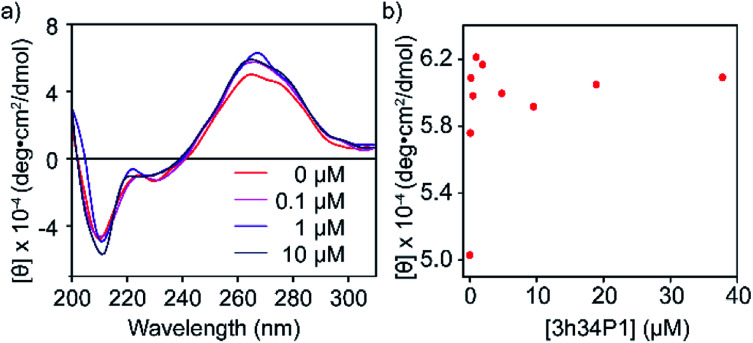
To confirm the binding of P1 to its target RNA and to investigate the ability of P1 to induce structural changes in 3h34 RNA, we performed circular dichroism (CD) spectroscopy experiments. Even in the absence of P1, the CD spectrum for 3h34 RNA showed a maximum at 266 nm and a local maximum at 275 nm, indicating the existence of multiple conformations (Fig. 4a). Circular dichroism at 266 nm increased rapidly with the addition of P1 up to 1 μM (Fig. 4b). Surprisingly, however, circular dichroism at 266 nm decreased when the concentration of the peptide is further increased from 1 μM (Fig. 4b). We attribute these changes in CD signal to structural changes in 3h34 RNA upon binding of P1 to its high- and low-affinity binding sites. However, the addition of P1 to 5h34 RNA showed no significant changes in CD spectra (Fig. S5 ESI†).
Fig. 4. (a) Changes in circular dichroism spectra of 3h34 RNA upon addition of P1 is shown. (b) Circular dichroism change at 266 nm wavelength also indicate two clear P1 binding events.
3.4. P1 influences the formation of 16S helix 34 duplex
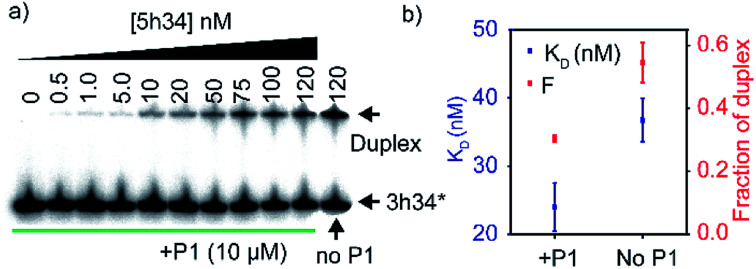
We hypothesized that P1 peptide could influence the formation of helix 34 native duplex. To test our hypothesis, we performed an electrophoretic mobility gel shift assays (EMSA). In these assays, radiolabeled 3h34 RNA (2 nM) was incubated with its complementary RNA strand. In the presence of complementary RNA strand (5h34), 3h34 formed an RNA duplex with lower electrophoretic mobility compared to single-stranded 3h34 RNA (Fig. 5a). In the presence of P1, the fraction of h34 duplex (at 100 nM 5h34) was found to be 0.30 compared to 0.54 in its absence (Fig. 5b). In addition, equilibrium dissociation constant for helix 34 duplex decreased in the presence of the peptide (Fig. 5b). Both these results suggest the ability of P1 peptide to influence helix 34 duplex formation. P1 may be stabilizing an off-path non-native helix 34 duplex.
Fig. 5. (a) Radiograph of EMSA carried out to detect P1-dependent strand annealing defects is shown. (b) Equilibrium dissociation constants of helix 34 duplex and the highest fraction of duplex is shown.
3.5. The selected peptide inhibits the binding of RsmC to its target RNA strand
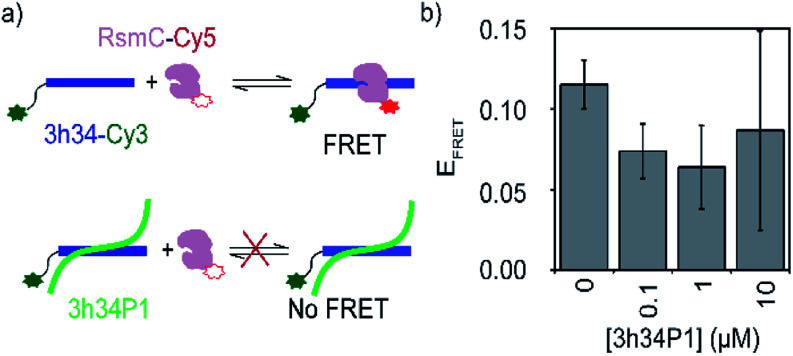
A competition FRET assay was performed to investigate the ability of P1 to inhibit interactions between 3h34 and RsmC enzyme. 16S rRNA methyltransferase enzyme RsmC bind to 3h34. Binding of RsmC is found to be essential for the formation of helix 34 duplex (unpublished data). For this FRET-based inhibition assay, protein RsmC labeled with FRET acceptor dye (Cyanine5) was added to the fluorescently-labeled 3h34 RNA (with FRET donor dye, Cyanine3) that was pre-incubated with various concentrations (0 to 10 μM) of P1 peptide (Fig. 6a). The FRET signal decreased with the increase in peptide concentration (Fig. 6b), illustrating the ability of P1 to inhibit protein RsmC binding to 3h34 RNA. The IC50 for RsmC binding inhibition by P1 is in the low micromolar range. However, even at 10 μM P1 concentration, FRET efficiency does not drop to zero. This result suggests two different possibilities; (1) only a fraction of RNA is not binding to RsmC or (2) the presence of P1 changed the binding orientation of RsmC to 3h34. However, if RsmC binding inhibition is due to the low-affinity binding site of P1 (KD > 10 μM), more than 20 μM concentration of P1 is required for complete inhibition. Unfortunately, P1 showed low solubility in the buffer used for FRET titrations at concentrations equal to or higher than 10 μM, preventing RsmC inhibition testing at high peptide concentrations (>10 μM). Likely, the inhibition of RNA–protein interactions by P1 peptide may not be limited to RsmC binding; P1 may also inhibit the binding of other r-proteins that bind 16S helix 34, such as r-protein S3 that is involved in unwinding of mRNA during bacterial translation.
Fig. 6. (a) A schematic showing the design of FRET-based inhibition assay. (b) Change in the FRET efficiency of 3h34-Cy3 and RsmC-Cy5 on increasing [P1] is shown.
3.6. P1 influences bacterial growth
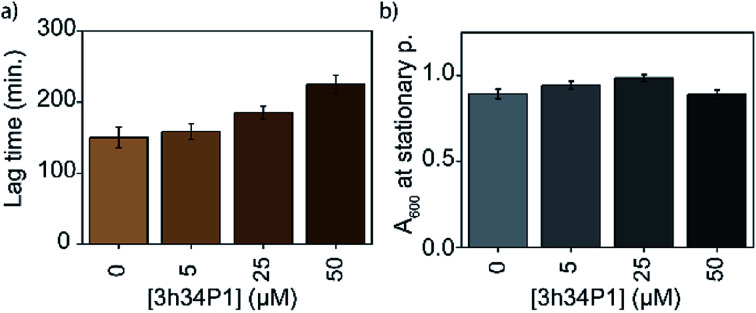
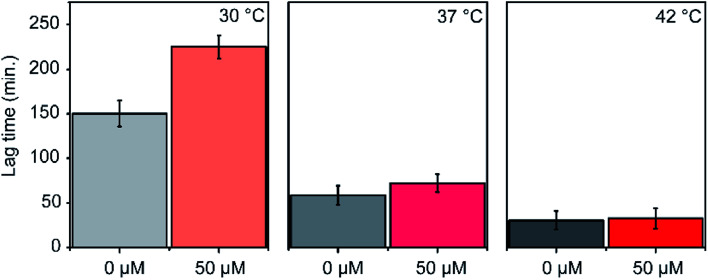
The efficacy of an inhibitor depends on many of its properties, such as cellular uptake, efflux, stability, solubility, and off-target binding. Although the in vitro inhibitory concentration is in the low micromolar range, the effective inhibitory concentration in vivo might be higher for P1. Changes in E. coli growth kinetics in the presence of the peptide were determined to evaluate the efficacy of P1 as an antibacterial agent. D-peptide of P1 was used in these experiments to improve the in vivo stability of the peptide. Our control experiments showed that the D-peptide of the P1 sequence binds equally well to target RNA as its L-peptide counterpart (Fig. S6† ESI†). Bacteria (E. coli) were inoculated into LB media that had varying concentrations (0–50 μM) of the D-peptide. The absorbance at 600 nm wavelength (A600) was recorded to track the bacterial growth at different times up to ∼24 hours. Sigmoidal growth curves were fitted to the logistic model29 to obtain growth parameters. Growth curves at 30 °C indicated an increase in the growth lag on increasing P1 concentration (Fig. 7a). Likely, bacterial growth lag can further increase at concentrations higher than that was tested and may even lead to growth inhibition.37 Unfortunately, the lack of solubility or aggregation of P1 stock solutions prevented the testing of bacterial growth lag increase at concentrations above 50 μM. No changes in the asymptote of the growth curve (A600 at stationary phase) were observed, indicating the inability of P1 to influence the overall bacterial growth at concentrations tested (Fig. 7b). The peptide-induced changes in the growth lag decreased with the increase of temperature from 25 °C to 37 °C or 42 °C (Fig. 8). However, at all temperatures tested, the bacterial growth rate remained the same regardless of the peptide concentrations used (Fig. S7 ESI†). Overall, the effect of the peptide on bacterial cell growth is low (Fig. S7 ESI†). Despite this, the significant increase in the growth lag at 30 °C signifies that this peptide may be involved in generating non-productive assembly intermediates at lower temperatures.43 At higher temperatures, kinetically trapped intermediates may refold due to higher thermal energy. Nevertheless, it is also likely that hydrolysis, efflux, and off-target binding of the peptide significantly influence its efficacy in vivo.
Fig. 7. Mild bacterial growth defects are observed in the presence of 3h34P1. Changes in the (a) lag time and (b) overall cell growth at stationary phase with increasing 3h34P1 peptide concentration is shown.
Fig. 8. Changes in lag phase of E. coli growth is shown. Experiments were done at 30 °C, 37 °C and 42 °C.
4. Conclusions
In conclusion, we have discovered a peptide that binds to one of the strands of helix 34 with a low nanomolar affinity. The binding of P1 peptide to its target RNA influences RNA–RNA and RNA–protein interactions of helix 34. Lack of intermolecular interactions of helix 34 may lead to ribosome biogenesis defects, therefore causing the observed bacterial growth defects. The introduction of chemical modifications that can increase cellular uptake, decrease the rate of hydrolysis and oxidation, and improve binding affinity to target RNA can increase the effectiveness of the peptide as an antibacterial agent. Linking of negamycin or tetracycline that bind close to helix 34 to P1 can improve its target specificity.
Conflicts of interest
There are no conflicts of interest to declare.
Supplementary Material
Acknowledgments
Authors thank NSF-REU (CHE-1659571) for Davidnhan To's summer research support, Dr Robert Tweig for granting access to CD spectrophotometer and Dr Christine Chow for her feedback during manuscript preparation.
Electronic supplementary information (ESI) available. See DOI: 10.1039/c9ra07812f
Notes and References
- Webster T. J. Li B. J. Orthop. Res. 2018;36:22–32. doi: 10.1002/jor.24043. [DOI] [PMC free article] [PubMed] [Google Scholar]
- Lin J. Zhou D. Steitz T. A. Polikanov Y. S. Gagnon M. G. Annu. Rev. Biochem. 2018;87:451–478. doi: 10.1146/annurev-biochem-062917-011942. [DOI] [PMC free article] [PubMed] [Google Scholar]
- Wilson D. N. Nat. Rev. Microbiol. 2014;12:35–48. doi: 10.1038/nrmicro3155. [DOI] [PubMed] [Google Scholar]
- Nishimura K. Johansen S. K. Inaoka T. Hosaka T. Tokuyama S. Tahara Y. Okamoto S. Kawamura F. Douthwaite S. Ochi K. J. Bacteriol. 2007;189:6068–6073. doi: 10.1128/JB.00558-07. [DOI] [PMC free article] [PubMed] [Google Scholar]
- McGaha S. M. Champney W. S. Antimicrob. Agents Chemother. 2007;51:591–596. doi: 10.1128/AAC.01116-06. [DOI] [PMC free article] [PubMed] [Google Scholar]
- Foster C. Champney W. S. Arch. Microbiol. 2008;189:441–449. doi: 10.1007/s00203-007-0334-6. [DOI] [PubMed] [Google Scholar]
- Mehta R. Champney W. S. Curr. Microbiol. 2003;47:237–243. doi: 10.1007/s00284-002-3945-9. [DOI] [PubMed] [Google Scholar]
- Maguire B. A. Microbiol. Mol. Biol. Rev. 2009;73:22–35. doi: 10.1128/MMBR.00030-08. [DOI] [PMC free article] [PubMed] [Google Scholar]
- Nikolay R. Schmidt S. Schlömer R. Deuerling E. Nierhaus K. H. Antibiotics. 2016;5:1–13. doi: 10.3390/antibiotics5020018. [DOI] [PMC free article] [PubMed] [Google Scholar]
- Noller H. Woese C. Science. 1981;212:403–411. doi: 10.1126/science.6163215. [DOI] [PubMed] [Google Scholar]
- Wimberly B. T. Brodersen D. E. Jr W. M. C. Morgan-warren R. J. Carter A. P. Vonrhein C. Hartsch T. Ramakrishnan V. Nature. 2000;407:327–339. doi: 10.1038/35030006. [DOI] [PubMed] [Google Scholar]
- Yusupova G. Z. Yusupov M. M. Cate J. H. D. Noller H. F. Cell. 2001;106:233–241. doi: 10.1016/S0092-8674(01)00435-4. [DOI] [PubMed] [Google Scholar]
- Yusupov M. M. Yusupova G. Z. Baucom A. Lieberman K. Earnest T. N. Cate J. H. D. Noller H. F. Science. 2001;292:883–896. doi: 10.1126/science.1060089. [DOI] [PubMed] [Google Scholar]
- Tscherne J. S. Nurse K. Popienick P. Ofengand J. J. Biol. Chem. 1999;274:924–929. doi: 10.1074/jbc.274.2.924. [DOI] [PubMed] [Google Scholar]
- Jemiolo D. K. Taurence J. S. Giese S. Nucleic Acids Res. 1991;19:4259–4265. doi: 10.1093/nar/19.15.4259. [DOI] [PMC free article] [PubMed] [Google Scholar]
- Powers T. Daubresse G. Noller H. F. J. Mol. Biol. 1993;232:362–374. doi: 10.1006/jmbi.1993.1396. [DOI] [PubMed] [Google Scholar]
- Chen S. S. Williamson J. R. J. Mol. Biol. 2013;425:767–779. doi: 10.1016/j.jmb.2012.11.040. [DOI] [PMC free article] [PubMed] [Google Scholar]
- Wilson D. N. Nierhaus K. H. Crit. Rev. Biochem. Mol. Biol. 2007;42:187–219. doi: 10.1080/10409230701360843. [DOI] [PubMed] [Google Scholar]
- Olivier N. B. Altman R. B. Noeske J. Basarab G. S. Code E. Ferguson A. D. Gao N. Huang J. Juette M. F. Livchak S. Miller M. D. Prince D. B. Cate J. H. D. Buurman E. T. Blanchard S. C. Proc. Natl. Acad. Sci. U. S. A. 2014;111:16274–16279. doi: 10.1073/pnas.1414401111. [DOI] [PMC free article] [PubMed] [Google Scholar]
- Polikanov Y. S. Szal T. Jiang F. Gupta P. Matsuda R. Shiozuka M. Steitz T. A. Vázquez-Laslop N. Mankin A. S. Mol. Cell. 2014;56:541–550. doi: 10.1016/j.molcel.2014.09.021. [DOI] [PMC free article] [PubMed] [Google Scholar]
- Oehler R. Polacek N. Steiner G. Barta A. Nucleic Acids Res. 1997;25:1219–1224. doi: 10.1093/nar/25.6.1219. [DOI] [PMC free article] [PubMed] [Google Scholar]
- Brodersen D. E. Clemons W. M. Carter A. P. Morgan-Warren R. J. Wimberly B. T. Ramakrishnan V. Cell. 2000;103:1143–1154. doi: 10.1016/S0092-8674(00)00216-6. [DOI] [PubMed] [Google Scholar]
- Pioletti M. Schlünzen F. Harms J. Zarivach R. Glühmann M. Avila H. Bashan A. Bartels H. Auerbach T. Jacobi C. Hartsch T. Yonath A. Franceschi F. EMBO J. 2001;20:1829–1839. doi: 10.1093/emboj/20.8.1829. [DOI] [PMC free article] [PubMed] [Google Scholar]
- Geigenmuller U. Nierhaus K. H. Eur. J. Biochem. 1986;161:723–726. doi: 10.1111/j.1432-1033.1986.tb10499.x. [DOI] [PubMed] [Google Scholar]
- Lamichhane T. N. Abeydeera N. D. Duc A. C. E. Cunningham P. R. Chow C. S. Molecules. 2011;16:1211–1239. doi: 10.3390/molecules16021211. [DOI] [PMC free article] [PubMed] [Google Scholar]
- Kitagawa M. Ara T. Arifuzzaman M. Ioka-Nakamichi T. Inamoto E. Toyonaga H. Mori H. DNA Res. 2005;12:291–299. doi: 10.1093/dnares/dsi012. [DOI] [PubMed] [Google Scholar]
- Sélo I. Négroni L. Créminon C. Grassi J. Wal J. M. J. Immunol. Methods. 1996;199:127–138. doi: 10.1016/S0022-1759(96)00173-1. [DOI] [PubMed] [Google Scholar]
- Abeysirigunawardena S. C. Chow C. S. RNA. 2008;14:782–792. doi: 10.1261/rna.779908. [DOI] [PMC free article] [PubMed] [Google Scholar]
- Zwietering M. H. Jongenburger I. Rombouts F. M. Riet K. V. 'T. Appl. Environ. Microbiol. 1990;56:1875–1881. doi: 10.1128/aem.56.6.1875-1881.1990. [DOI] [PMC free article] [PubMed] [Google Scholar]
- Smith G. P. Petrenko V. A. Chem. Rev. 1997;97:391–410. doi: 10.1021/cr960065d. [DOI] [PubMed] [Google Scholar]
- Hoess R. H. Chem. Rev. 2001;101:3205–3218. doi: 10.1021/cr000056b. [DOI] [PubMed] [Google Scholar]
- Agris P. F. Marchbank M. T. Newman W. Guenther R. Ingram P. Swallow J. Mucha P. Szyk A. Rekowski P. Peletskaya E. Deutscher S. L. J. Protein Chem. 1999;18:425–435. doi: 10.1023/A:1020688609121. [DOI] [PubMed] [Google Scholar]
- Mucha P. Szyk A. Rekowski P. Weiss P. A. Agris P. F. Biochemistry. 2001;40:14191–14199. doi: 10.1021/bi010978o. [DOI] [PubMed] [Google Scholar]
- Ye J.-D. Tereshko V. Frederiksen J. K. Koide A. Fellouse F. A. Sidhu S. S. Koide S. Kossiakoff A. A. Piccirilli J. A. Proc. Natl. Acad. Sci. U. S. A. 2008;105:82–87. doi: 10.1073/pnas.0709082105. [DOI] [PMC free article] [PubMed] [Google Scholar]
- Llano-Sotelo B. Klepacki D. Mankin A. S. J. Mol. Biol. 2009;391:813–819. doi: 10.1016/j.jmb.2009.06.069. [DOI] [PMC free article] [PubMed] [Google Scholar]
- Kaur M. Rupasinghe C. N. Klosi E. Spaller M. R. Chow C. S. Bioorg. Med. Chem. 2013;21:1240–1247. doi: 10.1016/j.bmc.2012.12.048. [DOI] [PMC free article] [PubMed] [Google Scholar]
- Bose D. Nahar S. Rai M. K. Ray A. Chakraborty K. Maiti S. Nucleic Acids Res. 2015;43:4342–4352. doi: 10.1093/nar/gkv185. [DOI] [PMC free article] [PubMed] [Google Scholar]
- Roviello G. N. Vicidomini C. Di Gaetano S. Capasso D. Musumeci D. Roviello V. RSC Adv. 2016;6:14140–14148. doi: 10.1039/C5RA25809J. [DOI] [PMC free article] [PubMed] [Google Scholar]
- Roviello G. N. Musumeci D. RSC Adv. 2016;6:63578–63585. doi: 10.1039/C6RA08765E. [DOI] [PMC free article] [PubMed] [Google Scholar]
- Musumeci D. Roviello V. Roviello G. N. Int. J. Nanomed. 2018;13:2613–2629. doi: 10.2147/IJN.S156381. [DOI] [PMC free article] [PubMed] [Google Scholar]
- Fourmy D. Recht M. I. Puglisi J. D. J. Mol. Biol. 1998;277:347–362. doi: 10.1006/jmbi.1997.1552. [DOI] [PubMed] [Google Scholar]
- Yoshizawa S. Fourmy D. Puglisi J. D. EMBO J. 1998;17:6437–6448. doi: 10.1093/emboj/17.22.6437. [DOI] [PMC free article] [PubMed] [Google Scholar]
- Stokes J. M. Davis J. H. Mangat C. S. Williamson J. R. Brown E. D. eLife. 2014;3:e03574. doi: 10.7554/eLife.03574. [DOI] [PMC free article] [PubMed] [Google Scholar]
Associated Data
This section collects any data citations, data availability statements, or supplementary materials included in this article.


