

Abstract
In medicine, obtaining simply a resolute and accurate image of an organ of interest is a real challenge. To achieve this, it has recently been proposed to use combined methods in which standard imaging (MRI, PAI, CT, PET/SPEC, USI, OI) is carried out in the presence of iron oxide nanoparticles, thus making it possible to image certain tissues/cells through the specific targeting of these nanoparticles, hence resulting in improved imaging contrast and resolution. Here, the advantages and drawbacks of these combined methods are presented as well as some of their recent medical applications.
In medicine, obtaining simply a resolute and accurate image of an organ of interest is a real challenge.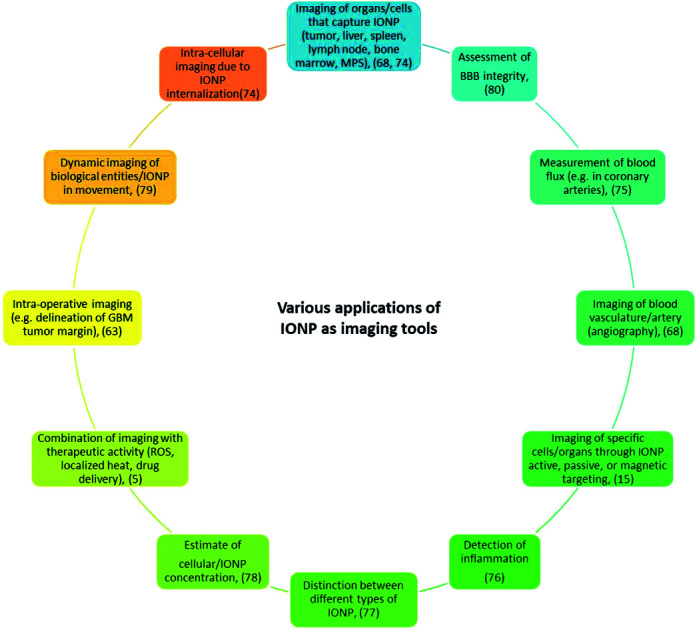
Introduction
Iron oxide nanoparticles (IONP) can be used to image organs/cells, which capture or accumulate them, such as the liver,1 spleen,2 lymph nodes,3,4 bone marrow, and those of the mononuclear phagocytic system, whether these organs/cells are tumorigenic or not.5,6 Other examples of IONP imaging applications include the detection of apoptosis,7 inflammation,8 angiography,9 ruptured atherosclerotic plaque,10 multiple sclerosis,5 integrity of the blood–brain barrier,11 and vasculature, e.g. coronary arteries12 (Fig. 1). The development of IONP for these applications stems from their advantages compared with non-nanoparticle based systems such as: (i) their longer residence/circulation time,13 (ii) their faculty to act as a contrast agent for several imaging methods simultaneously,14 (iii) their ability to specifically target an organ/tissue of interest via passive, active or magnetic targeting with an efficacy that varies depending on studies and leads to a percentage of IONPs that target the tumor relative to the quantity of injected IONP that is between 4 × 10⁻⁴% and 7%,15 and (iv) their use as ‘theranostic’ probes, where IONP therapeutic activity comes from localized ROS or heat production, exposure of IONP to various excitation sources, or conjugation of drugs to IONP.16 Furthermore, since IONP are already used on humans for therapeutic applications either to treat iron anemia disease or to carry out magnetic hyperthermia treatment of cancer,15 one could easily foresee their clinical use for imaging applications.
Fig. 1. Various applications of IONP as imaging tools.

Here, I review the use of IONP as imaging tools in various imaging methods, i.e. magnetic resonance imaging (MRI), magnetic particle imaging (MPI), photo-acoustic imaging (PAI), computing tomography (CT), positron emission tomography (PET)/single photon emission computed tomography (SPECT), ultrasound imaging (USI), and optical imaging (OI). IONP appeal comes from the fact that they enable:
• Adjustment of IONP T1/T2 contrasting strength by tuning the properties of these nanoparticles (size, charge, assembly, surface) for MRI;17
• Use of a device generating a magnetic field that can both image and heat IONP through magnetic hyperthermia for MPI;18
• Improved imaging resolution using common diagnostic devices for most imaging methods;19
• Localized functional imaging for PET/SPECT;20
• A broad spectrum of different types of detections, e.g. drug release and intracellular imaging, for optical imaging.21
The review presented here is broader in scope than previous ones since it covers more imaging techniques and is not restricted to IONP synthesized by a specific method.22–25
INOP advantages/drawbacks and parameters influencing IONP their imaging power in these various imaging methods are summarized in Table 1 and Fig. 2.
Advantages and drawbacks of the various imaging techniques (PA, OI, CT, USI, PET/SPEC, MRI, MPI) used in combination with IONP.
| Imaging methods | Advantages | Drawbacks |
|---|---|---|
| MRI | Widely used (available clinically) | Negative contrast |
| High penetration depth | Artifacts preventing detailed anatomical imaging | |
| Rapid signal acquisition | No direct measurement of concentration | |
| Functional information using fMRI | Not so good resolution (25–100 μM) | |
| Large area covered with one scan (>2500 cm2) | ||
| MPI | No penetration depth limit | Slow signal acquisition |
| Direct measurement of concentration | No widely used (not available clinically) | |
| No radiation | No functional information | |
| Good resolution (∼1 mm) | ||
| Can combine imaging/therapeutic activity (MPH) | ||
| Large area covered with one scan (can be adjusted by varying coil size) | ||
| PAI | No radiation | Low penetration depth (∼5 cm) |
| Rapid signal acquisition | Not widely used (only prototypes available in clinic) | |
| Good resolution (∼0.5 nm) | No direct measurement of IONP concentration | |
| Large area covered with one scan (∼15 cm2) | ||
| Functional information | ||
| CT | Large area covered with one scan (>2500 cm2, similar to MRI) | |
| Rapid signal acquisition | Not so good resolution (5–200 μm) | |
| No penetration depth limit | Radiation | |
| Widely used (available clinically) | No functional information | |
| Large area covered with one scan? | No direct measurement of low IONP concentration | |
| Limited soft tissue resolution | ||
| PET/SPECT | Widely used (available clinically) | Radiation |
| Simultaneous anatomical/functional imaging | Not so good good resolution (2-10 mm) | |
| Can combine imaging/therapeutic activity | Not straightforward to bind a radiotreacer to IONP and maintain the complex IONP-radiotrace active in vivo without its destruction | |
| No penetration depth limit | Not straightforward to acquire signal | |
| Can cover the whole body | ||
| No radiation | ||
| Direct measurement of concentration in some cases | ||
| Sonography | Widely used (available clinically) | No direct detection (use of magneto-motive mechanism or additional contrast agent such as micro-bubble) |
| No radiation | Not so good resolution (50–500 μM) | |
| Rapid signal acquisition | Limited penetration depth (∼5–20 cm) | |
| Large area covered with one scan (∼200 cm2) | No functional information | |
| No direct measurement of IONP concentration | ||
| Optical method | No radiation | Limited penetration depth (∼1–5 cm) |
| Area covered depends on diameter/number of optical fibers used | Not so good resolution (1–5 mm) | |
| Can combine therapeutic/imaging activity | Not widely used clinically | |
| Functional information in some cases | Not straightforward to bind a fluorophore to IONP and maintain the complex IONP-fluorophore luminescent in vivo | |
| Measurement of IONP concentration in some cases | Not straightforward to acquire signal | |
| All techniques | Can be combined with eachother | One technique does not gather all advantages |
| IONP can be eliminated in blood (capture by macrophages/opsonization) |
Fig. 2. Parameters that need to be optimized for using IONP as imaging tools in PA, OI, CT, USI, PET/SPEC, MRI, MPI.

Magnetic resonance imaging (MRI)
Since human body is mainly composed of water, specific water properties could be measured to image all parts of the organism. MRI was developed to measure proton relaxation times of water molecules following a two-steps excitation process in which a static magnetic field (B0) first produces longitudinal magnetization, i.e. alignment of proton nuclear spins parallel to B0, and then a radiofrequency pulse yields transverse magnetization, i.e. alignment of proton nuclear spins perpendicular to B0. Upon removal of the radiofrequency pulse, the proton nuclear spins relax longitudinally and transversely with relaxation times of T1 and T2, respectively. IONP can be used as contrast agents to improve the quality of MRI images by decreasing the values of T1 and/or T2. IONP contrast agents (CA) can be divided between T1 and T2 CA that lead to bright and dark MRI images associated with the recovery of the longitudinal magnetization (positive contrast, T1) or loss of transverse magnetization (negative contrast, T2). The relaxivity of an assembly of IONP and water molecules (Ri) can be expressed as a function of the relaxivities of isolated water protons (Rwater) and IONP magnetic moment (RIONP), using the relation: Ri = 1/Ti = Rwater + CIONPRIONP (i = 1 or 2). This relation indicates how Ri can be maximized by using large values of RIONP and CIONP. Furthermore, on the one hand, the Solomon–Bloemberger–Morgan theory indicates that R1 can be maximized by increasing IONP proton molecular thumbling time and decreasing proton residence lifetime. On the other hand, the outer-sphere diffusion model suggests that the effect of IONP on T1 or T2 relaxivities essentially depends on the stability or strength of IONP magnetic moment. According to this model, IONP with less stable magnetic moments and smaller sizes essentially increase T1 relaxivities while IONP with more stable magnetic moments and larger sizes increase T2 relaxivities. However, these theories are simplified. They don't take into account the whole stet of parameters that can influence the values of T1 and T2 relaxivities, which include:26,27
• Size of IONP, with small IONP acting as a positive contrast agent, e.g. r1 increases from 3–30 mM−1 s−1 for IONP of ∼20–65 nm to 66 mM−1 s−1 for IONP of ∼5 nm,28 and large IONP behaving as negative contrast agents, e.g. r2 increases from 35–130 mM−1 s−1 for IONP of 4–5 nm to 218–385 mM−1 s−1 for IONP of 12–14 nm,28
• Shape of IONP, which affects the stability of IONP magnetic moment and magnetization, leading “theoretically” to well-distributed magnetization for ellipsoids and to localization of magnetization in specific locations of IONP for other geometries, e.g. in the corners of IONP cubes, a parameter that seems to influence IONP contrasting power if water molecules are unable to reside where IONP magnetization is located.
• Crystallinity of IONP, which determines whether IONP affects T1 and/or T2 through: (i) IONP crystal phase, e.g. spinel/inverse spinel crystal phases of Fe2O3/Fe3O4 with ferrimagnetic behaviors enhance T2 contrast while IONP with antiferromagnetic behaviors, low magnetic moments, and small sizes such as α-FeOOH mainly impact T1 contrast, (ii) the presence of doping material in the crystal, e.g. doping XFe2O4 with X = Mn2+, Fe2+, Co2+, or Ni2+ leads to the largest magnetic moment for X = Mn2+ and a very significant effect on T2 with r2 = 358 mM−1 s−1 (1.5 T), and most interestingly (iii) the formation of mixed crystalline structures such as GdxFeyOz, possibly enabling dual-mode T1–T2 contrast agents.
• Surface of IONP, which can lead to an enhanced IONP contrasting ability when: (i) surface defects are minimized, (ii) the number of metallic atoms at IONP surface that are close to water molecules is maximized, (iii) a specific binding material covers the surface, (iv) oxygen atoms occupy surface vacancies in a well-adjusted manner, (iv) coating material and coating thickness are chosen to optimize the interactions between IONP magnetic moments and protons of water molecules.
• Assembly of IONP, which can change IONP contrasting power by modifying the diffusion properties of either IONP or water molecules surrounding IONP or both, e.g. a decrease in diffusion of water molecules surrounding IONP assemblies was associated with an increase in T2.
While some of these parameters favor one type of contrast to the detriment of the other one, e.g. a large nanoparticle size could enhance negative contrast and decrease positive contrast, other ones such as a mixed nanoparticle structure containing both metallic (Iron) and Gd atoms can promote simultaneously T1 and T2 contrasting ability.
In addition, since IONP contrasting ability depends on IONP interaction with the excitation sources, i.e. a combination of magnetic field and radiofrequency, the parameters of the excitation sources, in particular the strength or homogeneity/inhomogeneity of the magnetic field applied or the temperature of measurement, are other important parameters that influence the values of T1 and T2.
IONP, commercialized as negative or positive contrast agents, are listed in Table 2. They have been used for imaging: (i) liver/spleen using Ferumoxides/AMI-24/AMI-25/Endorem/Feridex or Ferucarbotran/SHU555A/Resovist/Cliavist,29 (ii) lymph node/bone marrow imaging using Ferumoxtran-10/AMI-227/Sinerem/Combidex or Ferucarbotran/SHU555C/Supravist,30 (iii) angiography using Feruglose/NC100250/Clariscan or Ferumoxytol/AMI-7228/Feraheme (231), (iv) delineation of the bowel from adjacent organs and tissues, using AMI-121/Lumirem/Gastromark,32
Properties of IONP as contrast agents in MRI, such as IONP blood half-life, values of IONP relaxivities r1 and r2, recommended IONP clinical dose expressed in quantity of iron in IONP per Kg of patients, administration route, i.e. intravenous (iv), intra-gastric (IG), as well as IONP applications for imaging various parts of the organism with MRI.
| Properties as MRI contrast agents of commercialized iron oxide nanoparticles | |||||||
|---|---|---|---|---|---|---|---|
| Name/reference | Composition | Blood half life in patients | r 1 (mmol−1 s−1) | r 2 (mmol−1 s−1) | Type of contrast | Clinical dose | Application/administration |
| Ferumoxides (AMI-24 AMI-25), endorem, feridex | SPION (120–180 nm) + dextran coating (ref. 66) | 10 min (ref. 65) | 24 (ref. 68 and 73) | 100–160 (ref. 72 and 73) | Negative | 30 μmol Fe kg−1 (ref. 66) | Liver/spleen I (ref. 69) |
| Ferucarbotran SHU555A, Resovist/Cliavist | SPION (60–80 nm) + carboxy-dextran coating (ref. 66) | 12 min (ref. 65) | 25 (ref. 68 and 73) | 164–177 (ref. 72 and 73) | Negative | 8–12 μmol Fe kg−1 (ref. 66) | Liver/spleen IV (ref. 68 and 69) |
| Ferumoxtran-10 AMI-227, Sinerem Combidex | USPIO (30 nm) + dextran coating (ref. 66) | 24–30 h (ref. 65) | 22 (ref. 68 and 73) | 44–85 (ref. 72 and 73) | Positive or negative | 45 μmol Fe kg−1 (ref. 66) | Lymph node bone marrow IV (ref. 68 and 69) |
| Ferucarbotran SHU555C, Supravist | USPIO (20–25 nm) + carboxy-dextran coating (ref. 66) | 6–8 h (ref. 65) | 7 (ref. 68) | 57 (ref. 68) | Positive | 40 μmol Fe kg−1 (ref. 66) | Perfusion lymph node bone marrow IV (ref. 68 and 69) |
| Feruglose NC100250, Clariscan | USPIO (10–20 nm) + carbohydrate-polyethylene glycol (ref. 66) | 2 h (ref. 65) | 20 (ref. 68) | 35 (ref. 68) | Positive | 36 μmol Fe kg−1 (ref. 66) | Perfusion angiography IV (ref. 68 and 69) |
| Ferumoxytol AMI-7228, Feraheme | USPIO (3 nm) + carboxy-methyldextran (ref. 67) | 14 h (ref. 65) | 15 (ref. 71) | 89 (ref. 71) | Positive | 50–400 mg per patient (ref. 71) | Angiography IV (ref. 68 and 70) |
| AMI-121 Lumirem and Gastromark | SPION (300 nm) + silica coating (ref. 74) | NA | 3 (ref. 68) | 72 (ref. 68) | Negative | 105 mg per patient (ref. 74) | GI oral (ref. 74, 69 and 31) |
The commercialization of most IONP mentioned in Table 2 has stopped for the following reasons.33 First, IONP are often eliminated in blood where they are captured by macrophages, making the targeting of specific organs by IONP a difficult task. Second, IONP can result in the formation of artifacts/black holes, which can prevent the realization of a detailed image of anatomical/tissular structures. Third, a quantity/concentration of IONP can't be deduced from an MRI image since IONP only indirectly affect an MRI image. Fourth, most IONP are T2 contrast agents, which are not favored by clinicians due to their darkening contrasting effect on an MRI image.
MPI (magnetic particle imaging)
Magnetic particle imaging (MPI)34,35 is a new appealing imaging technique, which relies on the application of two types magnetic fields. A first magnetic field gradient results in the formation of a first region where the strength of the magnetic field is sufficiently high to saturate IONP magnetic moments and align them parallel to the applied magnetic field, and a second region, also called field free point (FFP), where the magnetic field strength is zero, and IONP magnetic moments are randomly oriented. When IONP located in the FFP are exposed to a second oscillating magnetic field of strength 10–100 mT and frequency 10–100 KHz,36 their magnetization oscillates with time, leading to an electromagnetic signal, which is detected and further converted into an MPI image. As for MRI, the quality of MPI imaging depends on IONP properties, such as IONP size, leading to an increase in spatial resolution by a factor 4 using IONP of 20 nm compared with Resovist of 45–60 nm. Several applications of IONP in MPI have been suggested such as:
• Cell concentration measurement, i.e. it is possible to obtain a relation between the MPI signal and the cellular concentration,37 with a high resolution, down to ∼250 cells and 7.8 ng of Fe. It however necessitates knowing on the one hand the quantity of IONP internalized in each cell and on the other hand how IONP internalization affects MPI signal. Whereas the quantity of IONP nanoparticles internalized in each cell can easily be determined in vitro, it seems more difficult to evaluate it in vivo without extracting a tissue sample from the organism for analysis, restricting the use of this method. In addition, whereas the MPI signal of some IONP is relatively independent of their environment and of the fact that they are internalized or not, due to a minor Brownian contribution to their MPI signal, other IONP display a MPI signal that strongly depends on IONP environment,38 making the judicious choice of IONP crucial for accurate MPI measurement.
• Imaging of several different types of IONP, since IONP with different sizes yield different MPI signals. This can enable the detection of various biological entities if each IONP of different size targets a different entity.39
• Measurement of blood flux, which can on the one hand enable evaluating the displacement speed of IONP in blood by MPI and on the other hand certain specific blood trajectory such as that resulting from bleeding, i.e. IONP leakage outside of blood vessels.40
• Imaging of some organs or tissues (tumors), which are either targeted by IONP following different targeting methods, i.e. passive through the EPR effect, magnetic via the application of a magnetic field gradient, or active using an antibody bound to IONP that targets a specific cell receptor, or directly injected with IONP, yielding imaging of organ, e.g. lung41 or brain,42 or vasculature,37 imaging without facing the same hurdle as in MRI in which IONP can leads to a hypo-intense signal that is similar to that of air inside lung.
• MPI combined with MHT, which can be foreseen since the properties of the applied oscillating magnetic field (strength and frequency) are similar in MPI and MHT (magnetic hyperthermia), possibly enabling combining imaging and therapeutic methods with IONP.18
MPI present a series of advantages such as: (i) a high penetration depth due to a theoretical unlimited propagation of the magnetic field, (ii) a direct measurement of IONP concentration, (iii) a positive contrast, (iv) an operating mechanism that does not rely on the use of toxic radiations, (v) a signal that should not be strongly affected by background tissue, (vi) a signal that can be acquired quickly in a spatially selective manner, (vii) a high resolution (sub-mm). However, MPI also suffers from a series of drawbacks such as: (i) the absence of anatomic imaging (MPI only images IONP), (ii) possible formation of eddy currents that can yield overheating if the strength/frequency of the oscillating magnetic field is too high, (iii) the necessity to use IONP whose magnetic moment couples with the external oscillating magnetic field without depending on IONP environment, (iv) the absence of a MPI equipment that can be used in the clinic.
Photo-acoustic imaging (PAI)
The mechanism of photo-acoustic imaging relies on the excitation of a tissue with a nanosecond pulsed laser of 680–970 nm emission wavelength, 10 Hz frequency, and 10–100 mJ cm−2 power, resulting in a slight temperature increase and thermo-elastic expansion of the tissue, which further generates an acoustic wave that provides an image of tissue following detection and processing of the signal by an echograph of typical ultrasound frequency 5–50 MHz.43–45 Chromophores such as melanin and hemoglobin that are strong optical absorbers can act as intrinsic PAI contrast agents. However, in some cases they are not available, e.g. in some cancer cells, then requiring the use of other extrinsic PAI contrast agents such as IONP. IONP can behave as PAI contrast agents without the presence of another substance. In this case, the coupling mechanism between the incident laser light and IONP can involve surface plasmon waves.46 IONP can also be conjugated to a fluorophore such as Indocyanine Green,21 which enhance laser light absorption. An important number of applications of PAI has been described,45 such as the imaging of certain cancers (breast, prostate, bladder, melanoma, ovarian), lymph nodes possibly containing metastasis, circulating tumor cells, as well as neonatal brain, gastrointestinal, thyroid, or intra-operative imaging. PAI displays a number of advantages such as: (i) an operating mechanism that does not use radiation, (ii) fast imaging acquisition, i.e. typically less than 1 minute,47 (iii) a relatively good resolution, e.g. ∼0.5 mm was reached for breast imaging,48 which can be increased by increasing the ultrasound frequency, (iv) the relatively large area that can be covered with one scan, e.g. a surface of 10–50 cm2 of a breast tumor can be imaged,48 (v) the possibility to obtain functional information derived from a variation in hemoglobin or melanin concentration, (vi) the ability to combine PAI with other imaging techniques such as MRI or CT. However, this technique also suffers from a relatively low penetration depth (typically of the order of a few cm), which is due to the use of laser light and to the ultrasound frequency when it is too high, and to a too small number of PAI equipment that can be used in the clinic. As an example, the Twente Photoacoustic Mammoscope (PAM) was built at the University of Twente (Enschede, the Netherlands) to image breast tumor cells in the clinic, but this type of equipment remains a prototype.49 It needs to be more widely developed and made available in different hospitals to spread out the use of the PAI imaging technique.
Scanner, computing tomography (CT)
X-ray scanners, also designated as computing tomography (CT), expose patients to an X-ray beam, resulting in a non-uniform absorption of X-rays by the patients, i.e. the absorption is different parts for various parts of the organism depending on their consistency (Z-number). Then the transmitted (non-absorbed) X-rays are detected, providing an image of these different parts with various contrasts. In fact, the interaction between X-rays and the organism is due to the photo-electric effect, whose strength is mainly proportional to Z3 (Z: atomic number), and Compton scattering, which is enhanced at high electron and mass density.50 The unit of attenuation measurement obtained in CT is Hounsfield unit (HU), leading to low CT number (HU value) for weakly absorbing material (−1000 HU for air and 0 HU for water), to intermediate HU values for slightly absorbing material (40 to 80 HU for tissue), and to larger HU values for stronger absorbing material (400 to 1000 HU for bone).51 Substances with high HU values (strongly attenuating X-ray) appear white or light gray, while those with low HU values (weakly attenuating X-ray) appear dark gray or black. The photoelectric and Compton effects suggest that material with high Z and large mass density would be the best contrast agent. Although the Z value of iron, i.e. 26, and the density of maghemite comprised in most IONP for medical application, i.e. 5 g cm−3, are not the largest values that can be reached with nanomaterials, and are larger than those of water (Z = 1 for hydrogen, and Z = 8 for oxygen, r = 1 g cm−3 for water) that constitutes the majority of organic living material, they seem sufficient to provide. They seem are sufficient to provide a contrast with CT. Indeed, IONP were shown to act as CT contrast agent, leading to CT number that increases with increasing IONP concentration, i.e. from 27 HU at 2.5 mg mL−1 of IONP to 113 HU at 25 mg mL−1 of IONP.52 However, compared with iodine, IONP were shown to absorb ∼5–6 times less X-ray.52 The advantages of CT lie in: (i) the acquisition of large scans (typically 10–20 cm) quickly (under 5 seconds) with image reconstruction within less than one minute, (ii) its non-invasiveness, (iii) high contrast resolution, (iv) no depth penetration limit, (v) a relatively low cost, (vi) quantitative information on contrast agents can be obtained, (vii) its wide availability in hospitals. Disadvantages of CT come from: (i) its low sensitivity compared with other imaging techniques, i.e. CT detection limit is ∼10−3 M,51 compared with 10−5 M for Gd chelates in MRI and 10−9 M for nuclear techniques about,51 (ii) the exposure of patient to relatively high dose of ionizing radiation, (iii) limited soft tissue resolution.
Positron emission tomography (PET)/single photon emission computed tomography (SPECT)
The mechanism of PET and SPECT relies on the use of a radio-tracer, which targets a specific part of the organism such as a tumor, then emits a signal made of positrons (PET) or gamma rays (SPECT) that is measured, hence enabling the detection of this part of the organism. PET and SPECT are functional imaging methods mimicking a substance of interest such as glucose for 18F-FDG, which gets fixed on a specific tissue, e.g. a tumor in case of 18F-FDG that consumes more glucose than a healthy tissue.53 Using IONP, it was possible to bring several improvement to the standard PET/SPECT imaging method by: (i) binding different radio-tracers to IONP [18F]fluorodeoxyglucose (FDG), copper-61/64, gallium-66/68, zirconium-89, and iodine-124 for PET,54 and 99mTc, 125I, 111I, 125I and 131I for SPECT,54–56 that increase radio-tracer lifetime and targeting efficacy,55 (ii) enabling simultaneous anatomical and functional imaging by combining PET/SPEC with MRI, taking advantage of the MRI contrasting ability of IONP, (iii) enlarging the SPECT/PET imaging capacity to a therapeutic activity through the use of a theranostic IONP probe that can trigger drugs delivery, immunotherapy, hyperthermia, or photodynamic therapy.19,57 In addition, PET/SPECT lead to high detection sensitivity, e.g. PET was shown to be 200 times more sensitive than MRI using nanoparticles, the possibility to image the whole organism without limitation in depth of penetration, and the acquisition of quantitative information since in optimal operating conditions PET/SPECT signal should be proportional to the number/concentration of radiotracer in the targeted region.54 For these reasons, the development of PET/SPECT can be foreseen in various medical fields such as disease detection or the assessment of the efficacy of a medical treatment.
Ultrasound imaging/sonography
It was reported that IONP could be used in ultrasound (sonography) imaging. On the one hand, IONP could be inserted within a material that is already an ultrasound contrast agent such as a micro-bubble or liposomes, then enabling a combination between USI and another imaging modality such as MRI that is made possible by the presence of IONP.58 On the other hand, although a direct detection of IONP by ultrasound was not reported to the author knowledge, IONP presence could be detected indirectly by measuring tissue resistance resulting from IONP motion/vibration under the application of a high intensity pulsed magnetic field through a technique cold magneto-motive ultrasound whose efficacy essentially depends on IONP susceptibility and could be combined with ultrasound imaging to provide both anatomical tissue information and estimate the quantity of IONP or photo-acoustic imaging to improve the resolution of PAI imaging. Magneto-motive approaches could be used to carry out dynamic imaging, i.e. imaging of moving biological systems, such as circulating tumor cells, metastases diffusing in/out of lymph nodes or stem cells, to determine viscoelastic property of soft tissues, and could easily be combined with other imaging modalities.59
Optical imaging methods
Optical imaging can be carried out with IONP-fluorophore complexes, essentially using NIR fluorophores such as organic fluorochromes, e.g. cyanine dyes such as Cy5.5. Such complexes are either made of IONP surrounded by various coatings such as silica shell, spacer, lipid bilayer, polymer, which contain or are labeled with fluorophores or of IONP directly coated with a fluorescent semiconducting material. Such methods present the advantages of being relatively easy to implement, of yielding under optimized conditions a high spatial/temporal resolution, and of being complementary to other imaging techniques such as MRI. In order for this method to be efficient, absorption by the organism/tissue/water/hemoglobin/melanin/proteins that occurs between 200 and 650 nm shall be avoided by choosing fluorescent probes with absorption/emission within the range of 650–1450 nm. Furthermore, fluorophores should not be prone to photo-bleaching, not be quenched by iron oxide, be stable in biological media, i.e. have a long life-time in such environment, and display well-separated emission and absorption spectra to be to distinguishable them. The use of this method is facilitated by the existence of numerous systems that can excite/detect fluorescence in different conditions, i.e. in real time, in vitro, in vivo, such as: optical scanners, e.g. fluorescence mediated tomography, fluorescence reflectance tomography, optical coherence tomography, a large number of fluorescence microscopies, flow cytometry, spectrophotometry, intra-vital microscopy, intravascular non-invasive near-infrared (NIRF) imaging, clinical endoscopy, and equipment for fluorescence detection during surgery. Such method can be used for monitoring magnetofection efficacy,60 for multi-modal imaging with MPI, MRI and PAI,61,62 for detecting various biological entities such as tumors,16,56 apoptotic cells,7 and sentinel lymph nodes,4 and for delineating infiltrating tumors such as glioblastoma.63
Multimodal imaging
Since IONP can be used with various imaging methods, they could be considered for multimodal imaging. The latter presents the advantage of enabling the combination of information coming from different imaging methods.64 For example, in PET/MRI, MRI is used for anatomical imaging while PET offers molecular information.
Conclusion/perspectives
From the author's point of view, the challenges ahead lie in:
• Improving both IONP (better targeting, size control, fabrication process) and imaging methods (better resolution, miniaturization, lower cost, more limited use of hospital infrastructure);
• Yielding a sufficiently large percentage of IONP in the organ of interest so that IONP can act as contrast agents;
• Developing a single imaging method that brings together the maximum benefit of the different imaging techniques with the minimum of their drawbacks;
• Building a device/platform that gathers all the different imaging techniques in one unit;
• Identifying the specific medical need upstream and then providing the imaging method best suited to this need, an approach that seems appropriate when medical needs remain globally unchanged, which may be the case within a limited time period in specialized hospital units.
• IONP present the advantage of being compatible and even improving a large series of different imaging techniques, making them appealing for multimodal imaging.64
Abbreviations
- BBB
Blood brain barrier
- CA
Contrast agent
- CT
Computing tomography
- IONP
Iron oxide nanoparticles
- MRI
Magnetic resonance imaging
- MPI
Magnetic particle imaging
- MPH/MHT
Magnetic particle hyperthermia
- MPS
Mononuclear phagocytic system
- MS
Multiple sclerosis
- OI
Optical imaging
- PAI
Photo-acoustic imaging
- ROS
Radical oxygen species
- US
Ultrasounds
- USI
Ultrasound imaging (sonography)
Conflicts of interest
EA has been working in the company Nanobacterie.
Supplementary Material
Acknowledgments
I would like to thank the BPI (‘banque publique d'investissement, France’), the region of Paris (‘Parris Région Entreprise, France’), the French Research Tax Credit program (‘crédit d'impôt recherche’), the incubator Paris Biotech Santé, the ANRT (CIFRE 2014/0359, CIFRE 2016/0747, CIFRE 2013/0364, CIFRE 2015/976), the Eurostars programs (Nanoneck-2 E9309 and Nanoglioma E11778), the AIR program (‘aide à l'innovation responsable’) from the region of Paris (A1401025Q), the ANR (‘Agence Nationale de la Recherche’) Méfisto, as well as the Universities Paris 6 and Paris 11. We also would like to thank the Nomis Foundation and Markus Reinhard for their support.
References
- Lu J. Sun J. Li F. Wang J. Kim D. Fan C. Hyeon T. Ling D. Highly Sensitive Diagnosis of Small Hepatocellular Carcinoma Using pH-Responsive Iron Oxide Nanocluster Assemblies. J. Am. Chem. Soc. 2018;140:10071–10074. doi: 10.1021/jacs.8b04169. [DOI] [PubMed] [Google Scholar]
- El-Boubbou K. Magnetic iron oxide nanoparticles as drug carriers: preparation conjugation and delivery. Nanomedicine. 2018;13:929–952. doi: 10.2217/nnm-2017-0320. [DOI] [PubMed] [Google Scholar]
- Clauson R. M. Chen M. Scheetz L. M. Berg B. Chertok B. Size-Controlled Iron Oxide Nanoplatforms with Lipidoid-Stabilized Shells for Efficient Magnetic Resonance Imaging-Trackable Lymph Node Targeting and High-Capacity Biomolecule Display. ACS Appl. Mater. Interfaces. 2018;10:20281–20295. doi: 10.1021/acsami.8b02830. [DOI] [PubMed] [Google Scholar]
- Mehralivand S. Van der Poel H. Winter A. Choyke P. L. Pinto P. A. Turkbey B. Sentinel lymph node imaging in urologic oncology. Transl. Androl. Urol. 2018;7:887–902. doi: 10.21037/tau.2018.08.23. [DOI] [PMC free article] [PubMed] [Google Scholar]
- Dadfar S. M. Roemhild K. Drude N. I. Von Stillfried S. Knüchel R. Kiessling F. Lammers T. Iron oxide nanoparticles: Diagnostic, therapeutic and theranostic applications. Adv. Drug Delivery Rev. 2019;138:302–325. doi: 10.1016/j.addr.2019.01.005. [DOI] [PMC free article] [PubMed] [Google Scholar]
- Hu Y. Mignani S. Majoral J.-P. Shen M. Shi W. Construction of iron oxide nanoparticle-based hybrid platforms for tumor imaging and therapy. Chem. Soc. Rev. 2018;47:1874–1900. doi: 10.1039/C7CS00657H. [DOI] [PubMed] [Google Scholar]
- Mekawya M. M. Saito A. Sumiyoshic A. Riera J. J. Shimizud H. Kawashima R. Tominagaa T. Hybrid magneto-fluorescent nano-probe for live apoptotic cells monitoring at brain cerebral ischemia. Mater. Sci. Eng., C. 2019;100:485–492. doi: 10.1016/j.msec.2019.03.032. [DOI] [PubMed] [Google Scholar]
- Hedgire S. Krebill C. Wojtkiewicz G. R. Oliveira I. Ghoshhajra B. B. Hoffmann U. Harisinghani M. G. Ultrasmall superparamagnetic iron oxide nanoparticle uptake as noninvasive marker of aortic wall inflammation on MRI: proof of concept study. Br. J. Radiol. 2018;1092:20180461. doi: 10.1259/bjr.20180461. [DOI] [PMC free article] [PubMed] [Google Scholar]
- Cai Y. Wang Y. Xu H. Cao C. Zhu R. Tang X. Zhang T. Pan Y. Positive magnetic resonance angiography using ultrafine ferritin-based iron oxide nanoparticles. Nanoscale. 2019;11:2644–2654. doi: 10.1039/C8NR06812G. [DOI] [PubMed] [Google Scholar]
- Chan J. M. S. Monaco C. Wylezinska-Arridge M. Tremoleda J. L. Cole J. E. Goddard M. Cheung M. S. H. Bhakoo K. K. Gibbs R. G. J. Imaging vulnerable plaques by targeting inflammation in atherosclerosis using fluorescent-labeled dual-ligand microparticles of iron oxide and magnetic resonance imaging. J. Vasc. Surg. 2018;67:1571–1548e3. doi: 10.1016/j.jvs.2017.04.046. [DOI] [PubMed] [Google Scholar]
- Ivask A. Pilkington E. H. Blin T. Käkinen A. Vija H. Visnapuu M. Quinn J. F. Whittaker M. R. Qiao R. Davis T. P. Ke P. C. Voelcker N. H. Uptake and transcytosis of functionalized superparamagnetic iron oxide nanoparticles in an in vitro blood brain barrier model. Biomater. Sci. 2018;6:314–323. doi: 10.1039/C7BM01012E. [DOI] [PubMed] [Google Scholar]
- Lehrman E. D. Plotnik A. N. Hope T. Saloner D. Ferumoxytol-enhanced MRI in the peripheral vasculature. Clin. Radiol. 2019;74:37–50. doi: 10.1016/j.crad.2018.02.021. [DOI] [PMC free article] [PubMed] [Google Scholar]
- Arami H. Khandhar A. P. Tomitaka A. Yu E. Goodwill P. W. Conolly S. M. Krishnan K. M. In vivo multimodal magnetic particle imaging (MPI) with tailored magneto/optical contrast agents. Biomaterials. 2015;52:251–261. doi: 10.1016/j.biomaterials.2015.02.040. [DOI] [PMC free article] [PubMed] [Google Scholar]
- Shin T. H. Choi Y. Kim S. Shin J. C. Recent advances in magnetic nanoparticle-based multi-modal imaging. Chem. Soc. Rev. 2015;44:4501–4516. doi: 10.1039/C4CS00345D. [DOI] [PubMed] [Google Scholar]
- Alphandéry E. Biodistribution and targeting properties of iron oxide nanoparticles for treatments of cancer and iron anemia disease. Nanotoxicology. 2019;13:573–596. doi: 10.1080/17435390.2019.1572809. [DOI] [PubMed] [Google Scholar]
- Song C. Sun W. Xiao Y. Shi X. Ultrasmall iron oxide nanoparticles: synthesis, surface modification, assembly, and biomedical applications. Drug Discovery Today. 2019;24:835–844. doi: 10.1016/j.drudis.2019.01.001. [DOI] [PubMed] [Google Scholar]
- Bonvin D. Alexander D. T. L. Millán A. Piñol R. Sanz B. Goya G. F. Martínez A. Bastiaansen J. A. M. Stuber M. Schenk K. J. Hofmann H. Ebersold M. M. Tuning Properties of Iron Oxide Nanoparticles in Aqueous Synthesis without Ligands to Improve MRI Relaxivity and SAR. Nanomaterials. 2017;7:225. doi: 10.3390/nano7080225. [DOI] [PMC free article] [PubMed] [Google Scholar]
- Tay Z. W. Chandrasekharan P. Chiu-Lam A. Hensley D. W. Dhavalikar R. Zhou X. Y. Yu E. Y. Goodwill P. W. Zheng B. Rinaldi C. Conolly S. M. Magnetic Particle Imaging-Guided Heating in vivo Using Gradient Fields for Arbitrary Localization of Magnetic Hyperthermia Therapy. ACS Nano. 2018;12:3699–3713. doi: 10.1021/acsnano.8b00893. [DOI] [PMC free article] [PubMed] [Google Scholar]
- Vallabani N. V. S. Singh S. Recent advances and future prospects of iron oxide nanoparticles in biomedicine and diagnostics. 3 Biotech. 2018;8:279. doi: 10.1007/s13205-018-1286-z. [DOI] [PMC free article] [PubMed] [Google Scholar]
- Yuan H. Wilks M. Q. Normandin M. D. Fakhri G. E. Kaittanis C. Josephson L. Heat-induced radiolabeling and fluorescence labeling of Feraheme nanoparticles for PET/SPECT imaging and flow cytometry. Nat. Protoc. 2018;13:392–412. doi: 10.1038/nprot.2017.133. [DOI] [PMC free article] [PubMed] [Google Scholar]
- Wang H. Li X. Tse B. W. C. Yang Y. Thorling C. A. Liu Y. Touraud M. Chouane J. B. Liu X. Roberts M. S. Liang X. Indocyanine green-incorporating nanoparticles for cancer theranostics. Theranostics. 2018;8:1227–1242. doi: 10.7150/thno.22872. [DOI] [PMC free article] [PubMed] [Google Scholar]
- Shen Z. Wu A. Chen X. Iron Oxide Nanoparticle Based Contrast Agents for Magnetic Resonance Imaging. Mol. Pharmaceutics. 2017;14:1352–1364. doi: 10.1021/acs.molpharmaceut.6b00839. [DOI] [PubMed] [Google Scholar]
- Fernández-Barahona I. Muñoz-Hernando M. Herranz F. Microwave-Driven Synthesis of Iron-Oxide Nanoparticles for Molecular Imaging. Molecules. 2019;24:1224. doi: 10.3390/molecules24071224. doi: 10.3390/molecules24071224. [DOI] [PMC free article] [PubMed] [Google Scholar]
- Dulinska-Litewka J. Łazarczyk A. Hałubiec P. Szafranski O. Karnas K. Karewicz A. Superparamagnetic Iron Oxide Nanoparticles—Current and Prospective Medical Applications. Materials. 2019;12:617. doi: 10.3390/ma12040617. doi: 10.3390/ma12040617. [DOI] [PMC free article] [PubMed] [Google Scholar]
- Song C. Sun W. Xiao Y. Shi X. Ultrasmall iron oxide nanoparticles: synthesis, surface modification, assembly, and biomedical applications. Drug Discovery Today. 2019;24:835–844. doi: 10.1016/j.drudis.2019.01.001. [DOI] [PubMed] [Google Scholar]
- Zhang W. Liu L. Chen H. Hu K. Delahunty I. Gao S. Xie J. Surface impact on nanoparticle-based magnetic resonance imaging contrast agents. Theranostics. 2018;8:2521–2548. doi: 10.7150/thno.23789. [DOI] [PMC free article] [PubMed] [Google Scholar]
- Zhou Z. Yang L. Gao J. Chen X. Structure–Relaxivity Relationships of Magnetic Nanoparticles for Magnetic Resonance Imaging. Adv. Mater. 2019;31:1804567. doi: 10.1002/adma.201804567. [DOI] [PMC free article] [PubMed] [Google Scholar]
- Blanco-Andujar C. Walter A. Cotin G. Bordeianu C. Mertz D. Felder-Flesch D. Begin-Colin S. Design of iron oxide-based nanoparticles for MRI and magnetic hyperthermia. Nanomedicine. 2019;11:1889–1910. doi: 10.2217/nnm-2016-5001. [DOI] [PubMed] [Google Scholar]
- Stephen Z. R. Kievit F. M. Zhang M. Magnetite Nanoparticles for Medical MR Imaging. Mater. Today. 2011;14:330–338. doi: 10.1016/S1369-7021(11)70163-8. [DOI] [PMC free article] [PubMed] [Google Scholar]
- Dinniwell R. Chan P. Czarnota G. et al., Pelvic lymph node topography for radiotherapy treatment planning from ferumoxtran-10 contrast-enhanced magnetic resonance imaging. Int. J. Radiat. Oncol., Biol., Phys. 2009;74:844–851. doi: 10.1016/j.ijrobp.2008.09.026. [DOI] [PubMed] [Google Scholar]
- Stoumpos S. Hennessy M. Vesey A. T. Radjenovic A. Kasthuri R. Kingsmore D. B. Mark P. B. Roditi G. Ferumoxytol magnetic resonance angiography: a dose-finding study in patients with chronic kidney disease. Eur. J. Radiol. 2019;29:3543–3552. doi: 10.1007/s00330-019-06137-4. [DOI] [PMC free article] [PubMed] [Google Scholar]
- Xiáng Y. Wáng J. Idée J.-M. A comprehensive literatures update of clinical researches of superparamagnetic resonance iron oxide nanoparticles for magnetic resonance imaging. Quant. Imaging Med. Surg. 2017;7:88–122. doi: 10.21037/qims.2017.02.09. [DOI] [PMC free article] [PubMed] [Google Scholar]
- Tong S. Zhu H. Bao G. Magnetic iron oxide nanoparticles for disease detection and therapy. Mater. Today. 2019 doi: 10.1016/j.mattod.2019.06.003. [DOI] [PMC free article] [PubMed] [Google Scholar]
- Bulte J. W. M. Superparamagnetic iron oxides as MPI tracers: A primer and review of early applications. Adv. Drug Delivery Rev. 2019;138:293–301. doi: 10.1016/j.addr.2018.12.007. [DOI] [PMC free article] [PubMed] [Google Scholar]
- Panagiotopoulos N. Duschka R. L. Ahlborg M. Bringout G. Debbeler C. Graeser M. Kaethner M. Lüdtke-Buzug K. Medimagh H. Stelzner J. Buzug T. M. Barkhausen J. Vogt F. M. Haegele J. Magnetic particle imaging: current developments and future directions. Int. J. Nanomed. 2015;10:3097–3114. doi: 10.2147/IJN.S70488. [DOI] [PMC free article] [PubMed] [Google Scholar]
- Meola A. Rao J. Chaudhary N. Song G. Zheng X. Chang S. D. Magnetic Particle Imaging in Neurosurgery. 2019;125:261–270. doi: 10.1016/j.wneu.2019.01.180. [DOI] [PubMed] [Google Scholar]
- Zhou X. Y. Tay Z. W. Chandrasekharan P. Yu E. Y. Hensley D. W. Orendorff R. Jeffris K. E. Mai D. Zheng B. Goodwill P. W. Conolly S. M. Magnetic particle imaging for radiation-free, sensitive and high-contrast vascular imaging and cell tracking. Curr. Opin. Chem. Biol. 2018;45:131–138. doi: 10.1016/j.cbpa.2018.04.014. [DOI] [PMC free article] [PubMed] [Google Scholar]
- Arami H. Ferguson R. M. Khandhar A. P. Krishnan K. M. Size-dependent ferrohydrodynamic relaxometry of magnetic particle imaging tracers in different environments. Med. Phys. 2013;40:071904. doi: 10.1118/1.4810962. [DOI] [PMC free article] [PubMed] [Google Scholar]
- Kratz H. Taupitz M. de Schellenberger A. A. Kosch O. Eberbeck D. Wagner S. Trahms L. Hamm B. Schnorr J. Novel magnetic multicore nanoparticles designed for MPI and other biomedical applications: from synthesis to first in vivo studies. PLoS One. 2018;13:e0190214. doi: 10.1371/journal.pone.0190214. [DOI] [PMC free article] [PubMed] [Google Scholar]
- Kaul M. G. Salamon J. Knopp T. Ittrich H. Adam G. Weller H. Wegner C. J. Magnetic particle imaging for in vivo blood flow velocity measurements in mice. Phys. Med. Biol. 2018;63:064001. doi: 10.1088/1361-6560/aab136. [DOI] [PubMed] [Google Scholar]
- Wegner F. Buzug T. M. Barkhausen J. Take a Deep Breath–Monitoring of Inhaled Nanoparticles with Magnetic Particle Imaging. Theranostics. 2018;8:3691–3692. doi: 10.7150/thno.27454. [DOI] [PMC free article] [PubMed] [Google Scholar]
- Wu L. C. Zhang Y. Steinberg G. Qu H. Huang S. Cheng M. Bliss T. Du F. Rao J. Song G. Pisani L. Doyle T. Conolly S. Krishnan K. Grant G. Wintermark M. A Review of Magnetic Particle Imaging and Perspectives on Neuroimaging. Am. J. Neuroradiol. 2019;40:206–212. doi: 10.3174/ajnr.A5896. [DOI] [PMC free article] [PubMed] [Google Scholar]
- Armanetti P. Flori A. Avigoa C. Conti L. Valtancoli B. Petroni D. Doumett S. Cappiello L. Ravagli C. Baldi G. Bencini A. Menichetti L. Spectroscopic and photoacoustic characterization of encapsulated iron oxide super-paramagnetic nanoparticles as a new multiplatform contrast agent. Spectrochim. Acta, Part A. 2018;199:248–253. doi: 10.1016/j.saa.2018.03.025. [DOI] [PubMed] [Google Scholar]
- Thawani J. P. Amirshaghaghi A. Yan L. Stein J. M. Liu J. Tsourkas A. Photoacoustic-Guided Surgery with Indocyanine Green-Coated Superparamagnetic Iron Oxide Nanoparticle Clusters. Small. 2017;13:1701300. doi: 10.1002/smll.201701300. [DOI] [PMC free article] [PubMed] [Google Scholar]
- Zackrisson S. van de Ven S. M. W. Y. Gambhir S. S. Light In and Sound Out: Emerging Translational Strategies for Photoacoustic Imaging. Cancer Res. 2014;74:979–1004. doi: 10.1158/0008-5472.CAN-13-2387. [DOI] [PMC free article] [PubMed] [Google Scholar]
- Chen H. Yuan Z. Wu C. Nanoparticle Probes for Structural and Functional Photoacoustic Molecular Tomography. BioMed Res. Int. 2015;2015:757101. doi: 10.1155/2015/757101. [DOI] [PMC free article] [PubMed] [Google Scholar]
- Beard P. Biomedical photoacoustic imaging. Interface Focus. 2011;1:602–631. doi: 10.1098/rsfs.2011.0028. [DOI] [PMC free article] [PubMed] [Google Scholar]
- Manohar S. Dantuma M. Current and Future Trends in Photoacoustic Breast Imaging. Photoacoustics. 2019 doi: 10.1016/j.pacs.2019.04.004. [DOI] [PMC free article] [PubMed] [Google Scholar]
- Valluru K. S. Wilson K. E. Willmann J. K. Photoacoustic Imaging in Oncology: Translational Preclinical and Early Clinical Experience. Radiology. 2016;280:332–349. doi: 10.1148/radiol.16151414. [DOI] [PMC free article] [PubMed] [Google Scholar]
- Kim J. Chhour P. Hsu J. Litt H. I. Ferrari V. A. Popovtzer R. Cormode D. P. Use of Nanoparticle Contrast Agents for Cell Tracking with Computed Tomography. Bioconjugate Chem. 2017;28:1581–1597. doi: 10.1021/acs.bioconjchem.7b00194. [DOI] [PMC free article] [PubMed] [Google Scholar]
- Cormode D. P. Naha P. C. Fayad Z. A. Nanoparticle Contrast Agents for Computed Tomography: A Focus on Micelles. Contrast Media Mol. Imaging. 2014;9:37–52. doi: 10.1002/cmmi.1551. [DOI] [PMC free article] [PubMed] [Google Scholar]
- Goel S. England C. G. Chen F. Cai W. Positron Emission Tomography and Nanotechnology: A Dynamic Duo for Cancer Theranostics. Adv. Drug Delivery Rev. 2017;113:157–176. doi: 10.1016/j.addr.2016.08.001. [DOI] [PMC free article] [PubMed] [Google Scholar]
- Dias A. L. Kunzel R. Levenhagen R. S. Okuno E. Application of computed tomography images in the evaluation of magnetic nanoparticles biodistribution. J. Magn. Magn. Mater. 2010;322:2405–2407. doi: 10.1016/j.jmmm.2010.02.046. [DOI] [Google Scholar]
- Ai F. Ferreira A. Chen F. Cai W. Engineering of Radiolabeled Iron Oxide Nanoparticles for Dual-Modality Imaging. Wiley Interdiscip. Rev.: Nanomed. Nanobiotechnol. 2016;8:619–630. doi: 10.1002/wnan.1386. [DOI] [PMC free article] [PubMed] [Google Scholar]
- Pellico J. Llop J. Fernández-Barahona I. Bhavesh R. Ruiz-Cabello J. Herranz F. Iron Oxide Nanoradiomaterials: Combining Nanoscale Properties with Radioisotopes for Enhanced Molecular Imaging. Contrast Media Mol. Imaging. 2017;2017:1549580. doi: 10.1155/2017/1549580. [DOI] [PMC free article] [PubMed] [Google Scholar]
- De Simone M. Panetta D. Bramanti E. Giordano C. Salvatici M. C. Gherardinia L. Menciassie A. Burchiellif S. Cintia C. Salvadoria P. A. Magnetically driven nanoparticles: 18FDGradiolabelling and positron emission tomography biodistribution study. Contrast Media Mol. Imaging. 2016;11:561–571. doi: 10.1002/cmmi.1718. [DOI] [PubMed] [Google Scholar]
- Revia R. A. Zhang M. Magnetite nanoparticles for cancer diagnosis, treatment, and treatment monitoring: recent advances. Mater. Today. 2016;19:157–158. doi: 10.1016/j.mattod.2015.08.022. [DOI] [PMC free article] [PubMed] [Google Scholar]
- Qian X. Han X. Chen Y. Insights into the unique functionality of inorganic micro/nanoparticles for versatile ultrasound theranostics. Biomaterials. 2017;142:13–30. doi: 10.1016/j.biomaterials.2017.07.016. [DOI] [PubMed] [Google Scholar]
- Evertsson M. Kjellman P. Cinthio M. Andersson R. Tran T. A. Zandt R. Grafström G. Toftevall H. Fredriksson S. Ingvar C. Strand S. E. Jansson T. Combined Magnetomotive ultrasound, PET/CT, and MR imaging of 68Ga-labelled superparamagnetic iron oxide nanoparticles in rat sentinel lymph nodes in vivo. Sci. Rep. 2017;7:4824. doi: 10.1038/s41598-017-04396-z. [DOI] [PMC free article] [PubMed] [Google Scholar]
- Zuvin M. Kuruoglu E. Kaya V. O. Unal O. Kutlu O. Acar H. Y. Gozuacik D. Koşar A. Magnetofection of Green Fluorescent Protein Encoding DNA Bearing Polyethyleneimine-Coated Superparamagnetic Iron Oxide Nanoparticles to Human Breast Cancer Cells. ACS Omega. 2019;4:12366–12374. doi: 10.1021/acsomega.9b01000. [DOI] [PMC free article] [PubMed] [Google Scholar]
- Meng L. Ma X. Jiang S. Ji G. Han W. Xu B. Tian J. Tian W. High-efficiency fluorescent and magnetic multimodal probe for long-term monitoring and deep penetration imaging of tumors. J. Mater. Chem. B. 2019;7:5345–5351. doi: 10.1039/C9TB00638A. [DOI] [PubMed] [Google Scholar]
- Song C. Sun W. Xiao Y. Shi X. Ultrasmall iron oxide nanoparticles : synthesis, surface modification, assembly, and biomedical applications. Drug Discovery Today. 2019;24:835–844. doi: 10.1016/j.drudis.2019.01.001. [DOI] [PubMed] [Google Scholar]
- Lee C. Kim G. R. Yoon J. Kim S. E. Yoo J. S. Piao Y. In vivo delineation of glioblastoma by targeting tumor-associated macrophages with near-infrared fluorescent silica coated iron oxide nanoparticles in orthotopic xenografts for surgical guidance. Sci. Rep. 2018;8:11122. doi: 10.1038/s41598-018-29424-4. [DOI] [PMC free article] [PubMed] [Google Scholar]
- Lemaster J. Chen F. Kim T. Hariri A. Jokerst J. V. Development of a Trimodal Contrast Agent for Acoustic and Magnetic Particle Imaging of Stem Cells. ACS Appl. Nano Mater. 2018;1:1321–1331. doi: 10.1021/acsanm.8b00063. [DOI] [PMC free article] [PubMed] [Google Scholar]
- Daldrup-Link H. E. Ten Things You Might Not Know about Iron Oxide Nanoparticles. Radiology. 2017;284:616–629. doi: 10.1148/radiol.2017162759. [DOI] [PMC free article] [PubMed] [Google Scholar]
- Weinstein J. S. Varallyay C. G. Dosa E. Gahramanov S. Hamilton B. Rooney W. D. Muldoon L. L. Neuwelt E. A. Superparamagnetic iron oxide nanoparticles: diagnostic magnetic resonance imaging and potential therapeutic applications in neurooncology and central nervous system inflammatory pathologies, a review. J. Cereb. Blood Flow Metab. 2010;30:15–35. doi: 10.1038/jcbfm.2009.192. [DOI] [PMC free article] [PubMed] [Google Scholar]
- Bullivant J. P. Zhao S. Willenberg B. J. Kozissnik B. Batich C. D. Dobson J. Materials Characterization of Feraheme/Ferumoxytol and Preliminary Evaluation of Its Potential for Magnetic Fluid Hyperthermia. Int. J. Mol. Sci. 2013;14:17501–17510. doi: 10.3390/ijms140917501. [DOI] [PMC free article] [PubMed] [Google Scholar]
- Wang Y. X. J. Hussain S. H. Krestin G. P. Superparamagnetic iron oxide contrast agents: physicochemical characteristics and applications in MR imaging. Eur. Radiol. 2001;11:2319–2331. doi: 10.1007/s003300100908. [DOI] [PubMed] [Google Scholar]
- Lodhia J. Mandarano G. Ferris N. J. Cowell S. F. Development and use of iron oxide nanoparticles (Part 1): Synthesis of iron oxide nanoparticles for MRI. Biomed. Imaging Intervention J. 2010;6(2):e12. doi: 10.2349/biij.6.2.e12. [DOI] [PMC free article] [PubMed] [Google Scholar]
- Toth G. B. Varallyay C. G. Horvath A. et al., Current and Potential Imaging Applications of Ferumoxytol for Magnetic Resonance Imaging. Kidney Int. 2017;92(1):47–66. doi: 10.1016/j.kint.2016.12.037. [DOI] [PMC free article] [PubMed] [Google Scholar]
- Deddens L. H. Van Tilborg G. A. F. Mulder W. J. M. De Vries H. E. Dijkhuizen R. M. Imaging Neuroinflammation after Stroke: Current Status of Cellular and Molecular MRI Strategies. Cerebrovasc. Dis. 2012;33:392–402. doi: 10.1159/000336116. [DOI] [PubMed] [Google Scholar]
- Notice of Lumirem, Guerbet laboratory
- Wang Y. X. Superparamagnetic iron oxide based MRI contrast agents: Current status of clinical application. Quant. Imaging Med. Surg. 2011;1:35–40. doi: 10.3978/j.issn.2223-4292.2011.08.03. [DOI] [PMC free article] [PubMed] [Google Scholar]
- Bertorelle F. Wilhelm C. Roger J. Gazeau F. Ménager C. Cabuil V. Fluorescence-Modified Superparamagnetic Nanoparticles: Intracellular Uptake and Use in Cellular Imaging. Langmuir. 2006;22:5385–5391. doi: 10.1021/la052710u. [DOI] [PubMed] [Google Scholar]
- Varallyay C. G. Nesbit E. Fu R. Gahramanov S. Moloney B. Earl E. Muldoon L. L. Li X. Rooney W. D. Neuwelt E. A. High-resolution steady-state cerebral blood volume maps in patients with central nervous system neoplasms using ferumoxytol, a superparamagnetic iron oxide nanoparticle. J. Cereb. Blood Flow Metab. 2013;33:780–786. doi: 10.1038/jcbfm.2013.36. [DOI] [PMC free article] [PubMed] [Google Scholar]
- Vermeij E. A. Koenders M. I. Bennink M. B. et al., The In-Vivo Use of Superparamagnetic Iron Oxide Nanoparticles to Detect Inflammation Elicits a Cytokine Response but Does Not Aggravate Experimental Arthritis. PLoS One. 2015;10(5):e0126687. doi: 10.1371/journal.pone.0126687. [DOI] [PMC free article] [PubMed] [Google Scholar]
- Chatterjee J. Haik Y. Chen C.-H. Size dependent magnetic properties of iron oxide nanoparticles. J. Magn. Magn. Mater. 2003;257:113–118. doi: 10.1016/S0304-8853(02)01066-1. [DOI] [Google Scholar]
- Feng Q. Liu Y. Huang J. Chen K. Huang J. Xiao K. Uptake, distribution, clearance, and toxicity of iron oxide nanoparticles with different sizes and coatings. Sci. Rep. 2018;8:2082. doi: 10.1038/s41598-018-19628-z. [DOI] [PMC free article] [PubMed] [Google Scholar]
- Li F. Liang Z. Liu J. Sun J. Hu X. et al., Dynamically Reversible Iron Oxide Nanoparticle Assemblies for Targeted Amplification of T1-Weighted Magnetic Resonance Imaging of Tumors. Nano Lett. 2019;19:4213–4220. doi: 10.1021/acs.nanolett.8b04411. [DOI] [PubMed] [Google Scholar]
- Tysiak E. Asbach P. Aktas O. et al., Beyond blood brain barrier breakdown – in vivo detection of occult neuroinflammatory foci by magnetic nanoparticles in high field MRI. J. Neuroinflammation. 2009;6:20. doi: 10.1186/1742-2094-6-20. [DOI] [PMC free article] [PubMed] [Google Scholar]