Abstract
Transforming biological waste into high value-added materials has attracted extensive current research interest in the wastewater treatment field. In this study, oyster shell-derived CaCO3 was used as a solid support to construct efficient Ag/ZnO/CaCO3via Cacumen platycladi extract. As compared to binary Ag/CaCO3 and ZnO/CaCO3, the as-obtained Ag/ZnO/CaCO3 exhibits excellent performance for the reduction of 4-nitrophenol (4-NP) with a reduction rate of 97.6% within 8 minutes. Furthermore, Ag/ZnO/CaCO3 exhibited superior antibacterial activity in inhibiting the growth of Escherichia coli (E. coli) and Staphylococcus aureus (S. aureus) with minimum inhibition concentrations (MICs) of 60 μg mL−1 and 30 μg mL−1, respectively. The observation of the superior activity for the reduction of 4-NP and antibacterial test of Ag/ZnO/CaCO3 can be attributed to the synergistic effect of Ag, ZnO and the oyster shell-derived CaCO3. This study provides a strategy in developing highly efficient catalysts for the reduction of 4-NP and antibacterial agents based on the oyster shell-derived CaCO3.
Oyster shell was used as an efficient template for synthesis Ag/ZnO/CaCO3 nanocomposites, which showed the enhanced catalytic and antibacterial activities.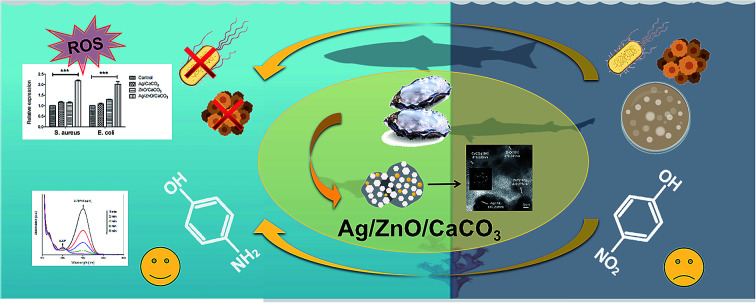
1. Introduction
The transformation of biological waste into high value-added materials has attracted extensive current research interest. Oyster shells, abundant but discarded in the coastal areas, have already been demonstrated to be attractive in some important fields such as wastewater treatment and regenerative medicine, due to their natural porous structure, abundance as well as rich biogenic calcium carbonate (CaCO3). Furthermore, the geochemical properties of biogenic CaCO3, such as its exchange capacity, high absorbability and reactive surface area make it ideal as a solid support to construct efficient bio-based materials for wastewater treatment.1,2 Although some examples have been reported in this area, the modification of organic compounds, including sodium dodecyl sulfate (SDS) and cetyltrimethyl ammonium bromide (CTAB), would tend to cause secondary pollution to bodies of water.3 Therefore, more explorations of oyster shell-derived materials for sustainable and green chemistry are still required.4–6
Recently, wastewater treatment based on semiconductor (photo) catalysis is regarded as a powerful method, as it can degrade the majority of harmful pollutants (such as 4-NP reduction) from wastewater. Until now, a variety of semiconductors, including ZnO, CuO as well as NiO, have been developed for the treatment of a wide range of organic/inorganic contaminants and pathogenic microorganisms from wastewater.7–12 Among these materials, ZnO is considered one of the most promising emerging semiconductors, and features advantages in terms of low cost, broad-spectrum, and environmental friendliness.13,14 In particular, the suitable redox potential of ZnO makes it degrade the majority of harmful pollutants from wastewater. However, the catalytic activity for wastewater treatment over bare ZnO still suffers from limited reusability and ease of aggregation.15
It is well known that noble metals play an important role in semiconductor-based catalytic activity since they can provide active redox sites. Based on previous studies, a noble metal (e.g., Pd, Pt, Au, Rh, and Ag) is usually used to promote the ZnO catalytic performance.16–19 As a typical noble metal, Ag has successfully attracted extensive current research interest in the wastewater treatment field, since Ag provides sufficient active sites for the degradation of harmful pollutants and accelerates the degradation of the pollutant.20–23 By far, various kinds of synthetic strategies, such as electrochemical, decomposition, microwave assisted technology and wet chemical, have been designed for the fabrication of binary Ag/ZnO, but they are generally costly, flammable and toxic.24–30 Therefore, developing an efficient and environmentally friendly route to prepare binary Ag/ZnO is urgently required. Recently, the plant exact is considered to be one of the most efficient methods, since the unique biological molecules (such as sugars, polyphenols and flavonoids, plant extracts, especially Cacumen platycladi extracts) can act as reducing, covering and stable agents in the synthesis process.31–34
In this work, Ag/ZnO obtained from Cacumen platycladi extract was coated onto oyster shell-derived CaCO3, and used for the reduction of 4-NP and as an antibacterial agent. It was found that the as-obtained Ag/ZnO/CaCO3 exhibited excellent performance for the reduction of 4-NP and as an antibacterial agent, as compared to that of binary Ag/CaCO3 and ZnO/CaCO3. The observation of the activity for the reduction of 4-NP and the antibacterial test of Ag/ZnO/CaCO3 can be ascribed to the synergistic effect of Ag, ZnO and the oyster shell-derived CaCO3.
2. Materials and reagents
2.1. Materials
The oyster shells and Cacumen platycladi used in this work were acquired from Quanzhou Normal University, China. Zinc nitrate hexahydrate (Zn(NO3)2·6H2O) and silver nitrate (AgNO3) were purchased from Sinopharm Chemical Reagent Co., Ltd. (China). 4-NP (C6H5NO3) was produced from Qigang Rd., Nanqiao Town, Fengxian, Shanghai. Sodium borohydride (NaBH4) was obtained from Xilong Scientific Co., Ltd. Glutaraldehyde was purchased from Tianjin Ruijinte Chemical Co., Ltd. Nutrient agar and nutrient broth were acquired from Shanghai Bowei Biotechnology Co., Ltd. Bacteria were obtained by the Second Affiliated Hospital of Fujian Medical University (Quanzhou). The reactive oxygen species assay kit was purchased from Biyuntian Biotechnology Co., Ltd. All chemicals were of analytical grade and the water used in this work was deionized (DI) water.
2.2. Synthesis of Ag/ZnO/CaCO3 nanocomposites
First, the oyster shells were rinsed thoroughly with tap water until all dirty matter was removed. The washed oyster shells were again rinsed twice with DI water, and were dried at room temperature for 24 hours. The dried oyster shells were powdered with a grinder, and sieved through a 200 mesh sieve, and then stored in a desiccator for further research. The material thus obtained was the oyster shell-derived CaCO3.
2 g of CaCO3 was dispersed in 50 mL of 0.5 mol L−1 Zn(NO3)2·6H2O solution under magnetic stirring for 24 hours. The reaction was vacuumed to take the solid powder, dried at room temperature, and then collected in a crucible. The ZnO/CaCO3 nanocomposites were obtained after calcination at 600 °C in a muffle furnace for 4 hours under a heating rate of 5 °C min−1. Thereafter, 1 g of the ZnO/CaCO3 nanocomposite was immersed in 10 mL of 0.1 mol L−1 AgNO3, and 10 mL of Cacumen platycladi extract was added. The mixture was combined with magnetic stirring for 48 hours without light, and then thoroughly washed with ethanol and water, and dried. For comparison, Ag/CaCO3 nanocomposites were prepared under similar experimental conditions without the Zn(NO3)2·6H2O solution.
2.3. Material characterization
X-ray diffraction (XRD) measurement of the samples was conducted with a Bruker D8 Advanced System over a 2θ range from 10° to 80° with a Cu Kα radiation source produced at 40 kV, 40 mA, with a scanning speed of 10° min−1. The morphological structures of the samples were examined by a field-emission scanning electron microscope (FESEM, Zeiss, Germany), which was combined with energy dispersive spectroscopy detectors (EDS, Zeiss, Germany) at an accelerating voltage of 1.5 kV. TEM and HRTEM images were taken on a Tecnai F30 FEI transmission electron microscope under a 300 kV operating voltage. X-ray photoelectron spectroscopy (XPS, Thermo Fisher Scientific ESCALAB 250Xi, USA) of the samples was performed with an Al Kα X-ray source. Thermogravimetric analysis (TGA, TA Instruments Q50, US) of the samples was conducted at a heating rate of 5 °C min−1 in air.
2.4. Catalytic reduction of 4-NP
To investigate the catalytic reduction performance of the sample to 4-NP, 4 mL of freshly prepared NaBH4 solution (0.33 mM) and 2 mL of 4-NP solution (1 mM) were mixed in 25 mL of DI water at room temperature. Then, 2 mg of the Ag/ZnO/CaCO3 nanocomposite was added to the mixture. A portion of the mixture was taken at intervals of 2 minutes before and after the addition of the nanocomposite, and the concentration of 4-NP was monitored using a UV-Vis spectrophotometer (METASH UV-9000S) to measure the absorbance at 400 nm. Ag/CaCO3 and ZnO/CaCO3 were each added as a control under the same experimental conditions. In addition, a recycling experiment was performed to evaluate the reusability of the Ag/ZnO/CaCO3 nanocomposite. The sample was centrifuged before each cycle test, washed several times with DI water and dried, and the test was repeated five times.
2.5. Antibacterial test
E. coli (ATCC 25922) and S. aureus (ATCC 25923) obtained from Research Laboratory of the Second Affiliated Hospital of Fujian Medical University were utilized to evaluate the antibacterial potential of the samples. E. coli and S. aureus were cultured in Luria–Bertani (LB) nutrient agar media. After subsequent incubation at 37 °C for 24 hours, a series of experiments were performed to estimate the bacterial viability and antimicrobial potential.
2.5.1. Agar plate experiment
The medium was rinsed several times with sterile water, and then the bacterial culture was suspended in a phosphate-buffered saline (PBS) solution at a final concentration of 108 CFU mL−1. 50 μL of the suspension was applied to the solid LB medium plate. Moreover, tablets made of 70 mg of Ag/CaCO3, ZnO/CaCO3 or Ag/ZnO/CaCO3 nanocomposite were each placed on LB media and cultured in a 37 °C incubator for 24 hours. The antimicrobial and bactericidal properties of the samples were determined by observing the growth of the bacteria and measuring the size of the inhibition zone.
2.5.2. Minimum inhibitory concentration (MIC) test
The bacteria were cultured to a logarithmic growth phase in the LB media, and then suspended in PBS at a final concentration of 108 CFU. 1 mL of the bacterial suspension was added to 1 mL of PBS with different amounts of the Ag/ZnO/CaCO3 composite material to obtain bacterial solutions of different sample concentrations of 15, 30, 45, 60, 75, and 90 μg mL−1. The control groups did not have composite materials. The bacterial cultures were cultivated at 220 rpm at 37 °C for 12 hours. The growth of the bacteria was initially deduced by turbidity visualization. After that, the antibacterial activity of the Ag/ZnO/CaCO3 nanocomposite was supported with optical density analysis using a UV-Visible double beam spectrophotometer (Tecan Infinite 200 Pro, Austria) at a wavelength of 600 nm.
2.5.3. Minimum bactericidal concentration (MBC) test
According to the results of the MIC experiment, different sample concentrations of 15, 30, 60, 120, 240, 480, and 960 μg mL−1 were prepared under similar experimental conditions, and two groups without materials were used as the control groups. The mixture was then set in a shaker incubator to promote the culture at 220 rpm for 12 hours. Moreover, 100 mL solutions were each transferred to the solid LB media, sprayed evenly, and then cultured at 37 °C for 24 hours to observe the colony growth on the plate.
2.5.4. Characterizing the microstructure of bacteria
The bacterial cell death was analyzed by optical microscope and further by SEM. 2 mg of the sample was added to 10 mL DI water and ultrasonicated for 15 minutes. Afterward, 1 mL of the sample solution was added to 0.5 mL of the bacterial solution under shaking for 8 hours. The bacterial suspension was rinsed three times with PBS, fixed with 35% glutaraldehyde for 30 minutes, and dehydrated in a graded ethanol series (30, 50, 70, 90, 100%) for 15 minutes. Finally, bacterial droplets were dried on silicon wafers overnight prior to SEM observation.
2.5.5. Reactive oxygen species (ROS) assay
To determine the production of ROS in cells, a 20 μM ROS assay kit containing DCFH-DA was used as a fluorescent probe. As a non-fluorescent dye, DCFH-DA is able to penetrate into the cells where it would be hydrolyzed to DCFH. In the presence of intracellular ROS, DCFH is converted into green fluorescent DCF for further analysis. In addition, E. coli and S. aureus were cultivated in LB medium with different materials of Ag/CaCO3, ZnO/CaCO3 and Ag/ZnO/CaCO3 for 8 hours. Thereafter, DCFH-DA was added and incubated for 6 hours at 37 °C. Finally, a Tecan Infinite 200 Pro fluorescence spectrophotometer was used for analysis.
3. Results and discussion
3.1. XRD of Ag/ZnO/CaCO3 nanocomposites
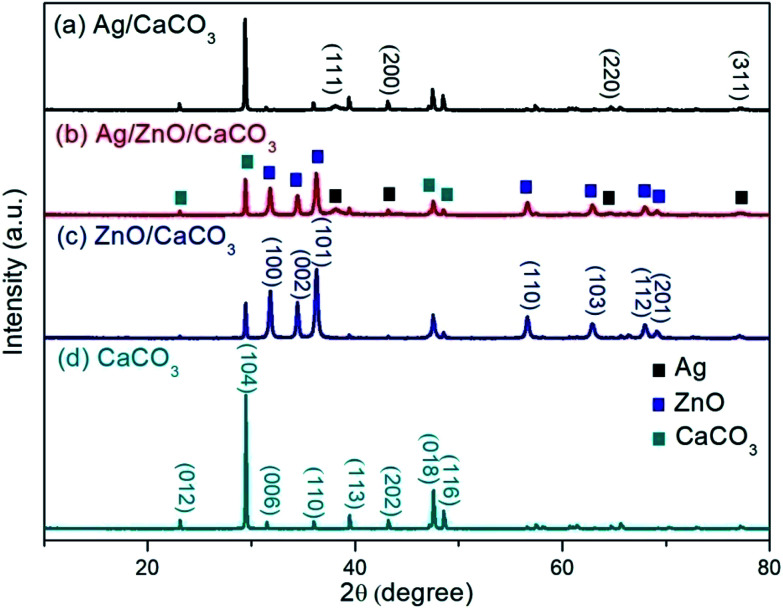
Ag/ZnO obtained from Cacumen platycladi extract was coated onto the oyster shell-derived CaCO3 (Ag/ZnO/CaCO3). For the XRD patterns of the as-obtained Ag/ZnO/CaCO3, the diffraction peaks at ca. 2θ degrees of 31.8°, 34.4°, 36.3°, 56.6°, 62.9°, 68.0°, and 69.1° correspond to the (100), (002), (101), (110), (103), (112) and (201) planes of hexagonal ZnO (JCPDS PDF # 36-1451). The diffraction peaks at ca. 2θ degrees of 38.1°, 44.3°, 64.4°, and 77.5° correspond to the (111), (200), (220), and (311) planes, which could be indexed to the face-centered cubic Ag (Fig. 1b). In addition, the diffraction peaks of oyster shell derived from CaCO3 were also observed (Fig. 1d), and are consistent with that of the bare calcite crystal CaCO3 (JCPDS PDF#05-0586). These results suggest that the as-obtained composites consist of the calcite crystal CaCO3, face-centered cubic Ag, as well as hexagonal ZnO.
Fig. 1. X-ray diffraction patterns of (a) Ag/CaCO3, (b) Ag/ZnO/CaCO3, (c) ZnO/CaCO3 and (d) CaCO3.
3.2. SEM and TEM analysis
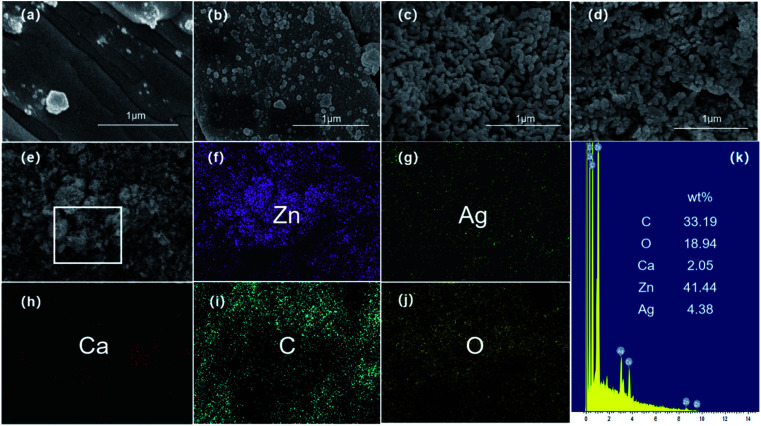
The morphologies of Ag/ZnO/CaCO3 were observed by SEM, as shown in Fig. 2a–d. As compared to the bare oyster shell-derived CaCO3 with its smooth lamellar structure, there are a lot of granules with an average size at 100 nm, which is similar to that observed in the SEM image of Ag/CaCO3, distributed throughout the surface of Ag/ZnO/CaCO3. In corroboration, the EDX elemental mapping analysis of Ag/ZnO/CaCO3 confirms the existence and uniform distribution of the Ag, Zn, Ca, C, and O elements (Fig. 2e–k).
Fig. 2. FE-SEM images of (a) CaCO3, (b) Ag/CaCO3 nanocomposites, (c) ZnO/CaCO3 nanocomposites, and (d) Ag/ZnO/CaCO3 nanocomposites. (e) FE-SEM image of the Ag/ZnO/CaCO3 nanocomposites and (f–j) corresponding elemental mapping images showing Zn, Ag, Ca, C and O in the selected area, (k) the EDX spectrum of the Ag/ZnO/CaCO3 nanocomposites.
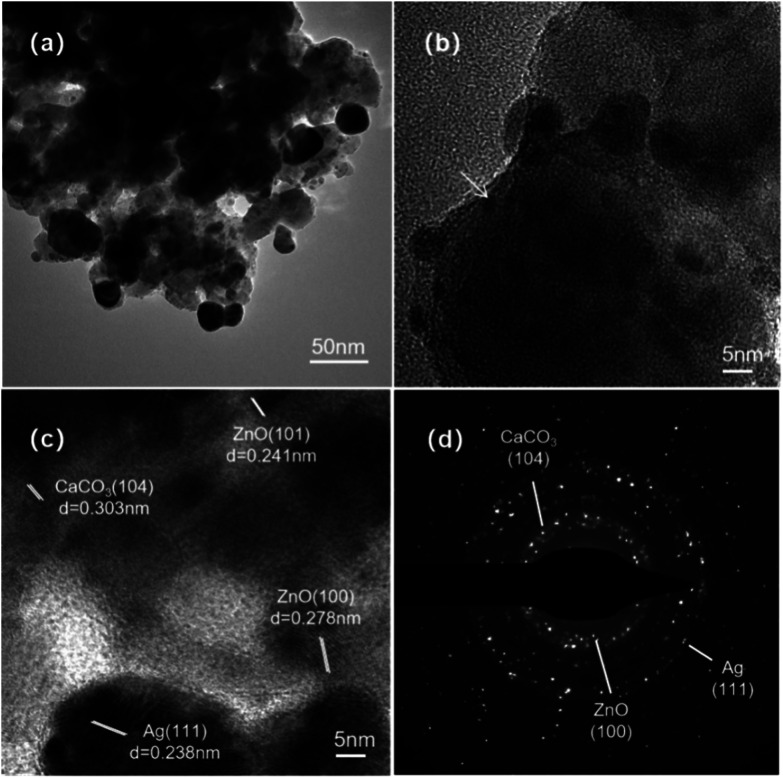
The microstructure of Ag/ZnO/CaCO3 was further observed by TEM. As the TEM images of Ag/ZnO/CaCO3 show, two types of nanoparticles with different sizes at ca. 10 nm and 2 nm were evenly deposited on the surface of the CaCO3 sheet. In addition to the lattice fringes of 0.303 nm corresponding to the (104) crystallographic plane of the calcite crystal CaCO3, clear lattice fringes of 0.278 nm and 0.238 nm corresponding to the (100) plane of hexagonal ZnO and the (111) plane of face-centered cubic Ag, respectively, can be observed in the enlarged TEM image of Ag/ZnO/CaCO3, indicating that Ag/ZnO has been successfully coated on the surface of CaCO3 (Fig. 3).
Fig. 3. (a) Low magnification, (b) high magnification, as well as (c) HRTEM and (d) SAED images of the Ag/ZnO/CaCO3 nanocomposites.
3.3. XPS analysis
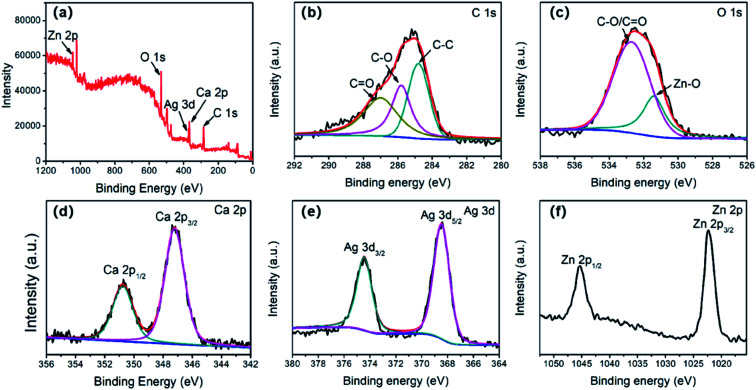
For further study of the surface information and electronic states of the Ag/ZnO/CaCO3, X-ray photoelectron spectroscopy (XPS) was carried out. The result of the wide spectrum indicated that the as-obtained Ag/ZnO/CaCO3 was composed of Ag, Zn, Ca, C, O, but there were no impurities (Fig. 4a). The XPS spectrum in the C 1s region of Ag/ZnO/CaCO3 shows three peaks at 284.8, 285.8 and 287.0 eV, ascribable to bonds of C–C, C–O, and C O, respectively, in which the C–C was always clarified as a reference calibration (Fig. 4b). The XPS spectrum of Ag/ZnO/CaCO3 in the O 1s region can be deconvoluted into two peaks. The peak at 531.4 eV can be ascribed to O2− in the Zn–O bonds, while the other peak at 532.6 eV can be attributed to the C–O/C O species (Fig. 4c). There were two peaks with a peak spacing of 3.5 eV observed in the Ca 2p region of the XPS spectrum. The peak at 347.2 eV belonged to Ca 2p3/2, while the other peak at 350.6 eV reflected Ca 2p1/2 (Fig. 4d). The intensity ratio of the two peaks was nearly 2 : 1, which was in agreement with that previously reported in the literature.20 In addition, the peaks observed in Fig. 4e at the binding energies of 368.5 and 374.5 eV were attributed to Ag 3d5/2 and Ag 3d3/2, respectively. The splitting of the Ag 3d doublet was approximately 6 eV, which indicated the presence of metallic silver in Ag/ZnO/CaCO3, and is consistent with the results of XRD.35 Moreover, the characteristic peaks for Zn 2p3/2 and Zn 2p1/2 (at the binding energies of 1022.4 and 1045.4 eV, respectively) were found in the spectrum of Zn 2p with the splitting of 23 eV, and it can be inferred that Zn only existed in a divalent oxidation state in the sample.36
Fig. 4. XPS spectra of the Ag/ZnO/CaCO3 nanocomposites: (a) XPS spectra of the survey scan, (b) C 1s, (c) O 1s, (d) Ca 2p, (e) Ag 3d, and (f) Zn 2p.
3.4. TGA analysis
The thermal decomposition of CaCO3, Ag/CaCO3, ZnO/CaCO3 and Ag/ZnO/CaCO3 were studied. As shown in Fig. 5, the loss of water from the samples occurred in the lower temperature range of 30–80 °C. It can be seen that a nearly 5% mass loss occurred from Ag/CaCO3 and Ag/ZnO/CaCO3 at around 350 °C, corresponding to the decomposition of organics in the arborvitae liquid. A dominant mass loss occurred at 630–730 °C due to the decomposition of CaCO3 and the loss of CO2. Once the temperature exceeded 750 °C, CaCO3 was completely converted into CaO and the decomposition tended to be stable. Since the oyster shell generally contained CaCO3 as the main calcium-based material, 600 °C was selected as a suitable calcination temperature for this study.
Fig. 5. TGA patterns of CaCO3, Ag/CaCO3, ZnO/CaCO3 and Ag/ZnO/CaCO3.
3.5. Catalysis reduction of 4-NP
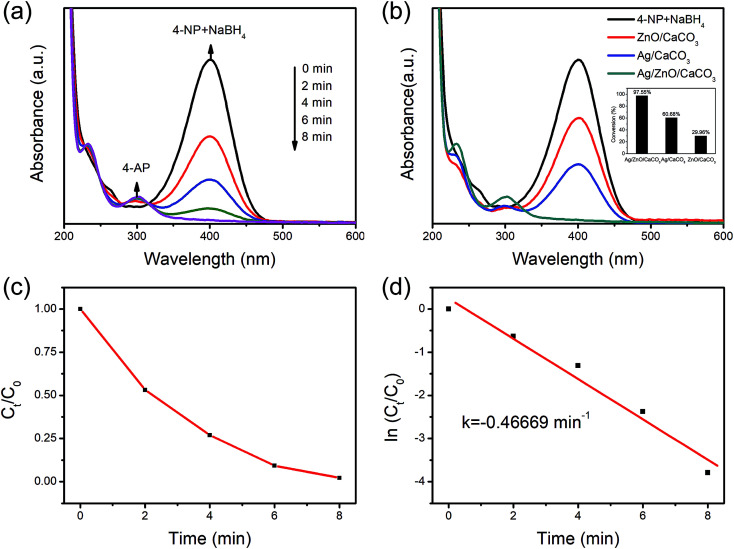
Due to its poor solubility and high stability, 4-NP is considered to be one of the most troublesome water pollutants, which is often degraded by NaBH4 with the addition of catalysis.37–39 Therefore, the reduction of 4-NP was selected as the model reaction to evaluate the performance of Ag/ZnO/CaCO3 for the wastewater treatment. As shown in Fig. 6a, the absorption peak at 400 nm ascribed to 4-NP rapidly decreased with time and completely disappeared after 8 minutes over Ag/ZnO/CaCO3. In addition, two new peaks at 300 nm and 230 nm simultaneously appeared, which are assigned to the characteristic peaks of 4-AP. These observations suggested that 4-NP can be reduced to 4-AP over Ag/ZnO/CaCO3 in an efficient manner. As compared to the binary Ag/CaCO3 and ZnO/CaCO3, Ag/ZnO/CaCO3 exhibited a better catalytic degradation performance by showing the highest degradation rate at 97.55% (Fig. 6b). The time-dependent reduction of 4-NP suggested that the reduction of 4-NP is extremely sensitive over the as-obtained Ag/ZnO/CaCO3. The pseudo-first-order kinetic model (dC/dt = k) was used to calculate the kinetic constant (k). The plot of ln(C/C0) and the reaction time showed that the reduction of 4-NP over the as-obtained Ag/ZnO/CaCO3 followed a pseudo-first-order kinetic model, and the k value of this system was 0.4667 min−1. In addition, the as-obtained Ag/ZnO/CaCO3 showed high stability in the reaction. Five cycling tests revealed no obvious decrease of the activity (Fig. 7).
Fig. 6. (a) Catalytic model of the Ag/ZnO/CaCO3 nanocomposites for 4-NP reduction, (b) different samples for 4-NP at 8 minutes, (c) and (d) plots of C/C0 and ln C/C0versus the reaction time, corresponding to the reduction of 4-NP catalyzed by the Ag/ZnO/CaCO3 nanocomposites.
Fig. 7. The reusability of Ag/ZnO/CaCO3 in the reduction of 4-NP with NaBH4.
The mechanism for the 4-NP reduction is proposed based on the already established fact.40 First, it is noted that the 4-NP solution changes from a light yellow color to bright yellow green after adding NaBH4, which is caused by the formation of 4-nitrophenolate ions. The absorption peak of the 4-NP solution also shifts from 317 nm to 400 nm.13,37 The 4-nitrophenolate ion and BH4− are adsorbed onto the surface of Ag/ZnO via electrostatic interactions and/or van der Waals' forces to free up the active site.41 During the process, the BH4− radical is responsible for transferring hydrogen to Ag NPs and ZnO NPs, and hence resulting in a reaction that forms two intermediates: an unstable 4-nitrosophenol and a stable 4-hydroxylaminophenol.42 The as-formed 4-hydroxylaminophenol is further activated to produce the final product 4-AP, which is visualized by the color changes from a yellow-green color to transparent. The amounts of active sites are normally considered the rate-determining step. This clearly indicates a strong synergistic effect between the Ag NPs and ZnO NPs, which facilitates the electron transfer relevant for 4-NP reduction.43
3.6. Antibacterial activity
It has been found that ZnO NPs showed marked antibacterial activity through the production of reactive oxygen species (ROS) and the release of Zn2+.44,45 Therefore, the antibacterial activity of Ag/ZnO/CaCO3 was also studied. In this part, the E. coli and S. aureus bacteria were used as experimental strains to evaluate the antibacterial activity of Ag/ZnO/CaCO3. Compared with binary Ag/CaCO3 and ZnO/CaCO3, Ag/ZnO/CaCO3 exhibited an effective antibacterial activity for both E. coli and S. aureus by showing larger inhibition zones of E. coli and S. aureus (Fig. 8a and b). In other words, the synergistic effect among the Ag, ZnO and CaCO3 played an important role in improving its antibacterial properties.
Fig. 8. Photographs of the zone of inhibition against (a) E. coli and (b) S. aureus by Ag/CaCO3, ZnO/CaCO3, and Ag/ZnO/CaCO3 nanomaterials. (1–3 and 4–6 represent the addition of ZnO/CaCO3, Ag/CaCO3 and Ag/ZnO/CaCO3 nanocomposites after 24 hours incubation.).
The optical density was measured at 600 nm to analyze the antimicrobial efficiency of different concentrations of the Ag/ZnO/CaCO3 nanocomposites. As shown in Fig. 9a, the Ag/ZnO/CaCO3 nanocomposites at concentrations of 60 μg mL−1 and 30 μg mL−1 can completely inhibit the growth of E. coli and S. aureus, respectively. In addition, the MBC test concentration was selected on the foundation of the results of the MIC experiment. As the results show in Fig. 9b, no E. coli colony was formed on the culture plate at a concentration of 1.92 mg mL−1, and the colony-forming units of the S. aureus bacteria were reduced to zero at a concentration of 960 μg mL−1, implying that both E. coli and S. aureus can be completely killed over Ag/ZnO/CaCO3. This may be related to the special cell membrane structure of E. coli that resists the entry of antimicrobial agents.46,47
Fig. 9. Comparative plots show changes with Ag/ZnO/CaCO3 nanocomposites at different concentrations against E. coli and S. aureus.
The SEM images of E. coli further revealed that untreated E. coli bacteria exhibited typical rod morphology with the intact surfaces and peripheral flagella. When co-cultured with the samples, the E. coli bacteria became short and rough, leading to the shrinkage of cells. Similarly, the initial S. aureus were round-shaped with smooth and intact cell walls. However, they showed membrane damage and distortion after treatment, resulting in the leakage of intracellular components and finally cell lysis. The damaged morphology was attributed to the internalization of the Ag/ZnO/CaCO3 nanocomposites. Generally, the release of metal ions and the production of ROS are two main factors affecting the structures of cells, leading to irreversible DNA damage and subsequent bacterial cell death (Fig. 10).
Fig. 10. SEM images of the status of E. coli and S. aureus before (a and c) and after treatment (b and d) with the Ag/ZnO/CaCO3 nanocomposites.
In order to investigate the effect of ROS on the bactericidal mechanism, the DCDFH-DA fluorescent probe was used to detect the production of ROS in bacterial cells treated with different materials.48,49 Data were normalized by relative expression and statistical analysis by the Student's t test. As compared to the binary Ag/CaCO3 and ZnO/CaCO3, Ag/ZnO/CaCO3 produced an approximate 2-fold increase of ROS. All of these studies revealed that the Ag/ZnO/CaCO3 nanocomposites were capable of producing ROS, and resulted in irreversible DNA damage and bacteria death (Fig. 11).50
Fig. 11. Relative expression of ROS in E. coli and S. aureus with different materials (Ag/CaCO3, ZnO/CaCO3 and Ag/ZnO/CaCO3) and without treatment, using fluorescence spectroscopy. (***: P < 0.01).
4. Conclusions
In summary, Ag/ZnO coated on oyster shell-derived CaCO3via Cacumen platycladi extract (Ag/ZnO/CaCO3) exhibited excellent performance for the reduction of 4-nitrophenol (4-NP) with a reduction rate at 97.6% within 8 minutes. It also demonstrated superior antibacterial activity in inhibiting the growth of E. coli and S. aureus with the minimum inhibition concentrations (MIC) of 60 μg mL−1 and 30 μg mL−1, respectively, which is attributed to the synergistic effect of Ag, ZnO and the oyster shell-derived CaCO3. This study not only provides a strategy for developing highly efficient catalysts for the reduction of 4-NP and an antibacterial agent based on oyster shell-derived CaCO3, but also highlights the great potential of oyster shell-derived CaCO3 for wastewater treatment.
Conflicts of interest
There are no conflicts to declare.
Supplementary Material
Acknowledgments
This work was supported by the Orientative project funded by Fujian Provincial Science and Technology Department (2019H0023), the National Natural Science Foundation of China (81472001); Fujian Provincial Engineering Research Center of Oral Biomaterial (2019kq05); Fujian Medical University (2018QH2039); and Quanzhou City Science & Technology Program (2017G023), Fujian Provincial Health Commission Project (2018-1-67).
Electronic supplementary information (ESI) available. See DOI: 10.1039/c9ra08960h
References
- Yang D.-P. Li Z. Liu M. Zhang X. Chen Y. Xue H. Ye E. Luque R. ACS Sustainable Chem. Eng. 2019;7:4564–4585. doi: 10.1021/acssuschemeng.8b06030. [DOI] [Google Scholar]
- Wu Q. Chen J. Clark M. Yu Y. Appl. Surf. Sci. 2014;311:264–272. doi: 10.1016/j.apsusc.2014.05.054. [DOI] [Google Scholar]
- Wang Z. Jiang S. Zhao Y. Zeng M. Mater. Sci. Eng. C. 2019:105. doi: 10.1016/j.msec.2019.110102. [DOI] [PubMed] [Google Scholar]
- Zhang X. He X. Kang Z. Cui M. Yang D.-P. Luque R. ACS Sustainable Chem. Eng. 2019;7:15762–15771. doi: 10.1021/acssuschemeng.9b04083. [DOI] [Google Scholar]
- Wang X. Zhu S. Liu L. Li L. ACS Appl. Mater. Interfaces. 2017;9:9051–9058. doi: 10.1021/acsami.7b00885. [DOI] [PubMed] [Google Scholar]
- Baldinelli A. Dou X. Buchholz D. Marinaro M. Passerini S. Barelli L. Green Chem. 2018;20:1527–1537. doi: 10.1039/C8GC00085A. [DOI] [Google Scholar]
- Landrigan P. J. Fuller R. Acosta Nereus J. R. Adeyi O. Arnold R. Basu N. Lancet. 2018;391:462–512. doi: 10.1016/S0140-6736(17)32345-0. [DOI] [PubMed] [Google Scholar]
- Sordello F. Berruti I. Gionco C. Paganini M. C. Calza P. Minero C. Appl. Catal., B. 2019;245:159–166. doi: 10.1016/j.apcatb.2018.12.053. [DOI] [Google Scholar]
- Jadhav J. Biswas S. Appl. Surf. Sci. 2018;456:49–58. doi: 10.1016/j.apsusc.2018.06.028. [DOI] [Google Scholar]
- Nguyen V. Q. Baynosa M. L. Nguyen V. H. Tuma D. Lee Y. R. Shim J.-J. Appl. Surf. Sci. 2019;486:37–51. doi: 10.1016/j.apsusc.2019.03.262. [DOI] [Google Scholar]
- Zhang X. Zhou J. Yang D.-P. Chen S. Huang J. Li Z. Catal. Today. 2019;335:228–235. doi: 10.1016/j.cattod.2018.11.047. [DOI] [Google Scholar]
- Wang N. Feng J. Chen J. Wang J. Yan W. Chem. Eng. J. 2017;316:33–40. doi: 10.1016/j.cej.2017.01.066. [DOI] [Google Scholar]
- He X. Yang D.-P. Zhang X. Liu M. Kang Z. Lin C. Jia N. Luque R. Chem. Eng. J. 2019;369:621–633. doi: 10.1016/j.cej.2019.03.047. [DOI] [Google Scholar]
- Meng A. Xing J. Li Z. Li Q. ACS Appl. Mater. Interfaces. 2015;7:27449–27457. doi: 10.1021/acsami.5b09366. [DOI] [PubMed] [Google Scholar]
- Zhang W. Sun Y. Xiao Z. Li W. Li B. Huang X. Liu X. Hu J. J. Mater. Chem. A. 2015;3:7304–7313. doi: 10.1039/C5TA00560D. [DOI] [Google Scholar]
- Yu W. Zhang J. Peng T. Appl. Catal., B. 2016;181:220–227. doi: 10.1016/j.apcatb.2015.07.031. [DOI] [Google Scholar]
- Sathishkumar P. Sweena R. Wu J. J. Anandan S. Chem. Eng. J. 2011;171:136–140. doi: 10.1016/j.cej.2011.03.074. [DOI] [Google Scholar]
- Liu J. Hu Z.-Y. Peng Y. Huang H.-W. Li Y. Wu M. Ke X.-X. Tendeloo G. V. Su B.-L. Appl. Catal., B. 2016;181:138–145. doi: 10.1016/j.apcatb.2015.07.054. [DOI] [Google Scholar]
- Odoom-Wubaha T. Li Q. Wang Q. Usha M. Z. R. Huanga J. Li Q. Mol. Catal. 2019:118–130. doi: 10.1016/j.mcat.2019.03.013. doi: 10.1016/j.mcat.2019.03.013. [DOI] [Google Scholar]
- Guo Y. Yang D.-P. Liu M. Zhang X. Chen Y. Huang J. Li Q. Luque R. J. Mater. Chem. A. 2019;7:8832–8844. doi: 10.1039/C8TA10822F. [DOI] [Google Scholar]
- Cao H. L. Huang H. B. Chen Z. Karadeniz B. Lu J. Cao R. ACS Appl. Mater. Interfaces. 2017;9:5231–5236. doi: 10.1021/acsami.6b13186. [DOI] [PubMed] [Google Scholar]
- Bai W. Sheng Q. Ma X. Zheng J. ACS Sustainable Chem. Eng. 2015;3:1600–1609. doi: 10.1021/acssuschemeng.5b00297. [DOI] [Google Scholar]
- Yang F. Huang J. Odoom-Wubah T. Hong Y. Du M. Sun D. Jia L. Li Q. Chem. Eng. J. 2015;269:105–112. doi: 10.1016/j.cej.2015.01.062. [DOI] [Google Scholar]
- Mou H. Song C. Zhou Y. Zhang B. Wang D. Appl. Catal., B. 2018;221:565–573. doi: 10.1016/j.apcatb.2017.09.061. [DOI] [Google Scholar]
- Vaiano V. Matarangolo M. Murcia J. J. Rojas H. Navío J. A. Hidalgo M. C. Appl. Catal., B. 2018;225:197–206. doi: 10.1016/j.apcatb.2017.11.075. [DOI] [Google Scholar]
- Sampaio M. J. Lima M. J. Baptista D. L. Silva A. M. T. Silva C. G. Faria J. L. Chem. Eng. J. 2017;318:95–102. doi: 10.1016/j.cej.2016.05.105. [DOI] [Google Scholar]
- Raji R. Sibi K. S. Gopchandran K. G. Appl. Surf. Sci. 2018;427:863–875. doi: 10.1016/j.apsusc.2017.09.050. [DOI] [Google Scholar]
- Bharadwaj S. Pandey A. Yagci B. Ozguz V. Qureshi A. Chem. Eng. J. 2018;336:445–455. doi: 10.1016/j.cej.2017.12.040. [DOI] [Google Scholar]
- Zhang X. Wang Y. Hou F. Li H. Yang Y. Zhang X. Yang Y. Wang Y. Appl. Surf. Sci. 2017;391:476–483. doi: 10.1016/j.apsusc.2016.06.109. [DOI] [Google Scholar]
- Zhu X. Liang X. Wang P. Dai Y. Huang B. Appl. Surf. Sci. 2018;456:493–500. doi: 10.1016/j.apsusc.2018.06.127. [DOI] [Google Scholar]
- Guo Y. Gao Y. Li X. Zhuang G. Wang K. Zheng Y. Sun D. Huang J. Li Q. Chem. Eng. J. 2019;362:41–52. doi: 10.1016/j.cej.2019.01.012. [DOI] [Google Scholar]
- Akhtar M. S. Panwar J. Yun Y.-S. ACS Sustainable Chem. Eng. 2013;1:591–602. doi: 10.1021/sc300118u. [DOI] [Google Scholar]
- Iravani S. Green Chem. 2011;13:2638–2650. doi: 10.1039/C1GC15386B. [DOI] [Google Scholar]
- Liu H. Lian T. Liu Y. Hong Y. Ind. Eng. Chem. Res. 2017;56:5262–5270. doi: 10.1021/acs.iecr.7b00064. [DOI] [Google Scholar]
- Mao H. Ji C. Liu M. Cao Z. Sun D. Xing Z. Chen X. Zhang Y. Song X.-M. Appl. Surf. Sci. 2018;434:522–533. doi: 10.1016/j.apsusc.2017.10.209. [DOI] [Google Scholar]
- Zhang X. He X. Kang Z. Cui M. Yang D.-P. Luque R. ACS Sustainable Chem. Eng. 2019;7:15762–15771. doi: 10.1021/acssuschemeng.9b04083. [DOI] [Google Scholar]
- Yan Z. Fu L. Zuo X. Yang H. Appl. Catal., B. 2018;226:23–30. doi: 10.1016/j.apcatb.2017.12.040. [DOI] [Google Scholar]
- Revathy T. A. Dhanavel S. Sivaranjani T. Narayanan V. Maiyalagan T. Stephen A. Appl. Surf. Sci. 2018;449:764–771. doi: 10.1016/j.apsusc.2018.01.280. [DOI] [Google Scholar]
- Liang X. Chen X. Xiang Z. Yan R. Xi H. Bian T. Zhang J. Zhao J. Cai Q. Wang H. Appl. Surf. Sci. 2018;459:716–722. doi: 10.1016/j.apsusc.2018.08.079. [DOI] [Google Scholar]
- Ayad M. M. Amer W. A. Kotp M. G. Mol. Catal. 2017;439:72–80. doi: 10.1016/j.mcat.2017.06.023. [DOI] [Google Scholar]
- Divband B. Khatamian M. Eslamian G. R. K. Darbandi M. Appl. Surf. Sci. 2013;284:80–86. doi: 10.1016/j.apsusc.2013.07.015. [DOI] [Google Scholar]
- Ji Y. Yang J. Luo W. Tang L. Bai X. Leng C. Ma C. Wei X. Wang J. Shen J. Lu S. Sun K. Shi H. ACS Appl. Mater. Interfaces. 2018;10:9571–9578. doi: 10.1021/acsami.7b15902. [DOI] [PubMed] [Google Scholar]
- Rasaki S. A. Zhao C. Wang R. Wang J. Jiang H. Yang M. Mater. Res. Bull. 2019;119:110536. doi: 10.1016/j.materresbull.2019.110536. [DOI] [Google Scholar]
- Sirelkhatim A. Mahmud S. Seeni A. Kaus N. H. M. Ann L. C. Bakhori S. K. M. Hasan H. Mohamad D. Nano-Micro Lett. 2015;7:219–242. doi: 10.1007/s40820-015-0040-x. [DOI] [PMC free article] [PubMed] [Google Scholar]
- Shinde V. V. Dalavi D. S. Mali S. S. Hong C. K. Kim J. H. Patil P. S. Appl. Surf. Sci. 2014;307:495–502. doi: 10.1016/j.apsusc.2014.04.064. [DOI] [Google Scholar]
- Shi H. Bratton B. P. Gitai Z. Huang K. C. Cell. 2018;172:1294–1305. doi: 10.1016/j.cell.2018.02.050. [DOI] [PMC free article] [PubMed] [Google Scholar]
- Zhang B. Zou S. Cai R. Li M. He Z. Appl. Catal., B. 2018;224:383–393. doi: 10.1016/j.apcatb.2017.10.065. [DOI] [Google Scholar]
- Malwal D. Gopinath P. J. Hazard. Mater. 2017;321:611–621. doi: 10.1016/j.jhazmat.2016.09.050. [DOI] [PubMed] [Google Scholar]
- Yao J. Cheng Y. Zhou M. Zhao S. Lin S. Wang X. Wu J. Li S. Wei H. Chem. Sci. 2018;9:2927–2933. doi: 10.1039/C7SC05476A. [DOI] [PMC free article] [PubMed] [Google Scholar]
- Tian X. Jiang X. Welch C. Croley T. R. Wong T. Y. Chen C. Fan S. Chong Y. Li R. Ge C. Chen C. Yin J. J. ACS Appl. Mater. Interfaces. 2018;10:8443–8450. doi: 10.1021/acsami.7b17274. [DOI] [PubMed] [Google Scholar]
Associated Data
This section collects any data citations, data availability statements, or supplementary materials included in this article.


