Abstract
The significant application potential of the DNAzyme activity of G-quadruplex (G4)–hemin complexes has prompted considerable research efforts to amplify their peroxidase mimicking activity to match that of their enzymatic counterparts. However, concurrent improvements in the catalytic cycle and catalyst recovery remain elusive. Herein, we report the creation of a network array of G-quadruplex (G4)–hemin complexes crosslinked by carbon quantum dots (CDs) that not only significantly improves the G-quadruplex–hemin DNAzyme activity, stability, and catalytic cycle, but also points towards easy catalyst regeneration via a semi-heterogeneous catalysis approach. 5′-phosphate terminated G-rich single-stranded DNA molecules proficient in generating intermolecular and intramolecular G-quadruplexes were covalently conjugated to anthrarufin derived CDs through phosphoramidite chemistry. The network array was achieved through K+ mediated intermolecular G-quadruplex formation that readily complexes with hemin to give the catalytic core. The presence of CDs in close vicinity ensures a favorable microenvironment that helps in amplifying the DNAzyme activity in both the intermolecular CD–G-quadruplex network assembly and the intramolecular CD–G quadruplex conjugate, while the former is necessary for easy catalyst regeneration. The CD photophysics enable the monitoring of the DNAzyme recovery and reaction progress.
Enhanced DNAzyme activity of G-quadruplex–hemin complex in carbon dot crosslinked nanonetwork with access to easy catalyst regeneration.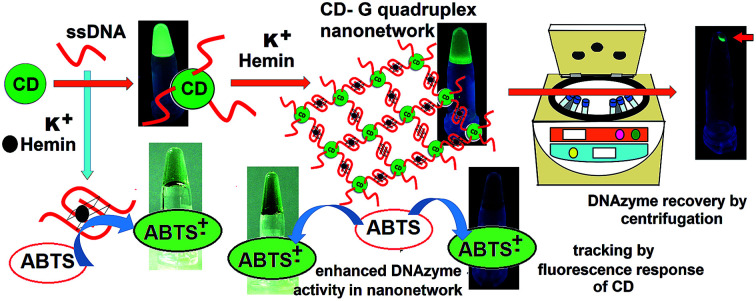
Introduction
Catalytic DNA oligonucleotides or DNAzymes have the ability to execute specific chemical reactions similar to those of biological enzymes, generating an increasing interest to use them in biosensing, DNA machinery, and biocatalysis.1 In particular, G quadruplex-DNA/hemin [iron(iii)–protoporphyrin IX] complexes are a well-known class of DNAzymes with a specific catalytic activity that mimics the enzyme, horseradish peroxidase (HRP), in the presence of hydrogen peroxide (H2O2).2 G quadruplex/hemin based DNAzymes possess several distinct advantages over natural proteic peroxidases, such as a high thermal and hydrolytic stability, small size, simple synthesis, facile manipulation and amenability to the rational design of allosteric control.3 Constant research efforts have been witnessed to increase the potency of the G-quadruplex-DNA/hemin based DNAzymes that would widen the substrate scope thereby expand applicability.4 However, important issues like preserving the G quadruplex-DNA/hemin catalytic core, catalytic cycle and catalyst regeneration are seldom addressed, which are essential if such DNAzymes are being envisioned as able contenders to traditional chemical catalysts and enzymes. Herein, for the first time, we are reporting the creation of a G quadruplex/hemin network array crosslinked by carbon quantum dots (CD) that not only display a significantly enhanced DNAzyme activity, but also offer superior stability with a definite route to easy catalyst regeneration and fluorescence-based tracking.
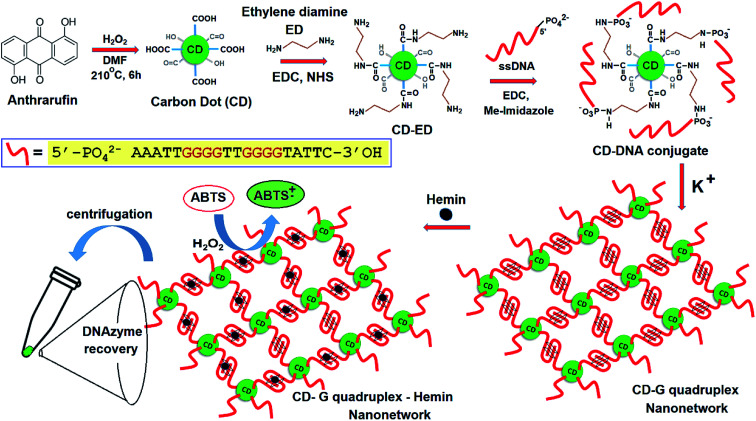
G-quadruplexes are non-canonical nucleic acid structures with stacked G-tetrads (G4) assembled by oogsteen hydrogen-bonding.5 They have an excellent affinity towards hemin, displaying DNAzyme activity, albeit lower than its enzymatic counterpart.6 Reportedly, the catalytic activity could be amplified and modulated by using biogenic polyamines, cationic polymers, ATP supplements, and using certain flanking and loop sequences to improve the performance of the biosensors and catalysts.7 A G-quadruplex array was designed on a DNA-nanotube that offered flexible positioning of the aptamers leading to a better DNAzyme activity.8 A “nucleoapzyme” was developed in which strong binding of the substrate with an aptamer linked G quadruplex is held responsible for the enhanced catalytic activity.9 Overall, recent research has provided definite hints about augmenting DNAzyme activity and improving the catalytic cycle by essentially manipulating the microenvironment of the catalytic core. However, there is a definite trade-off while maintaining the hydrophobic catalytic core and positioning the same in a microenvironment for the easy access of substrates to the former in aqueous media that limits the catalytic efficiency. In heterogeneous catalysis, confined microenvironments have been found to be equally important to easy access to catalytically active sites for the optimum function of the catalyst, which is increasingly difficult to achieve in homogeneous catalysis.10 In a novel intervention, we hypothesized the use of aqueous dispersible CDs as crosslinkers for pattering a definite network array of G quadruplexes to achieve a confined microenvironment and simultaneously provide easy access of the substrate to the catalytic core. This report is the first of its kind in which CD is covalently conjugated to G-rich single-stranded DNA (ssDNA) and further processed to affect a network array of intermolecular G-quadruplexes that is capable of significantly amplifying the DNAzyme activity and provide an easy way for catalyst regeneration (Scheme 1). Moreover, the intense fluorescence of the CD infuses important clues towards tracking of the reaction dynamics.
Scheme 1. Creation of the CD–G quadruplex–hemin nanonetwork and DNAzyme recovery.
Materials and methods
HPLC purified single-strand 5′-phosphorylated DNA (ssDNA, Table S1, ESI†) was purchased from Sigma. Methyl imidazole, N-hydroxy succinimide (NHS), and 1-(3-dimethylaminopropyl)-3-ethylcarbodiimide hydrochloride (EDC·HCl) were obtained from Alfa Aesar. All the chemicals required for buffer preparation and gel electrophoresis were obtained from either Sigma or Alfa Aesar and used without further purification. Nanopure water from Millipore was used in all the experiments, including the spectroscopic studies.
Synthesis of carbon dots (CDs) and their characterization
The CDs were prepared following an interlaboratory method. Briefly, 100 mg of 1,5-dihydroxyanthraquinone (anthrarufin) was dissolved in 3 mL of dimethylformamide and heated with 100 μL of 50% hydrogen peroxide in a Teflon lined stainless = still autoclave at 180 °C for 6 hours. After cooling to room temperature, the solvent was evaporated to obtain a dark brown residue. The residue was dispersed in ethanol (2 mL) and filtered with a 0.22 μm syringe filter. The filtrate was then stored at 4 °C for further use. Characterization of the CD was done by Fourier transform infrared (FTIR) spectroscopy, High-Resolution Transmission Electron Microscopy (HRTEM), Atomic Force Microscopy (AFM), X-ray Diffraction (XRD), as well as X-ray Photoelectron Spectroscopy (XPS). FTIR spectra were recorded on a PerkinElmer spectrometer within the range 400–4000 cm−1. AFM was performed on 5500 AFM/SPM equipment (Keysight Technologies). The morphology and size of the product were observed using a TEM CM200 (Phillips) at an accelerating potential of 200 kV (100 K magnification). XRD was performed in a Rigaku TTRAX III X-ray diffractometer. UV-vis absorption spectra were obtained on a UV-vis spectrophotometer (Horiba, Japan). The fluorescence spectra were recorded on a fluorescence spectrophotometer (Shimadzu, Japan) with the slit width of both excitation and emission set at 5 nm. Absorption and fluorescence measurements were carried out in a quartz cuvette (path length = 1 cm). Time-resolved fluorescence emission decays were measured at room temperature by a time-resolved fluorescence spectrophotometer (LifeSpec-II, Edinburgh Instruments, UK) operating on a using picosecond time-correlated single-photon counting (TCSPC) technique. Digital images were acquired with a Canon D-60 digital camera.
Conjugation of CD with ethylene diamine (ED)
For the covalent conjugation of CD to ED, a CD (0.2 mL) solution in DMF was activated by an aqueous solution of EDC (100 μL, 10 mM) followed by the addition of an aqueous NHS solution (200 μL, 10 mM). The reaction mixture was thoroughly mixed and allowed to stir at room temperature for 1 h. To this solution, ED (0.2 mL, 2 mM) was added, and a total volume reaction mixture of 1 mL was incubated for 12 h at room temperature under constant stirring. The reaction was quenched by adding dichloromethane and dried over anhydrous Na2SO4. The solvent was removed under vacuum to give the product CD–ED.
Conjugation of DNA with CD–ED
5′-phosphorylated G-rich ssDNA (0.1 mL, 1 mM) was activated by the addition of EDC (20 μL, 10 mM) and an aqueous solution of 1-methyl imidazole (20 μL, 20 mM) at pH 6 and thoroughly mixed for 90 min at 37 °C with constant stirring. To this activated 5′- phosphorimidazolide ssDNA, 300 μL of amine functional group-containing CD–ED (5 mg mL−1) was added in a total reaction volume of 500 μL in (4-(2-hydroxyethyl)-1-piperazineethanesulfonic acid) HEPES buffer (0.1 M, pH 8) and kept at 55 °C for 9 h. The crude reaction mixture was dialyzed multiple times (MWCO – 1–10 kDa) to remove the excess of EDC, 1-methyl imidazole and other unreacted residues, including unreacted DNA.
Absorption and emission spectroscopic techniques
The conjugated samples were analyzed under a UV-visible UV-2550 spectrophotometer (Shimadzu) through scanning the wavelength in a range of from 200 to 600 nm. The steady-state fluorescence spectra were analyzed on a Fluoromax-4 spectrofluorometer 45 (Horiba, Japan) at an excitation wavelength of 330 nm. Further, the average lifetimes of CDs and the CD conjugated system were measured using a time-correlated single-photon counting (TCSPC) technique by a time-resolved fluorescence spectrophotometer from Edinburgh Instruments (LifeSpec-II, UK). The fluorescence transients were detected in magic-angle (54.7°) polarization using a Hamamatsu MCP PMT (3809U) as the detector. The time-resolved fluorescence decays were recorded on a 100 ns window with 4096 channels, laser 375 nm, frequency 5 MHz, 5000 counts. All these spectrometric measurements were performed in aqueous medium.
Preparation of G quadruplex and characterization
The G-quadruplex was prepared by adding 0.1 mmol of G-rich ssDNA in the presence of a 25 mM Tris–HCl, 100 mM KCl solution in a final volume of 200 μL at neutral pH with nanopure water. This solution was kept at 37 °C overnight. A similar procedure was adapted to create a CD–G quadruplex network or CD–intramolecular G quadruplex from G-rich ssDNA. The characterization and confirmation of the G quadruplex formation were done via circular dichroism. Circular dichroism spectra of the G-quadruplex were acquired on a Jasco J-1500. The data are articulated as degrees of ellipticity, in units of millidegrees (mdeg). The sample was scanned thrice with a scan rate of 50 nm min−1 using a 1 mm pathlength cuvette. Circular dichroism spectra were also acquired for G-quadruplex DNA (not conjugated to CD) and after the addition of hemin (80 μL, 5 μM) to a 200 μL total volume.
AFM and TEM analysis
The morphologies of the CD and CD–G quadruplex conjugates were characterized by transmission electron microscopy (TEM) and atomic force microscopy (AFM) experiments. For the TEM and AFM experiments, the sample (100 μL) was diluted with Milli-Q water (400 μL) to obtain a transparent dispersion. For AFM, APS mica was used to drop cast CD samples, while a highly oriented pyrolytic graphite surface (HOPG) was used for the CD–G quadruplex nanonetwork. Samples were air-dried before recording data.
Agarose gel electrophoresis
CD, CD–DNA conjugate, G-rich ssDNA, and the CD–G quadruplex–hemin assembly were visualized with 1.5% agarose gel electrophoresis in 1× Tris acetate EDTA (TAE) buffer with pH 8 at 90 V. Images were acquired by a Canon D-60 digital camera. CD and G-rich ssDNA were used as controls. DNA was premixed with Sybr Gold nucleic acid stain®, whereas CD samples were visualized as such without any staining.
CD–G-quadruplex hemin complex formation
For the CD–G quadruplex–hemin complex formation, the CD–G quadruplex network was first assembled by adding 25 mM Tris–HCl, 100 mM KCl solution to a final volume of 200 μL at pH 7 with nanopure water and incubated at 37 °C overnight. The concentration of DNA conjugated to CD was estimated by measuring the OD @260 nm and comparing the same with the concentration of the control G-DNA. Then 100 μL of 0.1 mM CD–G quadruplex DNA and 10 μL of 5 mM hemin in DMF were added to 500 μL of a 1× buffer (80 mM HEPES–NH4OH, pH 8.0, 40 mM KCl, 0.1% Triton X-100 and 2% DMF) in a 1.5 mL vial. The total volume was made up to 1 mL by MilliQ® water. The solution was incubated for 5 min at room temperature to allow G-quadruplex–hemin complex formation. A similar amount of DNA and hemin was used for the preparation of the control G quadruplex DNA–hemin complex. The complex was studied by various spectrophotometric methods.
ITC analysis
ITC analysis was performed with a MicroCal ITC 200 (GE, USA). The CD–G quadruplex nanonetwork was prepared in the 100 mM KCl containing buffer at pH 7.0. The bindings of hemin with the CD–G quadruplex nanonetwork and with the G-quadruplex alone were evaluated by titrating 50 μM DNA containing samples against 500 μM hemin under the similar buffer condition at 25 °C. The DNA containing samples taken in the sample cell were titrated against hemin loaded in the syringe. The same procedure was followed to evaluate bindings for hemin and the intramolecular G quadruplex solution either free or conjugated with CD.
ABTS peroxidase test
The ABTS peroxidase test was carried out using the ABTS reagent, where oxidation of ABTS2− to the ABTS˙+ radical cation generates a green luminescence. CD–G-quadruplex–hemin complex (100 μL of 0.1 mM CD–G quadruplex DNA and 10 μL of 5 mM hemin in DMF) was prepared in 500 μL of buffer (80 mM HEPES–NH4OH, pH 8.0, 40 mM KCl, 0.1% Triton X-100, and 2% DMF) and Milli-Q® water as described above. Equal amounts of 10 mM ABTS (10 μL) and 10 mM H2O2 (10 μL) were added to a total volume of 1 mL to test the peroxidase activity. Similarly, the qualitative peroxidase activity was also tested using the ABTS reagent for the control G-quadruplex DNA–hemin without CD conjugation in the presence of 10 μL of H2O2. The concentration of DNA in the nanonetwork and control was maintained at 2 μM and estimated through OD values. The absorbance of the oxidized product was studied at 410 nm after 10 min incubation. Quenching of the fluorescence of the CDs after formation of product was also recorded with a digital camera after irradiation on a transilluminator or handheld UV lamp.
Recovery and reconstitution of CD–G-quadruplex–hemin DNAzyme
Once the oxidation reaction completed, the system was centrifuged at 20 817 g or 14 000 rpm for 20 min at 4 °C through the rotor FA-45-30-11 on an Eppendorf centrifuge 5430 R to obtain a fluorescent precipitate of the nano network after discarding the reaction mixture. However, in the presence of cold ethanol, the time to obtain the precipitate was reduced to 10 min. To reuse this pellet nanonetwork, a 25 mM Tris–HCl, 100 mM KCl solution was added to a volume of 200 μL and incubated. Further, a corresponding amount of hemin solution was added along with the working buffer (80 mM HEPES–NH4OH, pH 8.0, 40 mM KCl, 0.1% Triton X-100 and 2% DMF) in a 1.5 mL vial. Lastly, the reformed CD–G quadruplex along with hemin solution underwent the next cycle of ABTS assay.
Results and discussion
The green-emitting CD was synthesized by a solvothermal method using anthrarufin (1,5-dihydroxyanthraquinone, DHA) in dimethylformamide (DMF) solvent in the presence of a calculated amount of 50% H2O2. Confirmation of the graphitization of the CD was obtained from powdered X-ray Diffraction (pXRD) that disclosed the (002) plane of the graphitic framework at ∼25° within the CD (Fig. S1, ESI†). The decreased peak intensity and increased full-width half maxima indicated partial graphitization and high disorderliness of carbon atoms in the CD. Atomic Force Microscopy (AFM) and Transmission Electron Microscopy (TEM) analysis revealed a uniformly dispersed spherical morphology of the CD with a diameter of ∼7–8 nm (Fig. S2 and S3, ESI†). Fourier Transform-Infrared (FTIR) spectroscopy revealed broad O–H stretching (3361 cm−1, 3150 cm−1), and C O stretching bands (1705 cm−1, 1660 cm−1) with a few merged peaks indicating the presence of numerous carboxylic, alcoholic and keto groups indicative of the highly oxidized surface of the CD (Fig. S4, ESI†). Further, UV-vis absorption spectra showed a peak at 286 nm attributed to π–π* transition of the graphitic sp2 domain, and at 343 nm owing to the n–π* transition of the C O group of the CD (Fig. S5, ESI†).11 The steady-state fluorescence emission spectra of the CD showed a maximum emission at 520 nm when excited with 350 nm and exhibited an excitation independent fluorescence emission (Fig. S6, ESI†). The quantum yield (QY) of the CD was determined as 70% in water using rhodamine 6G as the standard.
In the pursuit of a compatible chemistry to covalently conjugate the CD with phosphate terminated ssDNA, the –COOH groups on the CD were coupled with ethylenediamine (ED). The amide formation reaction between CD and ED ensures the presence of terminal amine functionality on the surface of the CD for subsequent attachment to ssDNA. The carboxylic acid groups on the CD were activated by EDC. HCl and NHS and successively conjugated to ED. The covalent conjugation of CD and ED showed peaks at 1400 cm−1 and 1678 cm−1 in FTIR corresponding to C–N and C–O stretching, confirming the formation of the amide bond (Fig. S4, ESI†). Further, a broad peak at ∼3200 cm−1 confirms the presence of primary aliphatic amine groups on the CD. The UV-vis spectra of the CD–ED conjugate was similar to that of CD, and the emergence of any new peak was not observed (Fig. S7, ESI†).
The newly formed amino groups on CD were coupled with the phosphate groups of DNA following aqueous phase phosphoramidite chemistry using EDC. HCl and methyl-imidazole at room temperature with the relevant pH adjustment and purification by dialysis (DNA sequence 1, Table S1, ESI†). A distinct peak in the UV-vis spectra at ∼260 nm appeared after conjugation with the ssDNA that points towards the successful conjugation of CD with ssDNA (Fig. S7, ESI†). Further confirmation of the covalent conjugation of CD with ssDNA was also obtained from agarose gel electrophoresis and High-Performance Liquid Chromatography (HPLC) (Fig. 1A and B). While the gel mobility of the CD was significantly reduced after its conjugation to ssDNA, a new peak distinct from that of either the CD or free ssDNA was observed to emerge in HPLC. Given the availability of amino groups on a two-carbon linker, it is likely that multiple ssDNA gets covalently conjugated with one CD. The smearing of the band in gel electrophoresis and the presence of a few shoulders in the HPLC peak corresponding to a CD–DNA conjugate is testimonial to such an effect.
Fig. 1. (A) Agarose gel electrophoresis and (B) an RP-HPLC profile showing the differences in the mobilities of CD, DNA, and the CD–DNA covalent conjugate.
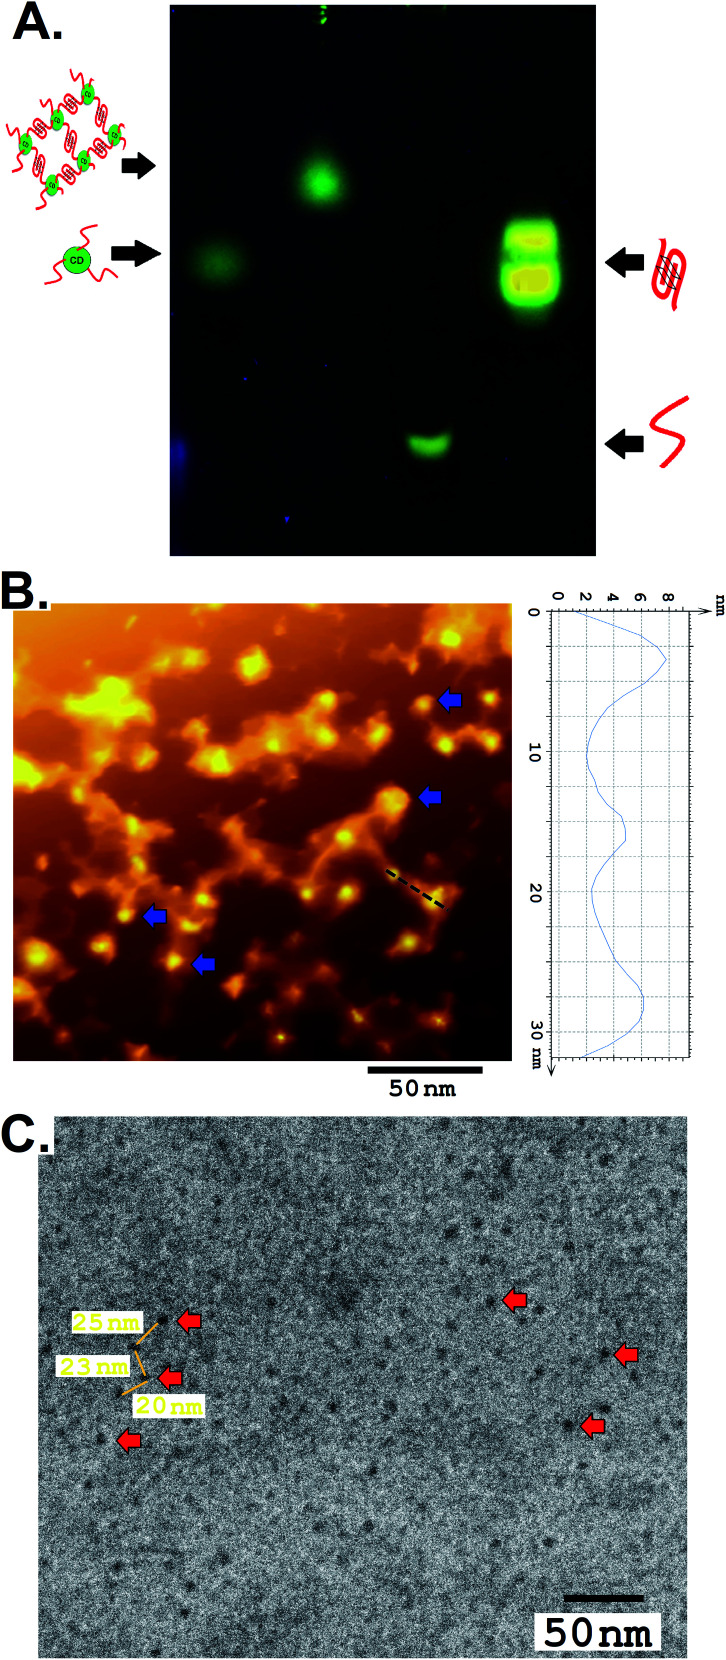
The G-quadruplex formation from the network forming sequence was optimized in the presence of K+ and displayed a well-recognized band in gel electrophoresis, analogous to intramolecular conformers, followed by a band with a lower mobility representing a multimeric structure reminiscent of the intermolecular G-quadruplex (Fig. 2A).12 The CD–DNA conjugate was further processed following optimized conditions, where DNA strands conjugated to different CDs would participate in the creation of a G quadruplex secondary structure in the presence of the K+ ion. This essentially points towards CD-mediated crosslinking through the formation of G quadruplexes. CD-DNA conjugate folds predominantly into intermolecular parallel conformers in the presence of 100–200 mM K+, as evident from the dominant band with limited mobility in agarose gel electrophoresis. Dragging of the low-mobility band also indicates the formation of a higher-ordered structure in the CD–DNA sample due to intermolecular G quadruplex network formation that was further slowed down after hemin addition (Fig. S8, ESI†).
Fig. 2. (A) Agarose gel electrophoresis the showing mobility of the CD–G quadruplex network. (B) An AFM image and (C) a TEM image of network formation by the CD–G quadruplex. A few CDs in the network are indicated by the arrows in (B) and (C).
For imaging, the nanonetwork samples of the CD–G quadruplex network were drop cast on a pyrolytic graphite surface (HOPG) and imaged with an Atomic Force Microscope (AFM).13 After intermolecular G quadruplex formation, the CDs were observed to be dispersed in a network in the AFM image (Fig. 2B). A definite interparticle distance of ∼20 to 25 nm between the CDs was maintained in the network with the height of CDs ranging between 6 and 8 nm and the G quadruplex around ∼4 nm that points towards the G quadruplex mediated network formation. However, conformational flexibility of DNA, contractions in DNA strands, and surface van der Waals forces impart minor non-uniformity in the inter-CD distance, as evident from AFM imaging. TEM was also performed to confirm the morphology and distribution of CDs in the nanonetwork that also revealed the formation of a CD–G-quadruplex nanonetwork (Fig. 2C and S9, ESI†).
The steady-state analysis showed a slight decrease in the fluorescence intensity for the CD due to the presence of amino groups (from ED conjugation) on its surface (Fig. S10, ESI†), and the effect was further translated after conjugation of ssDNA with CD through those amine groups. Overall, the photophysics of the CD remains preserved after its conjugation with ED and subsequently with ssDNA before and after G quadruplex formation with K+. Afterward, a calculated amount of hemin was added to the solution of the CD–G quadruplex network. Initially, due to the high affinity of hemin towards the G quadruplex, the addition of hemin to the CD–G quadruplex solution generates hemin–G4 complexes involving the network. Once the G quadruplex sites are saturated with hemin, its further addition leads to a non-covalent attachment on the surface of the CDs in the network. This is evident from the quenching of fluorescence of the CD with the addition of excess hemin. In an alternative approach, prior addition of hemin to a solution of the CD–DNA conjugate quench the fluorescence of CD that was regained after the addition of K+ ions in the solution. This indicates the formation of the G quadruplex–hemin complex and simultaneously also confirms the G quadruplex mediated network formation with CD–DNA. Reduction in the average fluorescence lifetime of the CD was also observed due to the non-covalent interaction of hemin with CD following a dynamic quenching mechanism (Fig. S11 and Table S2, ESI†).14
The negative peak at 240 nm and positive peak at 265 nm in circular dichroism spectra correspond to the parallel type of G quadruplex, which is characteristics of the DNA sequence used in the present study (Fig. S12, ESI†).15 In the case of the CD–DNA conjugate, the intensity of the positive peak at 265 nm increases in the presence of K+ ions, confirming the G quadruplex formation. Interestingly, an increase in the peak intensity of the characteristic G quadruplex peak at 265 nm in the presence of hemin attests to the intrinsic affinity of hemin for the G quadruplex leading to the enhanced formation and stability of the later. It further suggests that the presence of K+ stabilizes the enhanced formation of the G-quadruplex structure in the network, and the interaction of the G-quadruplex with hemin did not disturb its secondary structure.
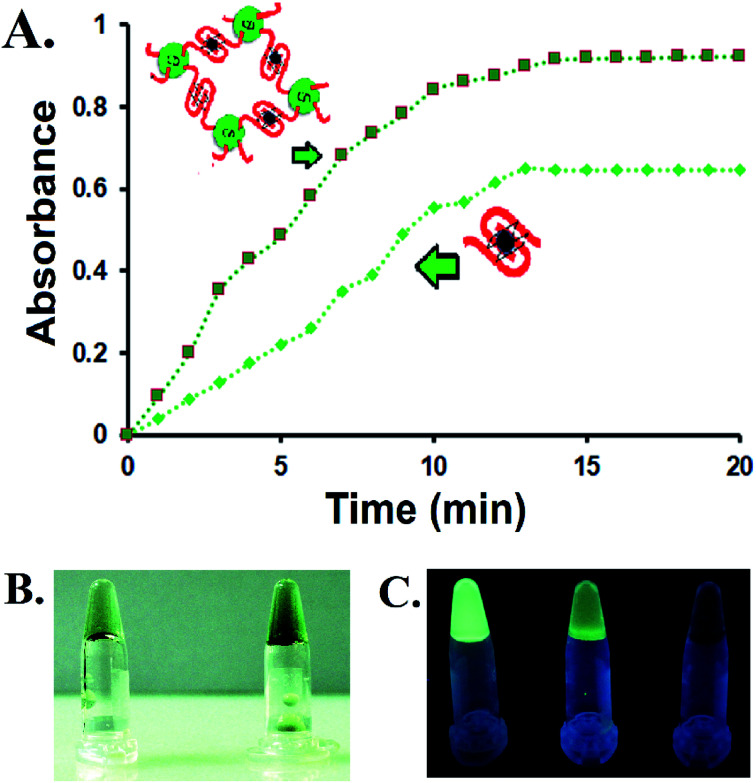
The CD–G quadruplex–hemin nanoassembly was further studied for its designated DNAzyme activity. As a prototype, 2,2′-azino-bis(3-ethylbenzothiazoline-6-sulfonic acid) (ABTS) was considered as a substrate, one of the most common substrates studied over the years for G quadruplex DNAzyme assay, not to mention the potential of ABTS in the application of the visual detection of target analytes.16 The colorless ABTS premixed with H2O2 was oxidized to a green charge–transfer complex of the ox-ABTS (ABTS˙+, λmax = 410 nm), as observed by UV-vis spectroscopy (Fig. S13, ESI†). Significantly more products were formed with the CD–G quadruplex–hemin nanoassembly compared to the unconjugated ssDNA derived G quadruplex used as a control in the same time interval as observed by UV-vis spectrophotometric scans and simple visual detection (Fig. 3A and B). The reaction of ABTS to the oxidized form was found to follow pseudo-first-order kinetics with respect to ABTS in the CD–G quadruplex–hemin nanonetwork, with a significantly higher rate constant leading to more product formation in a given time frame.17 However, no augmented DNAzyme activity was observed when the CD was loosely added to the G-quadruplex solution without any covalent conjugation that points towards the role of the vicinal CD in creating a favorable microenvironment for enhanced activity (Fig. S14, ESI†). Notably, DNA having sequences known to create predominantly intramolecular G quadruplex when conjugated to CD as the control also demonstrated an enhanced DNAzyme activity (sequence 2, Table S1 and Fig S15, ESI†). However, the DNAzyme activity was lower than that of the CD–G quadruplex hemin nano network.
Fig. 3. (A) A comparison of the peroxidase activities of G quadruplex–hemin and CD–G quadruplex–hemin using the ABTS reaction (average of 3 points). (B) A digital image of the ABTS reaction with unconjugated G quadruplex (left) and the CD–G quadruplex–hemin nanoassembly (right). (C) The fluorescence response (digital images) of CDs in the CD–G quadruplex–hemin nanonetwork after the addition of hemin (middle) and after 15 min of ABTS reaction (right).
One important corollary observed from the prototype ABTS reaction is that, apart from the UV-based detection of product formation, the presence of CD could also offer a fluorescence-based response of the reaction progress. With the progress of the reaction and subsequent formation of the oxABTS product, the fluorescence of the CD in the nanoassembly was quenched gradually. Apart from steady-state detection, such gradual quenching could be visually detected with the help of a handheld UV lamp only (Fig. 3C). This is of particular interest to biosensing applications in which G quadruplex–hemin DNAzyme mediated the formation of colored products (UV-vis detectable) for the detection of relevant reducible metabolites is no longer a mandatory condition. At the same time, this endorses the CD as a potential biocompatible entity for biosensing, drug delivery, and other important applications within the G-quadruplex framework.
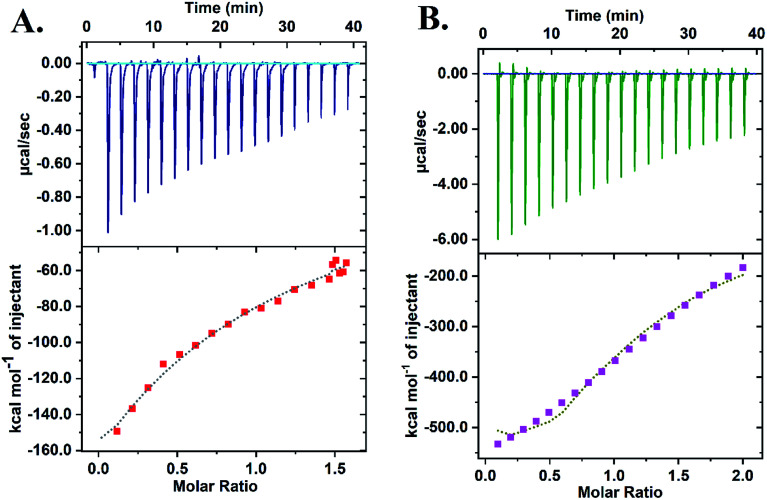
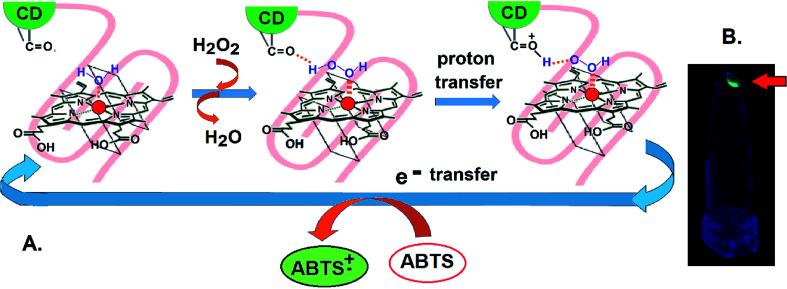
Isothermal Calorimetry (ITC) was implemented to decipher the augmented DNAzyme activity (Fig. 4). A stronger binding affinity of hemin to the tune of more than seven times along with an increased number of binding sites and −ΔG value was obtained for the CD–G quadruplex network (Table S3, ESI†). A better binding activity (nearly double) was also observed with CD conjugated to the intramolecular G-quadruplex (no network, sequence 2, Table S1†) compared to the unconjugated counterpart (Fig. S16 and Table S4, ESI†). The porphyrin ring of hemin possibly interacts with the CD through π–π stacking interactions. Additionally, the strong interaction of the Fe-core of hemin with the carbonyl functional groups of CD is also anticipated. Thus, ITC data clearly reveal that the role of CDs is to provide a favorable microenvironment for hemin to bind tightly with the G quadruplex irrespective of the network formation, which correlates well with previous findings.18 Overall, the enhancement of DNAzyme activity in the CD–G quadruplex–hemin nanonetwork is mainly attributed to two reasons: a stronger binding of hemin with the G quadruplex and subsequent formation of a confined yet favorable microenvironment where keto carbonyl functional groups on the surface of the CD interact with hemin, facilitating electron transfer (Fig. 5A).
Fig. 4. ITC data revealing the higher binding constant of hemin with the CD–G quadruplex nanonetwork: (A) DNA + hemin; (B) CD–G-quadruplex network + hemin.
Fig. 5. (A) Plausible mechanism of the interaction of CDs with hemin for the enhancement of the DNAzyme activity of the CD–G quadruplex–hemin nanonetwork. (B) Recovery of the CD–G quadruplex–hemin network assembly (indicated by the arrow) via centrifugation after the reaction cycle where a fluorescent precipitate is visible in the tube under UV irradiation.
Apart from the enhanced DNAzyme activity, the CD–G-quadruplex–hemin nanoassembly offers an unmatched simplicity for its recovery. This DNAzyme nanoassembly could be recovered by simple centrifugation at 20 000 g at 4 °C, which is greatly hastened in the presence of cold ethanol, that was otherwise not possible with CD–G quadruplex intramolecular assembly. The entire CD–G quadruplex–hemin nanonetwork precipitates and thus is separated easily, and, most interestingly, the success of the DNAzyme recovery can be visually ascertained by the fluorescence of the CD in the precipitate only to be reconstituted further by adding a suitable K+ and hemin containing buffer (Fig. 3D). The catalytic efficiency was found to be unperturbed for up to five cycles beyond which there was a gradual decrease mainly due to the loss of DNA during extraction and also inherent infidelity linked to the G quadruplex reconstitution (Fig. S17, ESI†). However, such centrifugation-based recovery was unattainable with the CD-intramolecular G-quadruplex control (sequence 2, Table S1, ESI†).
Previously, CD has been used as a crosslinker to create a linear array of DNA using non-G rich sequences (sequence 3, Table S1, ESI†) through Watson–Crick base pairing. This sequence was tested as a control that fails to impart any DNAzyme activity, virtually ruling out any solitary role of the CD in affecting the ABTS oxidation and hence, peroxidase activity.19 However, there is no instance of the creation of a G quadruplex mediated network array using CDs. There are only two illustrations where a G quadruplex linear array was created, one on streptavidin-coated magnetic nanoparticles for the biosensing of insulin and the other as a DNA-only self-assembled structure for potential use as a scaffold for functional molecules.8,20 In the first of its kind, we report the creation of an intermolecular G quadruplex nanoassembly where a highly fluorescent CD is being used as the crosslinker in a network that displayed significantly enhanced DNAzyme activity. The intramolecular CD–G quadruplex reported here also displayed an enhanced DNAzyme activity, albeit lower than that of the network assembly, and does not possess the versatility of easy DNAzyme recovery.
Conclusions
Our work demonstrates that the CD–G quadruplex–hemin nanonetwork represents a remarkable system with competent peroxidase activity more similar to that of its enzymatic counterpart (HRP) than the classical G quadruplex–hemin DNAzyme. This network array can oxidize ABTS significantly faster, which is attributed to the presence of the CDs that offer non-covalent interactions with hemin and present a confined yet favorable microenvironment for enhanced DNAzyme activity. Moreover, the nanoassembly offers the detection of product formation through a fluorescence response due to the presence of the CDs. The CD bound DNAzyme was easily reconstituted via ultracentrifugation/ethanol washing, a simple yet remarkable feat achieved for catalyst regeneration involving a G quadruplex DNAzyme. Thus, the function of the CDs in this work is clearly delineated as threefold: first, as a crosslinker to create the G quadruplex network that subsequently facilitates DNAzyme recovery; secondly, favorable interactions of the CDs with hemin facilitate electron transfer through the keto carbonyl functional groups on the surface of the CDs; third, to provide an alternative to the colorimetric detection of the peroxidase activity of the G quadruplex through the sensitive fluorescence response. All this is made possible due to the surface functional groups on the CDs that could be created by choosing appropriate substrates and fine-tuning the reaction conditions and their subsequently availability for various conjugation strategies, which are otherwise difficult to achieve with other carbon/metal-based nanoparticles. The nanoassembly reported here was also found to be stable at room temperature for more than three months. We believe the enhanced DNAzyme activity of the nanonetwork could be potentially used in biosensing and reaction engineering. We also envision its use in G quadruplex mediated drug delivery with the ability to track the loading and unloading of drugs in real-time through the fluorescence response of the CDs.
Conflicts of interest
There are no conflicts to declare.
Supplementary Material
Electronic supplementary information (ESI) available. See DOI: 10.1039/c9ra08290e
References
- (a) Kosman J. Juskowiak B. Anal. Chim. Acta. 2011;707:7–17. doi: 10.1016/j.aca.2011.08.050. [DOI] [PubMed] [Google Scholar]; (b) Willner I. Shlyahovsky B. Zayats M. Willner B. Chem. Soc. Rev. 2008;37:1153–1165. doi: 10.1039/B718428J. [DOI] [PubMed] [Google Scholar]; (c) Gong L. Zhao Z. Lv Y.-F. Huan S.-Y. Fu T. Zhang X.-B. Shen G.-L. Yu R.-Q. Chem. Commun. 2015;51:979–995. doi: 10.1039/C4CC06855F. [DOI] [PubMed] [Google Scholar]
- (a) Cheng X. Liu X. Bing T. Cao Z. Shangguan D. Biochemistry. 2009;48:7817–7823. doi: 10.1021/bi9006786. [DOI] [PubMed] [Google Scholar]; (b) Shimron S. Magen N. Elbaz J. Willner I. Chem. Commun. 2011;47:8787–8789. doi: 10.1039/C1CC12795K. [DOI] [PubMed] [Google Scholar]; (c) Liu J. Cao Z. Lu Y. Chem. Rev. 2009;109:1948–1998. doi: 10.1021/cr030183i. [DOI] [PMC free article] [PubMed] [Google Scholar]
- (a) Wang F. Lu C.-H. Willner I. Chem. Rev. 2014;114:2881–2941. doi: 10.1021/cr400354z. [DOI] [PubMed] [Google Scholar]; (b) Shimron S. Wang F. Orbach R. Willner I. Anal. Chem. 2012;84:1042–1048. doi: 10.1021/ac202643y. [DOI] [PubMed] [Google Scholar]; (c) Li T. Wang E. Dong S. Anal. Chem. 2010;82:1515–1520. doi: 10.1021/ac902638v. [DOI] [PubMed] [Google Scholar]
- (a) Zhao X.-H. Gong L. Zhang X.-B. Yang B. Fu T. Hu R. Tan W. Yu R. Anal. Chem. 2013;85:3614–3620. doi: 10.1021/ac303457u. [DOI] [PubMed] [Google Scholar]; (b) Li T. Dong S. Wang E. Anal. Chem. 2009;81:2144–2149. doi: 10.1021/ac900188y. [DOI] [PubMed] [Google Scholar]
- Zhou X.-H. Kong D.-M. Shen H.-X. Anal. Chem. 2010;82:789–793. doi: 10.1021/ac902421u. [DOI] [PubMed] [Google Scholar]
- Ghahremani Nasab M. Hassani L. Mohammadi Nejad S. Norouzi D. J. Biol. Phys. 2017;43:5–14. doi: 10.1007/s10867-016-9430-7. [DOI] [PMC free article] [PubMed] [Google Scholar]
- (a) Qi C. Zhang N. Yan J. Liu X. Bing T. Mei H. Shangguan D. RSC Adv. 2014;4:1441–1448. doi: 10.1039/C3RA45429K. [DOI] [Google Scholar]; (b) Li W. Li Y. Liu Z. Lin B. Yi H. Xu F. Nie Z. Yao S. Nucleic Acids Res. 2016;44:7373–7384. doi: 10.1093/nar/gkw634. [DOI] [PMC free article] [PubMed] [Google Scholar]; (c) Stefan L. Denat F. Monchaud D. Nucleic Acids Res. 2012;40:8759–8772. doi: 10.1093/nar/gks581. [DOI] [PMC free article] [PubMed] [Google Scholar]
- Rafati A. Zarrabi A. Abediankenari S. Aarabi M. Gill P. R. Soc. Open Sci. 2018;5:171835. doi: 10.1098/rsos.171835. [DOI] [PMC free article] [PubMed] [Google Scholar]
- Golub E. Albada H. B. Liao W.-C. Biniuri Y. Willner I. J. Am. Chem. Soc. 2016;138:164–172. doi: 10.1021/jacs.5b09457. [DOI] [PubMed] [Google Scholar]
- Li H. Xiao J. Fu Q. Bao X. Proc. Natl. Acad. Sci. 2017;114:5930–5934. doi: 10.1073/pnas.1701280114. [DOI] [PMC free article] [PubMed] [Google Scholar]
- Zhang W. Dai D. Chen X. Guo X. Fan J. Appl. Phys. Lett. 2014;104:091902. doi: 10.1063/1.4867487. [DOI] [Google Scholar]
- (a) Víglaský V. Bauer L. Tlučková K. Biochemistry. 2010;49:2110–2120. doi: 10.1021/bi902099u. [DOI] [PubMed] [Google Scholar]; (b) He Y. Neumann R. D. Panyutin I. G. Nucleic Acids Res. 2004;32:5359–5367. doi: 10.1093/nar/gkh875. [DOI] [PMC free article] [PubMed] [Google Scholar]; (c) Li Q. J. Tong X. J. Duan Y. M. Zhou J. Q. FEBS Lett. 2013;587:659–665. doi: 10.1016/j.febslet.2013.01.024. [DOI] [PubMed] [Google Scholar]
- Chiorcea-Paquim A.-M. Santos P. V. Eritja R. Oliveira-Brett A. M. Phys. Chem. Chem. Phys. 2013;15:9117–9124. doi: 10.1039/C3CP50866H. [DOI] [PubMed] [Google Scholar]
- Fraiji L. K. Hayes D. M. Werner T. C. J. Chem. Educ. 1992;69:424. doi: 10.1021/ed069p424. [DOI] [Google Scholar]
- (a) Neo J. L. Kamaladasan K. Uttamchandani M. Curr. Pharm. Des. 2012;18:2048. doi: 10.2174/138161212799958341. [DOI] [PubMed] [Google Scholar]; (b) Tuesuwan B. Kern J. T. Thomas P. W. Rodriguez M. Li J. David W. M. Kerwin S. M. Biochemistry. 2008;47:1896–1909. doi: 10.1021/bi701747d. [DOI] [PubMed] [Google Scholar]
- (a) Sato H. Shimada N. Masuda T. Maruyama A. Biomacromolecules. 2018;19:2082–2088. doi: 10.1021/acs.biomac.8b00201. [DOI] [PubMed] [Google Scholar]; (b) Fu Y. Zhao X. Zhang J. Li W. J. Phys. Chem. C. 2014;118:18116–18125. doi: 10.1021/jp503242e. [DOI] [Google Scholar]
- Goodwin D. C. Yamazaki I. Aust S. D. Grover T. A. Anal. Biochem. 1995;231:333–338. doi: 10.1006/abio.1995.0059. [DOI] [PubMed] [Google Scholar]
- Pagano B. Mattia C. A. Giancola C. Int. J. Mol. Sci. 2009;10:2935–2957. doi: 10.3390/ijms10072935. [DOI] [PMC free article] [PubMed] [Google Scholar]
- Kumari S. Solanki A. Mandal S. Subramanyam D. Das P. Bioconjugate Chem. 2018;29:1500–1504. doi: 10.1021/acs.bioconjchem.8b00173. [DOI] [PMC free article] [PubMed] [Google Scholar]
- Dutta K. Fujimoto T. Inoue M. Miyoshi D. Sugimoto N. Chem. Commun. 2010;46:7772–7774. doi: 10.1039/C0CC00710B. [DOI] [PubMed] [Google Scholar]
Associated Data
This section collects any data citations, data availability statements, or supplementary materials included in this article.


