Abstract
This work proposes a simple and efficient approach for the formation of short carbon nanotubes (CNTs) on graphene sheets. This paper investigates the effect of heat treatment time on the morphology of CNTs. The mechanism of the growth and disappearance of CNTs are also investigated. Graphene is added into ferric trichloride (FeCl3)–melamine solution to obtain a suspension. The suspension is dried with stirring, followed by a carbonization process under N2 atmosphere, resulting in the formation of CNTs on graphene sheets. The thus-prepared carbon material can be used as a kind of durable and efficient non-precious metal oxygen reduction reaction (ORR) electrocatalyst. The ORR activity of the catalyst with favorable performance is characterized and compared with a commercial Pt/C catalyst. The results show that the ORR electron transfer number of Fe–N/G with CNTs is 3.91 ± 0.02. The Fe–N/G-MFC achieves a maximum power density of 1210 ± 23 mW m−2, which is much higher than Pt/C-MFC (1080 ± 20 mW m−2). It demonstrates that Fe–N/G materials with CNTs can be a type of promising highly efficient catalyst and can enhance ORR performance of MFCs. Besides, the reason for the disappearance of CNTs we investigated in this study may provide some ideas for the study of loading metal oxide catalysts on CNTs.
Rod-like CNTs were formed on Fe–N doped graphene during a simple carbonization process, and the mechanism of the growth and disappearance of CNTs were also investigated.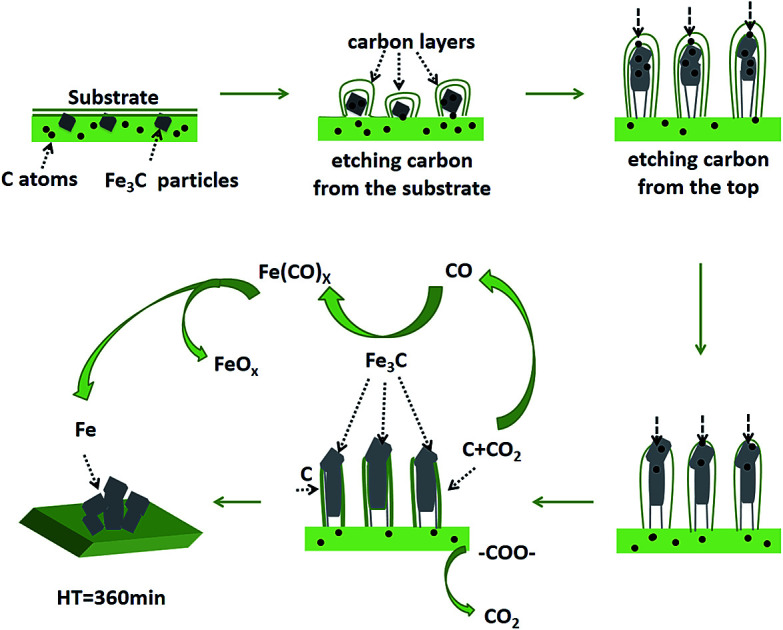
Introduction
A microbial fuel cell (MFC) is a promising technology to convert organic compounds directly to electricity using bacteria. This technology can be used in water treatment, environmental pollution control, biosensing techniques and so forth.1 Air-cathode MFCs with a simple single-chamber are typically considered as a promising configuration for wastewater treatment applications,2–4 since the oxygen as electron acceptor is constantly replenishment, cost effective and high redox potential of oxygen reduction.5 However, without catalysts the rate of the oxygen reaction reduction (ORR) is very low resulting in the poor performance of air-cathode MFCs.6 In recent years, Fe–N/C catalysts have received increasing attention due to their high activity toward ORR and superior stability and low cost compared to commercial Pt-based catalysts.7–9 The electrocatalytic activity and stability of these Fe–N/C materials are mainly boosted by the electronic and chemical interactions between the metal-based nanoparticles and N-doped carbons.10,11 When nitrogen atoms are doped into carbon lattices, the electronic and geometric structures of carbon are significantly modified. This doping process leads to non-uniform distribution of the spin and atom charge density, which can catalyse the ORR to water through a four-electron process without significant production of peroxide.12–16 Furthermore, it is believed that Fe–N coordination structures act as the most active catalytic sites.17 Even so, the type of carbon material also plays an important role.
Carbon materials have been getting increased attention in recent years, owing to its high conductivity, high surface energy, and easy to lose electron to show the reducibility. Graphene is a two-dimensional single atom thick sheet of sp2 hybridized carbon atoms arranged in a honeycomb lattice that exhibits superior electrical, mechanical, thermal, and chemical properties.18–20 It has a large surface area to disperse different nanoparticles and clusters. The produced nanocomposites possess not only both functions of pure graphene and the nanoparticle/cluster, but also some extraordinary synergetic effects.21,22 Although some carbon materials such as carbon black23 and CNTs24 show its excellent properties in MFCs, using graphene, by contrast, provides significant advantages as a catalyst support material.18–20 The previous studies indicated that functionalized graphene with iron and nitrogen (Fe–N/G) could enhance ORR performance of MFCs, which provided another potential candidate for ORR.25,26 However, the power density is not so high according to the previous studies, so there is still much room to improve the electrochemical performance of Fe–N/G catalysts.
Many studies have been reported to improve the performance of cathodic catalysts by mixing CNTs with other substances.27,28 But their electrochemical properties are relatively poor. Besides, Pt was still used in the latter study.28 There are also some studies on the growth of carbon nanotubes on graphene sheets using different methods.29–31 However, the preparations of their Fe–N/G materials are relatively complex, and it has not been applied to MFCs. In addition, Fe–N/C materials usually form non-uniformly pod-like or bamboo-like CNTs.32,33
Thus, in the present study, we try to use ferric trichloride (FeCl3)–melamine in combination with graphene (Fe–N/G) through a simple and efficient carbonization process to form short rod-like CNTs on graphene sheets. We studied the effect of the holding time (HT) at 800 °C on the formation and morphology of CNTs. The mechanism of the growth and disappearance of CNTs were investigated by structural characterization. The performances of the representative catalysts were analysed through electrochemical performance tests. Then electrocatalytic ORR of catalyst with best performance would be characterization. This study provides a new catalyst to improve the electrogenesis capacity in MFCs.
Experimental
Catalyst synthesis
This study adopted monolayer reduced graphene oxide (rGO) as the support of Fe–N compounds. The detailed experimental procedure for the preparation of the catalyst is described as follows. First, a water solution containing 20 mM FeCl3·6H2O and 20 mM melamine were prepared to form a Fe–N solution. Then, rGO powders were added into Fe–N solution to obtain suspensions with weight ratio of (Fe–N) to rGO of 4 : 1. These suspensions were dried with stirring at 80 °C. Second, these dried powders were carbonized under nitrogen gas at 800 °C with a heating rate of 5 °C min−1, and the HT were 60 min, 90 min, 150 min, 180 min, 240 min and 360 min respectively. After cooled to room temperature, Fe–N/G catalysts were obtained. And they were named as Fe–N/G-60, Fe–N/G-90, Fe–N/G-150, Fe–N/G-180, Fe–N/G-240 and Fe–N/G-360 respectively. Despite of HT, the preparation time of Fe–N/G catalysts was merely 3 h, improving the efficiency of the preparation process compared with methods described in other work.34–36
Cathode electrode preparation
Carbon cloths (HCP330, Heseng Co., Ltd., China) loaded 3.2 mg cm−2 catalysts were used as the cathode. The diffusion layer of carbon cloth was prepared by applying four layers of polytetrafluoroethylene (PTFE). The catalyst layer is a paste-like mixture of 23 mg Fe–N/G catalyst fines, 0.2 mL DI water, 1 mL iso-propanol, and 0.4 mL Nafion. The catalyst was coated on the side opposite the diffusion layer followed by drying at room temperature overnight. The detailed preparation can be found in ref. 37.
MFC construction and operation
Single chamber, cubic-shaped MFCs (Phychemi Co., Ltd., HK) were constructed with a 28 mL working volume. Both cathodes had a projected area of 7 cm2. Acid-treated pitch-based carbon fiber brush (2.5 cm in diameter and around 3 cm in length) with a titanium wire was used as anode,38–40 and it was placed horizontally in the cylindrical chamber with the edge of about 1 cm from the cathode. 1000 Ω external resistor was used in MFCs. The substrate of a MFC was made up of the volume ratio of wastewater to nutrient solution of 1 : 1. The composition of the nutrient solution was described elsewhere.41 All these tests were conducted at 30 °C.
Analysis and calculation
The output voltage of each MFC was measured across an external resistor (1000 Ω) using a data acquisition system (CT2001A, LANHE Co., Ltd., China) for current–voltage analysis. 4 h were needed to allow MFCs equilibrate at open circuit to get a stabilized open circuit voltage (OCV). Then the polarization data and the total (internal) resistance were measured by liner sweep voltammetry (scan rate 200 μV s−1) with the potentiostat from the open circuit potential to 0 V.42 Current density was calculated by I (mA m−2) = U/(RA), and power density was according to P (mW m−2) = UI/A, where U (mV) is the cell voltage, R (Ω) is the external resistance, and A (m−2) is the projected area of the cathode.
The morphology and structural features of Fe–N/G samples were characterized with a scanning electron microscope (SEM). The crystal structure of the catalysts were also characterized by using powder X-ray diffractometer (XRD). The surface functional groups were determined by X-ray photoelectron spectroscopy (XPS). To understand the composition of decomposed outlet gases, this work discusses the analysis of the thermogravimetry-mass spectrometry (TG-MS), which can help us to understand the changes of the morphology of CNTs.
The catalytic activity was determined from rotating disk electrode (RDE) measurements by recording the current–voltage curves at different electrode rotating rates. The overall electron transfer number of the ORR was calculated from the slopes of the Koutecky–Levich (K–L) plots which was described elsewhere.24
Results and discussion
SEM images of Fe–N/G catalysts
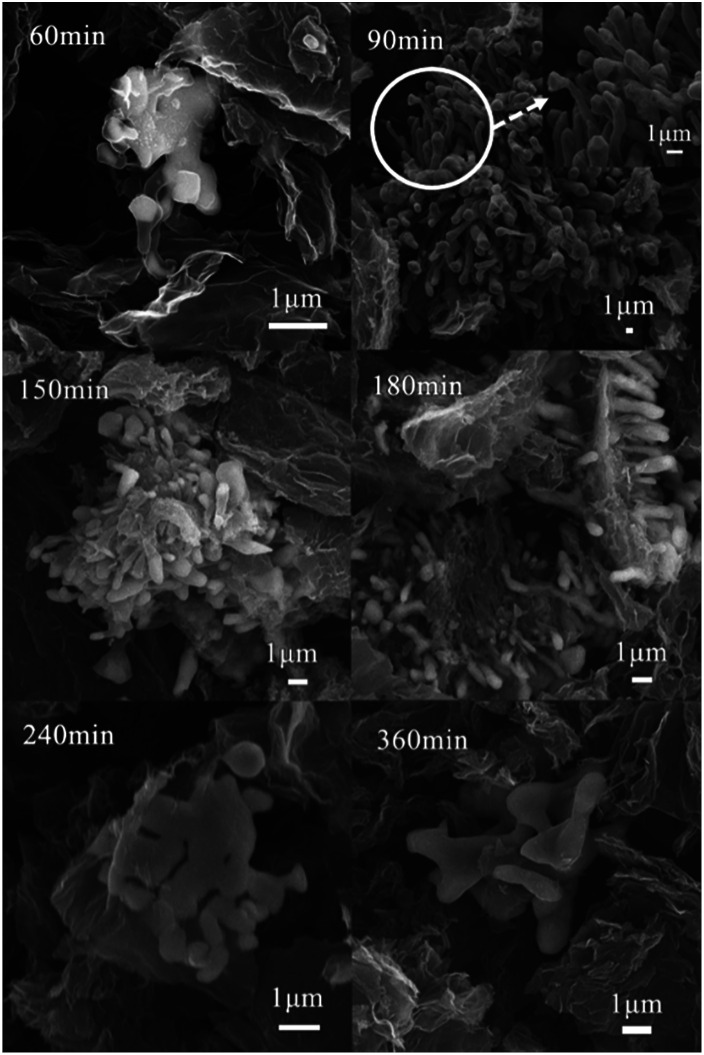
As shown in Fig. 1, there were some short rod-like CNTs were formed in the catalyst when the HT was 60, 90, 150 and 180 min. Their diameters were estimated to be in the range of 0.1–1 μm. The catalyst particles were wrapped in the CNTs. With the increase of HT from 60 min to 180 min, there was no obvious change in the morphology of CNTs. But when the HT increased to 240 min, CNTs disappeared. Some stacked and irregular particles were found in the catalyst. The exposed molten catalyst particles are easy to agglomerate due to the high mobility and high reactivity of metal atoms. In order to explore the causes of morphological differences of the Fe–N/G catalysts, and the mechanism of formation and disappearance of CNTs, XRD analysis was carried out.
Fig. 1. SEM images of Fe–N/G catalysts with different HT.
XRD analysis
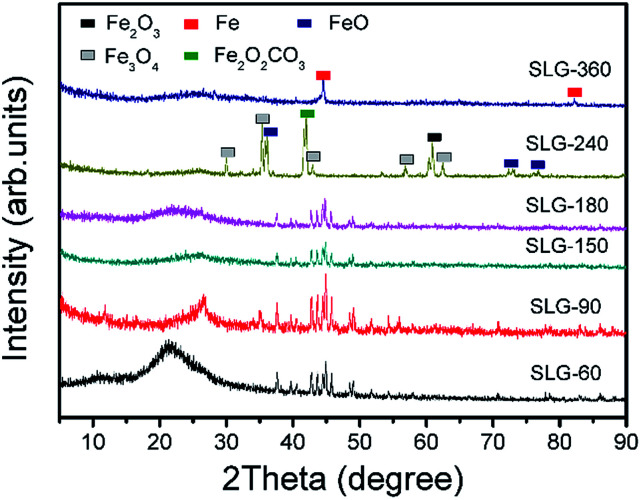
When the HT was 60–180 min, there were several significant diffraction peaks observed at 2θ = 26.1°, 37.6°, 42.7°, 43.7°, 45.0° and 49.1° which represent the crystalline lattice facets of C (002), Fe3C (121), Fe2N (121), Fe3N (111), Fe3C (031), and Fe3C (221) plane, respectively. It indicated that Fe was associated with C as well as N, and the crystallized Fe–C and Fe–Nx composites were formed during the carbonization. The broad C (002) peak indicated the amorphous structure of carbon in the N-doped graphene lattice.24 From Fig. 2, we can clearly see that when the HT was 90 min, Fe–C and Fe–Nx in graphene were better crystallized. When the HT was 240 min, the peak of Fe3C and FeNx disappeared. There were some crystalline peaks of iron oxides instead. When the HT was 360 min, there was only the peaks of Fe exists.
Fig. 2. XRD patterns of Fe–N/G catalysts with different HT.
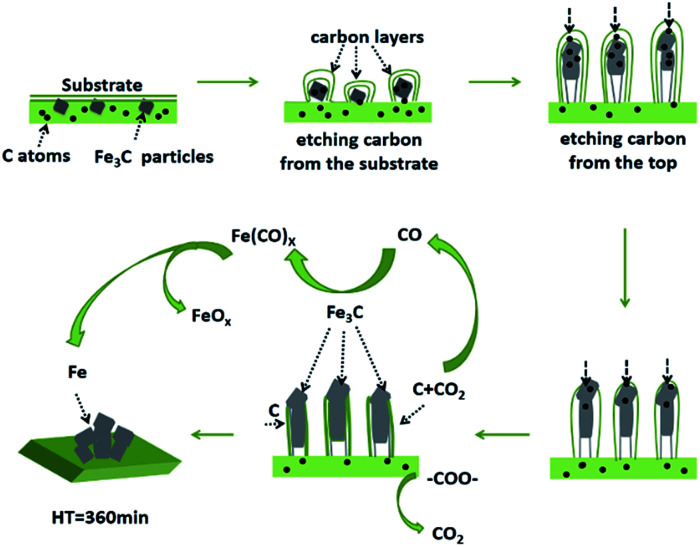
The change of the combined state of Fe illustrated how the CNTs grew and disappeared. The formation of CNTs was mainly due to that FeCl3 was decomposed, reduced and transformed into molten state of Fe at first during the carbonization. Fe play a key role in the formation of carbon nanosheets. Then the carbon was absorbed into the molten metal to form a solid solution with iron.43,44 Fe3C particles were trapped by the carbon shells at 800 °C.
With the catalyst particle continuing to etch the carbon layer and adsorb as well as dissolve carbon clusters, it made the carbon concentration of catalyst particles increase. When the carbon concentration reached the saturation, the graphite layer would be deposited on the surface of the catalyst, and the catalyst was elongated and grew under the expansion force caused by etching carbon substrate continuously. When CNTs grew to a certain degree, they would stop growing. It could be caused by following reasons: (1) the longer diffusion path for the formation of bigger catalyst particles,45,46 (2) the internal carbon concentration gradient of catalysts disappear,45,46 (3) the catalyst surface was further wrapped by the precipitated graphite layer,47 (4) the accessible carbon source was exhausted.48 Finally, such short CNTs were formed (Fig. 1), offering more graphene edge, increasing in ORR active sites, and making Fe–N/G possess excellent electrocatalytic activity.
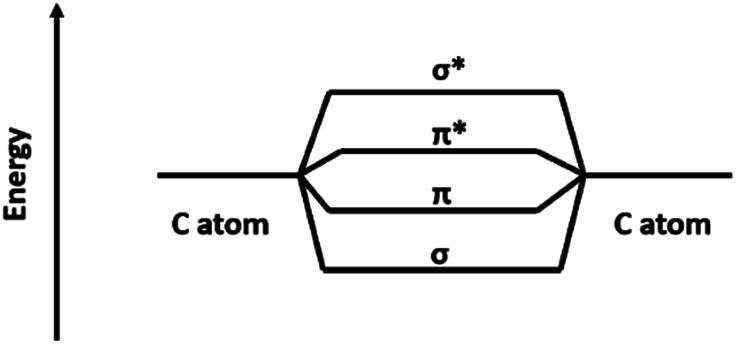
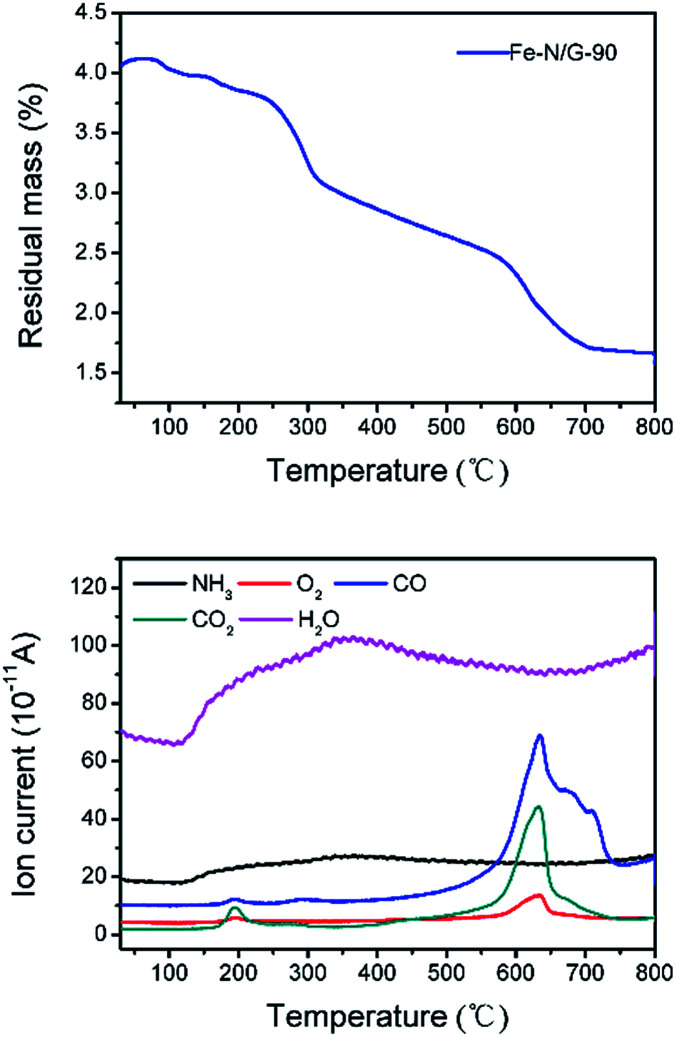
CNTs can be considered as a crimping of graphene sheets, so the carbon atoms are connected by a π bond or σ bond. This bonding mode can reduce the energy of the system (Fig. 3), and it can be decompose or form an antibonding state by applying external energy. Then, it is possible for the external atoms to combine with these carbon atoms to join the system. When the carbonization was carried out to a certain stage, CO2 was formed by thermal decomposition of oxygen-containing functional groups of graphene (Fig. 4). Then, CO2 reacted with the active carbon atoms on the surface of CNTs, and CO was produced (Fig. 5). When the CO2 contacts with the carbon atoms of the CNTs, its electronic absorption capability provides energy to the system. Thus, CNTs disappeared gradually. Then, carbonyl iron (Fe(CO)x) was formed by the reaction of CO and Fe3C, and it broke down into Fe and FeOx at high temperature.49,50 And FeOx was further reduced to Fe by C and CO. Thus, the pure Fe was formed eventually (HT = 360 min).
Fig. 3. Energy sketch for C atom, different bond and anti-bond.
Fig. 4. TG-MS analysis of Fe–N/G-90 pyrolyzed up to 800 °C.
Fig. 5. Mechanism of growth and disappearance of CNTs on graphene sheets.
In order to explore the effect of so-formed Fe–N/G with CNTs on the electrochemical performance, the output voltages, multicycle power densities and polarization curves of some significant catalysts were measured.
Performance of Fe–N/G-MFC
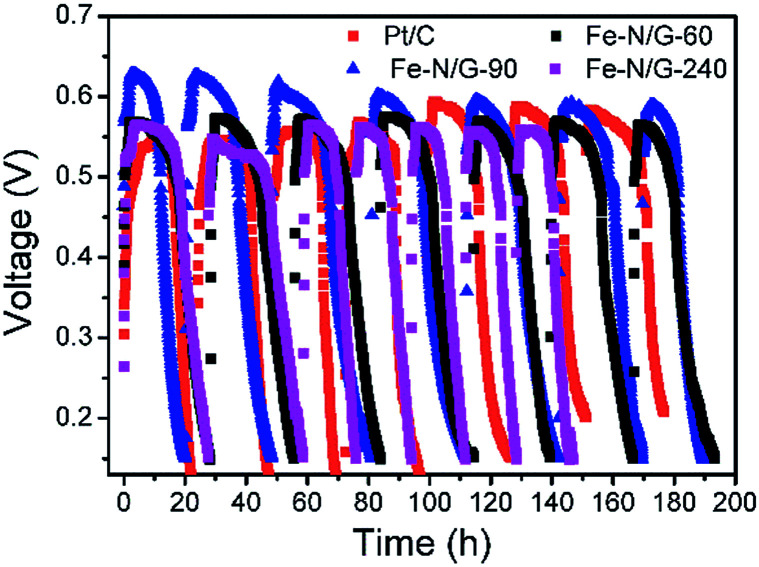
Fe–N/G-60, Fe–N/G-90 (as the representative of Fe–N/G with CNTs) and Fe–N/G-240 were applied on the air-cathode of MFCs. All of the MFCs were operated for four weeks at least. The output voltage profiles are shown in Fig. 6. For each cycle, when the fresh substrate was added, electricity started to generate and the output voltage of MFCs rose rapidly until it reached a certain level and then operated in a stable status. When the amount of nutrient substance reduced to a certain extent, the output voltage started to decline. As the voltage dropped to 150 mV, the substrate was almost exhausted and this cycle was completed. Repeatable and stable voltage of 571 ± 6 mV was obtained in Fe–N/G-60-MFC with the 1000 Ω external resistors, voltage of 610 ± 23 mV in Fe–N/G-90-MFC, voltage of 559 ± 11 mV in Fe–N/G-240-MFC, and voltage of 568 ± 24 mV in Pt/C-MFC. From this result, we can see that the oxides of iron also have certain catalytic activity. During the operation, the stable output voltages of MFCs slightly decreased, and achieved stable state in the latter several cycles. Compared with Pt/C-MFC, the performance of Fe–N/G-90-MFC was in a favorable condition, indicating a higher ORR efficiency at the cathode of MFC.
Fig. 6. Voltage output variation trend of Fe–N/G- and Pt/C-MFC.
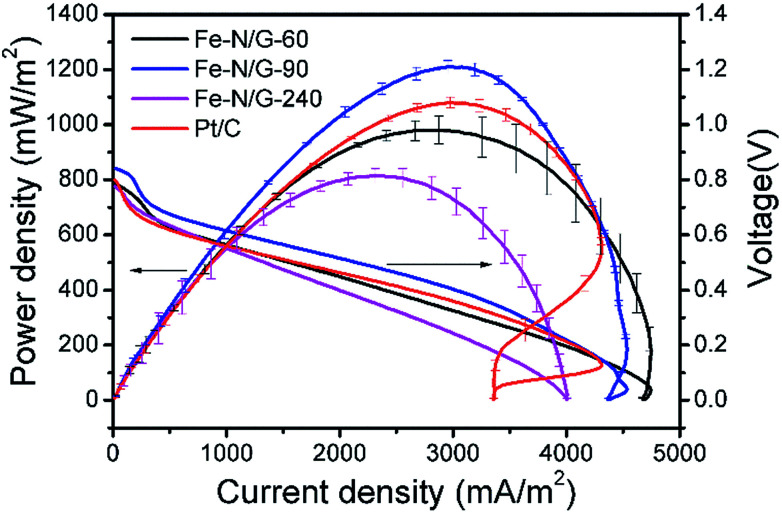
Fig. 7 exhibited that the Fe–N/G-90-MFC produced a maximum power density of 1210 ± 23 mW m−2 after four weeks, which was 23.3% higher than that of Fe–N/G-60-MFC (981 ± 49) mW m−2, 48.6% higher than that of Fe–N/G-240-MFC (814 ± 28) mW m−2 and 12% higher than that of Pt/C-MFC (1080 ± 20) mW m−2. Obviously, Fe–N/G-90-MFC had a relatively high electrogenesis capacity.
Fig. 7. The comparison of multicycle power density and polarization curves among Pt/C-MFC and Fe–N/G-MFCs.
The internal resistance of Fe–N/G-90-MFC and Pt/C-MFC were much the same (150 Ω), which were obtained by fitting the polarization curves. But the internal resistance of Fe–N/G-60-MFC (171 Ω) and Fe–N/G-240-MFC (223 Ω) were relatively high. The results indicated that the electricity generation performance of Fe–N/G-90 with short rod-like CNTs is comparable to that of Pt/C material.
To investigate the reasons why Fe–N/G-90 has better electrochemical performance among the Fe–N/G catalysts, it was characterized by XPS analysis.
XPS analysis
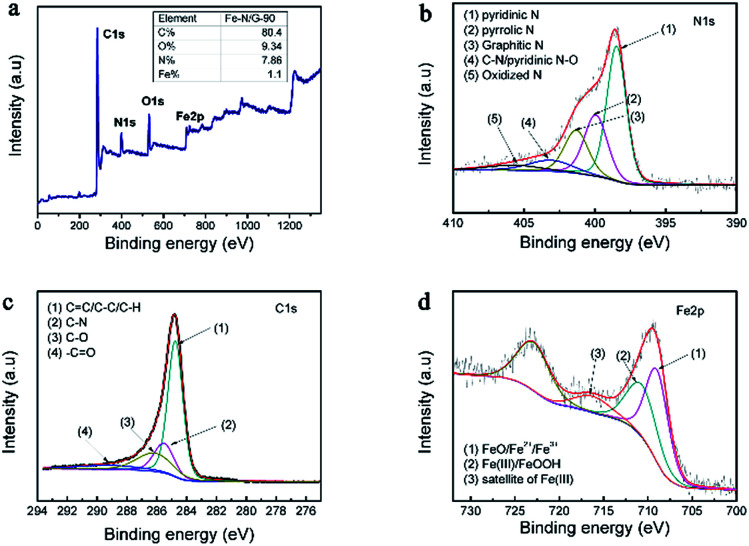
The full XPS spectrum (Fig. 8a) of Fe–N/G-90 clearly showed the presence of C, O, N, and Fe elements.
Fig. 8. XPS spectra of catalysts: (a) is XPS full-scan spectrum, and (b–d) are N 1s, Fe 2p and C 1s regions of Fe–N/G-90, respectively.
The N 1s spectrum (Fig. 8b) of Fe–N/G-90 consist of pyridinic-N (398.56 eV), pyrrolic-N (399.98 eV), C–N/pyridinic N–O (403.20 eV), graphitic-N (401.50 eV) and oxidized-N (405.60 eV).24,36,50,51 Their content are displayed in Table 1. Pyridinic-N is a nitrogen atom that bonds to two carbon atoms on the edge of a carbon plane and a carbon vacancy. The presence of pyridinic-N and graphitic-N species in XPS indicated that nitrogen functional groups were bonded to the carbon matrix during carbonization. The formation of Fe–Nx bonds in the catalysts is due to the coordination of pyridinic-N with Fe.24 Many electrocatalytic reactions show an increasing kinetics on carbon edge planes comparing with basal planes. This increase in activity is attributed to pyridinic-N of edge planes to be easy to chemisorb oxygen.52 Besides, pyridinic-N and graphite-N also increase the electron-donating ability of nitrogen-containing carbon-based catalysts, and transition metals like Fe can stabilize the incorporation of N within the carbon matrix, thus promoting the electrocatalysis of ORR.53,54
Element percentages of Fe–N/G-90.
| Element (%) | C–O | C O | O–C O | Pyridinic-N | Graphitic-N |
|---|---|---|---|---|---|
| Fe–N/G-90 | 16.8 | 18.4 | 7.3 | 53.3 | 17.6 |
The spectra about C 1s of Fe–N/G was exhibited in Fig. 8c. The peaks at 284.7 eV, 285.6 eV, 286.6 eV and 289.5 eV correspond to the sp2-hybridized graphitic carbon, C–O or C–N, C O, and O–C O configurations, respectively. The large peak at 284.7 eV reveals that sp2C is the dominant configuration in these Fe–N/G catalysts. Quantificationally, as shown in Table 1, the contents of C–O, O–C O and C O in Fe–N/G were 16.8%, 7.3%, 18.4% respectively. It revealed that O-containing functional groups were generated, leading to more negative surface charges, which are the active sites for Fe loadings including adsorption, coordination and replacement (Table 1).55,56
The Fe 2p XPS spectra were shown in Fig. 8d. According to the reports,57,58 Fe 2p peaks at 711.3 eV are due to Fe(iii) species coordinating to nitrogen or oxygen. Fe(iii) can be combined with pyridinic-N to form Fe–Nx structure, and this is a major factor in the catalytic activity which we have discussed above.
Indeed, Wen-jie Jiang et al. have discussed the effect of Fe–N coordination structures on the active catalytic sites of ORR.22 The conclusion are as follows: (1) N-doped carbon substrate, Fe/Fe3C nanocrystals or Fe–Nx themselves did not deliver the high activity; (2) the catalysts with both Fe/Fe3C nanocrystals and Fe–Nx exhibited the high activity; (3) the higher content of Fe–Nx gave the higher activity; (4) the removal of Fe/Fe3C nanocrystals severely degraded the activity; (5) the blocking of Fe–Nx downgraded the activity and the recovery of the blocked Fe–Nx recovered the activity. These facts supported that the high ORR activity of the Fe@C–FeNC electrocatalysts should be ascribed to that Fe/Fe3C nanocrystals boost the activity of Fe–Nx.
Electrocatalytic ORR characterization
RDE test was performed to evaluate the electrocatalytic activity of Fe–N/G-90 electrocatalyst in PBS solution with 50 mM O2-saturated and pH-neutral. To prepare the working electrode, 2 mg of as-prepared Fe–N/G-90 electrocatalyst were dispersed in 2 mL deionized (DI) water under sonication for 30 min to produce homogeneous catalyst ink. Then 429 μL of Nafion binder solution was added and vortex for 10 min. 30 μL suspension was dropped onto glass carbon electrode, giving the loading of 0.1 mg cm−2. The same method was used for Pt/C electrocatalyst.
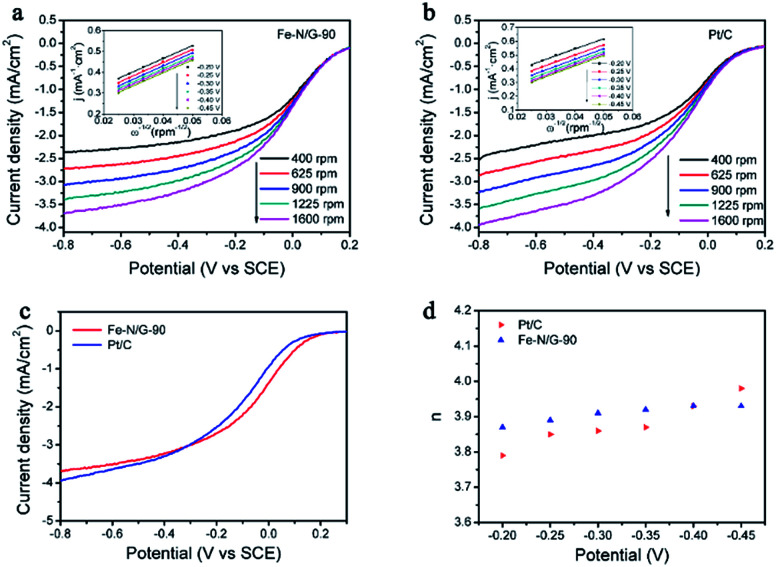
Fig. 9 demonstrated the results of linear polarization sweeping of the electrocatalysts at various rotating rates from 1600 to 400 rpm, and the K–L plots were profiled as insets in the figures based on K–L equation. The electron transfer number (n) of Fe–N/G-90 for ORR was 3.91 ± 0.02, indicating that Fe–N/G catalyst dominantly proceeded through a four-electron reaction pathway. Moreover, under the 1600 rpm rotating speed, the onset potential for Fe–N/G-90 was determined to be a little more positive than Pt/C at nearly 0.2 V. This results show that Fe–N/G with rod-like CNTs displayed excellent ORR catalytic activity.
Fig. 9. RDE polarization curves and calculated electron transfer number of Fe–N/G-90 and Pt/C (inset: the K–L plots of catalysts at various potentials derived from RDE data).
Based on the structural and compositional characterizations of Fe–N/G-90, we think that four important aspects should be responsible for its excellent ORR activity: (1) high percentage of pyridinic N (53.3%) doped into the CNTs can promote O2 adsorption due to the reduced the local work function of carbon caused by the increase current density of the C atoms, and also enhanced hydrophilicity strengthening the electrolyte–electrode interaction. (2) Short rod-like CNTs can offer more graphene edge, thus introducing more ORR active sites for larger turnover frequency per active site. (3) The Fe3C particles wrapped in the CNTs are electrochemically active for ORR due to their proper ability to adsorb oxygen. (4) The encapsulated metal nanoparticles can lead to a unique host–guest electronic interaction and change the local work function of the CNT walls, making the outer surface of the graphite layer more active to ORR.59,60
Conclusions
In this study, a facile method of thermal treatment has been used for the formation of rod-like CNTs in Fe–N/G catalyst. It not only improves the electrogenesis capacity but also effectively reduces the cost of the preparation of the high performance cathodic catalyst. It is conducive to the expansion of MFC applications. Furthermore, we found that Fe–N/G-90 has favorable electrogenesis capacity. Besides, Fe–N/G-90 has an excellent electro-catalytic activity for ORR in neutral PBS owing to its high loading of Fe–Cx and Fe–Nx composites. The electron transfer numbers (n) of Fe–N/G-90 for ORR was 3.91 ± 0.02. The maximum power density of 1210 ± 23 mW m−2 obtained with Fe–N/G catalyst in a MFC was higher than that of Pt/C catalyst (1080 ± 20 mW m−2), which means the as-prepared Fe–N/G catalyst with rod-like CNTs displayed superior ORR activity in neutral medium to commercial Pt/C, which has a good application prospects in MFCs. Besides, the reason for the disappearance of CNTs we investigated in this study may provide some ideas for the study of loading metal oxide catalysts on CNTs.
Conflicts of interest
There are no conflicts to declare.
Supplementary Material
References
- Logan B. E. Hamelersh B. Rozendal R. Schröder U. Keller J. Freguia S. Aelterman P. Rabaey K. Environ. Sci. Technol. 2006;40:5181–5192. doi: 10.1021/es0605016. [DOI] [PubMed] [Google Scholar]
- Ahn Y. H. Adv. Mater. Res. 2013;684:230–233. doi: 10.4028/www.scientific.net/AMR.684.230. [DOI] [Google Scholar]
- Bidart C. Fröhling M. Schultmann F. Appl. Energy. 2014;113:404–413. doi: 10.1016/j.apenergy.2013.07.028. [DOI] [Google Scholar]
- Liu H. Ramnarayanan R. Logan B. E. Environ. Sci. Technol. 2004;38:2281–2285. doi: 10.1021/es034923g. [DOI] [PubMed] [Google Scholar]
- Jadhav D. A. Ghadge A. N. Mondal D. Ghangrekar M. M. Bioresour. Technol. 2014;154:330–335. doi: 10.1016/j.biortech.2013.12.069. [DOI] [PubMed] [Google Scholar]
- Zhao F. Harnisch F. Schröder U. Scholz F. Bogdanoff P. Herrmann I. Environ. Sci. Technol. 2006;40:5193–5199. doi: 10.1021/es060332p. [DOI] [PubMed] [Google Scholar]
- Tian J. Morozan A. Sougrati M. T. Chenitz R. Dodelet J. P. Jones D. Jaouen F. Angew. Chem., Int. Ed. 2013;125:7005–7008. doi: 10.1002/ange.201303025. [DOI] [PubMed] [Google Scholar]
- Jaouen F. Proietti E. Lefèvre M. Chenitz R. Dodelet J. Wu G. Chung H. Johnston C. Zelenay P. Energy Environ. Sci. 2011;4:114–130. [Google Scholar]
- Wang Y. C. Lai Y. J. Song L. Zhou Z. Y. Liu J. G. Wang Q. Yang X. D. Chen C. Shi W. Zheng Y. P. Angew. Chem., Int. Ed. 2015;127:10045–10048. doi: 10.1002/ange.201503159. [DOI] [Google Scholar]
- Li J. Wang Y. Zhou T. Zhang H. Sun X. Tang J. Zhang L. Alenizi A. M. Yang Z. Zheng G. J. Am. Chem. Soc. 2015;137:14305–14312. doi: 10.1021/jacs.5b07756. [DOI] [PubMed] [Google Scholar]
- Iwase K. Yoshioka T. Nakanishi S. Hashimoto K. Kamiya K. Angew. Chem. 2015;127:11220–11224. doi: 10.1002/ange.201503637. [DOI] [PubMed] [Google Scholar]
- Fierro C. Anderson A. B. Scherson D. A. J. Phys. Chem. 1988;92:6902–6907. doi: 10.1021/j100335a013. [DOI] [Google Scholar]
- Feng L. Chen Y. Chen L. ACS Nano. 2011;5:9611–9618. doi: 10.1021/nn202906f. [DOI] [PubMed] [Google Scholar]
- Chlistunoff J. J. Phys. Chem. C. 2011;115:6496–6507. [Google Scholar]
- Zhang L. Xia Z. J. Phys. Chem. C. 2011;115:11170–11176. [Google Scholar]
- Lefèvre M. Proietti E. Jaouen F. Dodelet J.-P. J. Science. 2009;324:71–74. doi: 10.1126/science.1170051. [DOI] [PubMed] [Google Scholar]
- Zhou R. Jaroniec M. Qiao S. Z. ChemCatChem. 2015;7:3808–3817. doi: 10.1002/cctc.201500411. [DOI] [Google Scholar]
- Wu Z. S. Pei S. Ren W. Tang D. Gao L. Liu B. Li F. Liu C. Cheng H. Adv. Mater. 2009;21:1756–1760. doi: 10.1002/adma.200802560. [DOI] [Google Scholar]
- Lai L. Chen L. Zhan D. Sun L. Liu J. Lim S. Poh C. Shen Z. Lin J. Carbon. 2011;49:3250–3257. doi: 10.1016/j.carbon.2011.03.051. [DOI] [Google Scholar]
- Guo F. Silverberg G. Bowers S. Kim S. Datta D. Shenoy V. Hurt R. Environ. Sci. Technol. 2012;46:7717–7724. doi: 10.1021/es301377y. [DOI] [PMC free article] [PubMed] [Google Scholar]
- Neto A. H. C. Guinea F. Peres N. M. R. Novoselov K. S. Geim A. K. Rev. Mod. Phys. 2009;81:109. doi: 10.1103/RevModPhys.81.109. [DOI] [Google Scholar]
- Jiang W. J. Gu L. Li L. Zhang Y. Zhang X. Zhang L. J. Wang J. Q. Hu J. S. Wei Z. Wan L. J. J. Am. Chem. Soc. 2016;138:3570–3578. doi: 10.1021/jacs.6b00757. [DOI] [PubMed] [Google Scholar]
- Zhang F. Cheng S. Pant D. Bogaert G. V. Logan B. E. Electrochem. Commun. 2009;11:2177–2179. doi: 10.1016/j.elecom.2009.09.024. [DOI] [Google Scholar]
- Peng L. You S. J. Wang J. Y. Biosens. Bioelectron. 2010;25:1248–1251. doi: 10.1016/j.bios.2009.10.002. [DOI] [PubMed] [Google Scholar]
- Li S. Hu Y. Xu Q. Sun J. Hou B. Zhang Y. J. Power Sources. 2012;213:265–269. doi: 10.1016/j.jpowsour.2012.04.002. [DOI] [Google Scholar]
- Liu Y. Jin X. J. Dionysiou D. D. Liu H. Huang Y. J. Power Sources. 2015;278:773–781. doi: 10.1016/j.jpowsour.2014.12.134. [DOI] [Google Scholar]
- Halakoo E. Khademi A. Ghasemi M. Yusof N. Gohari R. Ismail A. Procedia CIRP. 2015;26:473–476. doi: 10.1016/j.procir.2014.07.034. [DOI] [Google Scholar]
- Kwon S. S. Jung Y. Kim S. J. Nanosci. Nanotechnol. 2016;16:8598–8601. doi: 10.1166/jnn.2016.12501. [DOI] [Google Scholar]
- Rao R. Chen G. Arava L. M. Arava R. Kalaga K. Ishigami M. Heinz T. F. Ajayan P. M. Harutyunyan A. R. Sci. Rep. 2013;3:1891. doi: 10.1038/srep01891. [DOI] [PMC free article] [PubMed] [Google Scholar]
- Gan X. Lv R. Bai J. Zhang Z. Wei J. Huang Z. H. Zhu H. Kang F. Terrones M. 2D Mater. 2015;2:034003. doi: 10.1088/2053-1583/2/3/034003. [DOI] [Google Scholar]
- Higgins D. C. Hoque M. A. Hassan F. Choi J. Y. Kim B. Chen Z. ACS Catal. 2014;4:2734–2740. doi: 10.1021/cs5003806. [DOI] [Google Scholar]
- Yang W. Liu X. Yue X. Jia J. Guo S. J. Am. Chem. Soc. 2015;137:1436–1439. doi: 10.1021/ja5129132. [DOI] [PubMed] [Google Scholar]
- Deng D. Yu L. Chen X. Wang G. Jin L. Pan X. Deng J. Sun G. Bao X. Angew. Chem., Int. Ed. 2013;52:371–375. doi: 10.1002/anie.201204958. [DOI] [PubMed] [Google Scholar]
- Bezerra C. W. B. Zhang L. Lee K. Liu H. Zhang J. Shi Z. Marques A. L. B. Marques E. P. Wu S. Zhang J. Electrochim. Acta. 2008;53:7703–7710. doi: 10.1016/j.electacta.2008.05.030. [DOI] [Google Scholar]
- Li X. Liu G. Popov B. N. J. Power Sources. 2010;195:6373–6378. doi: 10.1016/j.jpowsour.2010.04.019. [DOI] [Google Scholar]
- Xia X. Zhang F. Zhang X. Liang P. Huang X. Logan B. E. ACS Appl. Mater. Interfaces. 2013;5:7862–7866. doi: 10.1021/am4018225. [DOI] [PubMed] [Google Scholar]
- Middaugh J., Cheng S., Liu W. and Wagner R., How to make cathodes with a diffusion layer for single-chamber microbial fuel cells, 2006, available: http://www.engr.psu.edu/ce/enve/logan/bioenergy/pdf/Cathode_093008.pdf
- Cheng S. Liu H. Logan B. E. Electrochem. Commun. 2006;8:489–494. doi: 10.1016/j.elecom.2006.01.010. [DOI] [Google Scholar]
- Feng Y. Yang Q. Wang X. Logan B. E. J. Power Sources. 2010;195:1841–1844. doi: 10.1016/j.jpowsour.2009.10.030. [DOI] [Google Scholar]
- Xie Y. Ma Z. Song H. Wang H. Xu P. Improving the performance of microbial fuel cells by reducing the inherent resistivity of carbon fiber brush anodes. J. Power Sources. 2017;348:193–200. doi: 10.1016/j.jpowsour.2017.02.083. [DOI] [Google Scholar]
- Liang P. Huang X. Fan M. Z. Cao X. X. Wang C. Appl. Microbiol. Biotechnol. 2007;77:551–558. doi: 10.1007/s00253-007-1193-4. [DOI] [PubMed] [Google Scholar]
- Fang B. Chaudhari N. K. Kim M. S. Kim J. H. Yu J. S. J. Am. Chem. Soc. 2009;131:15330–15338. doi: 10.1021/ja905749e. [DOI] [PubMed] [Google Scholar]
- Dai H. Rinzler A. G. Nikolaev P. Thess A. Colbert D. T. Smalley R. E. Chem. Phys. Lett. 1996;260:471–475. doi: 10.1016/0009-2614(96)00862-7. [DOI] [Google Scholar]
- Liu T. Wang K. Song S. Brouzgou A. Tsiakaras P. Wang Y. Electrochim. Acta. 2016;194:228–238. doi: 10.1016/j.electacta.2015.12.185. [DOI] [Google Scholar]
- Baker R. T. K. Carbon. 1989;27:315–323. doi: 10.1016/0008-6223(89)90062-6. [DOI] [Google Scholar]
- Feng D. Kim Bolton A. Rosén A. J. Phys. Chem. B. 2010;108:17369–17377. [Google Scholar]
- Dai H. Rinzler A. G. Nikolaev P. Thess A. Colbert D. T. Smalley R. E. Chem. Phys. Lett. 1996;260:471–475. doi: 10.1016/0009-2614(96)00862-7. [DOI] [Google Scholar]
- Gorbunov A. Jost O. Pompe W. Graff A. Carbon. 2002;40:113–118. doi: 10.1016/S0008-6223(01)00080-X. [DOI] [Google Scholar]
- Liu S. Tang X. Mastai Y. Felner I. Gedanken A. J. Mater. Chem. 2000;10:2502–2506. doi: 10.1039/B004901H. [DOI] [Google Scholar]
- Schroeder D. Fiedler A. Schwarz J. Schwarz H. Chem. 1994;33:5094–5100. [Google Scholar]
- Zhu N. Huang J. Shen W. Tu L. Wu P. Ma H. Int. J. Electrochem. Sci. 2015;10:2634–2645. [Google Scholar]
- Kinoshita K. J. Am. Chem. Soc. 1988;3:541. [Google Scholar]
- Liu G. Li X. Ganesan P. Popov B. N. Appl. Catal., B. 2009;93:156–165. doi: 10.1016/j.apcatb.2009.09.025. [DOI] [Google Scholar]
- Gong K. Du F. Xia Z. Durstock M. Dai L. Science. 2009;323:760–764. doi: 10.1126/science.1168049. [DOI] [PubMed] [Google Scholar]
- Yan Z. Wang M. Huang B. Liu R. Zhao J. Int. J. Electrochem. Sci. 2013;8:149–158. [Google Scholar]
- Yu H. Jin Y. G. Peng F. Wang H. J. Yang J. J. Phys. Chem. C. 2008;112:6758–6763. [Google Scholar]
- Zhao Y. Watanabe K. Hashimoto K. J. Mater. Chem. A. 2013;1:1450–1456. [Google Scholar]
- Park H. Ayala P. Deshusses M. A. Mulchandani A. Choi H. Myung N. V. Chem. Eng. J. 2008;139:208–212. doi: 10.1016/j.cej.2007.10.025. [DOI] [Google Scholar]
- Zhang X. Deng J. Wang N. Deng D. Zhang W. H. Bao X. Li C. Angew. Chem., Int. Ed. 2014;53:7023. doi: 10.1002/anie.201400388. [DOI] [PubMed] [Google Scholar]
- Chung H. T. Won J. H. Zelenay P. Nat. Commun. 2013;4:1922. doi: 10.1038/ncomms2944. [DOI] [PMC free article] [PubMed] [Google Scholar]


