Abstract
Studies have reported that the competing endogenous RNA (ceRNA) networks are related to disease progression and prognosis in patients with hepatocellular carcinoma (HCC). The roles and mechanisms of long-chain non-coding RNA AP003469.4 in HCC have remained unclear. Here, we explored the roles of AP003469.4 in HCC progression using bioinformatics, CCK-8, Transwell assay, etc. AP003469.4 targets miRNAs and these target genes were predicted by the LncBase Predicted v.2, miRDB, miRTarBase, and TargetScan databases. Then, AP003469.4-associated ceRNA network was constructed. Biological functions and mechanisms of differentially expressed genes in the ceRNA network were explored using GO and KEGG. Survival analysis and Cox regression analysis were used to screen prognostic genes and construct a prognostic risk model. The results revealed that AP003469.4, with the area under the curve of 0.9048, was highly expressed in HCC tissues. Increased expression of AP003469.4 was an independent risk factor for the dismal prognosis of HCC patients and was associated with the short overall and disease-free survival. Downregulation of AP003469.4 expression inhibited cell proliferation, cycle transition, invasion, and migration, and promoted cell apoptosis. There were 489 differentially expressed target genes in the ceRNA network, which were involved in several pathways, such as the MAPK signaling pathway, cell cycle, and p53 signaling pathway. The risk model was based on the DTYMK, ZFC3H1, CBX2, PKM, TTC26, ATG10, TAGLN2, CD3EAP, SHISA9, SLC1A5, KPNA2, SCML2, E2F7, and SMARCD1, which were the independent risk factors for poor prognosis of HCC patients. In general, interference with AP003469.4 expression might delay the progression of HCC. AP003469.4 related network could help to identify the hub target molecules in HCC progression, which might be candidate biomarkers for evaluating the prognosis of HCC patients.
Keywords: AP003469.4, competing endogenous RNAs, disease-free survival, overall survival, hepatocellular carcinoma
Introduction
Liver cancer is one of the most common malignant tumors worldwide, ranking seventh in terms of prevalence, with liver cancer-related mortality ranking second [1]. Due to lack of specific clinical characteristics at an early stage of liver cancer, the patients are always at an advanced stage when cancer is detected [2]. With advancement in surgery, radiotherapy, chemotherapy, radiofrequency ablation, targeted therapy, and immunotherapy, the five-year survival time of patients with liver cancer has increased, but the prognosis remained poor, and the five-year recurrence rate was also as high as 70% [2,3]. Therefore, it is crucial to find new means to improve the prognosis of HCC patients.
Many studies have shown that long-chain non-coding RNA (lncRNA) plays important roles in tumorigenesis, vascular invasion, and distant metastasis in hepatocellular carcinoma (HCC) [4,5]. For example, Teng et al. reported that lncRNA MYLK-AS1 is overexpressed in HCC tissues and cells, and the increased expression of MYLK-AS1 was associated with overall survival (OS) and progression-free survival (PFS) of HCC patients. Downregulated expression of MYLK-AS1 could inhibit angiogenesis, proliferation, invasion, and metastasis of HCC cells. The MYLK-AS1/miR-424-5p/E2F7 competing endogenous RNA (ceRNA) network was reported to be involved in angiogenesis, growth, and migration of HCC cells [4]. Jin et al. found that LINC00346, CDK1, and CCNB1 were highly expressed, whereas miR-199a-3p had low expression in HCC tissues. The overexpression of LINC00346, CDK1, and CCNB1 promoted cell cycle transformation and invasion of HCC cells, and inhibited cell apoptosis, while the overexpression of miR-199a-3p had the opposite effect. LINC00346 promoted the expression of CDK1/CCNB1 using the competitive action of miR-199a-3p and inhibited the expression of p53 and p21 proteins, indicating that LINC00346 could competitively regulate the expression of CDK1/CCNB1 via the miR-199a-3p, forming a ceRNA regulatory relationship [5].
MicroRNAs (miRNAs) could regulate gene expression by binding to the target genes, and lncRNAs could regulate the target gene expression of miRNAs by competitively binding to miRNAs through the microRNA response elements (MREs). Multiple studies have shown that lncRNAs could regulate gene expression in the ceRNA networks by competing for endogenous miRNAs, and play a biological role in tumor progression [5-7]. Reportedly, lncRNAs are related to the development of drug resistance in HCC cells [8,9]. For example, Guo et al. reported that the expression of lncRNA SNHG16 in liver cancer tissues and cells was significantly upregulated, and was negatively correlated with the survival time of patients with liver cancer. SNHG16 is an independent predictor of dismal prognosis for HCC patients. Interfering with the expression of SNHG16 inhibited the proliferation, migration, invasion, and drug resistance of liver cancer cells to sorafenib [8]. Li et al. reported that lncARSR was upregulated in HCC tissues and was related to the tumor size, stage, and dismal prognosis of patients. Overexpression of lncARSR enhanced the resistance of HCC cells to doxorubicin in vitro and in vivo and knockdown of lncARSR would lead to the opposite results to doxorubicin. LncARSR promoted the degradation and decreased the expression of PTEN, and activated the PI3K/AKT signaling pathway. The PI3K/AKT signaling pathway inhibitor could reverse the resistance of lncARSR overexpression to doxorubicin [9]. LncRNA AP003469.4 was called ZNNT1 and KB-1460A1.5. In recent years, studies have found that lncRNA AP003469.4 is related to uveal melanoma (UM) progression [10]. Specifically, overexpression of ZNNT1 inhibited the cell survival, migration ability, and promoted the cell death of UM. The roles of AP003469.4 in other tumors and diseases have not been found so far. Therefore, the roles and mechanisms of AP003469.4 in HCC development were explored in our study to identify new candidate target molecules for the treatment of HCC patients using bioinformatics analysis and cell experiments.
Materials and methods
Cell culture and transfection
HepG2 cells were cultured in RPMI-1640 medium (HyClone, China), HuH-7 cells were cultured in DMEM medium (HyClone, China), and the environment of incubator was kept at 37°C and 5% CO2. Cells were transfected with Lipofectamine 2000 (Invitrogen, USA) transfection reagent and siRNA of working concentration 50 nM when the confluence of HCC cells was 50-60%. Serum-free Opti-MEM (Invitrogen, USA) medium was used to feed HCC cells, and after 24 h of incubation, cells were transferred to the cell growth medium. The cells were then divided into two groups: si-NC (transfected by negative control siRNA) and si-AP003469.4 (transfected by small interference AP003469.4 siRNA) groups. Cell RNAs from the si-NC and si-AP003469.4 groups were collected after 24 h, and the expression level of AP003469.4 was detected via reverse transcription-quantitative polymerase chain reaction (qRT-PCR). The inhibitors for AP003469.4 were purchased from Guangzhou RiboBio Co., Ltd. and the interference AP003469.4 sequence is shown in Table 1.
Table 1.
siRNAs for AP003469.4
| Sense (5’-3’) | Antisense (5’-3’) |
|---|---|
| GGAUGUGUCAGCUGGUAUAUG | UAUACCAGCUGACACAUCCGG |
| GCUUGACAGUAAUCUCUUAUC | UAAGAGAUUACUGUCAAGCUA |
| CAGACUGCUUCCAAAGAAAUC | UUUCUUUGGAAGCAGUCUGUU |
qRT-PCR
The qRT-PCR kit was used to extract RNA (Takara, Japan), and carry out reverse transcription (Takara, Japan) and PCR amplification (Takara, Japan). The forward primer of AP003469.4 was 5’-TCAAGGGTGGATGGTAAAGGT-3’ and the reverse primer of AP003469.4 was 5’-CCAAGCCGGGTTTATTCTCAT-3’ (Sangon Biotech, China). The forward primer of β-actin was 5’-GCATGGGTCAGAAGGATTCCT-3’, and the reverse primer was 5’-TCGTCCCAGTTGGTGACGAT-3’ (Sangon Biotech, China). Relative mRNA expression levels were calculated using the 2-ΔΔCt method and normalized to the internal control.
CCK-8
HCC cells transfected for 24 h were digested and centrifuged (1000 × g). The cell suspensions of si-NC and si-AP003469.4 groups were inoculated in a 96-well plate. The culture plate was placed in an incubator for 24 h. Next, 10 μL of CCK-8 (Beyotime, China) solution was added to each well, and the setup was incubated for 2 h. The absorbance of the cells was measured using a microplate reader at 450 nm, which was recorded as 0 h. The absorbance of the cells was measured for three days.
Cell cycle
HCC Cells (1 × 10⁶) were collected from each sample 24 h after cell transfection. After cell fixation, 50 μg/mL propidium iodide (PI) staining, 100 μg/mL RNaseA, and 0.2% Triton X-100 were applied while the cells were incubated for 30 min at 4°C in the dark. Standard procedure flow cytometry (BD caliber, USA) detection and ModFit analysis was followed [11]. With the control group as the standard, the cell cycle transition of the si-AP003469.4 group was detected.
Apoptosis
The transfected HCC cells were gently washed in 6-pore plates with 2 mL phosphate-buffered saline (PBS) solution, 0.5 mL of 0.25% trypsin without EDTA, and incubated until the cells began to fall off the culture plate wall as observed under the microscope. The cells were resuspended in pre-chilled binding buffer, and the density was adjusted to 1 × 10⁶ cells/ml. The cells were reacted with 1.25 μL Annexin V-FITC in the dark at room temperature for 15 min, then resuspended in 0.5 mL of pre-cooled 1 × binding buffer. Next, 10 μL propidium iodide was added, stored on ice in the dark, and analyzed by flow cytometry (BD caliber, USA). Using the control group as the standard, cell apoptosis of the si-AP003469.4 group was detected.
Cell invasion
Matrigel was dissolved at 4°C and diluted with pre-chilled serum-free medium. The cells were incubated at 37°C for 2 h to solidify the Matrigel in the Transwell chamber, and 100 uL and 600 uL serum-free medium were added to the upper and lower chambers, respectively. The setup was incubated overnight at 37°C. The transfected HCC cells were counted, resuspended in 100 uL serum-free medium, added to the upper chamber of the Transwell, and 600 uL complete medium was added to the lower chamber. After incubation at 37°C and 5% CO2 for 48 h, the cells were removed, the upper chamber cells were wiped with a cotton swab, fixed with 4% paraformaldehyde for 15 min, washed with PBS, stained with crystal violet for 10 min, and photographed for statistical analysis.
Cell migration
The two groups of transfected HCC cells were collected and counted, and were resuspended with 100 uL serum-free medium, and 100 uL and 600 uL serum-free media were added to the upper and lower chambers of Transwell, incubated overnight at 37°C. The transfected HCC cells were counted, resuspended in 100 uL serum-free medium, added to the upper chamber of the Transwell, and 600 uL complete medium was added to the lower chamber. After incubation at 37°C and 5% CO2 for 48 h, the cells were removed, the upper chamber cells were wiped with a cotton swab, fixed with 4% paraformaldehyde for 15 min, washed with PBS, stained with crystal violet for 10 min, and photographed for statistical analysis.
lnCAR database
The lnCAR database included the expression level of lncRNAs in pan-cancer tissues and cells, and the relationship between the prescribed drugs and patient prognosis [12]. AP003469.4 was entered into the lnCAR database to determine the expression level of AP003469.4 in HCC tissues. Screening criteria was set as P < 0.05.
TCGA database
The Cancer Genome Atlas (TCGA) database is a common cancer database containing data for more than 30 cancer types. Transcriptome data from 50 normal liver tissue samples and 374 HCC tissue samples were downloaded from the TCGA database. Among them, 50 cases of normal liver tissues and 50 cases of HCC tissues were obtained from the same HCC patients. The patients without complete clinical information out of 377 HCC patients from the TCGA database were excluded. In the TCGA database, the expression levels of AP003469.4 in HCC tissues were identified, and the expression values of AP003469.4 and clinicopathological features in patients with HCC were evaluated using survival analysis and univariate and multivariate Cox regression analyses. Screening criteria: P < 0.05.
Gene expression profiling interactive analysis database
The gene expression profiling interactive analysis (GEPIA) database is a commonly used online database. In the GEPIA database, the relationship between the expression level of AP003469.4 and the OS and disease-free survival (DFS) of patients with HCC were verified. As grouping criteria, median value of AP003469.4 expression was set and P < 0.05 was regarded as the significant.
Constructing the ceRNA network of AP003469.4
AP003469.4 was entered into the LncBase Predicted v.2 database to retrieve the miRNAs of AP003469.4. The screening criteria was set as binding score of > 0.8. The target genes downstream of miRNAs could be predicted in the miRDB, miRTarBase, and TargetScan databases, and the target binding relationship could be found in the miRDB, miRTarBase, and TargetScan databases. Therefore, a ceRNA network of AP003469.4 was constructed.
GO and KEGG
The Limma package was used to analyze the expression of putative genes in the ceRNA network in HCC tissues from TCGA database, and screening criteria was taken as P < 0.05. The Bioconductor package clusterProfiler was used to analyze the findings from Gene Ontology (GO) and Kyoto Encyclopedia of Genes and Genomes (KEGG) analyses. The differentially expressed genes (DEGs) in the ceRNA network were used to explore the signaling pathways whose function and mechanism was affected by AP003469.4. Screening criteria was set as P < 0.05.
Construction of risk model of prognostic factors
A risk prediction model based on multivariate Cox regression analyses and AIC method was constructed after univariate Cox regression analyses, to analyze the effects of high and low risks on the prognosis of HCC patients [13,14]. Correlation analysis was conducted to analyze the relationship between risk factors and clinicopathological features of patients with HCC. Univariate and multivariate Cox regression analyses were used to analyze the effects of risk factors and clinicopathological features on the prognosis of patients with HCC.
Gene set enrichment analysis
Gene set enrichment analysis (GSEA) is a method to analyze gene expression [16]. The gene expression data of HCC tissues were divided into two groups (high- and low-risk groups) according to the risk model score, and the influence of high- and low-risk groups on each gene was explored according to a certain gene sequencing mode, which predicted whether the risk model might be involved in the regulatory signaling mechanisms of HCC progression. Screening criteria: NOM P < 0.05.
Statistical analysis
Wilcoxon signed-rank test and logistic regression were used to analyze the expression of AP003469.4 and its relationship with clinicopathological features. Kaplan-Meier survival analysis was used to analyze the relationship between AP003469.4 expression and target genes in the ceRNA network and the prognosis of HCC patients. Cox regression analysis was used to analyze the correlation between the prognostic factors and the OS. In the cell functional study, the results of interfering AP003469.4 expression and the control groups were compared using the mean plus or minus standard deviation, and the t-test was used to verify whether the two groups were statistically significant. P < 0.05 was regarded as the standard of statistical significance.
Results
The expression level of AP003469.4 in HCC tissue was significantly increased
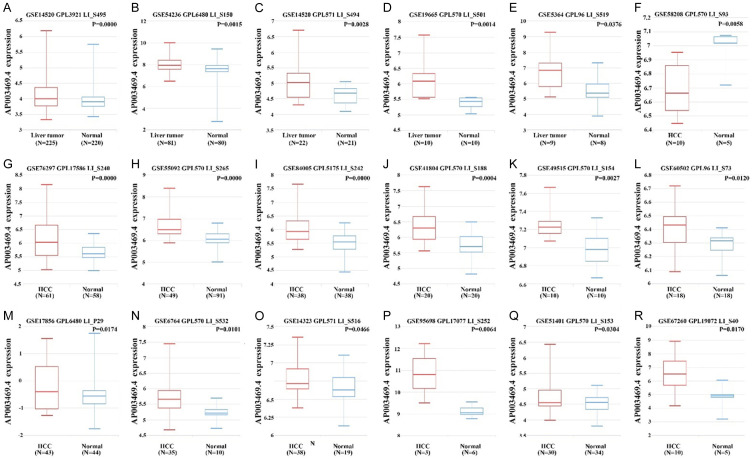
The expression level of AP003469.4 was significantly increased in liver cancer tissues (Figure 1). Compared with normal liver tissues, the expression level of AP003469.4 was significantly increased in liver cancer tissues in the GSE14520, GSE54236, GSE14520, GSE19665, GSE5364, GSE76297, GSE55092, GSE84005, GSE41804, GSE49515, GSE60502, GSE17856, GSE6764, GSE14323, GSE95698, GSE51401, and GSE67260 datasets, and the difference was statistically significant. Compared with normal liver tissues, the expression level of AP003469.4 decreased in liver cancer tissues in the GSE58208 dataset. Additionally, we found that the expression of AP003469.4 in HCC tissues was consistent with the general trend in the TCGA database (Figure 2A, 2B). To be more specific, the expression of AP003469.4 in HCC tissues was significantly higher than that in 50 normal liver tissues (Figure 2A). Compared with 50 paired normal liver tissues, the expression level of AP003469.4 in 50 paired HCC tissues was significantly increased (Figure 2B).
Figure 1.
The expression level of AP003469.4 in liver cancer tissue is generally high. A. GSE14520; B. GSE54236; C. GSE14520; D. GSE19665; E. GSE5364; F. GSE58208; G. GSE76297; H. GSE55092; I. GSE84005; J. GSE41804; K. GSE49515; L. GSE60502; M. GSE17856; N. GSE6764; O. GSE14323; P. GSE95698; Q. GSE51401; R. GSE67260.
Figure 2.
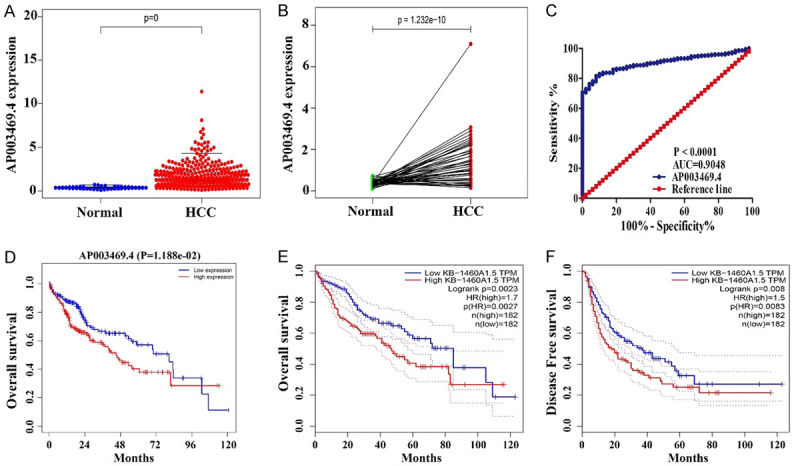
Detecting the expression of AP003469.4 and its clinical value in the TCGA and GEPIA databases. A, B. Unpaired and matched HCC samples; C. Diagnostic value; D-F. Prognostic value. Note: HCC, Hepatocellular carcinoma; TCGA, The Cancer Genome Atlas; GEPIA, gene expression profiling interactive analysis.
Increased expression of AP003469.4 was a biomarker of diagnosis and dismal prognosis in patients with HCC
In the TCGA database, the roles of AP003469.4 in the diagnosis of HCC were evaluated by receiver operating characteristic (ROC) analysis, and the results showed that the area under the curve (AUC) of AP003469.4 was 0.9048 (Figure 2C; P < 0.001). Increased AP003469.4 expression level was significantly correlated with the short OS of HCC patients (Figure 2D). In the GEPIA database, we found that increased AP003469.4 expression level was significantly associated with the short OS and DFS in patients with HCC (Figure 2E, 2F). In addition, increased expression level of AP003469.4 was an independent risk factor of dismal prognosis for HCC patients through multivariate Cox regression analysis (Figure S1).
Interference with AP003469.4 expression inhibited cell growth and migration
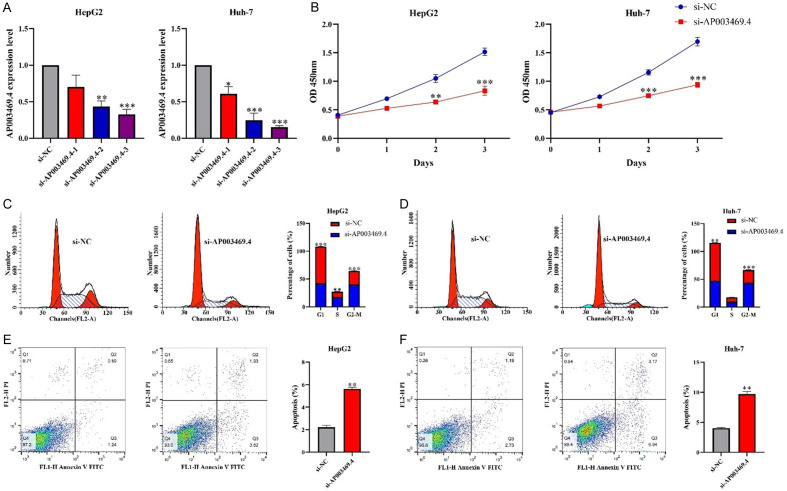
The AP003469.4 expression interfered model for the HCC HepG2 and HuH-7 cells were successfully constructed through siRNA transfection (Figure 3A). Interference with the expression of AP003469.4 could inhibit the proliferation and cycle transition of HCC HepG2 and HuH-7 cells (Figure 3B-D), and promote cell apoptosis (Figure 3E and 3F). Metastasis emerged as a common risk factor for dismal prognosis in cancer patients, and interference with the expression of AP003469.4 inhibited cell invasion and migration (Figure 4).
Figure 3.
Interference with AP003469.4 expression inhibited cell growth. A. Interference with AP003469.4 cell model; B-F. Cell proliferation, cell transformation, and apoptosis were detected by CCK-8 and flow cytometry.
Figure 4.
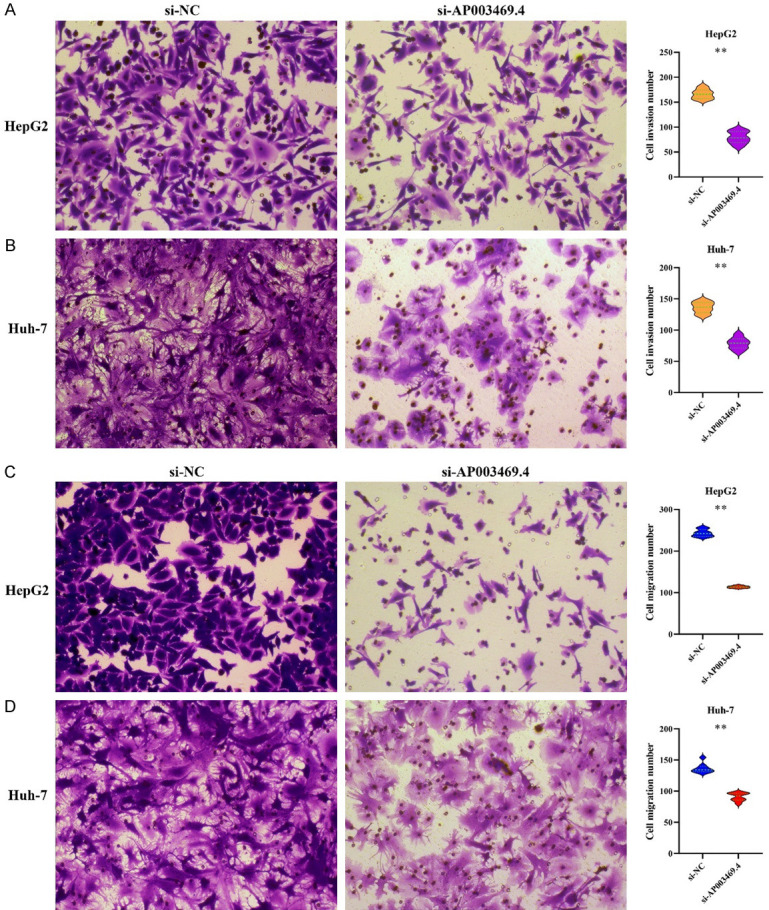
Interference with AP003469.4 expression inhibited cell invasion and migration via Transwell experiment. A, B. Cell invasion; C, D. Cell migration.
Construction of the AP003469.4 related ceRNA network
A total of 67 combined miRNAs of AP003469.4 were screened by the binding scores, namely hsa-miR-4672, hsa-miR-7114-5p, hsa-miR-3926, hsa-miR-5093, hsa-miR-7161-5p, hsa-miR-6079, hsa-miR-6734-5p, hsa-miR-495-3p, hsa-miR-3613-3p, hsa-miR-589-3p, hsa-miR-3941, hsa-miR-6077, hsa-miR-8063, hsa-miR-5002-5p, hsa-miR-4647, hsa-miR-6783-3p, hsa-miR-1250-3p, hsa-miR-3942-3p, hsa-miR-4725-3p, hsa-miR-6833-5p, hsa-miR-7156-3p, hsa-miR-551b-5p, hsa-miR-509-3p, hsa-miR-4481, hsa-miR-1304-3p, hsa-miR-2110, hsa-miR-4745-5p, hsa-miR-5688, hsa-miR-3150a-3p, hsa-miR-4699-5p, hsa-miR-6782-3p, hsa-miR-9500, hsa-miR-3911, hsa-miR-4662b, hsa-miR-4482-3p, hsa-miR-378g, hsa-miR-4427, hsa-miR-7-5p, hsa-miR-6736-3p, hsa-miR-4524b-3p, hsa-miR-646, hsa-miR-4668-5p, hsa-miR-3646, hsa-miR-1343-3p, hsa-miR-3156-5p, hsa-miR-1296-3p, hsa-miR-548j-3p, hsa-miR-548ae-3p, hsa-miR-4282, hsa-miR-548am-3p, hsa-miR-548ah-3p, hsa-miR-5584-5p, hsa-miR-548aq-3p, hsa-miR-6780b-5p, hsa-miR-543, hsa-miR-8485, hsa-miR-6772-5p, hsa-miR-4731-3p, hsa-miR-5683, hsa-miR-4801, hsa-miR-4288, hsa-miR-9-5p, hsa-miR-5701, hsa-miR-4668-3p, hsa-miR-3185, hsa-miR-4469, and hsa-miR-622 (Figure 5A and Table 2). In the miRDB, miRTarBase, and TargetScan databases, 1,506 genes had binding targets of miRNAs (Table S1). The AP003469.4-miRNAs-mRNAs ceRNA network mechanism was constructed. Figure 5B shows the ceRNA network signaling mechanism of AP003469.4 targeting hsa-miR-3613-3p, hsa-miR-8485, and hsa-miR-3941 (Table S1).
Figure 5.
The ceRNA network signaling mechanism of AP003469.4. A. AP003469.4 bound miRNAs; B. The AP003469.4 targeting hsa-miR-3613-3p, hsa-miR-8485, and hsa-miR-3941 ceRNA network.
Table 2.
The AP003469.4 target binding miRNAs
| miRNA Name | Score | miRNA Name | Score | miRNA Name | Score |
|---|---|---|---|---|---|
| hsa-miR-4672 | 0.999 | hsa-miR-4481 | 0.903 | hsa-miR-1296-3p | 0.843 |
| hsa-miR-7114-5p | 0.975 | hsa-miR-1304-3p | 0.897 | hsa-miR-548j-3p | 0.835 |
| hsa-miR-3926 | 0.974 | hsa-miR-2110 | 0.896 | hsa-miR-548ae-3p | 0.831 |
| hsa-miR-5093 | 0.972 | hsa-miR-4745-5p | 0.895 | hsa-miR-4282 | 0.831 |
| hsa-miR-7161-5p | 0.971 | hsa-miR-5688 | 0.895 | hsa-miR-548am-3p | 0.828 |
| hsa-miR-6079 | 0.967 | hsa-miR-3150a-3p | 0.895 | hsa-miR-548ah-3p | 0.828 |
| hsa-miR-6734-5p | 0.961 | hsa-miR-4699-5p | 0.893 | hsa-miR-5584-5p | 0.827 |
| hsa-miR-495-3p | 0.959 | hsa-miR-6782-3p | 0.887 | hsa-miR-548aq-3p | 0.827 |
| hsa-miR-3613-3p | 0.957 | hsa-miR-9500 | 0.884 | hsa-miR-6780b-5p | 0.824 |
| hsa-miR-589-3p | 0.957 | hsa-miR-3911 | 0.881 | hsa-miR-543 | 0.823 |
| hsa-miR-3941 | 0.954 | hsa-miR-4662b | 0.881 | hsa-miR-8485 | 0.822 |
| hsa-miR-6077 | 0.952 | hsa-miR-4482-3p | 0.879 | hsa-miR-6772-5p | 0.82 |
| hsa-miR-8063 | 0.952 | hsa-miR-378g | 0.879 | hsa-miR-4731-3p | 0.814 |
| hsa-miR-5002-5p | 0.947 | hsa-miR-4427 | 0.878 | hsa-miR-5683 | 0.814 |
| hsa-miR-4647 | 0.946 | hsa-miR-7-5p | 0.872 | hsa-miR-4801 | 0.811 |
| hsa-miR-6783-3p | 0.938 | hsa-miR-6736-3p | 0.871 | hsa-miR-4288 | 0.807 |
| hsa-miR-1250-3p | 0.93 | hsa-miR-4524b-3p | 0.866 | hsa-miR-9-5p | 0.807 |
| hsa-miR-3942-3p | 0.925 | hsa-miR-646 | 0.857 | hsa-miR-5701 | 0.806 |
| hsa-miR-4725-3p | 0.925 | hsa-miR-4668-5p | 0.857 | hsa-miR-4668-3p | 0.806 |
| hsa-miR-6833-5p | 0.908 | hsa-miR-3646 | 0.851 | hsa-miR-3185 | 0.806 |
| hsa-miR-7156-3p | 0.908 | hsa-miR-1343-3p | 0.85 | hsa-miR-4469 | 0.805 |
| hsa-miR-551b-5p | 0.906 | hsa-miR-3156-5p | 0.847 | hsa-miR-622 | 0.804 |
| hsa-miR-509-3p | 0.903 |
Biological functions and regulatory mechanisms of DEGs in ceRNA network
Differential analysis of the 1506 target genes in the ceRNA network showed that there were 489 DEGs (Table S2). Among them, there were 464 high expressed DEGs, and 25 low expressed DEGs, and the DEGs in the top 20 are shown using heat map and violin map (Figure S2). GO results showed that 489 DEGs were enriched in mechanisms such as protein folding, cell adhesion molecule binding, cell junction assembly, regulation of microtubule-based process, epithelial to mesenchymal transition, microtubule cytoskeleton organization involved in mitosis, regulation of mRNA catabolic process, protein refolding, and regulation of epithelial cell proliferation (Figure 6A-C and Table S3). KEGG pathway analysis showed that 489 DEGs were significantly enriched in transcriptional misregulation in cancer, viral carcinogenesis, MAPK signaling pathway, cell cycle, microRNAs in cancer, adipocytokine signaling pathway, p53 signaling pathway, cellular senescence, Hippo signaling pathway, PPAR signaling pathway, insulin resistance, and DNA replication (Figure 6D and Table S4).
Figure 6.
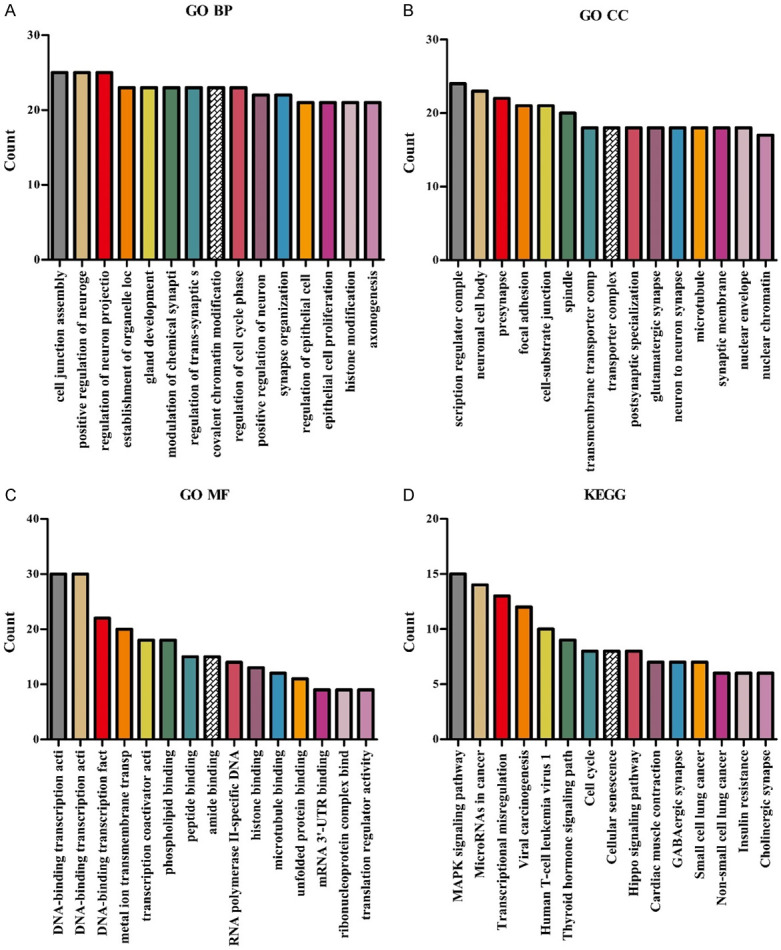
The biological functions and signaling mechanisms involved in DEGs from the network via GO and KEGG. A. BP; B. CC; C. MF; D. KEGG. Note: GO, Gene Ontology; KEGG, Kyoto Encyclopedia of Genes and Genomes; BP, Biological process; CC, Cellular components; MF, Molecular function; ceRNA, competing endogenous RNA; DEGs, Differentially expressed genes.
Screening target molecules related to prognosis in the ceRNA network
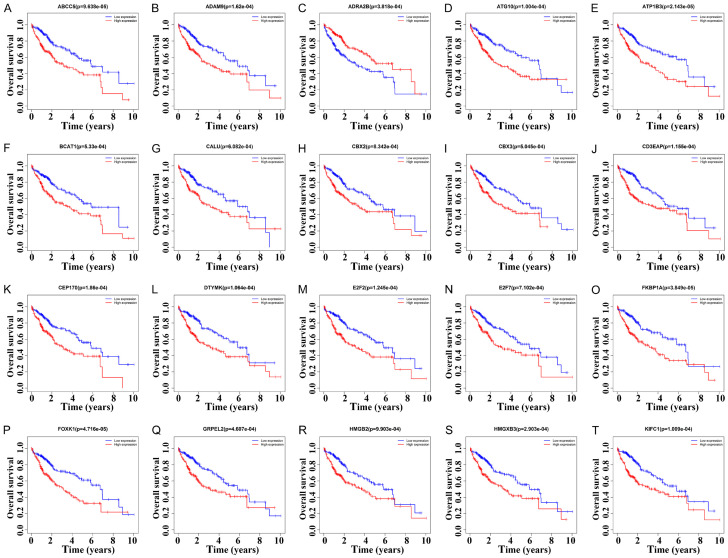
Kaplan-Meier survival analysis showed that 194 DEGs of the 489 DEGs in the ceRNA network were associated with the dismal prognosis of HCC patients. 40 DEGs were associated with the poor prognosis in patients with HCC via the screening criterion of P < 0.001 (Figures 7 and S3). In detail, the increased expression levels of ABCC5, ADAM9, ATG10, ATP1B3, BCAT1, CALU, CBX2, CBX3, CD3EAP, CEP170, DTYMK, E2F2, E2F7, FKBP1A, FOXK1, GRPEL2, HMGB2, HMGXB3, KIFC1, KPNA2, LARP4B, MARCKSL1, PKM, PPIA, PPIL1, SCML2, SHISA9, SKA1, SLC1A4, SLC1A5, SLC7A11, SMARCD1, SOCS7, SPC25, TAGLN2, TTC26, UCK2, USH1G, and ZFC3H1 were significantly correlated with dismal prognosis of HCC patients. The decreased expression level of ADRA2B was significantly correlated dismal prognosis of HCC patients.
Figure 7.
Twenty DEGs were associated with dismal prognosis in patients with HCC. A. ABCC5; B. ADAM9; C. ADRA2B; D. ATG10; E. ATP1B3; F. BCAT1; G. CALU; H. CBX2; I. CBX3; J. CD3EAP; K. CEP170; L. DTYMK; M. E2F2; N. E2F7; O. FKBP1A; P. FOXK1; Q. GRPEL2; R. HMGB2; S. HMGXB3; T. KIFC1. Note: DEGs, differentially expressed genes; HCC, hepatocellular carcinoma.
Construction of prognosis-related risk model
Univariate Cox regression analysis showed that the expression levels of SHISA9, E2F7, ATG10, CEP170, HMGB2, SOCS7, SCML2, SLC1A4, ZFC3H1, TAGLN2, PKM, CALU, PPIL1, PPIA, FKBP1A, HMGXB3, LARP4B, SMARCD1, E2F2, MARCKSL1, KIFC1, ADAM9, BCAT1, ATP1B3, CD3EAP, FOXK1, DTYMK, ABCC5, SKA1, SLC7A11, SPC25, CBX3, SLC1A5, TTC26, GRPEL2, KPNA2, UCK2, and CBX2 were risk factors for dismal prognosis of HCC patients (Figure S4). The risk model constructed using Cox regression analysis showed that DTYMK, ZFC3H1, CBX2, PKM, TTC26, ATG10, TAGLN2, CD3EAP, SHISA9, SLC1A5, KPNA2, SCML2, E2F7, and SMARCD1 were independent risk factors for dismal prognosis in HCC patients (Table 3).
Table 3.
Screening prognostic related factors with Cox regression model
| Gene | Coef | HR | HR.95L | HR.95H | P value |
|---|---|---|---|---|---|
| DTYMK | 0.254939313 | 1.290383309 | 0.944585621 | 1.762771998 | 0.109204697 |
| ZFC3H1 | 0.409359357 | 1.505852762 | 0.889952843 | 2.547991795 | 0.127135036 |
| CBX2 | 0.404822804 | 1.499036853 | 1.111313974 | 2.022031161 | 0.008021609 |
| PKM | -0.224383528 | 0.799008633 | 0.630867271 | 1.011963728 | 0.062700248 |
| TTC26 | 0.969929355 | 2.637758109 | 1.265034118 | 5.500063391 | 0.009680767 |
| ATG10 | 0.411966602 | 1.509784012 | 0.89890134 | 2.535815291 | 0.119443228 |
| TAGLN2 | 0.242178224 | 1.274021234 | 0.973168224 | 1.667882349 | 0.078057301 |
| CD3EAP | -0.58855025 | 0.555131503 | 0.307057148 | 1.00362746 | 0.051417408 |
| SHISA9 | 0.730886869 | 2.076921748 | 1.097286323 | 3.931156212 | 0.024758368 |
| SLC1A5 | 0.375671152 | 1.455968263 | 1.17306303 | 1.807101178 | 0.000654478 |
| KPNA2 | 0.285470623 | 1.330387992 | 0.932054034 | 1.8989588 | 0.115859762 |
| SCML2 | 0.643745998 | 1.903598415 | 1.115077941 | 3.249716268 | 0.018317369 |
| E2F7 | -0.473553835 | 0.622785055 | 0.337808201 | 1.148169951 | 0.129198835 |
| SMARCD1 | -0.874968928 | 0.416874973 | 0.211551859 | 0.82147585 | 0.011465451 |
Identification of the clinical value of risk model
HCC patients were divided into high- and low-risk groups according to the risk scores (Figure 8A). The survival status of the both groups are showed in Figure 8B. Figure 8C shows the relationship between high- and low-risk and the expression levels of DTYMK, ZFC3H1, CBX2, PKM, TTC26, ATG10, TAGLN2, CD3EAP, SHISA9, SLC1A5, KPNA2, SCML2, E2F7, and SMARCD1. Specifically, the expression levels of DTYMK, ZFC3H1, CBX2, PKM, TTC26, ATG10, TAGLN2, CD3EAP, SHISA9, SLC1A5, KPNA2, SCML2, E2F7, and SMARCD1 were positively correlated with risk scores. Kaplan-Meier survival analysis showed that the prognosis of HCC patients in the high-risk group was worse than that in the low-risk group (Figure 8D), and ROC analysis showed that the AUC of the risk score was 0.83 in HCC patients, indicating that the risk score was of great value in the diagnosis of HCC (Figure 8E).
Figure 8.
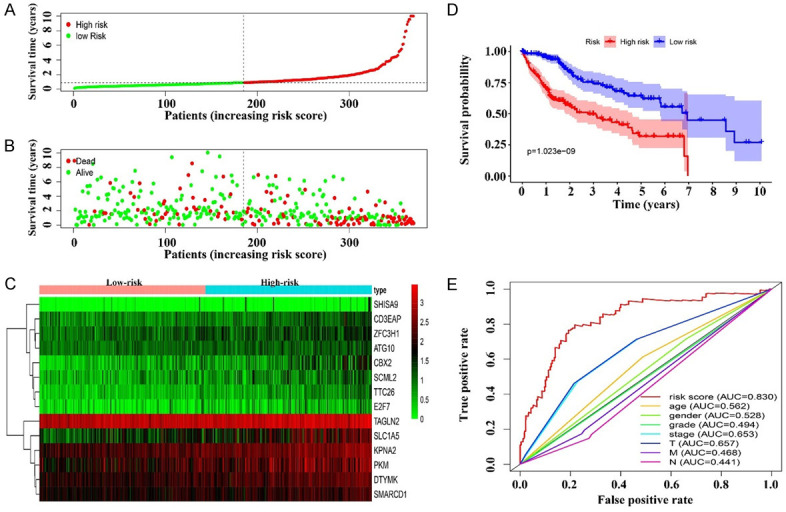
The value of risk model in clinical prognosis. A. Risk score; B. Survival time; C. Risk factors; D. Prognosis of patients in high- and low-risk groups; E. Diagnostic value of risk model.
In addition, univariate and multivariate Cox regression analysis showed that the risk score was an independent risk factor for the dismal prognosis in patients with HCC (Figure 9A, 9B). The heat map showed that the risk score was significantly correlated with the clinical stage, T stage, tumor grade, and survival status of HCC patients (Figure 9C).
Figure 9.
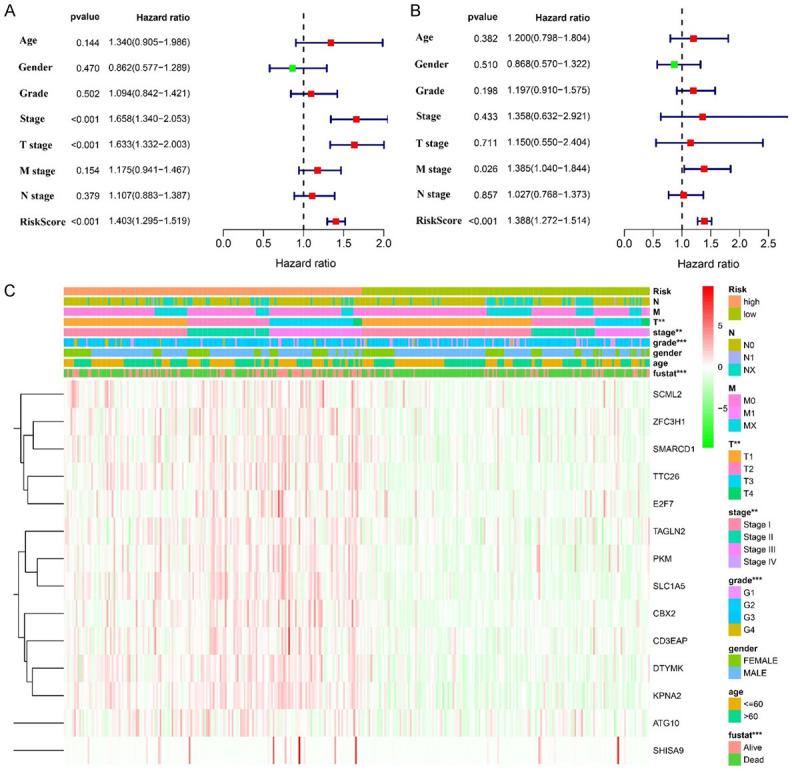
Cox regression analysis and correlation analysis showed that the roles of risk factors and clinicopathological characteristics in the prognosis of HCC patients. Note: HCC, hepatocellular carcinoma.
The risk model involved the regulatory mechanism of HCC progression
GSEA results showed that spliceosome, cell cycle, homologous recombination, oocyte meiosis, RNA degradation, DNA replication, progesterone-mediated oocyte maturation, endocytosis, ubiquitin-mediated proteolysis, base excision repair, basal transcription factors, NOD-like receptor signaling pathway, mTOR signaling pathway, and regulation of autophagy were significantly enriched in the high-risk group (Figure S5 and Table S5).
Discussion
Recently, the function of lncRNAs to participate in gene regulation in tumor progression has garnered much attention, especially in ceRNA networks. The target genes in ceRNA networks could affect the occurrence, development, and prognosis of cancer [4,5,16,17]. For example, LincSCRG1 is strongly expressed in HCC tissues and cells. LincSCRG1 regulates the expression of SKP2 by directly binding to miR26a as a ceRNA. This could induce viability, colony formation, migration, and proliferation of HCC cells in vitro and in vivo, increase the expression of cyclinD1, CDK4, MMP2/3/9 protein, vimentin, and N-cadherin, and inhibit the expression of E-cadherin [16]. Loc339803 expression level was upregulated both in liver cancer tissues and cells, and the increased level of loc339803 was positively correlated with the tumor size, end-stage disease, elevated AFP level, and poor prognosis. Furthermore, loc339803 acted as a ceRNA by directly binding to miR-30a-5p and upregulating the expression of Snail1, the target gene of miR-30a-5p, thereby promoting the migration and invasion of HCC cells [17]. This indicated that the ceRNA network was of great value in the progression of HCC.
In our study, the expression level of AP003469.4 was significantly increased in HCC tissues. Increased expression of AP003469.4 was associated with diagnosis in patients with HCC and the dismal prognosis. Cox regression analysis showed that increased expression of AP003469.4 was an independent risk factor for dismal prognosis in patients with HCC. Interference with the expression of AP003469.4 could inhibit the proliferation, cycle transition, invasion, and migration, and promote the apoptosis of HepG2 and HuH-7 cells. The preliminary results showed that the expression level of AP003469.4 in HCC progression was a carcinogen performing its biological function, and interference in AP003469.4 expression level was expected to improve the prognosis and prolong the survival time of HCC patients.
In our construction of the ceRNA network, it has been indicated that a large number of molecules are related to cancer progression and patient prognosis [18-23]. For example, miR-3613-3p mimics could inhibit cell proliferation, cell cycle transition, and the expression of Ki67 and PCAN in HCC cells [18]. MiR-543 was overexpressed in prostate cancer, while RKIP was less expressed. Overexpressed miR-543 would downregulate the RKIP expression and promote the proliferation and metastasis of cancer cells; the results were opposite when the expression of miR-543 was decreased [19]. MiR-3941 could downregulate the expression of IGBP1, inhibit the proliferation of lung adenocarcinoma cells, and induce cell apoptosis [20]. In addition, hub target molecules in the ceRNA networks play important roles in the development of HCC [4,24-30]. Overexpressed DTYMK partially reversed the inhibitory effect of the p300 inhibitor, B029-2, in HCC cells [24]. The high expression of CBX2 in HCC tissue and the increased expression of CBX2 were related to the dismal prognosis of HCC patients. Interfering with the expression of CBX2 could inhibit the proliferation and induce apoptosis of HCC cells, inhibit the expression of WTIP, and increase the phosphorylation level of YAP protein [25]. The expression levels of TAGLN2 mRNA and protein in HCC tissues were higher than those in para-cancerous tissues. The expression of TAGLN2 was associated with dismal prognosis in HCC patients, and TAGLN2 could participate in the proliferation and metastasis of HCC cells by regulating the expression of annexin A2. The expression of SMARCD1 was again related to the prognosis of patients with HCC. It was also found that SMARCD1 could promote the growth of HCC cells by activating the mTOR signaling pathway, both in vitro and in vivo [31]. These indicated that the AP003469.4-miRNAs-mRNAs ceRNA network could narrow down important target molecules in the progression of HCC, and the inhibition or promotion of these target molecules was expected to improve the survival time of HCC patients.
At present, the MAPK signaling pathway, cell cycle, Hippo signaling pathway, PPAR signaling pathway, DNA replication, and mTOR signaling pathway are known to be closely related to the progression of HCC [31-36]. For example, Zhang et al. reported that GRN was a highly expressed gene in HCC tissues and was the target gene of miR-140-3p. The increase of miR-140-3p could inhibit the expression of GRN, downregulate the expression of N-cadherin and vimentin, and upregulate the expression of E-cadherin related to the MAPK signaling pathway, thus inhibiting the migration and invasion of HCC cells. MiR-140-3p could inhibit the MAPK signaling pathway by targeting GRN, and then inhibit epithelial-mesenchymal transition (EMT), invasion, and metastasis [32]. ACTN1 was significantly upregulated in HCC tissues and was closely related to AFP, tumor size, TNM stage, and poor prognosis. Interfering with the expression of ACTN1 could inhibit the proliferation of HCC cells in vitro and tumor growth in vivo, and increase the activity of the Hippo signaling pathway [33]. CircRNA-100338 was one of markers of dismal prognosis in patients with hepatitis B-related liver cancer, and could regulates the mTOR signaling pathway through the miR-141-3p/RHEB axis [35]. In our study, it was found that the target genes and risk model in the ceRNA network involved the MAPK signaling pathway, cell cycle, Hippo signaling pathway, PPAR signaling pathway, DNA replication, mTOR signaling pathway, and other signaling pathways, which indicated that AP003469.4 might regulate the expression of miRNAs and participate in the progression of HCC through the aforementioned pathways.
Our network mechanism for constructing AP003469.4 has not been confirmed via basic research, which is a limitation of our study. The transcriptome sequencing should be performed in the cells of interfering AP003469.4 expression and control groups, and the number of miRNAs and genes reduced using qRT-PCR and western blotting to construct a convenient and effective risk model. In addition, the roles of AP003469.4 in other liver diseases has not been reported in the literature, which is where we need to pay attention.
In conclusion, we found that interference with AP003469.4 expression might delay the progression of HCC, and the AP003469.4-miRNAs-mRNAs ceRNA network was constructed based on the genome-wide analysis. The ceRNA network would then help to identify the target molecules in the progression of HCC. AP003469.4, DTYMK, ZFC3H1, CBX2, PKM, TTC26, ATG10, TAGLN2, CD3EAP, SHISA9, SLC1A5, KPNA2, SCML2, E2F7, and SMARCD1 may prove to be candidate biomarkers for evaluating the prognosis of HCC patients. In future, more basic research is needed to confirm the roles of the AP003469.4-miRNAs-mRNAs ceRNA network mechanisms in HCC.
Acknowledgements
This research was funded and supported by the Zunyi City Joint Fund (Zun Shi Ke He HZ Word (2021) No. 73).
Disclosure of conflict of interest
None.
Table S1
Table S2
Table S3
Figures S1-S5 and Tables S4, S5
References
- 1.Sung H, Ferlay J, Siegel RL, Laversanne M, Soerjomataram I, Jemal A, Bray F. Global cancer statistics 2020: GLOBOCAN estimates of incidence and mortality worldwide for 36 cancers in 185 countries. CA Cancer J Clin. 2021;73:209–249. doi: 10.3322/caac.21660. [DOI] [PubMed] [Google Scholar]
- 2.Bai Y, Long J, Liu Z, Lin J, Huang H, Wang D, Yang X, Miao F, Mao Y, Sang X, Zhao H. Comprehensive analysis of a ceRNA network reveals potential prognostic cytoplasmic lncRNAs involved in HCC progression. J Cell Physiol. 2019;234:18837–18848. doi: 10.1002/jcp.28522. [DOI] [PMC free article] [PubMed] [Google Scholar]
- 3.Serrano PE, Gu CS, Husien M, Jalink D, Ritter A, Martel G, Tsang ME, Law CH, Hallet J, McAlister V, Sela N, Solomon H, Moulton CA, Gallinger S, Levine M. Risk factors for survival following recurrence after first liver resection for colorectal cancer liver metastases. J Surg Oncol. 2019;120:1420–1426. doi: 10.1002/jso.25735. [DOI] [PubMed] [Google Scholar]
- 4.Teng F, Zhang JX, Chang QM, Wu XB, Tang WG, Wang JF, Feng JF, Zhang ZP, Hu ZQ. LncRNA MYLK-AS1 facilitates tumor progression and angiogenesis by targeting miR-424-5p/E2F7 axis and activating VEGFR-2 signaling pathway in hepatocellular carcinoma. J Exp Clin Cancer Res. 2020;39:235. doi: 10.1186/s13046-020-01739-z. [DOI] [PMC free article] [PubMed] [Google Scholar]
- 5.Jin J, Xu H, Li W, Xu X, Liu H, Wei F. LINC00346 Acts as a competing endogenous RNA regulating development of hepatocellular carcinoma via modulating CDK1/CCNB1 Axis. Front Bioeng Biotechnol. 2020;8:54. doi: 10.3389/fbioe.2020.00054. [DOI] [PMC free article] [PubMed] [Google Scholar]
- 6.Li ZB, Chu HT, Jia M, Li L. Long noncoding RNA LINC01139 promotes the progression of hepatocellular carcinoma by upregulating MYBL2 via competitively binding to miR-30 family. Biochem Biophys Res Commun. 2020;525:581–588. doi: 10.1016/j.bbrc.2020.02.116. [DOI] [PubMed] [Google Scholar]
- 7.Wang Y, Yang L, Chen T, Li L. A novel lncRNA MCM3AP-AS1 promotes the growth of hepatocellular carcinoma by targeting miR-194-5p/FOXA1 axis. Mol Cancer. 2019;18:28. doi: 10.1186/s12943-019-0957-7. [DOI] [PMC free article] [PubMed] [Google Scholar]
- 8.Guo Z, Zhang J, Fan L, Liu J, Yu H, Li X, Sun G. Long noncoding RNA (lncRNA) small nucleolar RNA host gene 16 (SNHG16) predicts poor prognosis and sorafenib resistance in hepatocellular carcinoma. Med Sci Monit. 2019;25:2079–2086. doi: 10.12659/MSM.915541. [DOI] [PMC free article] [PubMed] [Google Scholar]
- 9.Li Y, Ye Y, Feng B, Qi Y. Long noncoding RNA lncARSR promotes doxorubicin resistance in hepatocellular carcinoma via modulating PTEN-PI3K/Akt pathway. J Cell Biochem. 2017;118:4498–4507. doi: 10.1002/jcb.26107. [DOI] [PubMed] [Google Scholar]
- 10.Li P, He J, Yang Z, Ge S, Zhang H, Zhong Q, Fan X. ZNNT1 long noncoding RNA induces autophagy to inhibit tumorigenesis of uveal melanoma by regulating key autophagy gene expression. Autophagy. 2020;16:1186–1199. doi: 10.1080/15548627.2019.1659614. [DOI] [PMC free article] [PubMed] [Google Scholar]
- 11.Azoulay D, Cohen HI, Dementiev E, Eshel E, Akria L, Shaoul E, Horowitz N. Flow cytometry aneuploidy and cell cycle indexing as a possible tool for differentiating between CD10 diffuse large B-cell lymphoma and follicular lymphoma. Cytometry B Clin Cytom. 2020;98:449–453. doi: 10.1002/cyto.b.21861. [DOI] [PubMed] [Google Scholar]
- 12.Zheng Y, Xu Q, Liu M, Hu H, Xie Y, Zuo Z, Ren J. lnCAR: a comprehensive resource for lncRNAs from cancer arrays. Cancer Res. 2019;79:2076–2083. doi: 10.1158/0008-5472.CAN-18-2169. [DOI] [PubMed] [Google Scholar]
- 13.Wang WJ, Wang H, Hua TY, Song W, Zhu J, Wang JJ, Huang YQ, Ding ZL. Establishment of a prognostic model using immune-related genes in patients with hepatocellular carcinoma. Front Genet. 2020;11:55. doi: 10.3389/fgene.2020.00055. [DOI] [PMC free article] [PubMed] [Google Scholar]
- 14.Zhang Y, Tang M, Guo Q, Xu H, Yang Z, Li D. The value of erlotinib related target molecules in kidney renal cell carcinoma via bioinformatics analysis. Gene. 2022;816:146173. doi: 10.1016/j.gene.2021.146173. [DOI] [PubMed] [Google Scholar]
- 15.Guo Q, Ke XX, Fang SX, Gao WL, Song YX, Chen C, Lu HL, Xu G. PAQR3 inhibits non-small cell lung cancer growth by regulating the NF-κB/p53/Bax axis. Front Cell Dev Biol. 2020;8:581919. doi: 10.3389/fcell.2020.581919. [DOI] [PMC free article] [PubMed] [Google Scholar]
- 16.Hu JJ, Zhou C, Luo X, Luo SZ, Li ZH, Xu ZX, Xu MY. Linc-SCRG1 accelerates progression of hepatocellular carcinoma as a ceRNA of miR26a to derepress SKP2. J Exp Clin Cancer Res. 2021;40:26. doi: 10.1186/s13046-020-01825-2. [DOI] [PMC free article] [PubMed] [Google Scholar]
- 17.Xue C, Zhang X, Gao P, Cui X, Zhu C, Qin X. LncRNA loc339803 acts as CeRNA of miR-30a-5p to promote the migration and invasion of hepatocellular carcinoma cells. J Cancer. 2021;12:1061–1072. doi: 10.7150/jca.52413. [DOI] [PMC free article] [PubMed] [Google Scholar]
- 18.Zhang D, Liu E, Kang J, Yang X, Liu H. MiR-3613-3p affects cell proliferation and cell cycle in hepatocellular carcinoma. Oncotarget. 2017;8:93014–93028. doi: 10.18632/oncotarget.21745. [DOI] [PMC free article] [PubMed] [Google Scholar]
- 19.Du Y, Liu XH, Zhu HC, Wang L, Ning JZ, Xiao CC. MiR-543 promotes proliferation and epithelial-mesenchymal transition in prostate cancer via targeting RKIP. Cell Physiol Biochem. 2017;41:1135–1146. doi: 10.1159/000464120. [DOI] [PubMed] [Google Scholar]
- 20.Sato T, Shiba-Ishii A, Kim Y, Dai T, Husni RE, Hong J, Kano J, Sakashita S, Iijima T, Noguchi M. miR-3941: a novel microRNA that controls IGBP1 expression and is associated with malignant progression of lung adenocarcinoma. Cancer Sci. 2017;108:536–542. doi: 10.1111/cas.13148. [DOI] [PMC free article] [PubMed] [Google Scholar]
- 21.Zhang P, Tang WM, Zhang H, Li YQ, Peng Y, Wang J, Liu GN, Huang XT, Zhao JJ, Li G, Li AM, Bai Y, Chen Y, Ren YX, Li GX, Wang YD, Liu SD, Wang JD. MiR-646 inhibited cell proliferation and EMT-induced metastasis by targeting FOXK1 in gastric cancer. Br J Cancer. 2017;117:525–534. doi: 10.1038/bjc.2017.181. [DOI] [PMC free article] [PubMed] [Google Scholar]
- 22.Chen YA, Cheng L, Zhang Y, Peng L, Yang HG. LncRNA RUSC1-AS1 promotes the proliferation of hepatocellular carcinoma cells through modulating NOTCH signaling. Neoplasma. 2021;67:1204–1213. doi: 10.4149/neo_2020_191010N1024. [DOI] [PubMed] [Google Scholar]
- 23.Song WH, Feng XJ, Gong SJ, Chen JM, Wang SM, Xing DJ, Zhu MH, Zhang SH, Xu AM. microRNA-622 acts as a tumor suppressor in hepatocellular carcinoma. Cancer Biol Ther. 2015;16:1754–63. doi: 10.1080/15384047.2015.1095402. [DOI] [PMC free article] [PubMed] [Google Scholar]
- 24.Cai LY, Chen SJ, Xiao SH, Sun QJ, Ding CH, Zheng BN, Zhu XY, Liu SQ, Yang F, Yang YX, Zhou B, Luo C, Zhang X, Xie WF. Targeting p300/CBP attenuates hepatocellular carcinoma progression through epigenetic regulation of metabolism. Cancer Res. 2021;81:860–872. doi: 10.1158/0008-5472.CAN-20-1323. [DOI] [PubMed] [Google Scholar]
- 25.Mao J, Tian Y, Wang C, Jiang K, Li R, Yao Y, Zhang R, Sun D, Liang R, Gao Z, Wang Q, Wang L. CBX2 regulates proliferation and apoptosis via the phosphorylation of YAP in hepatocellular carcinoma. J Cancer. 2019;10:2706–2719. doi: 10.7150/jca.31845. [DOI] [PMC free article] [PubMed] [Google Scholar]
- 26.Chen D, Wang Y, Lu R, Jiang X, Chen X, Meng N, Chen M, Xie S, Yan GR. E3 ligase ZFP91 inhibits hepatocellular carcinoma metabolism reprogramming by regulating PKM splicing. Theranostics. 2020;10:8558–8572. doi: 10.7150/thno.44873. [DOI] [PMC free article] [PubMed] [Google Scholar]
- 27.Shi J, Ren M, She X, Zhang Z, Zhao Y, Han Y, Lu D, Lyu L. Transgelin-2 contributes to proliferation and progression of hepatocellular carcinoma via regulating Annexin A2. Biochem Biophys Res Commun. 2020;523:632–638. doi: 10.1016/j.bbrc.2020.01.028. [DOI] [PubMed] [Google Scholar]
- 28.Zhang P, Wang Q, Lin Z, Yang P, Dou K, Zhang R. Berberine inhibits growth of liver cancer cells by suppressing glutamine uptake. Onco Targets Ther. 2019;12:11751–11763. doi: 10.2147/OTT.S235667. [DOI] [PMC free article] [PubMed] [Google Scholar]
- 29.Guo X, Wang Z, Zhang J, Xu Q, Hou G, Yang Y, Dong C, Liu G, Liang C, Liu L, Zhou W, Liu H. Upregulated KPNA2 promotes hepatocellular carcinoma progression and indicates prognostic significance across human cancer types. Acta Biochim Biophys Sin (Shanghai) 2019;51:285–292. doi: 10.1093/abbs/gmz003. [DOI] [PubMed] [Google Scholar]
- 30.Zhao Y, Zhu C, Chang Q, Peng P, Yang J, Liu C, Liu Y, Chen X, Liu Y, Cheng R, Wu Y, Wu X, Hu L, Yin J. MiR-424-5p regulates cell cycle and inhibits proliferation of hepatocellular carcinoma cells by targeting E2F7. PLoS One. 2020;15:e0242179. doi: 10.1371/journal.pone.0242179. [DOI] [PMC free article] [PubMed] [Google Scholar]
- 31.Zhou Y, Xu Q, Tao L, Chen Y, Shu Y, Wu Z, Lu C, Shi Y, Bu H. Enhanced SMARCD1, a subunit of the SWI/SNF complex, promotes liver cancer growth through the mTOR pathway. Clin Sci (Lond) 2020;134:1457–1472. doi: 10.1042/CS20200244. [DOI] [PubMed] [Google Scholar]
- 32.Zhang QY, Men CJ, Ding XW. Upregulation of microRNA-140-3p inhibits epithelial-mesenchymal transition, invasion, and metastasis of hepatocellular carcinoma through inactivation of the MAPK signaling pathway by targeting GRN. J Cell Biochem. 2019;120:14885–14898. doi: 10.1002/jcb.28750. [DOI] [PubMed] [Google Scholar]
- 33.Xu M, Wang Y, He HT, Yang Q. MiR-589-5p is a potential prognostic marker of hepatocellular carcinoma and regulates tumor cell growth by targeting MIG-6. Neoplasma. 2018;65:753–761. doi: 10.4149/neo_2018_171125N762. [DOI] [PubMed] [Google Scholar]
- 34.Chen Q, Zhou XW, Zhang AJ, He K. ACTN1 supports tumor growth by inhibiting Hippo signaling in hepatocellular carcinoma. J Exp Clin Cancer Res. 2021;40:23. doi: 10.1186/s13046-020-01821-6. [DOI] [PMC free article] [PubMed] [Google Scholar]
- 35.Huang XY, Huang ZL, Zhang PB, Huang XY, Huang J, Wang HC, Xu B, Zhou J, Tang ZY. CircRNA-100338 is associated with mTOR signaling pathway and poor prognosis in hepatocellular carcinoma. Front Oncol. 2019;9:392. doi: 10.3389/fonc.2019.00392. [DOI] [PMC free article] [PubMed] [Google Scholar]
- 36.Liu H, Wang X, Feng B, Tang L, Li W, Zheng X, Liu Y, Peng Y, Zheng G, He Q. Golgi phosphoprotein 3 (GOLPH3) promotes hepatocellular carcinoma progression by activating mTOR signaling pathway. BMC Cancer. 2018;18:661. doi: 10.1186/s12885-018-4458-7. [DOI] [PMC free article] [PubMed] [Google Scholar]
Associated Data
This section collects any data citations, data availability statements, or supplementary materials included in this article.


