

Abstract
Ovarian clear cell cancer stem-like/spheroid cells (OCCCSCs) were associated with recurrence, metastasis, and chemoresistance in ovarian clear cell carcinoma (OCCC). We evaluated the anti-tumor effects of 5-aza-2-deoxycytidine (5-aza-dC) combined with everolimus (RAD001) on human OCCC. We investigated parental OCCCSCs and paclitaxel-resistant cell lines derived from OCCCSCs in vitro and in vivo. A Western blot analysis showed that the 5-aza-dC and RAD001 combination therapy was associated with the COL6A3-AKT-mTOR pathway. The OCCCSCs expressed high levels of stemness markers: CD117, ALDH1, NANOG, OCT4, and CD133. The 5-aza-dC and RAD001 combination inhibited proliferation and survival with up to 100-fold more potency in OCCCSCs compared to OCCC cells. This combination showed significant anti-tumor activity; it preferentially diminished OCCCSC stemness levels and spheroid numbers in vitro. Limiting dilution assays showed that OCCCSCs possessed tumor-initiating capacity. The 5-aza-dC and RAD001 combination significantly enhanced the inhibition of tumor growth compared to the 5-aza-dC or RAD001 alone. OCCCSCs showed higher expression levels of COL6A3, phospho-AKT, phospho-mTOR, and phospho-Rictor compared to OCCCs. Silencing COL6A3 or abolishing the phospho-AKT-mTOR-Rictor pathway with 5-aza-dC and RAD001 treatment further enhanced OCCCSC apoptosis and reduced OCCCSC stemness. In conclusion, 5-aza-dC combined with RAD001 effectively controlled OCCC and OCCCSC growth by inhibiting the COL6A3-AKT-mTOR pathway.
Keywords: 5-aza-2-deoxycytidine, everolimus, ovarian cancer, ovarian clear cell, cancer stem cells, COL6A3-AKT-mTOR pathway
Introduction
Ovarian clear cell carcinomas (OCCCs) account for 12% of ovarian cancers. OCCCs have become the second most common subtype of epithelial ovarian cancer in North America [1]. A relatively high frequency of OCCC (16-25%) was observed in Taiwan and Japan [2,3]. The early stages (Stages I and II) of OCCCs and other subtypes are often associated with a good prognosis. However, advanced-stage OCCCs are a poor response to chemotherapy, and this chemoresistance was associated with a grave prognosis [2-5]. The treatment response rate of relapsed or refractory OCCC was lower than 10% even in platinum-sensitive OCCC patients, which was lower than other histologic types, such as serous type [6]. Therefore, we urgently need to develop novel strategies for overcoming OCCC chemoresistance.
Although chemotherapy might initially kill most cancer cells, the residual surviving cancer cells are usually cancer stem-like/spheroid cells (CSCs). These CSCs populations are intrinsically resistant to chemotherapy, and the surviving CSCs can subsequently propagate and give rise to recurrent tumors. In suspension, CSCs can form spheres, which indicates that they have the property of self-renewal, proliferation, and multipotency [7]. Thus, CSCs are typically induced to become “spheroids” to enrich and demonstrate the stemness properties and mesenchymal-like characteristics of the isolated cells [8].
Akt targets the tuberous sclerosis proteins 1 and 2 (TSC1 and TSC2), which form the TSC1/TSC2 complex and negative regulation of mTOR function. Akt phosphorylates the TSC1/TSC2 complex, which then affects several substrates and promotes cell growth and protein synthesis [9]. OCCCs were shown to be highly responsive to mTORC1-targeted therapy [10]. However, rapalogs cannot inhibit the activity of mTORC2 to achieve sufficient anti-cancer effect due to feedback to activate the Akt survival signaling pathway [11]. Clinically, dual PI3K-mTOR1/2 inhibitors, such as BEZ235 and XL765 applied in cancer patients, exhibit severe hyperglycemia and gastrointestinal toxicity [12,13]. These observations indicate that a dual inhibition at a therapeutic dose may result in better tumor efficacy than monotherapy. However, it also caused severe systemic toxicity. Therefore, the rationale of combination treatment with other targeted drugs has been proposed to inhibit cancer progression, overcome drug resistance, and reduce additive side effects.
Epigenetic changes, such as abnormal DNA methylation, are associated with resistance to mTOR inhibitors [14]. To overcome mTOR inhibitors’ drug resistance, 5AZA-dC to everolimus mTORC1 targeting agent in medullary thyroid cancer cells has been shown a strong synergistic antiproliferative activity through the induction of apoptosis [15]. Our previous study also demonstrated 5-aza-dC followed by RAD001 could enhance antitumor efficacy and apoptosis not only in paclitaxel-sensitive but also in paclitaxel-resistant OCCCs [16]. In a phase II trial, patients with platinum-resistant ovarian cancer who were given low-dose decitabine before carboplatin showed promising results. Among 17 heavily pretreated and platinum-resistant ovarian cancer patients, the objective response rate was 35%, and the progression-free survival was 10.2 months, of which nine patients (53%) were free of progression at 6 months [17].
Collagen VI (COL6A3) was reported to contribute to cisplatin resistance in ovarian cancer [18]. Silencing COL6A3 interrupted the PI3k-Akt signaling pathway, which inhibited gastric cancer cell proliferation, migration, and invasion [19]. However, the expression levels of COL6A3, phospho-AKT, mTORC1 (p-mTOR), and mTORC2 (p-Rictor) were higher in OCCC stem-like/spheroid cells (OCCCSCs) than in OCCCs. Thus, everolimus (RAD001) was not sufficient to suppress this pathway.
We hypothesized that silencing COL6A3 participation in the AKT-mTOR pathway might play a vital role in the treatment of OCCCSCs. We recently demonstrated that administering RAD001 after 5-aza-dC provided promising anti-tumor effects against both chemosensitive and chemoresistant OCCCs [16]. However, it remains unclear whether this combination might effectively target OCCCSCs as well as OCCCs. We found the combination treatment with RAD001 and 5-aza-dC had strong synergistic antiproliferation in OCCCSCs compared to OCCCs. When 5-aza-dC was combined with RAD001, we observed up to 100-fold more potency for inhibiting proliferation and survival in OCCCSCs compared to OCCCs. The present study aimed to provide proof-of-concept that RAD001 combined with 5-aza-dC could target OCCCSCs by disrupting the COL6A3-AKT-mTOR pathway.
Materials and methods
The Institutional Review Board of our hospital approved the study protocol. All patients provided informed consent before samples were collected. Ascites samples obtained during surgery or for symptom relief in patients with primary or recurrent ovarian cancer were immediately taken to the laboratory for processing.
Cell lines and cultures
ES2 and TOV21G cell lines were obtained from American Type Culture Collection (ATCC). ES2 and TOV21G cells were maintained in a humidified atmosphere containing 5% CO2 at 37°C and were grown in McCoy’s 5A medium with 10% FBS. We developed paclitaxel-resistant ES-2 and TOV21G cell lines by continuously exposing cells to paclitaxel, as previously described [16]. The final paclitaxel concentrations used to induce paclitaxel-resistant subclones-called ES2TR and TOV21GTR- were 160 and 200 nM, respectively.
Tumorsphere formation of ovarian cancer stem-like cells
To induce tumorsphere formation, ES2 and ES2TR160, TOV21G and TOV21GTR cells, and ascites isolated from patients with OCCC were cultured in tumorsphere (spheroid) inducing conditions. Briefly, cells were cultured in DMEM/F12 medium with 20 ng/mL bFGF, 20 ng/mL EGF, 10 ng/mL IGF, and 2% B27 (Invitrogen, Carlsbad, CA), with or without 5-aza-dC or RAD001. Dissociated single cells (1×10⁵ cells/mL) were then seeded into ultra-low attachment plates (Corning 3262, Pittston, PA). After 7 days, we counted the number of spheres formed with an Olympus light microscope (Olympus, Tokyo, Japan). Then, tumorspheres obtained after 14 days were harvested and analyzed with flow cytometry.
Reagents/antibodies
Paclitaxel was purchased from Genovate Biotechnology (Hsinchu, Taiwan). 5-aza-2-dC was purchased from Cell Signaling Technology (Beverly, MA). RAD001 was obtained from Novartis Pharma AG (Taipei, Taiwan). ECL Western blotting detection reagents were from Perkin Elmer (Boston, MA). Antibodies that specifically recognized COL6A3, mTOR, phospho-mTOR (Ser2448), Rictor, phospho-Rictor, AKT, phospho-AKT (Ser473), phospho-AKT (Thr308), and GAPDH were purchased from Cell Signaling Technology (Beverly, MA). The Cell Titer 96-well proliferation assay kit was obtained from Promega (Madison, WI).
RNA preparation and quantitative real-time PCR
RNA was isolated with TriPure reagent (Roche) and stored at -80°C before use. The quantity and quality of RNA were evaluated with spectrophotometry. Quantitative real-time PCR was performed with a LightCycler Nano (Roche, Upper Bavaria, Germany), the Hs00369360g1 QIAGEN SYBRGreen Gene Expression Assay, and primers. The primers were designed to detect TWIST1 (QT00011956), Snai1 (QT00010010), Snai2 (QT00044128), MDR1 (QT00081928), ABCG2 (QT00073206), HIF-1α (QT00083664), HIF-2α (QT00069587), and GAPDH (QT01192646); GAPDH served as an internal control. We applied the following thermocycling conditions: 2 min at 50°C, 10 min at 95°C, and then 40 cycles of 95°C for 15 s and 60°C for 1 min. The interpolated number (Ct) of cycles needed to reach a fixed threshold above the background noise was used to quantify amplification. The Hs00369360g1 assay and primers-including primers for detecting COL6A3-were applied with an ABI-7300 Sequence Detection System (Applied Biosystems, Foster, CA). The primer sequences used for detecting COL6A3 were: F-GTGTTCTCGGTGAGCACCTT and R-CAGCAGTTGAGAGTGATGCTG.
Flow cytometric analysis
Specific markers expressed in ovarian parental and cancer stem-like cells were analyzed with flow cytometry (FACSCalibur, BD Biosciences, Erembodegem, Belgium). To identify specific cell types, we applied fluorescein isothiocyanate- or phycoerythrin-conjugated antibodies against OCT4, NANOG, AC133, ABCG1, ABCG2, HIF-1α, and HIF-2α (BioLegend Cat.372804, San Diego, CA). ALDH1 (Assaypro Cat.32005-05141, St Charles, MO), AC133 (BioLegend Cat.372804, San Diego, CA), AC117 (BD-555714, Franklin Lakes, NJ), and CD44 (Bio-Rad-MCA89F, Hercules, CA).
Cytotoxicity
We assessed the sensitivities of ES2 and ES2TR160 cells or their derived spheroids to paclitaxel or RAD001 with an MTT assay (Sigma, M5655, Saint Louis, MO). Briefly, tumor cells (4000 cells/well) were placed in a 96-well plate and exposed to paclitaxel and/or RAD001 at the indicated concentrations for 72 h at 5% CO2 and 37°C. Control cells were exposed to culture medium alone. MTT was added to the cells at a final concentration of 0.5 mg/ml. Cells were incubated at 37°C for 3 h. Next, the cultured medium was removed, and 200 μL DMSO (Sigma) was added to dissolve the blue formazan crystals. The optical density was measured at 490 nm with a universal microplate reader Elx800 (Bio-Tek Instruments). IC50 values (the concentration of drugs that produced a 50% reduction of absorbance) were calculated and recorded.
Cell proliferation
Cell proliferation was also determined with MTT assays, as described previously [16]. Briefly, we plated ES2, ESTR160, TOV21G, TOV21GTR cells, or their derived tumorsphere cells at 1×10⁴ cells/well in 6-well plates. We treated the cells with different doses of 5-aza-dC, RAD001, 5-aza-dC combined with RAD001, or paclitaxel in growth media for 1, 3, 5, and 7 days, at 5% CO2 and 37°C. Then, the MTT solution was added to each well, and cells were incubated at 37°C for 3 h, as described previously. The medium was then aspirated and replaced with a solubilization solution (DMSO). The plates were evaluated on a Micro Elisa reader (Anthos 2001) at 570 nm.
Caspase-3/7 activity
Caspase-3/7 activities were quantitatively determined with the Caspase-Glo 3/7 assay kit (Promega, G8091, Madison, WI), according to the manufacturer’s instructions. Briefly, ES2 and ES2TR160 parental cells and tumorspheres were seeded and treated with 5-aza-dC, RAD001, or 5-aza-dC combined with RAD001, as described in section 4.7. After 24 h, cells were lysed and luminogenic substrates specific for the caspase species were added. Light emissions were measured in a luminometer (Berthold Technologies, Wildbad, Germany).
Western blot analysis
Parental tumor cells and tumorspheres were treated with a Protein Extraction Solution (iNtRON-17081, Korea). Lysates were separated with SDS-PAGE (12.5%) and transferred to a PVDF membrane (NEF-1002001PK, Perkin Elmer, Boston, MA). The membrane was blocked in blocking buffer (TBS, with 0.2% Tween 20 and 1% I-block) and incubated with the appropriate polyclonal antibodies for 1 h. A purified rabbit anti-human GAPDH polyclonal antibody (Santa Cruz Biotechnology, Inc., Santa Cruz, CA) was applied at the same time to serve as the endogenous control. The GAPDH signal was used to normalize the signals generated from the antibodies against mTOR, p-mTOR, Rictor, p-Rictor, AKT, p-Akt (Ser473), p-Akt (Thr308), and COL6A3 (Cell Signaling). After washing the membrane, we applied an alkaline phosphatase-conjugated anti-rabbit secondary antibody (Vector Laboratories). The membrane was washed, and the bound antibodies were visualized by developing with the NBT/BCIP chromogens.
COL6A3 shRNA transfection into ES2 and ES2TR160 cells
We performed a COL6A3 knock-down by transfecting cells with human pLKO.1 lentiviral shRNA plasmids (from The RNAi Consortium). The shRNA target sequences were: COL6A3#1: 5’-GCTTTGCACATATTCGAGATT-3’. COL6A3#2: 5’-GCCCTCATCCAAAGCATCAAA-3’, COL6A3#3: 5’-CGCGACTTTGTAATGAACCTA-3’, COL6A3#4: 5’-CCTTAATCTATGTGCACCGTT-3’, COL6A3#5: 5’-GTGGTTAAGATGCTCCGTGAA-3’.
Animal experiments
NOD/SCID (NOD.CB17 Prkdc scid/Jnarl) mice were purchased from the National Animal Center (Taipei, Taiwan) and maintained following institutional policies. All experiments were approved by the Institutional Animal Care and Use Committee of Cathay General Hospital.
In the first experiments, 5-7-week-old nod/scid mice were inoculated subcutaneously in bilateral flanks with 1×10³ or 1×10⁴ parental and tumorsphere ES2 and ES2TR160 cells on day 0. Mice were then subcutaneously treated with 200 μL PBS or 0.25 mg/kg 5-aza-dC for 3 days (days 1-3). When the tumors reached approximately 50 mm3 (around day 8), the mice were randomized into 3 groups-a PBS control group (n=5); a RAD001 test group, which received 5 mg/kg RAD001 orally (n=3) twice per week; and a RAD001 plus 5-aza-dC group, which received 5 mg/kg RAD001 orally twice per week and a 5-aza-dC induction (n=3). Tumor volumes were measured every 2 days after the start of treatment. Tumor growth was measured with calipers, and volumes were calculated based on the modified ellipsoid formula-L×W×W/2-at the indicated time points. All experiments were carried out in duplicate.
In the second experiment, mice were inoculated subcutaneously with 1×10³ or 1×10⁴ ES2TR160 cells, ES2 cells, or ES2TR160 spheroids. Tumor volumes were measured every week.
In the third experiment, mice were inoculated subcutaneously with 5×10⁴ ES2 or ES2TR160 cells transfected with vector alone or with spheroid cells transfected with the COL6A3 shRNA. Tumor volumes were measured every week.
In the fourth experiment, mice were inoculated subcutaneously in bilateral flanks with 3×10⁴ ES2 and ES2TR160 tumorsphere cells or COL6A3-shRNA ES2 and ES2TR160 tumorsphere cells on day 0. Mice were then subcutaneously treated with 200 μL PBS or 0.25 mg/kg 5-aza-dC for 3 days (days 1-3). When the tumors reached approximately 50 mm3 (around day 8), the mice were randomized into 3 groups- a PBS control group (n=5); a paclitaxel test group (n=5), which received 20 mg/kg per week, and a RAD001 plus 5-aza-dC group (n=5), which received 2.5 mg/m2 RAD001 orally twice per week and a 5-aza-dC induction.
Results
Preferential expression of stemness, drug resistance, and EMT markers in ES2 and ES2TR160 cells and tumorspheres
Compared to their parental cells, the ES2 and the ES2TR160 tumorspheres expressed higher levels of pluripotent factors-OCT4, NANOG, CD44, and AC133 (Figure 1A), and characteristic drug-resistance factors-ABCG1, ABCG2, and the hypoxia-related factors, HIF-1α and HIF-2α (Figure 1B). Furthermore, ES2 and ES2TR160 tumorspheres exhibited epithelial-mesenchymal-transition (EMT) properties, with elevated levels of SNAI1, SNAI2, and TWIST1 (Figure 1B), compared to parental cells. In addition, ES2 and ES2TR160 (Figure 1C), and TOV21G and TOV21GTR200 (Figure 1D) tumorspheres expressed higher percentages of stemness markers-ALDH1/CD44- than their parental cells, based on flow cytometry. In various human ovarian cancer cell lines, the percentage of tumorspheres that expressed CD117 was higher than the percentage observed in the corresponding parental cells (Figure 2A). To make the data more convincing, we measured the protein levels of pluripotent factors-OCT4, NANOG, CD44, AC133, and characteristic drug-resistance factors-ABCG1, ABCG2, and the hypoxia-related factors, HIF-1α and HIF-2α in addition to mRNA levels. Compared to their parental cells, the ES2 and the ES2TR160 tumorspheres expressed higher levels of pluripotent factors-OCT4, NANOG, and AC133, and characteristic drug-resistance factors-ABCG1, ABCG2, and the hypoxia-related factors, HIF-1α and HIF-2α (Figure 2B).
Figure 1.

Expression of cell markers in ES2 and ES2TR160 tumorspheres (TS). Quantitative RT-PCR results show the expression levels of (A) pluripotent factors-OCT4, NANOG, CD44, and AC133 in ES2, ES2 TS, ES2 TR160 and ES2TR160 TS. (B) EMT-related factors-SNAI1, SNAI2, and TWIST1, and drug resistance-related factors-ABCG1, ABCG2 HIF-1α and HIF-2α in ES2, ES2 TS, ES2 TR160 and ES2TR160 TS. (C) Percentages of ALDH1/CD44-expressing cells among ES2, ES2 TS, ES2 TR160 and ES2TR160 TS by flowcytometric analysis. (D) Percentages of ALDH1/CD44-expressing cells among TOV21G, TOV21G TS, TOV21GTR200, and TOV21GTR200 TS by flowcytometric analysis.
Figure 2.

Expression of cell markers in ES2 and ES2TR160 cells and tumorspheres. A. Percentages of CD117-expressing cells among various parental tumor cells and their TS by flowcytometric analysis. B. Percentages of pluripotent factors-OCT4, NANOG, CD44, and AC133, EMT-related factors-SNAI1, SNAI2, and TWIST1, and drug resistance-related factors-ABCG1, ABCG2 HIF-1α and HIF-2α in ES2, ES2 TS, ES2 TR160, and ES2TR160 TS by flowcytometric analysis. (*P<0.05, **P<0.01, ***P<0.001, all by students’ t-test).
Stemness and proliferation inhibited by 5-aza-dC and RAD001 in paclitaxel-sensitive and paclitaxel-resistant cells
As shown in Figure 2A, the percentage of ALDH1-expressing ES2 and ES2TR160 tumorspheres increased after paclitaxel treatment. In contrast, the percentages of AC117-expressing ES2 and ES2TR spheroids significantly decreased after 5 nM or 10 nM paclitaxel treatment (Figure 3A). However, the percentages of ALDH1- and AC133-expressing parental and tumor spheroid cells decreased after 5-aza-dC and/or RAD001 treatment (Figures 3B and 4A).
Figure 3.
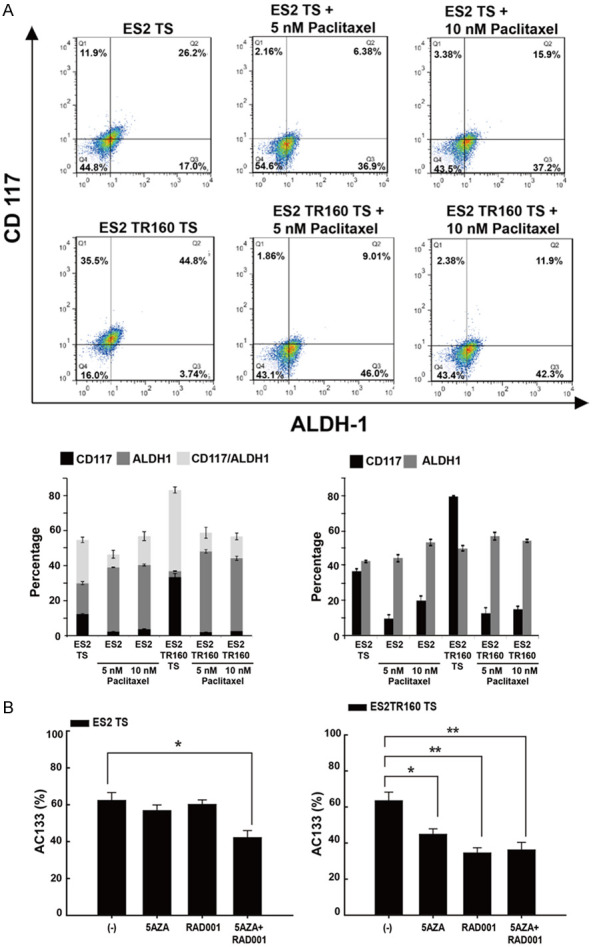
Effects of anti-tumor drugs on stemness markers expression and cell proliferation of tumor cell lines and their tumorspheres (TS) by flow cytometric analysis. A. Percentages of CD117, ALDH1, CD117/ALDH1-expressing ES2, ES2TR160, ES2 TS, and ES2TR160 (TS) treated with or without paclitaxel by flow cytometric analysis. B. Percentages of AC133 expression of ES2 or ES2TR160 and their tumorspheres treated with 10 μM 5-aza-dC (5AZA) and/or IC50 of RAD001 by flowcytometric analysis. (*P<0.05, **P<0.01, ***P<0.001, all by students’ t-test).
Figure 4.
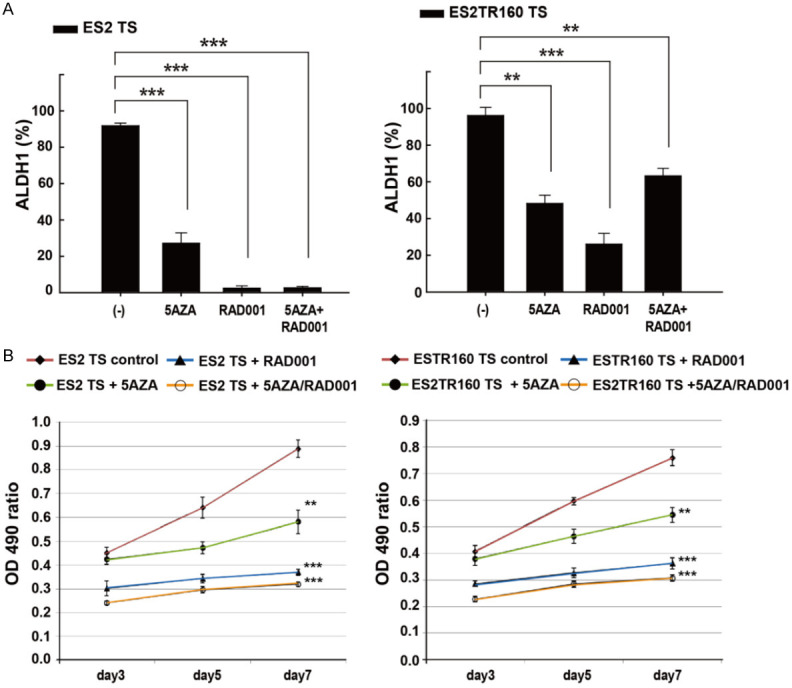
A. Effects of anti-tumor drugs on stemness markers expression and cell proliferation of tumor cell lines and their tumorspheres (TS) by flow cytometric analysis and MTT assay. Percentages of ALDH1 expression of ES2 or ES2TR160 and their tumorspheres treated with 10 μM 5-aza-dC (5AZA) and/or IC50 of RAD001 by flowcytometric analysis. B. Cell proliferation assays of ES2 TS and ES2TR160 TS in the absence or presence of 10 μM 5-aza-dC and/or 10 μM RAD001 for seven days by MTT assays. (**P<0.01, ***P<0.001, all by students’ t-test).
We also evaluated the effects of 5-aza-dC and/or RAD001 on tumor cell proliferation. We found that, in ES2 and ES2TR160 spheroid cells, 5-aza-dC inhibited proliferation by 35% and 28%, and RAD001 inhibited proliferation by 58% and 52%, respectively (Figure 4B). The combination of 5AZA-dC and RAD001 also synergistically inhibited ES2 and ES2TR160 spheroid cell proliferation by 64% and 59%, respectively (Figure 4B).
ES2 and ES2TR160 spheroid yield reduced with 5-aza-dC followed by RAD001
Figure 5A shows representative images of ES2 spheroids after treating with 5-aza-dC and/or RAD001. The numbers of ES2 and ES2TR160 spheroids significantly decreased after treatment with 1 μM 5-aza-dC and/or 100 μM RAD001 (Figure 5B). Treatment with 5-aza-dC followed by RAD001 caused a larger reduction in the numbers (24±2%) and sizes of ES2 and ES2TR160-derived spheroids, compared to treatment with 5-aza-dC or RAD001 alone (P<0.001). However, 5-aza-dC, but not RAD0001, significantly reduced the fraction of ES2 and ES2TR160 tumorspheres found in G1 of the cell cycle (Figure 5C).
Figure 5.
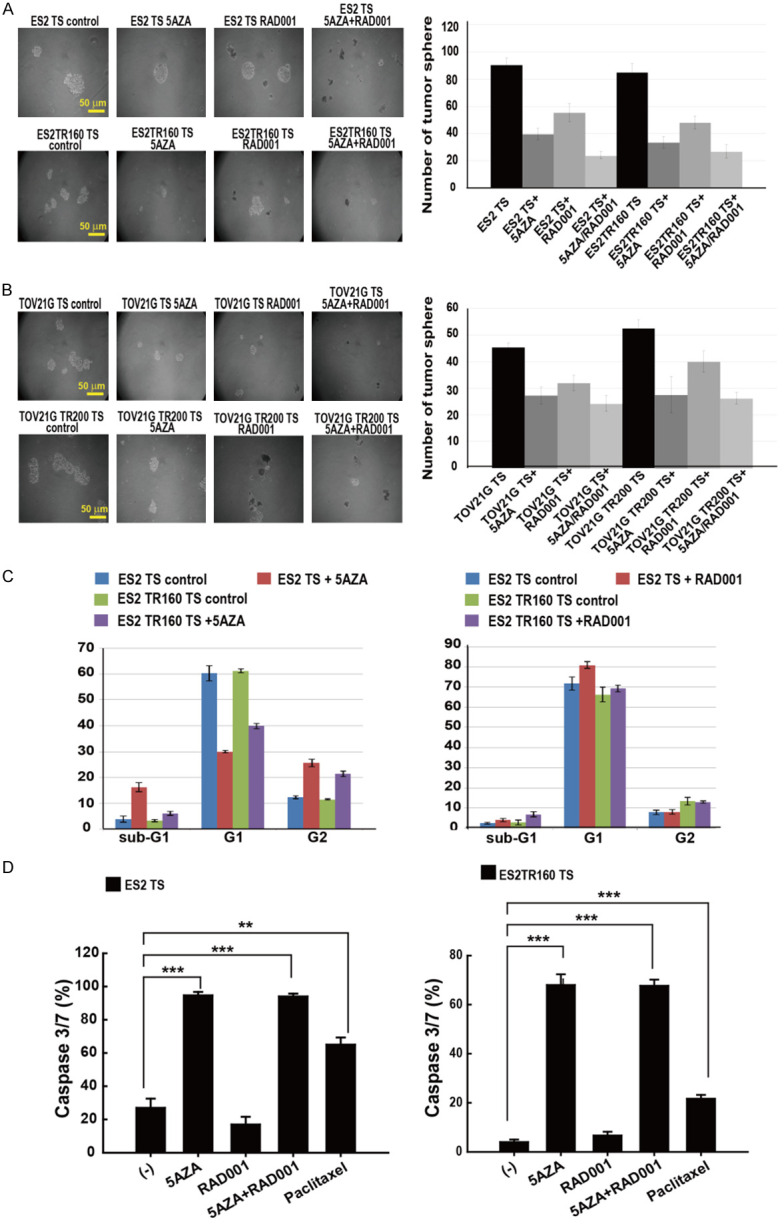
Anti-tumor effects of 5-aza-dC and RAD001 on ES2 and ES2TR160 TS, and TOV21G and TOV21G200 (tumorspheres). A. Representative images of ES2 and ES2TR160 TS treated without or with 5-aza-dC and/or RAD001. B. The numbers of tumorspheres formed in ES2, ES2TR160, TOV21G, and TOV21GTR200 cultures treated without or with 5-aza-dC and/or RAD001. C. Distribution of different stages of the cell cycle of tumor cells and their tumorspheres treated without or with 5-aza-2-dC (left) or RAD0001 (right) by flow cytometric analysis. D. Caspase 3/7 activity in ES2 and ES2TR160-derived spheroids treated without or with 10 μM 5-aza-dC and/or IC50 of RAD001 or paclitaxel. (**P<0.01, ***P<0.001, all by students’ t-test).
5-Aza-dC followed by RAD001 induced caspase 3/7 activity in spheroids
Treatment with 5-aza-dC, either alone or followed by RAD001, significantly increased caspase 3/7 activities in both ES2 and ES2TR160-derived spheroid cells (P<0.001, student’s t-test, Figure 5D).
Cytotoxicity of paclitaxel, 5-Aza-dC, and RAD001 in spheroids
Paclitaxel exhibited a significantly higher IC50 in ES2TR160 spheroids (461 nM) than in ES2 cells (23.5 nM; P<0.001), ES2 spheroids (25.7 nM; P<0.001), and ES2TR160 cells (220 nM; P<0.05). However, the IC50 of RAD001 in ES2 cells (157 μM) was similar to those observed in ES2TR160 cells (127 μM; P=0.069), ES2 spheroids (153 μM; P=0.520), and ES2TR160 spheroids (156 μM; P=0.340). The IC50 of RAD001 was 138.7 μM in tumor spheroids that were cultured from ascites of a patient with recurrent OCCC. This IC50 was similar to that observed for RAD001 in ES2TR160 spheroids. In contrast, the IC50 of paclitaxel in ascites was 13.8 μM, which was 30-fold higher than that observed for paclitaxel in ES2TR160 spheroids.
These results suggested that RAD001 cytotoxicity could occur at similar concentrations in both paclitaxel-sensitive and paclitaxel-resistant ES2 cells and ES2-derived spheroids.
Inhibitory effects of RAD001 on paclitaxel-sensitive and paclitaxel-resistant OCCC-derived spheroids
Paclitaxel inhibited the proliferation of ES2 cells and ES2TR160 spheroids in a dose-dependent manner (Figure 6A). After 7 days, paclitaxel treatment inhibited growth by 46-92% in ES2 spheroids treated with 23.5 nM or 70.5 nM and by 14-53% in ES2TR160 spheroids treated with 160 nM or 461 nM paclitaxel. As shown in Figure 4A, RAD001 also inhibited the proliferation of ES2 cells and ES2TR160 spheroids in a dose-dependent manner. In ES2 spheroids and ES2TR160 spheroids treated for 7 days with 159 μM and 459 μM RAD001, respectively, growth was inhibited by 60-99% and 48-82%, respectively.
Figure 6.
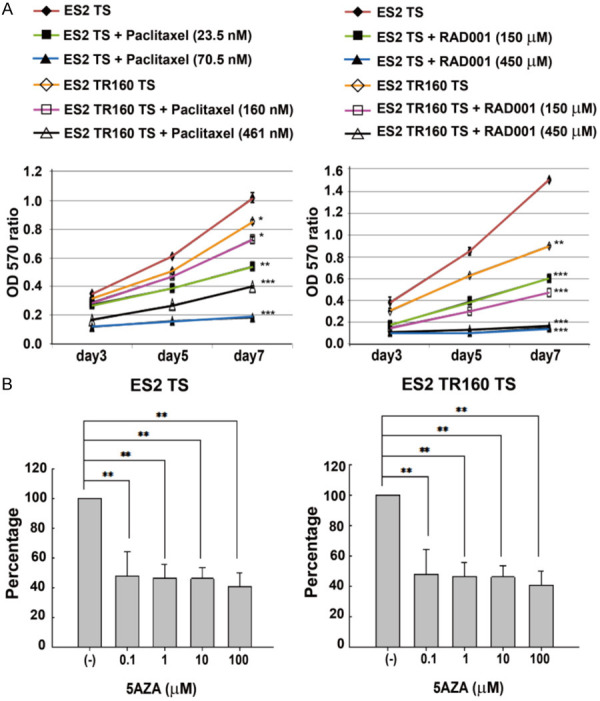
Time- and dose-dependent effects of anti-tumor drugs on tumor tumorsphere viability. A. Time course of ES2 and ES2TR160 tumorsphere (TS) proliferation in the absence or presence of different doses of paclitaxel or RAD001. B. The percentage of proliferation in ES2 and ES2TR160 tumorspheres when treated with the IC50 of RAD001 followed by different concentrations of 5-aza-2-dC (0, 0.1, 1, 10, 100 μM). (*P<0.05, **P<0.01, ***P<0.001, all by students’ t-test).
In vitro growth inhibited by 5-Aza-dC and RAD001 in paclitaxel-sensitive and paclitaxel-resistant OCCC cell-derived spheroids
The IC50 of 5-aza-dC was over 1 mM in ES2 and ES2TR160 spheroids. However, treatment with the IC50 of RAD001 followed by 0.1-100 μM 5-aza-2-dC achieved significant inhibition of proliferation in ES2 and ES2TR160 spheroids (Figure 6B). Conversely, treatment with a fixed dose of 10 μM 5aza-dC followed by 0.1-1000 μM RAD001 also achieved significant inhibition of proliferation in ES2 and ES2TR160 spheroids, particularly at 150 μM RAD001, compared to treatment with 5-aza-dC alone, RAD001 alone, or paclitaxel (Figure 7A). When 5-aza-dC was combined with RAD001, we observed up to 100-fold more potency for inhibiting proliferation and survival in OCCCSCs compared to OCCCs. This inhibition was dose-dependent at RAD001 concentrations of 0.1-1000 μM (Figure 7B-D). The combination treatment with RAD001 and 5-aza-dC showed strong synergistic antiproliferation in OCCCSCs compared to OCCCs. In ES2 and ES2TR160 spheroids cells, the combination of RAD001 and 5-aza-dC was highly synergistic (CI: 0.007 for ES2 spheroids, CI: 0.006 for ES2TRspheroids) when either of the two drugs was used with equitoxic concentration (IC50 RAD001, IC50 5-aza-dC). The DRI (DRI calculated for 50% cell survival) of ES2 and ES2TR160 spheroids was 1530 and 1560 for RAD001, and 10000 and 13400 for 5-aza-dC, respectively. In TOV21G and TOV21GTR spheroids, a highly synergistic activity was also detected. The combination index (CI) and drug resistance index (DRI) of OCCCSCs and OCCCs were presented in Table 1.
Figure 7.

Dose-dependent effects of anti-tumor drugs on tumor cells and their tumorsphere viability by MTT assays. (A) Viabilities of ES2 cells and ES2 tumorspheres treated with 5-aza-2-dC and/or RAD001. (B) Viabilities of ES2TR160 cells and ES2TR160 tumorspheres treated with 5-aza-2-dC and/or RAD001. (C) Viabilities of TOV21G cells and TOV21G tumorspheres treated with 5-aza-2-dC and/or RAD001, and (D) Viabilities of TOV21GTR200 cells and TOV21GTR200 tumorspheres treated with 5-aza-2-dC and/or RAD001. (different concentrations of 5-AZA-dC or RAD001, or a fixed dose of 10 μM 5-AZA-dC combined with RAD001 concentrations of 0, 0.1, 1, 10, 100, and 1000 μM). (*P<0.05, **P<0.01, ***P<0.001, all by students’ t-test).
Table 1.
Combination index (CI), dose reduction index (DRI) of everolimus (EV), and 5-aza-2-deoxycytidine (5-aza-dC) combination in cell lines after 6 days of treatment
| Cell line | ED50 (μM) | CI | DRI | ||
|---|---|---|---|---|---|
|
|
|
||||
| EV | 5-aza-dC | EV | 5-aza-dC | ||
| ES2 | 159 | 58000 | 0.812 | 1.23 | >10000 |
| ES2TS | 153 | 39000 | 0.0007 | 1530 | 10000 |
| ES2TR | 127 | 55800 | 0.631 | 1.59 | 698 |
| ES2TRTS | 156 | 13400 | 0.0006 | 1560 | 134000 |
| TOV21G | 100 | >1000 | 0.11 | 10 | >100 |
| TOV21TS | 1 | 100 | 0.011 | 14.3 | 1000 |
| TOV21GTR | 193 | >1000 | 0.052 | 19.3 | >100 |
| TOV21GTRTS | 10 | 700 | 0.01 | 125 | 7000 |
CI50 was calculated for 50% cell survival (ED50) by isobologram analyses performed with CALCUSYN software. DRI was calculated in the case of synergism. It represents the order of magnitude (fold) of dose reduction obtained for ED50 effect in a combination setting as compared to each drug alone.
In vivo tumorigenic capabilities of OCCCs and paclitaxel-resistant spheroids
To determine whether ES2 spheroids and ES2TR160 spheroids retained their tumorigenic capacity, we tested their growth in vivo, in an animal model of tumorigenesis. When we injected mice subcutaneously with 1×10³ ES2 or ES2TR160 spheroids, tumors grew in 2 of 6 mice and 1 of 8 mice, respectively. Moreover, when mice were injected with 1×10⁴ ES2 or ES2TR160 spheroids, 2 out of 3 mice grew tumors in both groups. In contrast, when mice were injected with 1×10⁴ ES2TR160 cells, none of the mice (0/3) grew tumors.
We calculated the tumor initiation fraction (TIF) as the total number of mice that grew tumors/the total number of cells injected in all mice. We found TIFs of 1/9000 in ES2 spheroids, 1/12667 in ES2TR160 spheroids, and 0/32000 in ES2TR160 cells. Thus, the TIFs were 2.5-3.6 folds higher in spheroids than those in ES2TR160 parental cells.
Potent in vivo anti-tumor effects on OCCC spheroid-derived tumors with 5-aza-dC followed by RAD001
To determine whether RAD001 or 5-aza-dC followed by RAD001 could inhibit tumor growth after injecting ES2 or ES2TR160 spheroids in vivo, we employed a subcutaneous xenograft mouse model. The mean ES2 spheroid-derived tumor sizes after 25 days were: 669.6 mm3, in PBS-treated mice, 474.6 mm3 in 5-aza-dC-treated mice, 422.0 mm3 in RAD001-treated mice, and 261.5 mm3 in 5-aza-dC plus RAD001-treated mice (P<0.01, one-way ANOVA, Figure 8A). The mean ES2TR160-derived tumor sizes after 25 days were: 668.2 mm3 in PBS-treated mice, compared to 518.6 mm3 in 5-aza-dC-treated mice, 445.8 mm3 in RAD001-treated mice, and 292.8 mm3 in 5-aza-dC plus RAD001-treated mice (P<0.01, one-way ANOVA, Figure 8B). The 5-aza-dC plus RAD001-treated in ES2 spheroid-derived tumor group showed the lowest tumor weights (0.22±0.05 g) compared to the PBS-treated (0.59±0.10 g), 5-aza-dC-treated (0.31±0.04 g) and RAD001-treated (0.37±0.06 g) groups (P<0.001, one-way ANOVA; Figure 8C), The 5-aza-dC plus RAD001-treated in ES2TR160 spheroid-derived tumor group also showed the lowest tumor weights (0.20 g±0.07 g) compared to the PBS-treated (0.55±0.12 g), 5-aza-dC-treated (0.37±0.05 g) and RAD001-treated (0.34±0.11 g) groups (P<0.001, one-way ANOVA; Figure 8D).
Figure 8.
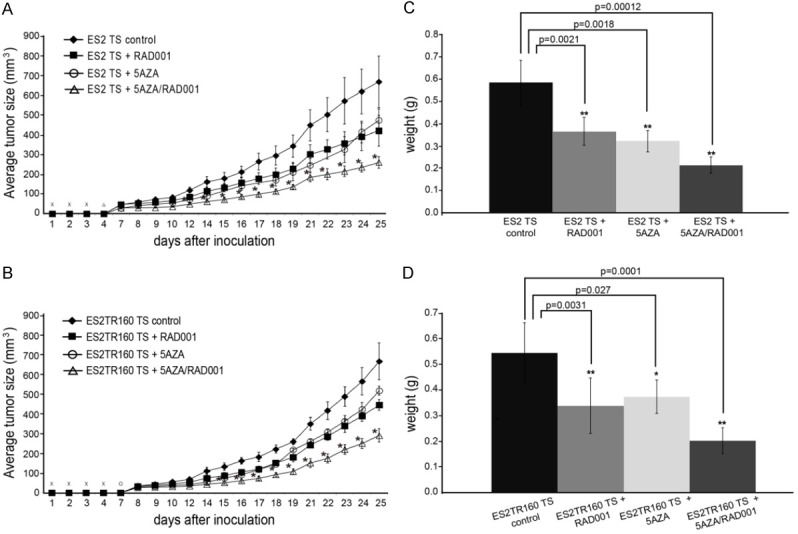
Tumorgenicity of tumorspheres (TS) in vivo. A. Time course of average tumor growth in mice inoculated with ES2 TS treated with 5-AZA-dC and/or RAD001. B. Time course of average tumor growth in mice inoculated with ES2TR160 TS treated with 5-AZA-dC and/or RAD001. C. The average weights of tumors grown in mice after inoculations with ES2 TS treated with 5aza-dC and/or RAD001 on day 25. D. The average weights of tumors grown in mice after inoculations with ES2TR160 TS treated with 5aza-dC and/or RAD001 on day 25. (*P<0.05, **P<0.01, ***P<0.001, all by students’ t-test).
These results indicated that RAD001 combined with 5-aza-dC could generate more potent in vivo anti-tumor effects than RAD001 or 5-aza-dC alone.
Phosphorylation of mTOR, rictor, and AKT was inhibited by 10 μM 5-Aza-dC followed by IC50 of RAD001 in paclitaxel-sensitive and paclitaxel-resistant OCCC spheroids
We evaluated the phosphorylation of mTOR, Rictor, and AKT in the presence and absence of 5-aza-dC and/or RAD001. We found that the phosphorylation levels of mTOR, Rictor, and AKT have elevated more in OCCC spheroids than in OCCC parental cells (Figures 9, 10). Treatment with RAD001 could not inhibit the phosphorylation of mTOR, Rictor, or AKTser473 in OCCC spheroids (Figure 9). Treatment with RAD001 or 5-aza-dC could not inhibit the phosphorylation of mTOR or Rictor in OCCC spheroids. However, 5-aza-dC followed by RAD001 could inhibit the phosphorylation of mTOR and Rictor in both paclitaxel-sensitive and paclitaxel-resistant OCCC spheroids (Figures 9, 10).
Figure 9.
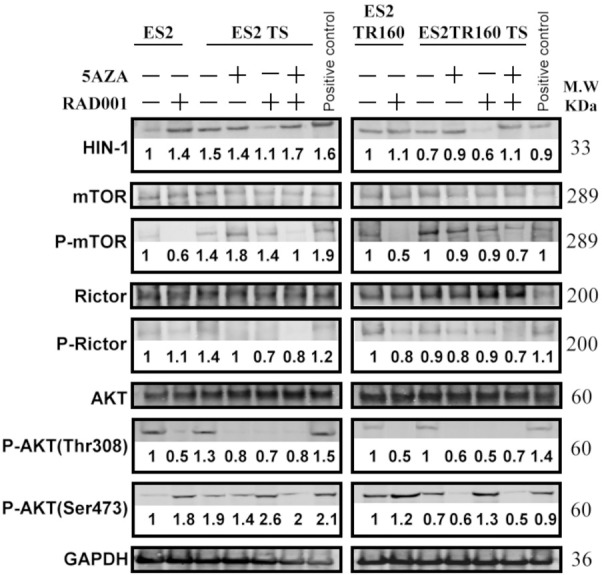
Analysis of anti-tumor drug effects on the mTOR signaling pathway. Western blot results show the HIN1, mTOR, phosphorylation of mTOR (p-mTOR), Rictor, phosphorylation of Rictor (p-Rictor), AKT, phosphorylation of AKT (p-AKT) (Thr308), p-AKT (Ser473), and GAPDH in ES2 cells, ES2 tumorspheres (TS), ES2TR160 cells, and ES2TR160 TS treated with 5-aza-dC, RAD001, or 5-aza-dC combined with RAD001. The numbers in the immunoblot represent the relative folds of HIN-1, p-mTOR, p-Rictor, p-AKT (Thr308), and p-AKT (Ser473) in ES2 cells, ES2 tumorspheres (TS), ES2TR160 cells, and ES2TR160 TS treated with 5-aza-dC, RAD001, or 5-aza-dC combined with RAD001 compared to the control group in ES2 cells without treatment. The numbers in the immunoblot were calculated as target protein density/target protein+GAPDH density and set the control group in ES2 cells without treatment as 1.
Figure 10.

Statistic analysis of anti-tumor drug effects on the mTOR signaling pathway. Statistic analysis results show the relative folds of HIN1, phosphorylation of mTOR (p-mTOR), phosphorylation of Rictor (p-Rictor), phosphorylation of AKT (p-AKT) (Thr308), and p-AKT (Ser473) in ES2 cells, ES2 tumorspheres (TS), ES2TR160 cells, and ES2TR160 TS treated with 5-aza-dC, RAD001, or 5-aza-dC combined with RAD001.
COL6A3 knockdown reversed chemoresistance and spheroid formation, and induced apoptosis in paclitaxel-sensitive and -resistant OCCC spheroids
COL6A3 was previously related to cisplatin resistance in ovarian cancer cells13. We examined whether COL6A3 expression was correlated with the paclitaxel resistance of OCCC spheroids by silencing COL6A3 expression in vitro. The IC50 values of paclitaxel were significantly higher in ES2 (25.7 nM) and ES2TR160 spheroids (461 nM) than in COL6A3-silenced ES2 (1.6 nM, P<0.0001) and ES2TR160 spheroids (0.6 nM, P<0.0001, students’ t-test). These results suggested that COL6A3 inhibition could enhance the response to chemotherapy in both paclitaxel-sensitive and paclitaxel-resistant OCCC spheroids.
We next evaluated whether COL6A3 was associated with the in vitro stemness and in vivo tumorigenesis of OCCC spheroids. COL6A3 expression was remarkably increased in OCCC spheroids compared to OCCCs (Figure 11). 5-aza-dC treatment dose-dependently suppressed COL6A3 expression in OCCC spheroids, but not in OCCC parental cells (Figure 11). Moreover, the numbers of OCCC spheroids were significantly lower in COL6A3-silenced ES2 and ES2TR160 cultures compared to the numbers observed in mock-transfected ES2 and ES2TR160 cultures (Figure 12A). In addition, the percentages of caspase 3/7-expressing cells were significantly higher in COL6A3-silenced ES2 and ES2TR160 spheroids compared to ES2 and ES2TR160 spheroids (Figure 12B). The percentage of caspase 3/7-expressing cells was further enhanced by treating with 5-aza-dC, RAD001, or 5-aza-dC followed by RAD001 (Figure 12B).
Figure 11.

Analysis of the dose-dependent effect of 5-aza-dC on the COL6A3 expression. Western blots and statistic analysis results show COL6A3 expression in ES2 cells, ES2 TS, ES2TR160 cells, and ES2TR160 TS treated with 0, 2, 5, and 10 μM 5-aza-dC. The blots were cropped from the original blots. (*P<0.05, **P<0.01, all by students’ t-test). The numbers in the immunoblot represent the relative folds of COL6A3 in ES2 cells, ES2 TS, ES2TR160 cells, and ES2TR160 TS treated with 0, 2, 5, and 10 μM 5-aza-dC. The numbers in the immunoblot were calculated as COL6A3 density/COL6A3+GAPDH density and set the control group in ES2 cells, ES2 TS, ES2TR160 cells, and ES2TR160 TS without 5-aza-dC treatment as 1.
Figure 12.

Analysis of anti-tumor drug effects on the ES2 and ES2TR160 COL6A3-silenced tumorspheres (TS). A. The numbers and size distributions of ES2 and ES2TR160 tumorspheres compared to the numbers and size distributions in COL6A3-silenced tumorspheres. B. The percentages of caspase 3/7-expressing cells among COL6A3-silenced ES2 and ES2TR160 tumorspheres compared to ES2 and ES2TR160 tumorspheres, treated without or with 10 μM 5-AZA-dC, IC50 of RAD001, 10 μM 5-aza-dC combined with IC50 of RAD001, or paclitaxel. C. The percentages of ALDH1 and AC133-expressing cells among ES2 and COL6A3-silenced ES2 TS treated with 5-aza-2-dC and/or RAD001. D. The percentages of ALDH1 and AC133-expressing cells among ES2TR160 and COL6A3-silenced ES2TR160 TS treated with 5-aza-2-dC and/or RAD001. (*P<0.05, **P<0.01, ***P<0.001, all by students’ t-test).
Treating ES2 spheroids with 5-aza-dC, RAD001, or 5-aza-dC followed by RAD001 caused a reduction in the percentages of ALDH1-expressing cells, but not AC133-expressing cells (Figure 12C). However, the percentages of ALDH1-expressing ES2TR spheroids did not significantly change with 5-aza-dC, RAD001, or 5-aza-dC followed by RAD001 (Figure 12D). We found that ALDH1 expression levels were further reduced with 5-aza-dC, RAD001, or 5-aza-dC followed by RAD001 in COL6A3-silenced ES2TR160 spheroids compared to ES2TR160 spheroids (Figure 12D).
Our results indicated that inhibiting COL6A3 expression could overcome the drug resistance of ES2TR spheroids against 5-aza-dC, RAD001, or 5-aza-dC followed by RAD001 treatment.
Inhibiting COL6A3 reduced the tumorigenicity of OCCC spheroids in vivo
We next examined whether inhibiting COL6A3 could reduce the tumorigenicity of OCCC spheroids in vivo. Among the five mice inoculated with 5×10⁴ COL6A3-silenced ES2 spheroids, none exhibited tumor growth (P=0.002, students’ t-test); in contrast, all five of the mice inoculated with mock-transfected ES2 spheroids tumors had tumor growth. Similarly, one out of ten mice inoculated with 5×10⁴ COL6A3-silenced ES2TR160 spheroids and 6 out of 10 mice inoculated with mock-transfected ES2TR160 spheroids exhibited tumors (P=0.019, students’ t-test). These results indicated that inhibiting COL6A3 expression could reduce the tumorigenicity of ES2 and ES2TR160 spheroids in vivo.
Silencing of COL6A3 through reducing the stemness and increasing the apoptosis was further achieved by treatment with 5-aza-dC and RAD001 in both paclitaxel-sensitive and resistant OCCC spheroids.
We next compared the antitumor effects of 5-aza-dC plus RAD001 with paclitaxel treatment of ES2 and ES2TR160 spheroids and COL6A3-shRNA ES2 and ES2TR160 spheroids in vivo. Among the five mice inoculated with 3×10⁴ ES2 spheroids, 5 exhibited tumor growth; in contrast one out of 5 mice inoculated with 3×10⁴ ES2 spheroids treated with 5-aza-dC plus RAD001 (P<0.01, students’ t-test). However, among the five mice inoculated with 3×10⁴ ES2 spheroids treated with paclitaxel, 5 exhibited tumor growth. Similarly, the tumor size significantly decreased in mice inoculated with 3×10⁴ ES2TR spheroids treated with 5-aza-dC plus RAD001 compared with those without treatment (P<0.05, students’ t-test). However, the tumor size did not significantly decrease in mice inoculated with 3×10⁴ ES2TR spheroids treated with paclitaxel compared with those without treatment (P=0.18). Among the five mice inoculated with 3×10⁴ COL6A3-silenced ES2 or ES2TR spheroids treated with either 5-aza-dC plus RAD001 or paclitaxel, none exhibited tumor growth. The tumor size significantly decreased in mice inoculated with 3×10⁴ COL6A3-silenced ES2TR spheroids treated with paclitaxel or 5-aza-dC plus RAD001 compared with those without treatment (average in size: 0 mm3 vs. 214 mm3; 0 mm3 vs. 68.2 mm3, both ps <0.01).
We examined the effects of 5-aza-dC, RAD001, and 5-aza-dC plus RAD001 treatments on the phosphorylation of mTOR, Rictor, and AKT in COL6A3-silenced paclitaxel-sensitive and paclitaxel-resistant OCCC spheroids (Figure 13). We found that phosphorylation was reduced on Rictor, and AKT-Thr308 in collagen-silenced ES2 and ES2TR spheroids compared to mock-transfected ES2 and ES2TR spheroids. However, the COL6A3 knockdown did not inhibit the phosphorylation of mTOR or AKTser473, in ES2 spheroids, or AKTser473, in ES2TR160 spheroids (Figure 13). Moreover, the phosphorylation of mTOR, Rictor, or AKTser473 could not be completely abolished with RAD001 or 5-aza-2-dC in OCCC spheroids. In contrast, 5-aza-dC followed by RAD001 almost entirely inhibited the phosphorylation of mTOR, Rictor, and AKTser473 in both paclitaxel-sensitive and paclitaxel-resistant COL6A3-silenced OCCC spheroids (Figure 13). Silencing of COL6A3 might enhance abolishing phospho-AKT/mTOR/Rictor by treatment with 5-aza-dC and RAD001 in both paclitaxel-sensitive and resistant OCCC spheroids.
Figure 13.

Effects of anti-tumor drugs on phosphorylation of mTOR-pathway enzymes. Western blot analysis shows the COL6A3, mTOR, phosphorylation of mTOR (p-mTOR), Rictor, phosphorylation of Rictor (p-Rictor), AKT, phosphorylation of AKT (p-AKT) (Thr308), and p-AKT (Ser473) in COL6A3-silenced ES2 and ES2TR160 tumorspheres (TS), treated without (-) or with 5-Aza-dC, RAD001, or 5-Aza-dC combined with RAD001. The blots were cropped from the original blots. The numbers in the immunoblot represent the relative folds of COL6A3, p-mTOR, p-Rictor, p-AKT (Thr308), and p-AKT (Ser473) in COL6A3-silenced ES2 and ES2TR160 TS, treated without (-) or with 5-Aza-dC, RAD001, or 5-Aza-dC combined with RAD001 compared to ES2 and ES2TR160 TS. The numbers in the immunoblot were calculated as target protein density/target protein+GAPDH density and set the control group in ES2 and ES2TR160 TS without treatment as 1.
Discussion
In this study, we established that OCCCSCs possessed stemness properties, drug resistance, and EMT characteristics. ALDH1 has been confirmed as an ovarian CSC marker [20]. High ALDH1 levels were related to chemoresistance and advanced-stage OCCCs, which significantly reduced progression-free survival [21]. OCCC is a unique subtype of epithelial ovarian cancer with resistance to platinum-based chemotherapy. OCCC has a worse prognosis than the most common serous carcinomas, in both first-line and recurrent settings [4,6,22]. Few studies have focused on CSCs in OCCCs. We found that ALDH1, CD133, and CD117 expression levels were consistently higher in OCCCSCs than in OCCCs. In contrast, CD44 was inconsistently higher in OCCCSCs than in OCCCs. Although many studies have shown that CSCs have high expression of CD44+ cells, we found that ALDH1, CD133, and CD117 expression were more representative of OCCCSCs. The expression CD44 seems higher in ES2TR160 spheroid than ES2TR160 parental, but not in ES2 spheroid vs ES2. The IC50 of ES2 spheroid is low as well as ES2 (25.7 nM vs 23.5 nM). Our data confirm that an increase in the number of CD44+ cells increases chemoresistance, which is consistent with previous studies on ovarian cancer cell lines.
When OCCCSCs were treated with paclitaxel- the major anti-cancer drug in advanced ovarian cancer- we observed a reduction in AC117 expression, but not ALDH1 expression. However, RAD001 plus 5-AZA-dC treatment reduced both ALDH1 and AC133 expression in OCCCSCs. Previous studies have shown that the PI3K-mTOR pathway plays an important role in the proliferation of CSCs in solid tumors [23,24]. Caumanns et al. reported mTORC1/2 (AZD8055), PI3K (GDC0941) and MEK1/2 (selumetinib) inhibitors have synergistic effects in a combination of low-dose in a set of genetically diverse OCCC cell lines and OCCC PDX models. Their study stated that a synergistic combination of mTORC1/2, PI3K, and MEK1/2 inhibitors at low-dose is an effective treatment strategy that precludes pathway reactivation induced by low-dose single treatment and is worthy of further exploration in OCCCs [25]. The dual inhibition of PI3K/mTOR and MDM2 significantly reduced the tumor volume in the mouse xenograft model and achieved a synergistic anti-proliferative effect in OCCCs cells without TP53 mutation [26]. However, one study showed that adding temsirolimus to frontline chemotherapy by inhibiting mTORC1 activity did not improve overall survival in patients with primary stages III and IV OCCC, compared to historical controls [27,28].
Recent studies have shown encouraging results by combining PI3K/mTOR inhibitors with hormonal therapy, chemotherapy, or targeted therapy. Those studies demonstrated clinical benefits without significant additional toxicity [29,30]. Currently, several phase II clinical trials (NCT02724020 and NCT02725268) are evaluating the efficacy of a new generation of mTORC1/2 inhibitors, such as MLN0128 (Sapanisertib). A strategy that combines the inhibition of mTOR with PI3K or MEK was proposed to be the most likely to show high clinical benefit in a majority of OCCC patients. In the present study, we demonstrated that RAD001 given after 5-aza-dC inhibited both mTORC1/2 and AKT phosphorylation, possessed anticancer activity, and provided promising anti-tumor effects against both chemosensitive and chemoresistant OCCCSCs. The combinations showed a strong synergistic effect, and CI is less than 0.01. Using the method of Chou-Talalay, it can be proven that the combination of 5-AZA-dC and everolimus is more effective in inhibiting the proliferation of OCCCSCs than using each drug alone. This cytotoxic activity in both chemosensitive and chemoresistant OCCCSCs cells effectively induces apoptosis and has a highly synergistic effect. Our in vivo data revealed the antitumor effect of RAD001 combined with 5-aza-dC could overcome paclitaxel resistance in both chemosensitive and chemoresistant OCCCSCs. Knockdown COL6A3 is effective in treating both chemosensitive and chemoresistant OCCCSCs. Thus, this treatment showed potential for testing in clinical trials in the future.
Compared with the more common serous carcinoma, OCCC is more resistant to platinum-based chemotherapy and has a worse prognosis in the primary and recurrent OCCC [4,6,22]. The response rate of salvage chemotherapy to platinum-sensitive and platinum-resistant clear cell carcinoma is only 9% and 1%, respectively [6], which indicates that new treatment strategies for recurrent clear cell carcinoma of the ovary are urgently needed. A previous study showed patients with platinum-resistant ovarian cancer received low-dose decitabine administered before carboplatin achieved a 35% objective response rate (ORR) and a 10.2-month progression-free survival [17]. Zeng et al. reported a three-drug combination with low-dose DAC pretreatment and reducing-dose of carboplatin/paclitaxel in patients with platinum-resistant/refractory ovarian cancer had a 40.74% of ORR (31.82% for measurable disease), which is tolerable and shows remarkable clinical activity [31]. The anticancer effect of everolimus may be restricted by the absence of the intrinsic inhibition on mTORC2 and the activation of survival pathways in cancer cells [32]. Vitale et al. reported everolimus combined with 5-aza-dC- has synergistic activity in medullary thyroid carcinoma cell lines [15]. Thus, we proposed and proved the concept that everolimus combined with 5-aza-2-deoxycytidine could generate potent anti-tumor effects on OCCCSCs by Inhibiting the COL6A3-AKT-mTOR Pathway. In addition, our previous in vivo study showed the ES2 and ES2TR160 tumor-bearing mice treated with 5-aza and RAD001 had a significantly smaller volume than those treated with PBS alone, 5-AZA, paclitaxel, or RAD001 [16]. The results indicate that 5-aza-dC combined with RAD001 had potent anti-tumor effects in both paclitaxel-sensitive and resistant OCCC tumors. The related experimental and clinical data indicate the potentially high importance of our experimental results to therapeutic practice.
The expression of collagen VI in primary ovarian tumors may correlate with tumor grade and response to chemotherapy [18]. Tumor cells can directly remodel their extracellular matrix through overexpression of COL6A3. This change in the microenvironment is helpful to develop drug resistance in ovarian cancer [18]. COL6A3 is highly expressed in primary and metastatic ovarian cancer tissues and the omentum and ascitic stromal cells (MSc-OCSPCs) within the tumor microenvironment. High expression of COL6A3 is associated with advanced stage and poor survival in EOC. Collagen VI can promote ovarian cancer tumor growth and metastasis in EOC. When ES2 or ES2TR cells were cultured in McCoy’s 5A medium with COL6 proteins, then transferred to a spheroid culture medium, we found that the number of spheroids markedly increased. By contrast, when ES2 and ES2TR cells were cocultured with MSc-OCSPCs/shCOL6A3 for 2 weeks and then transferred to a spheroid culture medium, the development of spheroids was markedly reduced compared with spheroids in cocultures with MSc-OCSPCs. Due to the COL6A3 enhancing spheroid formation in OCCC cells and the CSCs usually representing chemoresistance cells, we hypothesized that COL6A3 might be involved in OCCCSC properties. We first examined an association between COL6A3 expression and paclitaxel resistance. We found that knocking down COL6A3 expression could overcome paclitaxel resistance by reducing the IC50 of paclitaxel in ES2 and ES2TR spheroids. Next, we examined whether COL6A3 was related to stemness features in OCCCSCs cell lines. We confirmed that COL6A3 expression was remarkably higher in OCCCSCs than in OCCCs. Knocking down COL6A3 expression reduced spheroid formation and induced apoptosis in paclitaxel-sensitive and paclitaxel-resistant ES2 spheroids. In vivo, mice subcutaneously injected with 5×10⁴ COL6A3-silenced ES2 and ES2TR160 spheroids showed diminished tumor growth compared to mice injected with ES2 and ES2TR160 spheroids (0/5 vs. 5/5 tumors with ES2 spheroids; 1/10 vs. 6/10 tumors with ES2TR160 spheroids, respectively). Therefore, these preliminary data indicated that COL6A3 expression was involved in the tumorigenicity of ES2 and ES2TR spheroids in vitro and in vivo. Importantly, when COL6A3 expression was knocked down in paclitaxel-resistant ES2 spheroids, 5-Aza-dC followed by RAD001 treatment could reduce the fraction of ALDH1-expressing cells to very low percentages.
Ao et al. reported that COL6A3 gene silencing inhibited cell proliferation, migration, and invasion, but promoted apoptosis, through the PI3K-Akt signaling pathway in gastric cancer [19]. To our knowledge, the present study was the first to show that the COL6A3-AKT-mTOR pathway was involved in OCCCSCs and might serve as a target for treating OCCCS. RAD001, in combination with 5-Aza-dC, effectively targeted cancer stem-like spheroid cells in OCCCs. Silencing COL6A3 enhanced the effects of RAD001 combined with 5-Aza-dC in OCCCSCs, by reducing stemness and promoting apoptosis. Further studies that aim to uncover this mechanism might reveal a strategy for overcoming the chemoresistance and tumorigenicity of OCCCSCs.
We concluded that RAD001 combined with 5-aza-dC effectively targeted cancer stem-like spheroid OCCCs. Silencing COL6A3 enhanced the effects of RAD001 combined with 5-aza-dC in OCCCSCs by reducing their stemness and promoting apoptosis. Therefore, 5-aza-dC combined with RAD001 might effectively control the tumorgenicity of OCCCs and OCCCSCs by inhibiting the COL6A3-AKT-mTOR pathway. This treatment strategy might overcome the chemoresistance and tumorigenicity of OCCCSCs.
Acknowledgements
This work was supported by research funds from the Ministry of Science and Technology (MOST) and Cathay General Hospital in Taiwan (MOST104-2314-B-281-006-MY3, MOST107-2314-B-281-005-MY3).
Disclosure of conflict of interest
None.
Abbreviations
- OCCCSCs
Ovarian clear cell cancer stem-like/spheroid cells
- OCCC
ovarian clear cell carcinoma
- 5-aza-dC
5-aza-2-deoxycytidine
- RAD001
everolimus
- CSCs
cancer stem-like cells
- p-mTOR
mTORC1
- p-Rictor
mTORC2
- COL6A3
Collagen VI
References
- 1.Köbel M, Kalloger SE, Huntsman DG, Santos JL, Swenerton KD, Seidman JD, Gilks CB Cheryl Brown Ovarian Cancer Outcomes Unit of the British Columbia Cancer Agency. Vancouver BC. Differences in tumor type in low-stage versus high-stage ovarian carcinomas. Int J Gynecol Pathol. 2010;29:203–211. doi: 10.1097/PGP.0b013e3181c042b6. [DOI] [PubMed] [Google Scholar]
- 2.Ho CM, Huang YJ, Chen TC, Huang SH, Liu FS, Chang Chien CC, Yu MH, Mao TL, Wang TY, Hsieh CY. Pure-type clear cell carcinoma of the ovary as a distinct histological type and improved survival in patients treated with paclitaxel-platinum-based chemotherapy in pure-type advanced disease. Gynecol Oncol. 2004;94:197–203. doi: 10.1016/j.ygyno.2004.04.004. [DOI] [PubMed] [Google Scholar]
- 3.Itamochi H, Kigawa J, Terakawa N. Mechanisms of chemoresistance and poor prognosis. in ovarian clear cell carcinoma. Cancer Sci. 2008;99:653–658. doi: 10.1111/j.1349-7006.2008.00747.x. [DOI] [PMC free article] [PubMed] [Google Scholar]
- 4.Sugiyama T, Kamura T, Kigawa J, Terakawa N, Kikuchi Y, Kita T, Suzuki M, Sato I, Taguchi K. Clinical characteristics of clear cell carcinoma of the ovary: a distinct histological type with poor prognosis and resistance to platinum-based chemotherapy. Cancer. 2000;88:2584–2594. [PubMed] [Google Scholar]
- 5.Ho CM, Chien TY, Shih BY, Huang SH. Evaluation of complete surgical staging with pelvic and para-aortic lymphadenectomy and paclitaxel plus carboplatin chemotherapy for improvement of survival in stage I ovarian clear cell carcinoma. Gynecol Oncol. 2003;88:394–399. doi: 10.1016/s0090-8258(02)00156-7. [DOI] [PubMed] [Google Scholar]
- 6.Crotzer DR, Sun CC, Coleman RL, Wolf JK, Levenback CF, Gershenson DM. Lack of effective systemic therapy for recurrent clear cell carcinoma of the ovary. Gynecol Oncol. 2007;105:404–408. doi: 10.1016/j.ygyno.2006.12.024. [DOI] [PubMed] [Google Scholar]
- 7.Zhang S, Balch C, Chan MW, Lai HC, Matei D, Schilder JM, Yan PS, Huang TH, Nephew KP. Identification and characterization of ovarian cancer-initiating cells from primary human tumors. Cancer Res. 2008;68:4311–4320. doi: 10.1158/0008-5472.CAN-08-0364. [DOI] [PMC free article] [PubMed] [Google Scholar]
- 8.Rfehi S, Ramos Valdes Y, Bertrand M, McGee J, Préfontaine M, Sugimoto A, DiMattia GE, Shepherd TG. TGFβ signaling regulates epithelial-mesenchymal plasticity in ovarian cancer ascites-derived spheroids. Endocr Relat Cancer. 2016;23:147–159. doi: 10.1530/ERC-15-0383. [DOI] [PubMed] [Google Scholar]
- 9.Manning BD, Cantley LC. Akt/PKB signaling: navigating downstream. Cell. 2007;129:1261–1274. doi: 10.1016/j.cell.2007.06.009. [DOI] [PMC free article] [PubMed] [Google Scholar]
- 10.Mabuchi S, Hisamatsu T, Kimura T. Targeting mTOR signaling pathway in ovarian cancer. Curr Med Chem. 2011;18:2960–2968. doi: 10.2174/092986711796150450. [DOI] [PubMed] [Google Scholar]
- 11.Bhagwat SV, Crew AP. Novel inhibitors of mTORC1 and mTORC2. Curr Opin Investig Drugs. 2010;11:638–645. [PubMed] [Google Scholar]
- 12.Papadopoulos KP, Tabernero J, Markman B, Patnaik A, Tolcher AW, Baselga J, Shi W, Egile C, Ruiz-Soto R, Laird AD, Miles D, Lorusso PM. Phase I safety, pharmacokinetic, and pharmacodynamic study of SAR245409 (XL765), a novel, orally administered PI3K/mTOR inhibitor in patients with advanced solid tumors. Clin Cancer Res. 2014;20:2445–2456. doi: 10.1158/1078-0432.CCR-13-2403. [DOI] [PubMed] [Google Scholar]
- 13.Fazio N, Buzzoni R, Baudin E, Antonuzzo L, Hubner RA, Lahner H, DE Herder WW, Raderer M, Teulé A, Capdevila J, Libutti SK, Kulke MH, Shah M, Dey D, Turri S, Aimone P, Massacesi C, Verslype C. Phase II study of BEZ235 in patients with everolimus-resistant, advanced pancreatic neuroendocrine tumours. Anticancer Res. 2016;36:713–719. [PMC free article] [PubMed] [Google Scholar]
- 14.Bihani T, Ezell SA, Ladd B, Grosskurth SE, Mazzola AM, Pietras M, Reimer C, Zinda M, Fawell S, D’Cruz CM. Resistance to everolimus driven by epigenetic regulation of MYC in ER+ breast cancers. Oncotarget. 2015;6:2407–2420. doi: 10.18632/oncotarget.2964. [DOI] [PMC free article] [PubMed] [Google Scholar]
- 15.Vitale G, Dicitore A, Pepe D, Gentilini D, Grassi ES, Borghi MO, Gelmini G, Cantone MC, Gaudenzi G, Misso G, Di Blasio AM, Hofland LJ, Caraglia M, Persani L. Synergistic activity of everolimus and 5-aza-2-deoxycytidine in medullary thyroid carcinoma cell lines. Mol Oncol. 2017;11:1007–1022. doi: 10.1002/1878-0261.12070. [DOI] [PMC free article] [PubMed] [Google Scholar]
- 16.Ho CM, Lee FK, Huang SH, Cheng WF. Everolimus following 5-aza-2-deoxycytidine is a promising therapy in paclitaxel-resistant clear cell carcinoma of the ovary. Am J Cancer Res. 2018;8:56–69. [PMC free article] [PubMed] [Google Scholar]
- 17.Matei D, Fang F, Shen C, Schilder J, Arnold A, Zeng Y, Berry WA, Huang T, Nephew KP. Epigenetic resensitization to platinum in ovarian cancer. Cancer Res. 2012;72:2197–2205. doi: 10.1158/0008-5472.CAN-11-3909. [DOI] [PMC free article] [PubMed] [Google Scholar]
- 18.Sherman-Baust CA, Weeraratna AT, Rangel LB, Pizer ES, Cho KR, Schwartz DR, Shock T, Morin PJ. Remodeling of the extracellular matrix through overexpression of collagen VI contributes to cisplatin resistance in ovarian cancer cells. Cancer Cell. 2003;3:377–386. doi: 10.1016/s1535-6108(03)00058-8. [DOI] [PubMed] [Google Scholar]
- 19.Ao R, Guan L, Wang Y, Wang JN. Silencing of COL1A2, COL6A3, and THBS2 inhibits gastric cancer cell proliferation, migration, and invasion while promoting apoptosis through the PI3k-Akt signaling pathway. J Cell Biochem. 2018;119:4420–4434. doi: 10.1002/jcb.26524. [DOI] [PubMed] [Google Scholar]
- 20.Sharrow AC, Perkins B, Collector MI, Yu W, Simons BW, Jones RJ. Characterization of aldehyde dehydrogenase 1 high ovarian cancer cells: towards targeted stem cell therapy. Gynecol Oncol. 2016;142:341–348. doi: 10.1016/j.ygyno.2016.03.022. [DOI] [PMC free article] [PubMed] [Google Scholar]
- 21.Mizuno T, Suzuki N, Makino H, Furui T, Morii E, Aoki H, Kunisada T, Yano M, Kuji S, Hirashima Y, Arakawa A, Nishio S, Ushijima K, Ito K, Itani Y, Morishige K. Cancer stem-like cells of ovarian clear cell carcinoma are enriched in the ALDH-high population associated with an accelerated scavenging system in reactive oxygen species. Gynecol Oncol. 2015;137:299–305. doi: 10.1016/j.ygyno.2014.12.005. [DOI] [PubMed] [Google Scholar]
- 22.Winter WE 3rd, Maxwell GL, Tian C, Carlson JW, Ozols RF, Rose G, Markman M, Armstrong DK, Muggia F, McGuire WP Gynecology Oncology Group Study. Prognostic factors for stage III epithelial ovarian cancer: a gynecologic oncology group study. J. Clin. Oncol. 2007;25:3621–3627. doi: 10.1200/JCO.2006.10.2517. [DOI] [PubMed] [Google Scholar]
- 23.Dubrovska A, Kim S, Salamone RJ, Walker JR, Maira SM, Garcia-Echeverria C, Schultz PG, Reddy VA. The role of PTEN/Akt/PI3K signaling in the maintenance and viability of prostate cancer stem-like cell populations. Proc Natl Acad Sci U S A. 2009;106:268–273. doi: 10.1073/pnas.0810956106. [DOI] [PMC free article] [PubMed] [Google Scholar]
- 24.Zhou J, Wulfkuhle J, Zhang H, Gu P, Yang Y, Deng J, Margolick JB, Liotta LA, Petricoin E 3rd, Zhang Y. Activation of the PTEN/mTOR/STAT3 pathway in breast cancer stem-like cells is required for viability and maintenance. Proc Natl Acad Sci U S A. 2007;104:16158–16163. doi: 10.1073/pnas.0702596104. [DOI] [PMC free article] [PubMed] [Google Scholar]
- 25.Caumanns JJ, Berns K, Wisman GBA, Fehrmann RSN, Tomar T, Klip H, Meersma GJ, Hijmans EM, Gennissen AMC, Duiker EW, Weening D, Itamochi H, Kluin RJC, Reyners AKL, Birrer MJ, Salvesen HB, Vergote I, van Nieuwenhuysen E, Brenton J, Braicu EI, Kupryjanczyk J, Spiewankiewicz B, Mittempergher L, Bernards R, van der Zee AGJ, de Jong S. Integrative kinome profiling identifies mTORC1/2 inhibition as treatment strategy in ovarian clear cell carcinoma. Clin Cancer Res. 2018;24:3928–3940. doi: 10.1158/1078-0432.CCR-17-3060. [DOI] [PMC free article] [PubMed] [Google Scholar]
- 26.Makii C, Ikeda Y, Oda K, Uehara Y, Nishijima A, Koso T, Kawata Y, Kashiyama T, Miyasaka A, Sone K, Tanikawa M, Tsuruga T, Mori-Uchino M, Nagasaka K, Matsumoto Y, Wada-Hiraike O, Kawana K, Hasegawa K, Fujiwara K, Aburatani H, Osuga Y, Fujii T. Anti-tumor activity of dual inhibition of phosphatidylinositol 3-kinase and MDM2 against clear cell ovarian carcinoma. Gynecol Oncol. 2019;155:331–339. doi: 10.1016/j.ygyno.2019.08.028. [DOI] [PubMed] [Google Scholar]
- 27.Tamochi H, Kigawa J. Clinical trials and future potential of targeted therapy for ovarian cancer. Int J Clin Oncol. 2012;17:430–440. doi: 10.1007/s10147-012-0459-8. [DOI] [PubMed] [Google Scholar]
- 28.Shu CA, Zhou Q, Jotwani AR, Iasonos A, Leitao MM Jr, Konner JA, Aghajanian CA. Ovarian clear cell carcinoma, outcomes by stage: the MSK experience. Gynecol Oncol. 2015;139:236–241. doi: 10.1016/j.ygyno.2015.09.016. [DOI] [PMC free article] [PubMed] [Google Scholar]
- 29.Kolev VN, Wright QG, Vidal CM, Ring JE, Shapiro IM, Ricono J, Weaver DT, Padval MV, Pachter JA, Xu Q. PI3K/mTOR dual inhibitor VS-5584 preferentially targets cancer stem cells. Cancer Res. 2015;75:446–455. doi: 10.1158/0008-5472.CAN-14-1223. [DOI] [PubMed] [Google Scholar]
- 30.Fang DD, Zhang CC, Gu Y, Jani JP, Cao J, Tsaparikos K, Yuan J, Thiel M, Jackson-Fisher A, Zong Q, Lappin PB, Hayashi T, Schwab RB, Wong A, John-Baptiste A, Bagrodia S, Los G, Bender S, Christensen J, Vanarsdale T. Antitumor efficacy of the dual PI3K/mTOR inhibitor PF-04691502 in a human xenograft tumor model derived from colorectal cancer stem cells harboring a mutation. PLoS One. 2013;8:e67258. doi: 10.1371/journal.pone.0067258. [DOI] [PMC free article] [PubMed] [Google Scholar]
- 31.Zhang Y, Mei Q, Liu Y, Li X, Brock MV, Chen M, Dong L, Shi L, Wang Y, Guo M, Nie J, Han W. The safety, efficacy, and treatment outcomes of a combination of low-dose decitabine treatment in patients with recurrent ovarian cancer. Oncoimmunology. 2017;6:e1323619. doi: 10.1080/2162402X.2017.1323619. [DOI] [PMC free article] [PubMed] [Google Scholar]
- 32.Chan J, Kulke M. Targeting the mTOR signaling pathway in neuroendocrine tumors. Curr Treat Options Oncol. 2015;15:365–379. doi: 10.1007/s11864-014-0294-4. [DOI] [PMC free article] [PubMed] [Google Scholar]