

Abstract
Subcutaneous implantation of a human cancer cell line in immune-deficient mice (CDX) is a commonly used tool in preclinical studies for the assessment of potential anti-cancer drugs. As immunotherapy is transforming cancer treatment, tumor models in immunocompetent mice are necessary for us to understand the immune aspects of tumor biology. However, the systemic immune response to the implantation of cancer cells at proteome level is unclear. In this study, we characterized the dynamic proteomic changes of subcutaneous tumors and 5 immune organs (draining lymph node, mesenteric lymph node, spleen, thymus and marrow) at six time points after implantation using a Hepa1-6 derived allograft mouse model. Our data suggest that interaction of the implanted tumor cells with mouse immune system followed the trajectory of “tumor rejection” to “immune evasion” in that the tumor gained the ability to evade the immune system for growth. Furthermore, anti-PDL2 antibody was validated here as an optional immunotherapy strategy to inhibit the growth of Hepa1-6 subcutaneous tumors. These findings from our study provided valuable information for the understanding of tumor and immune interaction and shed light on the rational design for clinical cancer treatment and other preclinical experiments.
Keywords: Hepa1-6, allograft mouse model, proteomics, PDL2
Introduction
The interaction between cancer cell and its immune environment plays critical roles in tumor outgrowth and in the control of tumor progression. The dynamic changes in cancer cells and the host immune system during tumor rejection to tumor outgrowth, particularly, to the escape from immune-mediated destruction represent bona fide cancer hallmarks [1-3]. Several animal models have been created to examine the complexity of the tumor and its microenvironment. They include syngeneic mouse models, chemotoxic agent mouse models, genetically engineered mouse models, and humanized mouse models [4,5].
Hepatocellular carcinoma (HCC) is one of the most common malignant tumors caused by risk factors such as hepatitis virus infection, excessive alcohol, diabetes, and obesity [6]. The tumor microenvironment (TME) also has a major impact on the development of HCC [7]. Thus, research using immunodeficient animal models limits its application to human HCC [8] as the immunodeficient mice are not suitable for the screening of immune modulation drugs [9]. Although humanized mouse models have been used to study the interactions between the immune system and human derived tumors, the establishment of humanized mouse models is time-consuming and expensive with significant individual variations [10,11]. The subcutaneous allograft tumor model in mouse with competent immune system has a stable genetic background and less heterogeneity in TME. Therefore, murine syngeneic tumor model offers an alternative preclinical model for drug selection and target validation [12].
While the immune-competent mouse models have been used for the preclinical study, the temporal proteomic changes in tumors and in the host immune organs after cancer cell allografting are unknown [13-20]. The immune cell composition of the TME is distinct among different syngeneic tumor models with varying in the degree of immune infiltration and diversity. These tumor models also result in altered systemic immune response in immune organs including tumor-draining lymph node, bone marrow, blood and spleen [21]. In our current study, we used subcutaneous allograft model in immunocompetent C57BL/6J mouse with mouse liver cancer cell line Hepa1-6 to depict a proteomic map. The landscape of proteome changes in tumors and five main immune organs will help us to better understand the molecular mechanisms underlying the tumor growth and its interaction with immunity during this process. Based on our results, we find that the tumor overcomes innate and adaptive immune to achieve the immune escape and grows rapidly in the late stage of tumor growth. The immune protein emerged in the later stage may serve as potential therapeutic targets for cancer treatment.
Materials and methods
Cells and reagents
The HCC cell line Hepa1-6 was obtained from Institute of Basic Medical Sciences of the Chinese Academy of Medical Sciences. Hepa1-6 cells were cultured in high-glucose DMEM (Gibco, USA) supplemented with 10% fetal bovine serum (Gibco, USA) at 37°C under a 5% CO2 atmosphere. Anti-mouse PDL2 Ab (Catalog # BE0112) was purchased from Bio X Cell (West Lebanon, NH, USA).
Tumor and immune organs collection in Hepa1-6 derived allografting mice
Eight-week-old female C57BL/6J mice were purchased from Beijing HFK Bioscience Co., LTD (Beijing, China) and were maintained in a standard SPF (special pathogen-free) laboratory environment (a specific pathogen-free, temperature-controlled micro-environment with a 12 h day/night cycle). After one week for the mice to adapt to the environment, Hepa1-6 cells (2×10⁶ cells) were subcutaneously implanted in the left flank of mice in a volume of 0.1 mL. Three mice were randomly selected at 0, 3, 7, 10, 14, and 21 days, respectively for euthanasia and sample collection. Six organs and tissues were used in this study including draining lymph nodes (LN), Mesenteric lymph node (MLN), Spleen, Thymus, Marrow and tumor. The collected tissues were washed for three times with prechilled phosphate-buffered saline (PBS), snap frozen in liquid nitrogen, and stored at -80°C for protein extractions. All animal experiments in this study were carried out in compliance with the animal care regulations of the National Protein Science Center (Beijing Proteome Research Center) Animal Care and Use Institutional Committee, and have obtained ethical and scientific approval (IACUC-20210702-26MT).
PDL2 treatment to Hepa1-6 cancer cell derived allografting mice
Hepa1-6 cells (2×10⁶ cells) were subcutaneously implanted in the left flank of 8-10-week-old female C57BL/6J mice in a volume of 0.1 mL. Mice were randomized (n=4/group) when average tumor size reached ~100 mm3 and intraperitoneally administered a single dose of either vehicle or anti-PDL2 Ab (200 μg/dose) every three days for 24 days. Tumor volumes were calculated as follows: (TV=L*W2/2); L: tumor length and W: width.
Extraction and digestion of proteins
Tissues were homogenized in lysis buffer consisting of 1% sodium deoxycholate, 10 mM Tris (2-carboxyethyl) phosphine, 40 mM 2-chloroacetamide and 100 mM Tris-HCl pH8.8. After heating at 95°C for 5 min and sonicating for 5 min (3 s on and 3 s off, amplitude 25%), the tissue lysates were centrifuged at 16,000 g for 10 min at 4°C, and the supernatants were collected as whole tissue extract (WTE). Their protein concentration was determined by Thermo Nanodrop One (Thermo Fisher, USA). Cell lysates of 100 μg protein were digested overnight with trypsin (Promega, USA) at 37°C, and the digestion was stopped by formic acid at the final concentration of 1%. Precipitated sodium deoxycholate was removed by centrifugation at 4°C with 16,000 g for 10 min. The supernatants were collected, desalted, vacuum-dried and stored at -80°C until subsequent liquid chromatography tandem mass spectrometry liquid chromatography tandem mass spectrometry (LC-MS/MS) analysis.
LC-MS/MS analysis
MS samples were analyzed on a Orbitrap Fusion mass spectrometer (Thermo Fisher Scientific, Rockford, IL, USA) (Thermo Fisher Scientific) coupled online to an Easy-nLC 1,000 nanoflow LC system (Thermo Fisher Scientific). Vacuum-dried samples were dissolved with 24 ul phase A (0.1% formic acid water), vortexed on the shaker for 15 seconds, and centrifuged at 14,000 g for 10 min. 1/8 of the supernatant was used for analysis. The sample was separated by a 150 μm × 30 cm silica microcolumn (homemade; particle size, 1.9 μm; pore size, 120 Å) with a linear gradient of 6-40% and 95% Mobile Phase B (0.1% formic acid in acetonitrile) at a flow rate of 600 nl/min for 140 min and 10 min, respectively. To acquire mass spectra, data-dependent mode was applied by carrying out a Full MS scan (AGC target 2 × 10⁵ ions, maximum injection time 50 ms, 300-1400 m/z, R=120,000 at 200 m/z) followed by a duty cycle of 3 s was performed in Rapid mode with high-energy collision dissociation (target 5 × 10³ ions, max injection time 35 ms, isolation window 1.6 m/z, normalized collision energy of 35%), detected in the Iontrap (R=15,000 at 200 m/z). Dynamic exclusion time was set to 25 s. All data were acquired using the Xcalibur software (Thermo Fisher Scientific).
Peptide identification and protein quantification
MS raw files were processed with the Z-system proteomics work-station (http://61.155.143.3:9000/). MS raw files were searched against the National Center for Biotechnology Information (NCBI) Ref-seq mouse proteome database (updated on 04/07/2013, 27,414 entries) in Mascot search engine (version 2.3, Matrix Science Inc.). The mass tolerances were 20 ppm for precursor ions and 50 mmu or 0.5 Da for productions. The trypsin proteolytic cleavage sites are KR. Up to two missed cleavages were allowed. The minimal peptide length was seven amino acid long. Cysteine carbamidomethylation was set as a fixed modification, and protein N-acetylation and oxidation of methionine were considered variable modifications, and the charges of precursor ions were limited to +2, +3, +4 and +5. All identified peptides were quantified in Z-system with peak areas derived from their MS1 intensity. Peptide false discovery rate (FDR) was adjusted to 1%. For protein level, we kept the proteins that had at least one unique peptide and two high-confidence peptides (mascot ion score >20). Protein quantification was determined by a label-free, intensity-based absolute quantification (iBAQ) approach according to the area under the curve (AUC) of precursor ions which was calculated with homemade software [22]. The fraction of total (FOT) was calculated by this formula: protein’s iBAQ/the total iBAQ. The FOT was further multiplied by 105 to obtain the relative abundance (iFOT) for easy representation [23]. Missing values were substituted with zeros.
Identification of co-expression modules
A total of 111 sample data from the six tissues were analyzed using the R package-“WGCNA” package of R-Studio version 1.2.5001 software to construct a gene co-expression network [24]. First, the expression correlation coefficients of all proteins were calculated. After determining the soft threshold (power) according to the correlation between proteins, a gene clustering tree was constructed. The expression module was determined according to the gene expression correlation coefficient, and the minimum number of genes for each expression module was set to 30 (minModuleSize =30). Next, we calculated the eigengene, hierarchically clustered the modules, and merged similar modules when the correlation coefficient between the modules was higher than 0.85. The module eigengene (ME) represents the first principal component of the module and is used to describe the expression pattern of the module in each sample. Finally, we calculated the correlation between the modules and experimental data to identify significant tissue-specificity modules. The correlation was calculated and clustered according to the spearman correlation coefficient in tumor. We searched co-expression modules through diagonal to identify a good correlation with a correlation coefficient larger than 0.70, including 39 proteins. As the module on the diagonal a seed, we performed Spearman correlation again, retaining 5 proteins that had high correlations with all proteins in seed (R>0.70, P ≤ 0.05). Finally, the protein-protein interaction (PPI) was performed to identify the known interaction network.
Bioinformatics and statistical analysis
The unsupervised hierarchical clustering analysis (HC), principal component analysis (PCA), Spearman correlation and Fuzzy C-Means Clustering (FCM) analysis with Mfuzz package were used to identify discernible boundaries in different tissues. Statistical analysis was performed by the ANOVA for groups and by analysis of variance for multiple groups. P-value lower than 0.05 was considered as significant. Metascape (http://metascape.org/) and the Gene Ontology (GO) term enrichment were determined using the Database for Annotation, Visualization and Integrated Discovery (DAVID) Bioinformatics Resources (https://david.ncifcrf.gov/) [25]. “Project to human” option in the Reactome Pathway Analysis tool was used (http://www.reactome.org/), which means all non-human identifiers in the sample were mapped to their human equivalents. Protein-protein interaction annotation was from the String Database (https://string-db.org/).
Results
Proteomic analysis of tumor and immune organs in the Hepa1-6 subcutaneous tumor model
Syngeneic mouse models are more suitable to study the anti-tumor immune response in the natural immune environment. A previous study showed that tumor-bearing burden in mice had a negative impact on the host immune system, and this effect was clearly seen at day 14 after cancer cell inoculation [21]. To understand in detail the changes in host immune system during the growth of tumor from implanted cancer cells, we performed liquid chromatography tandem mass spectrometry (LC-MS/MS) with samples from subcutaneously injected mice. Specifically, Hepa1-6 cells were subcutaneously injected in C57BL/6J mice, and the subcutaneous tumors and five immune organs were collected at different time point from Day 0, 3, 7, 10, 14 to Day 21 after inoculation. The immune organs we collected were draining lymph node (LN), mesenteric lymph node (MLN), spleen, thymus, and bone marrow. All samples were then subjected to LC-MS/MS for proteomic analysis (Figure 1A). A total of 111 samples (21 tumors and 90 immune organ tissues) were measured, and 10,038 gene products (GPs) were identified at a 1% peptide false discovery rate (FDR) (Table S1). With tumor sample, a total of 6,383 GPs were quantified by at least one unique peptide (GPs-specific sequence) and two strict peptides (mascot ion score ≥ 20), or three unique strict peptides (Table S2). To further increase the reliability of the data, 5,500 GPs proteins that were identified in at least 2 out the 3 replicates were selected for bioinformatics analyses (Figure 1B; Table S3). Using the same criteria to the samples of immune organs, a total of 4377 (LN), 4455 (MLN), 4287 (spleen), 4230 (thymus), 3518 (bone marrow) GPs, respectively, were used for bioinformatics analyses (Table S3). A total of 2879 proteins were detected in all samples. The number of proteins that were only detected in some samples were shown in Figure 1B, with 1017 proteins detected only in the tumor sample.
Figure 1.

The general workflow and proteomic landscape of developing tumor and immune organs from Hepa1-6 subcutaneous allograft mouse model. A. I. The establishment of HCC mouse model and experiment outline. Subcutaneous allograft was established with Hepa1-6 cells in 2-3 m old female mice (n=18). Six tissue types were collected at different days after cancer cell inoculation as indicated in the figures. Icons was made by Freepik from www.flaticon.com. II. Extraction and digestion of tissue proteome. III. MS-based identification and quantitative proteomics. IV. Bioinformatics analysis of multiple datasets. B. Multiple data sets with different filtering criteria and venn diagram of proteins in six tissues across 6 timepoints. C. Heatmap analysis of temporal proteomic data in six tissues by unsupervised clustering and Correlation’s hierarchical clustering. D. PCA analyses of the proteome data on the five immune organs’ samples. E. Heatmap of the correlation between the module eigengenes and traits of the tissue by WGCNA.
The high reproducibility of our proteomic data was indicated by the high Spearman correlation coefficients between the repeated experiments (R=0.7-0.9; Figure S1A). Hierarchical clustering analysis of proteins detected in all the samples showed that the tumor sample exhibited the most dramatic change in proteomic profiling among all the samples collected at different time points during tumor growth from the inoculated cancer cells (Figure 1C). For example, the proteome at day 0 tumor sample was markedly different from Day 3 tumor sample reflecting the biological changes of cancer cell from seeding to growth initiation.
Principal Component Analysis (PCA) confirmed that while the tumor sample proteomic profile was well separated from that of immune organs, the immune organs were clustered together (Figure S1B). To better visualize the relationship among immune tissues, PCA was applied on these samples without the tumor sample. As shown in Figure 1D, they were generally close, and thymus showed the most difference from others while the LN and MLN were mostly inseparable (Figure 1D).
Next, we used Weighted Gene Co-expression Network Analysis algorithm (WGCNA) to identify protein co-expression modules in the temporal spatial proteomic dataset. 29 distinct modules, which correlated mostly with tissue specificity, were obtained. MEblue, MEgreen and MEmagenta module had the highest correlation coefficients that were statistically significant, and they were correlated with tumor (R=0.86, P=2e-34), thymus (R=0.86, P=3e-33), and marrow (R=0.82, P=1e-27), respectively (Figure 1E; Table S4; Figure S2). Additionally, draining lymph node and mesenteric lymph node showed high correlation in the 4 modules (MEbrown, MEmidnightblue, MEtan, MEgrey), suggesting that these two tissues were more closely related. To reveal the pathways that are altered in these samples, the String-Reactome enrichment of the six high correlation modules in each sample was performed (Figure S3). It showed that proteins in the MEmagenta module (marrow) were significantly enriched in immune system, and proteins in the MEgreen module (thymus) were related to cell cycle, whereas proteins in the MEblue module (tumor) were enriched in the immune system, metabolism and trafficking. The pathways in tumor sample exhibited the most diversity, as membrane trafficking, immune system and various intracellular metabolic processes were enriched. The MEbrown module (mesenteric lymph node) proteins function mainly in the immune system, such as signaling by Rho GTPase and the B cell receptor (BCR). The MEtan module (draining lymph node) proteins’ function was mainly on the metabolism of lipids and fatty acid metabolism. Proteins in the MEcyan module (spleen) function in hemostasis and fibrin clot formation, which are consistent with the hematopoietic function of spleen.
The dynamic proteomic changes during tumor growth
To systematically examine the dynamic changes in protein expression during tumor implantation and growth, we analyzed the temporal expression of proteins by using a soft clustering method (Fuzzy C-Means Clustering, FCM). In general, the proteomic data showed that from Day 3 to Day 21 after cancer cell inoculation, the proteomic profile in all samples were changed gradually, and the dramatic difference was seen between the samples from Day 3 and Day 21 (Figure S6A). In the tumor sample, we identified five clusters of protein expression patterns and analyzed their functional enrichment (Figure 2A). Proteins in cluster 1 declined sharply on the 3rd day after the cell inoculation, and the functional enrichment showed a decline in RNA-related functions, such as proteins involved in splicesome and RNA transport pathway (Figure 2B). Proteins in cluster 2 had a significant rise on the 3rd day followed by a sharp decrease. Metascape analysis indicated that the significantly increased proteins functioned mainly in response to inflammation, including acute-phase response, neutrophil degranulation and were positive regulators for cytokine production (Figure 2B). The most significantly enriched pathways were the coagulation and complement pathways including all 3 branches of the complement cascades (Figure S6B). Proteins in cluster 3 showed a continuous increase. There appeared to be a phase of rapid increase in Days 3-7, and then the rate of increase plateaued. Metascape analysis showed that lysosome and phagosome components and immune processes, including the innate immune system, antigen processing and presentation of exogenous antigen and lymphocyte proliferation were enriched (Figure 2B). Proteins in cluster 4 showed an increase on Day 14 followed by a rapid increase on Day 21. Proteins regulating the immune response to the external stimulus were found as the most significantly enriched proteins by Metascape analysis (Figure 2B). Expression of the Cluster 5 proteins showed large fluctuation, with four turning points occurring on days 3, 7, 10, and 14. Function of the proteins in cluster 5 was mainly related to protein metabolism and autophagy (Figure 2B).
Figure 2.

Protein expression dynamics during tumor growth. (A) Protein trajectories of the 5 clusters in tumor, Fuzzy C-Means Clustering. (B) The Metascape term enrichments for proteins of each cluster in (A). (C) The iFOT of Banf1 in 6 tissues.
We also performed similar analyses to the proteomic data from the immune organs. While 5 clusters were identified in each organ (Figure S4; Table S5), the enriched GO terms of cluster 2 were different between tumor and immune organs, with tumors mostly enriched on the immune system process while immune organs enriched on the regulation of DNA (Figure S5). One example of proteins that were enriched differentially between tumor sample and organ samples is Banf1 (BAF nuclear assembly factor 1), which can competitively bind to dsDNA and inhibit the binding of cGAS and nuclear DNA [26]. Banf1 can be detected in tumor cells on day 0, but not in any of the immune organs. On the 3rd and 7th day of tumor-bearing, the expression of Banf1 in the tumor was decreased, but it was gradually increased from the 10th day to the 21st day in all tissues (Figure 2C). The upregulated Banf1 at the later stage might assist the cancer cells to be more resistant and manage to escape the immune surveillance in the Hepa1-6 allograft mouse model.
Upregulated protein expression during Hepa1-6 HCC cancer cell derived tumor growth of in immune-competent mice
During tumor growth, cancer cells have to escape from the host immune surveillance by crippling the functionality of immune system. Hence, it is conceivable that proteins supporting the outgrowth of tumor will be upregulated [3,27]. Those protein would be potential targets for cancer therapy. Identifying these proteins will be clinically significant. Hence, we carried out analyse on the proteins whose expression was upregulated during tumor growth. While the expression of proteins in tumor clusters 3 and 4 were upregulated, the increased expression in cluster 3 showed a slowdown at the later stage (d21). So we focused our analysis on proteins with a continuous increase in their expression in the cluster 4.
We selected 9 representative proteins in cluster 4 for further study. The expression of these proteins was continually increasing during tumor growth, and the function of most of these proteins is known to be involved in the immune surveillance (Figure 3A, 3B). Among these 9 proteins, NOS2 and Osr1 can promote tumor growth and metastasis in HCC [28,29]. IDO1 (Indoleamine 2,3-dioxygenase 1) is involved in the immune escape of tumors [30,31]. Indeed, IDO1 inhibitors has been used to treat tumors, diabetes, depression and other diseases [32]. PDL2 was reported to act as a co-receptor for PD1. Both PDL1 and PDL2 bind to PD1 to inhibit the immune activation of T cells, and PD1 binds to PDL2 preferably [33]. In addition, PDL2 can work with RGMb to promote the functional activation of T cells [34]. While PD1/PDL1 inhibitors have been widely used in clinical practice, the specific function and mechanism of action for PDL2 are still unclear.
Figure 3.
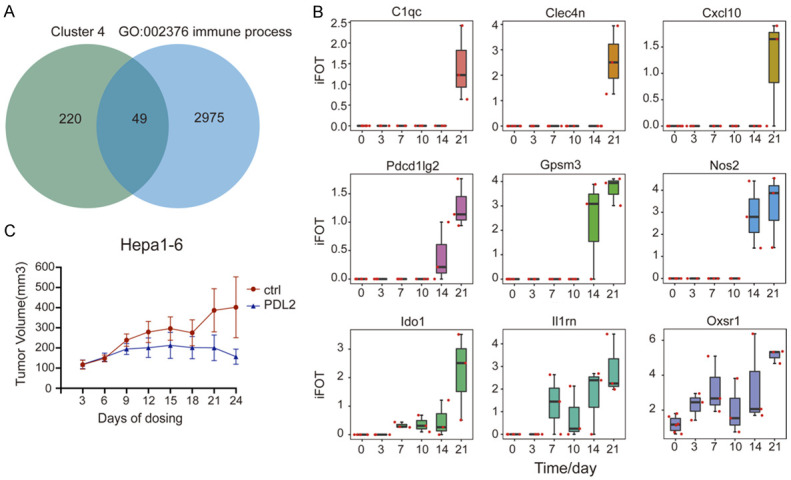
Upregulated protein expression during Hepa1-6 cell derived tumor growth in immune-competent mice. A. Venn diagram of proteins in cluster 4 of the proteins from tumor and immune organs in GO: 002376. B. The iFOT of 9 proteins in tumor including Cxcl10, Nos2, Pdcd1lg2, Ido1, Il1rn, Oxsr1, C1qc, Clec4n, Gpsm3. C. Validation of anti-tumor efficacy by inhibiting PDL2 in Hepa1-6 mouse model. The tumor growth was inhibited by intraperitoneal injection of anti-PDL2 antibody. Error bars are created by mean ± SD of four replicates.
PDL2 co-expression modules during tumor growth
To examine the effect of PDL2 inhibition on tumor growth, mice bearing Hepa1-6 tumors were injected with an antibody against PDL2 intraperitoneally once every three days for 24 days (Figure 3C). We found that anti-PDL2 antibody could indeed inhibit the growth of tumors. Which the tumor in control vehicle treated mice continued to grow, the tumor growth in PDL2 treated mice was stopped. The average tumor size in mice treated with anti-PDL2 antibody was smaller than that of the control group after treatment for 24 days.
Having confirmed the tumor suppressive effect of anti-PDL2 antibody in mice, we speculated that other upregulated proteins or PDL2 co-expressing proteins might also be important for tumor growth, which warrant them as potential drug target. To identified these proteins, we used two methods to predict PDL2 co-expression proteins. First, we performed WGCNA to identify the temporal co-expression modules in the tumor sample, which resulted in 22 modules. The MEpink module contained 141 proteins including PDL2 (Figure 4A; Table S6; Figure S7). Then we selected 23 proteins with a similar trend to PDL2 (ratio of day 21 vs. Day 0 ≥ 1.5 or ratio of day 14 vs. Day 0 ≥ 1.5) (Figure 4A). Second, we used the Spearman correlation coefficient of 0.70 as a cut-off to define a positive correlation between protein pairs [35]. We found a PDL2-containing module consisting of 44 proteins (Figure 4B). From the two methods, there were 64 proteins in PDL2 co-expression module in total. We further selected 19 immune function-related proteins and performed String analysis and found that Zap70 was a putative PDL2 interacting proteins, consistent with a recent report [36,37] (Figure 4C, 4D). Additionally, by comparing the changes of these proteins in other immune tissues, we found that Padi4 (The peptidyl arginine deiminase 4) has similar changes in tumors and bone marrow (Figure 4E).
Figure 4.

PDL2 co-expression modules during tumor growth. (A) Heatmap of the 23 proteins in MEpink module of WGCNA. ME, module eigengene. (B) Co-expression modules of PDL2. Spearman’s correlation coefficient (R ≥ 0.7, t-test, P-value ≤ 0.05). (C) Venn diagram of proteins in two PDL2 modules and immune proteins in GO: 002376. (D) String analysis (medium confidence) of the common immune protein in (C). (E) The iFOT of Padi4 in 6 tissues.
Discussion
Immunotherapy is emerging as a new strategy for cancer treatment. Preclinical testing for these immunotherapeutic drugs requires the xenografting tumor models in immune-competent mice. In our study, we used syngeneic mouse model by subcutaneously inoculating mouse liver cancer cell line Hepa1-6 in C57BL/6J mice and successfully established allograft tumor for our further study about the effect of tumor-bearing burden on global protein expression during tumor growth in host mice. In order to examine the systemic response upon cancer cell inoculation, in particular in the components of TME [13], we collected tumor and immune tissues starting from Day 0 to Day 21 after injection in an immune-competent mouse model.
We classified proteins in each tissue into different protein clusters, and analyzed the functional enrichment of differentially expressed proteins in each cluster. The function of proteins in the 1st cluster of tumor revealed that tumor metabolism declined might due to the fact that tumor state changed from a proliferation-oriented to an adaptive state. Protein profile in the 2nd cluster suggested that in the early stage of tumor-bearing (Day 3 after injection), host immune system reacted to the cancer cell injection by increased inflammation and initial immune response. Unlike the cytokine storm on the 2nd cluster, proteins in the 3rd cluster are more involved in the process of phagocytosis and antigen presentation by various lymphocytes, suggesting that immunity played an important and persistent role in the process of tumor-bearing. In the later stage of the tumor growth (Day 21 after injection), proteins that were upregulated were likely to assist tumor growth. Some of these proteins may restrict antitumor immunity [7]. Hence, our detailed analysis on the proteomic changes during tumor growth provide the important information for our understanding of the tumor biology.
Our proteomic profiling has identified several molecules whose expression is upregulated in later stage of tumor growth. One of them is NOS2. In many tumors, elevated NOS2 has been reported as a biomarker for poor prognosis [28]. In HCC, NOS2 is shown to promote tumor development and metastasis [38]. It is reasonable to consider targeting NOS2 for HCC treatment. However, NOS2 substrate L-arginine has also been reported to enhance the effect of cancer radiotherapy and thereby alleviate the progression of advanced tumor brain metastasis [39]. Hence, caution needs to be taken when considering NOS2 as a therapeutic target. Another upregulated protein we identified is IDO1. IDO1 can catalyze tryptophan metabolism and is a new immune checkpoint protein. The metabolites produced from tryptophan consumed by tumor can induce local immunity [40,41]. IDO1 mainly exerts its immunosuppressive function through three mechanisms: GCN2, m-TOR and AhR [31]. In addition, kynuric acid produced by IDO1 can increase the expression of IL-6 in tissues, thereby increasing the expression of VEGF, and promoting tumor angiogenesis [42]. The upregulated IDO1 in our results might presents as an attractive cancer treatment target for the tumor growth of allograft mouse model.
The most interesting molecule we identified in our study is PDCD1LG2 (PDL2 in humans). We found that the expression of PDL2 increased dramatically at Day 14 and Day 21 after injection while its expression was not detectable at day 0. As a receptor for PD1, the affinity of PDL2 is twice higher than that of PDL1 [33], and PDL2 has a much stronger correlation with decreased antitumor immune responses in TME according to the Cancer Genome Atlas (TCGA) datasets [43]. At present, the crystal structure of PDL2 is not clear, and the binding mechanism of PD1/PDL2 has not been studied. The inhibitory signal pathway generated by the PDL1/2-PD1 pathway can downregulate T cell response and promote T cell tolerance. PDL1/2 synergistically inhibit CD4+ T cell secretion of IFNγ [44]. In addition, cancer-associated fibroblasts (CAFs), enriched in the TME, can dysfunction or kill CD8+ T cells in an antigen-dependent manner via PDL2 and FASL [45]. In our study, blocking PDL2 with intraperitoneal injection of anti-PDL2 antibody could inhibit the tumor growth in our Hepa1-6 subcutaneous allografting tumor model. Thus, inhibiting PDL2 might be a promising approach to reshape TME and promote antitumor immunity.
PADI4 is one of the PDL2 co-expression proteins we observed in our study. PADI4 post-translationally converts peptidylarginine to citrulline, and it is overexpressed in diverse malignant tumors, including liver cancer, breast cancer [46], lung cancer [47], gastric cancer [48], osteosarcoma [49], etc. Our data obtained from Hepa1-6 mouse model also showed that the expression of PADI4 increased in the later stage of the tumor growth, which suggested that the PADI4 may promote tumor growth. Since PADI4 is expressed at very low level in normal tissues and in benign tumors, and the expression of PADI4 is tissue-specific, mainly limited to immune cells, PADI4 may serve as a potential tumor treatment target.
Our study also generated proteomic profile in major immune organs during the Hepa1-6 HCC tumor growth in immunocompetent mice. This database could serve as a resource to other researchers for data mining and reference. However, further study with other HCC cancer cell line or other cancer types will be needed not only to further verify the relationship between tumor and immunity but also to reveal our data are unique or hold true for other cancer types. In addition, although subcutaneously mouse model in our study is easier to track tumor growth, the orthotopic allograft model in immunocompetent mouse will be important in mimicking the local immune response triggered by injection-induced inflammation and reflecting the physiological complexity of tumor microenvironment.
Acknowledgements
This work was supported by the National Natural Science Foundation of China (No. 31770892, No. 31970725, No. 31870828, No. 81874237 and No. 81974016), Beijing Municipal Natural Science Foundation (No. 7192199) National Key Research and Development Program of China (No. 2018YFA0507503, No. 2017YFA0505102, No. 2017YFA0505103 and No. 2017YFA0505104), and State Key Laboratory of Proteomics (No. SKLP-K202002).
Disclosure of conflict of interest
None.
Figures S1-S7
Table S1
Table S2
Table S3
Table S4
Table S5
Table S6
References
- 1.Hanahan D, Weinberg RA. Hallmarks of cancer: the next generation. Cell. 2011;144:646–674. doi: 10.1016/j.cell.2011.02.013. [DOI] [PubMed] [Google Scholar]
- 2.Galon J, Bruni D. Tumor immunology and tumor evolution: intertwined histories. Immunity. 2020;52:55–81. doi: 10.1016/j.immuni.2019.12.018. [DOI] [PubMed] [Google Scholar]
- 3.Kim R, Emi M, Tanabe K. Cancer immunoediting from immune surveillance to immune escape. Immunology. 2007;121:1–14. doi: 10.1111/j.1365-2567.2007.02587.x. [DOI] [PMC free article] [PubMed] [Google Scholar]
- 4.Whiteside TL, Mandapathil M, Szczepanski M, Szajnik M. Mechanisms of tumor escape from the immune system: adenosine-producing Treg, exosomes and tumor-associated TLRs. Bull Cancer. 2011;98:E25–31. doi: 10.1684/bdc.2010.1294. [DOI] [PubMed] [Google Scholar]
- 5.Olson B, Li Y, Lin Y, Liu ET, Patnaik A. Mouse models for cancer immunotherapy research. Cancer Discov. 2018;8:1358–1365. doi: 10.1158/2159-8290.CD-18-0044. [DOI] [PMC free article] [PubMed] [Google Scholar]
- 6.Cao M, Li H, Sun D, Chen W. Cancer burden of major cancers in China: a need for sustainable actions. Cancer Commun (Lond) 2020;40:205–210. doi: 10.1002/cac2.12025. [DOI] [PMC free article] [PubMed] [Google Scholar]
- 7.Ruf B, Heinrich B, Greten TF. Immunobiology and immunotherapy of HCC: spotlight on innate and innate-like immune cells. Cell Mol Immunol. 2021;18:112–127. doi: 10.1038/s41423-020-00572-w. [DOI] [PMC free article] [PubMed] [Google Scholar]
- 8.Brown ZJ, Heinrich B, Greten TF. Mouse models of hepatocellular carcinoma: an overview and highlights for immunotherapy research. Nat Rev Gastroenterol Hepatol. 2018;15:536–554. doi: 10.1038/s41575-018-0033-6. [DOI] [PubMed] [Google Scholar]
- 9.Okada S, Vaeteewoottacharn K, Kariya R. Application of highly immunocompromised mice for the establishment of patient-derived xenograft (PDX) models. Cells. 2019;8:889–907. doi: 10.3390/cells8080889. [DOI] [PMC free article] [PubMed] [Google Scholar]
- 10.Yao LC, Aryee KE, Cheng M, Kaur P, Keck JG, Brehm MA. Creation of PDX-bearing humanized mice to study immuno-oncology. Methods Mol Biol. 2019;1953:241–252. doi: 10.1007/978-1-4939-9145-7_15. [DOI] [PubMed] [Google Scholar]
- 11.De La Rochere P, Guil-Luna S, Decaudin D, Azar G, Sidhu SS, Piaggio E. Humanized mice for the study of immuno-oncology. Trends Immunol. 2018;39:748–763. doi: 10.1016/j.it.2018.07.001. [DOI] [PubMed] [Google Scholar]
- 12.Mosely SI, Prime JE, Sainson RC, Koopmann JO, Wang DY, Greenawalt DM, Ahdesmaki MJ, Leyland R, Mullins S, Pacelli L, Marcus D, Anderton J, Watkins A, Coates Ulrichsen J, Brohawn P, Higgs BW, McCourt M, Jones H, Harper JA, Morrow M, Valge-Archer V, Stewart R, Dovedi SJ, Wilkinson RW. Rational selection of syngeneic preclinical tumor models for immunotherapeutic drug discovery. Cancer Immunol Res. 2017;5:29–41. doi: 10.1158/2326-6066.CIR-16-0114. [DOI] [PubMed] [Google Scholar]
- 13.Kimura T, Kato Y, Ozawa Y, Kodama K, Ito J, Ichikawa K, Yamada K, Hori Y, Tabata K, Takase K, Matsui J, Funahashi Y, Nomoto K. Immunomodulatory activity of lenvatinib contributes to antitumor activity in the Hepa1-6 hepatocellular carcinoma model. Cancer Sci. 2018;109:3993–4002. doi: 10.1111/cas.13806. [DOI] [PMC free article] [PubMed] [Google Scholar]
- 14.Liu J, Sun H, Shen D, Wang M, Wen Z. Antitumor effect of membrane-type Tim-3 on hepatocellular carcinoma Hepa1-6 cells of ICR mice. Oncol Lett. 2018;15:2631–2634. doi: 10.3892/ol.2017.7620. [DOI] [PMC free article] [PubMed] [Google Scholar]
- 15.Park DJ, Sung PS, Kim JH, Lee GW, Jang JW, Jung ES, Bae SH, Choi JY, Yoon SK. EpCAM-high liver cancer stem cells resist natural killer cell-mediated cytotoxicity by upregulating CEACAM1. J Immunother Cancer. 2020;8:e000301–e000314. doi: 10.1136/jitc-2019-000301. [DOI] [PMC free article] [PubMed] [Google Scholar]
- 16.Shin SW, Yang K, Lee M, Moon J, Son A, Kim Y, Choi S, Kim DH, Choi C, Lee N, Park HC. Manganese ferrite nanoparticles enhance the sensitivity of Hepa1-6 hepatocellular carcinoma to radiation by remodeling tumor microenvironments. Int J Mol Sci. 2021;22:2637–2652. doi: 10.3390/ijms22052637. [DOI] [PMC free article] [PubMed] [Google Scholar]
- 17.Wei Y, Lao XM, Xiao X, Wang XY, Wu ZJ, Zeng QH, Wu CY, Wu RQ, Chen ZX, Zheng L, Li B, Kuang DM. Plasma cell polarization to the immunoglobulin g phenotype in hepatocellular carcinomas involves epigenetic alterations and promotes hepatoma progression in mice. Gastroenterology. 2019;156:1890–1904. e1816. doi: 10.1053/j.gastro.2019.01.250. [DOI] [PubMed] [Google Scholar]
- 18.Droste M, Thakur BK, Eliceiri BP. Tumor-derived extracellular vesicles and the immune system-lessons from immune-competent mouse-tumor models. Front Immunol. 2020;11:606859–606890. doi: 10.3389/fimmu.2020.606859. [DOI] [PMC free article] [PubMed] [Google Scholar]
- 19.Shirasaki T, Murai K, Honda M, Okada H, Innami Y, Yamada A, Shimakami T, Kawaguchi K, Yamashita T, Sakai Y, Kaneko S. Establishment of liver tumor cell lines from atherogenic and high fat diet fed hepatitis C virus transgenic mice. Sci Rep. 2021;11:13021–13035. doi: 10.1038/s41598-021-92128-9. [DOI] [PMC free article] [PubMed] [Google Scholar]
- 20.Park JH, Kim HY, Lee A, Seo YK, Kim IH, Park ET, Kang MS, Park SJ, Park S. Enlightening the immune mechanism of the abscopal effect in a murine HCC model and overcoming the late resistance with anti-PD-L1. Int J Radiat Oncol Biol Phys. 2021;110:510–520. doi: 10.1016/j.ijrobp.2020.12.031. [DOI] [PubMed] [Google Scholar]
- 21.Allen BM, Hiam KJ, Burnett CE, Venida A, DeBarge R, Tenvooren I, Marquez DM, Cho NW, Carmi Y, Spitzer MH. Systemic dysfunction and plasticity of the immune macroenvironment in cancer models. Nat Med. 2020;26:1125–1134. doi: 10.1038/s41591-020-0892-6. [DOI] [PMC free article] [PubMed] [Google Scholar]
- 22.Schwanhausser B, Busse D, Li N, Dittmar G, Schuchhardt J, Wolf J, Chen W, Selbach M. Global quantification of mammalian gene expression control. Nature. 2011;473:337–342. doi: 10.1038/nature10098. [DOI] [PubMed] [Google Scholar]
- 23.Zhang C, Chen Y, Mao X, Huang Y, Jung SY, Jain A, Qin J, Wang Y. A bioinformatic algorithm for analyzing cell signaling using temporal proteomic data. Proteomics. 2017;17:600425–600436. doi: 10.1002/pmic.201600425. [DOI] [PubMed] [Google Scholar]
- 24.Langfelder P, Horvath S. WGCNA: an R package for weighted correlation network analysis. BMC Bioinformatics. 2008;9:559–572. doi: 10.1186/1471-2105-9-559. [DOI] [PMC free article] [PubMed] [Google Scholar]
- 25.Huang da W, Sherman BT, Lempicki RA. Systematic and integrative analysis of large gene lists using DAVID bioinformatics resources. Nat Protoc. 2009;4:44–57. doi: 10.1038/nprot.2008.211. [DOI] [PubMed] [Google Scholar]
- 26.Guey B, Wischnewski M, Decout A, Makasheva K, Kaynak M, Sakar MS, Fierz B, Ablasser A. BAF restricts cGAS on nuclear DNA to prevent innate immune activation. Science. 2020;369:823–828. doi: 10.1126/science.aaw6421. [DOI] [PubMed] [Google Scholar]
- 27.Rosenthal R, Cadieux EL, Salgado R, Bakir MA, Moore DA, Hiley CT, Lund T, Tanic M, Reading JL, Joshi K, Henry JY, Ghorani E, Wilson GA, Birkbak NJ, Jamal-Hanjani M, Veeriah S, Szallasi Z, Loi S, Hellmann MD, Feber A, Chain B, Herrero J, Quezada SA, Demeulemeester J, Van Loo P, Beck S, McGranahan N, Swanton C, consortium TR. Neoantigen-directed immune escape in lung cancer evolution. Nature. 2019;567:479–485. doi: 10.1038/s41586-019-1032-7. [DOI] [PMC free article] [PubMed] [Google Scholar]
- 28.Thomas DD, Wink DA. NOS2 as an emergent player in progression of cancer. Antioxid Redox Signal. 2017;26:963–965. doi: 10.1089/ars.2016.6835. [DOI] [PubMed] [Google Scholar]
- 29.Chu J, Geng G, Ai X, Jia W, Wang J, Xu B, Kong X, Kong L. LINC01291 promotes hepatocellular carcinoma development by targeting the miR-186-5p/OXSR1 axis. J Gene Med. 2021;24:e3394–e3407. doi: 10.1002/jgm.3394. [DOI] [PubMed] [Google Scholar]
- 30.Cheong JE, Sun L. Targeting the IDO1/TDO2-KYN-AhR pathway for cancer immunotherapy - challenges and opportunities. Trends Pharmacol Sci. 2018;39:307–325. doi: 10.1016/j.tips.2017.11.007. [DOI] [PubMed] [Google Scholar]
- 31.Liu M, Wang X, Wang L, Ma X, Gong Z, Zhang S, Li Y. Targeting the IDO1 pathway in cancer: from bench to bedside. J Hematol Oncol. 2018;11:100–112. doi: 10.1186/s13045-018-0644-y. [DOI] [PMC free article] [PubMed] [Google Scholar]
- 32.Ye Z, Yue L, Shi J, Shao M, Wu T. Role of IDO and TDO in cancers and related diseases and the therapeutic implications. J Cancer. 2019;10:2771–2782. doi: 10.7150/jca.31727. [DOI] [PMC free article] [PubMed] [Google Scholar]
- 33.Lazar-Molnar E, Scandiuzzi L, Basu I, Quinn T, Sylvestre E, Palmieri E, Ramagopal UA, Nathenson SG, Guha C, Almo SC. Structure-guided development of a high-affinity human programmed cell death-1: implications for tumor immunotherapy. EBioMedicine. 2017;17:30–44. doi: 10.1016/j.ebiom.2017.02.004. [DOI] [PMC free article] [PubMed] [Google Scholar]
- 34.Nie X, Chen W, Zhu Y, Huang B, Yu W, Wu Z, Guo S, Zhu Y, Luo L, Wang S, Chen L. B7-DC (PD-L2) costimulation of CD4(+) T-helper 1 response via RGMb. Cell Mol Immunol. 2018;15:888–897. doi: 10.1038/cmi.2017.17. [DOI] [PMC free article] [PubMed] [Google Scholar]
- 35.Malovannaya A, Li Y, Bulynko Y, Jung SY, Wang Y, Lanz RB, O’Malley BW, Qin J. Streamlined analysis schema for high-throughput identification of endogenous protein complexes. Proc Natl Acad Sci U S A. 2010;107:2431–2436. doi: 10.1073/pnas.0912599106. [DOI] [PMC free article] [PubMed] [Google Scholar]
- 36.Takehara T, Wakamatsu E, Machiyama H, Nishi W, Emoto K, Azuma M, Soejima K, Fukunaga K, Yokosuka T. PD-L2 suppresses T cell signaling via coinhibitory microcluster formation and SHP2 phosphatase recruitment. Commun Biol. 2021;4:581–593. doi: 10.1038/s42003-021-02111-3. [DOI] [PMC free article] [PubMed] [Google Scholar]
- 37.Au-Yeung BB, Shah NH, Shen L, Weiss A. ZAP-70 in signaling, biology, and disease. Annu Rev Immunol. 2018;36:127–156. doi: 10.1146/annurev-immunol-042617-053335. [DOI] [PubMed] [Google Scholar]
- 38.Wang R, Geller DA, Wink DA, Cheng B, Billiar TR. NO and hepatocellular cancer. Br J Pharmacol. 2020;177:5459–5466. doi: 10.1111/bph.14838. [DOI] [PMC free article] [PubMed] [Google Scholar]
- 39.Marullo R, Castro M, Yomtoubian S, Calvo-Vidal MN, Revuelta MV, Krumsiek J, Cho A, Morgado PC, Yang S, Medina V, Roth BM, Bonomi M, Keshari KR, Mittal V, Navigante A, Cerchietti L. The metabolic adaptation evoked by arginine enhances the effect of radiation in brain metastases. Sci Adv. 2021;7:eabg1964–eabg1981. doi: 10.1126/sciadv.abg1964. [DOI] [PMC free article] [PubMed] [Google Scholar]
- 40.Zhai L, Ladomersky E, Lenzen A, Nguyen B, Patel R, Lauing KL, Wu M, Wainwright DA. IDO1 in cancer: a Gemini of immune checkpoints. Cell Mol Immunol. 2018;15:447–457. doi: 10.1038/cmi.2017.143. [DOI] [PMC free article] [PubMed] [Google Scholar]
- 41.Bishnupuri KS, Alvarado DM, Khouri AN, Shabsovich M, Chen B, Dieckgraefe BK, Ciorba MA. IDO1 and kynurenine pathway metabolites activate PI3K-Akt signaling in the neoplastic colon epithelium to promote cancer cell proliferation and inhibit apoptosis. Cancer Res. 2019;79:1138–1150. doi: 10.1158/0008-5472.CAN-18-0668. [DOI] [PMC free article] [PubMed] [Google Scholar]
- 42.Dey S, Mondal A, DuHadaway JB, Sutanto-Ward E, Laury-Kleintop LD, Thomas S, Prendergast GC, Mandik-Nayak L, Muller AJ. IDO1 signaling through GCN2 in a subpopulation of Gr-1(+) cells shifts the IFNgamma/IL6 balance to promote neovascularization. Cancer Immunol Res. 2021;9:514–528. doi: 10.1158/2326-6066.CIR-20-0226. [DOI] [PubMed] [Google Scholar]
- 43.Tanegashima T, Togashi Y, Azuma K, Kawahara A, Ideguchi K, Sugiyama D, Kinoshita F, Akiba J, Kashiwagi E, Takeuchi A, Irie T, Tatsugami K, Hoshino T, Eto M, Nishikawa H. Immune suppression by PD-L2 against spontaneous and treatment-related antitumor immunity. Clin Cancer Res. 2019;25:4808–4819. doi: 10.1158/1078-0432.CCR-18-3991. [DOI] [PubMed] [Google Scholar]
- 44.Sheng H, Wang Y, Jin Y, Zhang Q, Zhang Y, Wang L, Shen B, Yin S, Liu W, Cui L, Li N. A critical role of IFNgamma in priming MSC-mediated suppression of T cell proliferation through up-regulation of B7-H1. Cell Res. 2008;18:846–857. doi: 10.1038/cr.2008.80. [DOI] [PubMed] [Google Scholar]
- 45.Lakins MA, Ghorani E, Munir H, Martins CP, Shields JD. Cancer-associated fibroblasts induce antigen-specific deletion of CD8 (+) T Cells to protect tumour cells. Nat Commun. 2018;9:948–957. doi: 10.1038/s41467-018-03347-0. [DOI] [PMC free article] [PubMed] [Google Scholar]
- 46.Wang Y, Lyu Y, Tu K, Xu Q, Yang Y, Salman S, Le N, Lu H, Chen C, Zhu Y, Wang R, Liu Q, Semenza GL. Histone citrullination by PADI4 is required for HIF-dependent transcriptional responses to hypoxia and tumor vascularization. Sci Adv. 2021;7:eabe3771–eabe3785. doi: 10.1126/sciadv.abe3771. [DOI] [PMC free article] [PubMed] [Google Scholar]
- 47.Liu M, Qu Y, Teng X, Xing Y, Li D, Li C, Cai L. PADI4mediated epithelialmesenchymal transition in lung cancer cells. Mol Med Rep. 2019;19:3087–3094. doi: 10.3892/mmr.2019.9968. [DOI] [PMC free article] [PubMed] [Google Scholar]
- 48.Zheng Y, Zhao G, Xu B, Liu C, Li C, Zhang X, Chang X. PADI4 has genetic susceptibility to gastric carcinoma and upregulates CXCR2, KRT14 and TNF-alpha expression levels. Oncotarget. 2016;7:62159–62176. doi: 10.18632/oncotarget.11398. [DOI] [PMC free article] [PubMed] [Google Scholar]
- 49.Zhai Q, Qin J, Jin X, Sun X, Wang L, Du W, Li T, Xiang X. PADI4 modulates the invasion and migration of osteosarcoma cells by down-regulation of epithelial-mesenchymal transition. Life Sci. 2020;256:117968–117974. doi: 10.1016/j.lfs.2020.117968. [DOI] [PubMed] [Google Scholar]
Associated Data
This section collects any data citations, data availability statements, or supplementary materials included in this article.