

Abstract
Epigenetic changes are present in many physiological and pathological processes. The N6-methyladenosine (m6A) modification is the most common modification in eukaryotic mRNA. However, the role of m6A modification in diabetic nephropathy (DN) remains elusive. Here, we found that m6A modification was significantly upregulated in the kidney of type 1 and type 2 diabetic mice, which was caused by elevated levels of METTL3. Moreover, METTL3 is increased in podocyte of renal biopsy from patients with DN, which is related to renal damage. METTL3 knockout significantly reduced the inflammation and apoptosis in high glucose (HG)-stimulated podocytes, while its overexpression significantly aggravated these responses in vitro. Podocyte-conditional knockout METTL3 significantly alleviated podocyte injury and albuminuria in streptozotocin (STZ)-induced diabetic mice. Therapeutically, silencing METTL3 with adeno-associated virus serotype-9 (AAV9)-shMETTL3 in vivo mitigated albuminuria and histopathological injury in STZ-induced diabetic mice and db/db mice. Mechanistically, METTL3 modulated Notch signaling via the m6A modification of TIMP2 in an insulin-like growth factor 2 mRNA binding protein 2 (IGF2BP2)-dependent manner and exerted pro-inflammatory and pro-apoptotic effects. In summary, this study suggested that METTL3-mediated m6A modification is an important mechanism of podocyte injury in DN. Targeting m6A through the writer enzyme METTL3 is a potential approach for the treatment of DN.
Keywords: diabetic nephropathy, m6A, podocytes, METTL3, TIMP2
Graphical abstract
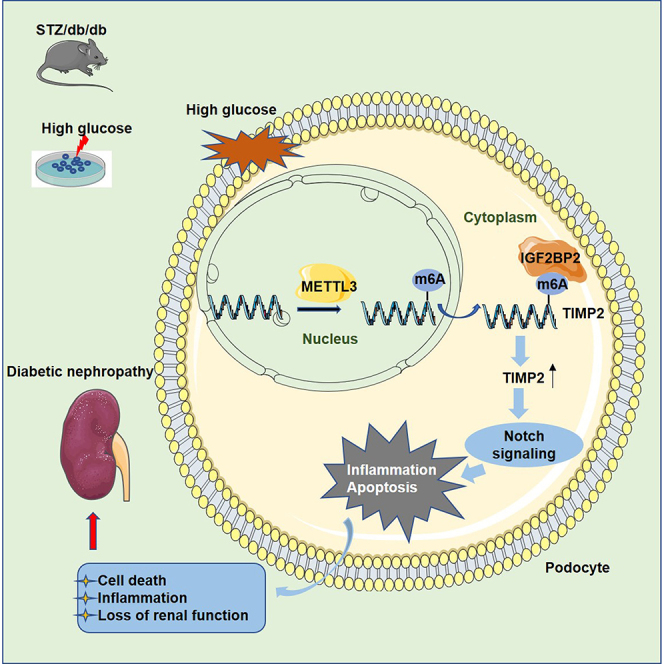
Wu and his colleagues reveal for the first time that METTL3-mediated m6A modification is an important mechanism of podocyte injury in DN. Targeting m6A through the writer enzyme METTL3 is a potential approach for the treatment of DN.
Introduction
Diabetic nephropathy (DN), a common microvascular complication of diabetes, is the main cause of chronic kidney disease (CKD), which accounts for approximately 50% of end-stage renal disease (ESRD) cases.1,2 The pathological features of DN include a variety of structural and functional changes in the kidneys, including glomerular and tubular hypertrophy, mesangial matrix expansion, extracellular matrix (ECM) accumulation, and podocyte dysfunction.3, 4, 5 Podocytes are highly differentiated glomerular epithelial cells that play an essential role in maintaining the integrity of the glomerular filtration barrier.6 Since podocytes have limited repair and regeneration capabilities, the degree of podocyte injury is considered to be the main prognostic determinant of ESRD.7 In addition, increased inflammation can directly destroy the structure of the kidney, which is closely related to the progression of DN.8,9 Although progress has been made to control blood glucose, hypertension, dyslipidemia, and related metabolic abnormalities, the number of patients who progress to ESRD due to DN remains high. There is an urgent need to further understand the etiology of DN as well as identify new biomarkers and therapeutic targets.
N6-methyladenosine (m6A) methylation is ubiquitous modification in eukaryotic mRNA. The effects of m6A modification include the maintenance of mRNA stability, transport, splicing, positioning, translation, and protein-RNA interaction.10 The m6A modification in mammalian cells is dynamic and reversible. The m6A methyltransferase (also referred as the writer: METTL3; METTL14; KIAA1429; and WTAP) performs the modification reaction, whereas m6A demethylase (also referred as the eraser: FTO and ALKBH5) leads to the reversal of this modification.11 Furthermore, specific RNA-binding proteins (also known as readers: YTHDF1/2/3; IGF2BP1/2/3; eIF3; HNRNPA2B1; etc.) can directly or indirectly bind to m6A motifs and thereby influence the RNA function. The biological functions of m6A modulators are related to tissue development, cell differentiation, circadian rhythm, and tumor progression.12 In addition, m6A modification can regulate inflammation and apoptosis, which are important mechanisms mediating pathological injury in DN. However, the biological role of m6A and the potential regulatory mechanism in DN remain largely unknown.
In this study, we explored the biological role of METTL3-mediated m6A modification in DN and revealed for the first time that METTL3 may serve as a new predictive biomarker and therapeutic target to block the progression of DN.
Results
Association of DN in type 1 and type 2 diabetes with high levels of m6A mRNA methylation
To clarify the functional role of m6A modification in DN, we first detected the level of m6A modification in mRNA of type 1 diabetic mice kidneys (4, 8, 12, and 16 weeks after streptozotocin [STZ] induction). Through colorimetric detection of RNA m6A methylation, we found that STZ-induced renal tissue RNA m6A modification levels 12 and 16 weeks after STZ induction were significantly higher than those in the control group (Figures 1A and 1B). The m6A modification is mainly catalyzed by the m6A writer (METTL3, METTL14, KIAA1429, and WTAP) and removed by eraser (ALKBH5 and FTO). To explore the reasons for the changes in m6A modification in DN, we compared the temporal mRNA levels of m6A writers and erasers in diabetic and control kidneys (Figure S1A). The results showed that the mRNA expression levels of different enzymes changed differentially at 4, 8, 12, and 16 weeks after STZ induction. To further determine the cause underlying the changes in m6A modification during early DN, we used the mice kidney tissue at 12 weeks after STZ induction to perform western blotting. As shown in Figures 1C and S1B, the protein level of METTL3 significantly increased, while the expression of METTL14 was decreased; there was no significant change in other enzymes, which suggested that METTL3 may mediate the increased m6A modification of renal mRNA in STZ-induced DN. Similar results were also found in type 2 diabetic db/db mice. The results presented in Figures 1D and 1E show that the m6A methylation in the kidneys of the db/db mice at 20 weeks of age was significantly higher than in the db/m group. RT-PCR results showed that the expression levels of several methylation-related genes changed significantly at 20 weeks (Figure S1C). Results of protein level analysis showed that a significant increase in METTL3 level may be involved in mediating the enhanced m6A modification (Figures 1F and S1D). Conclusively, increased m6A modification is observed in the type 1 and type 2 diabetes, and it may be mediated by the increased expression of METTL3.
Figure 1.

The expression of m6A was upregulated in type 1 and type 2 diabetic mice, consistent with the increased levels of METTL3 in podocyte
(A) The global level of mRNA m6A modification in STZ-induced mice kidney was determined by colorimetric ELISA-like assay. (B) The m6A level of kidney mRNA at different time points after STZ induction was detected by dot blot experiment. The m6A level of poly(A)+ RNAs isolated from total RNA was indicated by m6A dot blot (gray stripe). Methylene blue (MB) staining served as a loading control (blue stripe). (C) Expression of RNA m6A methylation-regulated associated genes in STZ-induced diabetic mice was detected by western blot. (D) The global level of mRNA m6A modification in db/db mice kidney was determined by EpiQuik m6A RNA methylation quantification ELISA kit. (E) Dot blot experiment showed the m6A levels of kidney mRNA at different age of db/db or db/m mice. (F) Expression of RNA m6A methylation-regulation-associated genes was detected in the kidneys of db/db or db/m mice by western blot. (G) The global level of m6A modification in high-glucose-treated MPC5 cells was detected by m6A RNA methylation quantification kit. (H) Dot blot experiment showing the m6A level of MPC5 cell mRNA at 24 h stimulated by NG or HG. (I) Expression of RNA m6A methylation-regulation-associated genes in MPC5 cells was detected by western blot. (J) The expression of m6A modification levels in podocyte after silencing different m6A methyltransferase was detected using m6A RNA methylation quantification kit. (K) The level of TNF-α expression after different m6A methylation-regulation genes knockdown under HG stimulation was determined by qRT-PCR experiment. (L) Representative western blot of METTL3 in podocytes treated with advanced glycation end product (AGE) (50–200 μg/mL) for 24 h. Statistical analysis of western blot is shown on the right panel of Figure 1L. (M) Immunohistochemical staining of METTL3 in STZ-induced type 1 diabetic mice and db/db type 2 diabetic mice as well as control mice. Statistical analysis of Immunohistochemical staining are shown on the right panel of Figure 1M. Scale bars: black 50 μm; red 20 μm. (N) Representative immunofluorescence of METTL3 and WT-1 in diabetic mice and renal biopsies from patients. The arrows indicate representative podocytes. Scale bars: 20 μm. Data represent the mean ± SEM. ∗p < 0.05, ∗∗p < 0.01, and ∗∗∗p < 0.001. HG, high glucose, 30 mmol/L; NG, normal glucose, 5.5 mmol/L.
Upregulated expression of METTL3 in podocytes induced by high glucose (HG) accounts for the aberrant m6A modification
To explore the cell type that primarily contributes to the m6A modification in renal mRNA, we screened the methylation-related enzymes in three different cell lines (Figure S2). The results showed that changes in methylation-related enzymes in mesangial (Figure S2A) and epithelial cells (Figure S2B) were not obvious after the stimulation with HG. However, the m6A modification of podocyte mRNA increased significantly (Figures 1G and 1H), and the expressions of “writer” and “eraser” varied significantly (Figures 1I and S2C) after the stimulation with HG. Therefore, we selected podocytes as the target cell to further study the role of m6A methylation. Furthermore, we performed immunofluorescence staining in db/m or db/db mice and STZ-induced mice to explore the key gene involved in m6A modification in DN. The results showed that only METTL3 was activated in podocyte in both db/db mice and STZ-induced mice compared with that in the control (Figure S3A). In vitro, we used small interfering RNA (siRNA) to silence the four methylation writer proteins, respectively (Figures S4A and S4B). According to the results of Figure 1J, we found that knockdown METTL3, METTL14, and KIAA1429 all reduced the m6A modification level of podocyte stimulated by HG. Only METTL3 silencing can reduce the expression of HG-stimulated podocyte tumor necrosis factor alpha (TNF-α), which is also a manifestation of podocyte injury (Figure 1K), suggesting that METTL3 may play an important role in podocyte injury in DN. Therefore, METTL3 was selected for further study. Consistently, we observed that advanced glycation end product (AGE) stimulation also significantly increased the expression of METTL3 (Figure 1L). Furthermore, results of immunohistochemistry (IHC) showed that METTL3 expression was significantly increased in the glomeruli of mice with type 1 and type 2 diabetes (Figure 1M). Using immunofluorescence staining of METTL3 and WT-1, we found that the METTL3 expression was increased significantly in the podocytes of mice with type 1 and type 2 diabetes (Figure 1N). In order to explore the correlation between METTL3 expression and clinical DN, we performed immunofluorescence double staining for METTL3 and podocyte marker WT-1 in renal specimens of DN patients. Results showed that expression of METTL3 in podocytes was positively correlated with 24-h urinary microalbumin (Spearman r = 0.6722; p < 0.05) and creatinine (CRE) levels (Spearman r = 0.2717; p < 0.05) and negatively correlated with estimated glomerular filtration rate (Spearman r = −0.4957; p < 0.05; Figures 1N and S5A–S5C).
METTL3 knockout alleviates inflammation and apoptosis in HG-stimulated podocytes
We explored the function of METTL3 in vitro using CRISPR-Cas9 to knock out METTL3 expression in podocytes (Figure 2A). Results of western blot analysis showed that knocking out METTL3 significantly restored the expression levels of nephrin, WT-1, and podocin following HG stimulation (Figure 2B). Electron microscopy showed condensed chromatin and decreased cell content in the cytoplasm of podocyte after HG stimulation; METTL3 knockout eliminated these changes (Figure 2C). Furthermore, knocking out METTL3 significantly reduced TNF-α, interleukin-1β (IL-1β), and MCP-1 expression after HG treatment (Figure 2D) along with the levels of phospho-p65 nuclear factor κB (NF-κB) protein (Figure 2E), which is a key transcription factor of the classic inflammatory pathway. By the detecting of cleaved-caspase3 (Figure 2F) and performing flow cytometry (Figure 2G), we observed that the reduced METTL3 alleviated the HG-induced apoptosis in podocytes. Moreover, we overexpressed METTL3 in MPC5 cells (Figures 2H and 2I) and observed that METTL3 overexpression enhanced HG-induced inflammatory indices (Figure 2J) and apoptosis (Figure 2K) in podocytes.
Figure 2.

METTL3 facilitates HG-induced inflammation and apoptosis in podocytes in vitro
(A)Western blot was performed to identify the knockout effect of METTL3. (B) Representative western blot gel documents and summarized data showing that the gene knockout of METTL3 restored the expressions of WT-1, nephrin, and podocin in podocytes. (C) Electron microscopy demonstrating the ultrastructural changes in podocytes induced by HG with or without METTL3 knockout. (D) qRT-PCR showing the relative level of pro-inflammatory cytokines TNF-α, IL-1β, and MCP-1 to evaluate the role of METTL3 in podocytes stimulated by HG. (E) Western blot analysis and quantitative data of NF-κB phosphorylation in MPC5 cells. (F) Western blot analysis and quantitative data of cleaved-caspase3 in MPC5 cells. (G) Podocytes with different treatments were stained with fluorescein isothiocyanate (FITC)-conjugated annexin V and propidium iodide (PI) and analyzed by flow cytometry to evaluate the role of METTL3 in the aggravation of apoptosis. (H) qRT-PCR data to identify the effect of overexpression of METTL3 in podocytes. (I) Western blot analysis showing the effect of the overexpression of METTL3 in podocytes. Statistical analysis is shown on the right panel. (J) The relative levels of the inflammatory index in podocytes with METTL3 overexpression. (K) Flow cytometry showing the apoptosis level of podocytes when overexpressing METTL3. Data represent the mean ± SEM for 3–4 independent experiments. ∗p < 0.05, ∗∗p < 0.01, and ∗∗∗p < 0.001. KO, knockout; OE, overexpression; SgNC, sgRNA normal control; SiMETTL3, siRNA-METTL3.
METTL3 deletion alleviated podocyte injury in STZ-induced diabetic mice
To elucidate the role of METTL3 in podocyte injury in vivo, we generated conditional knockout mice in which METTL3 was specifically ablated in podocytes using Cre-LoxP recombination system (Figure 3A). Nphs1-Cre mice were crossed with METTL3fl/fl to generate Nphs1-Cre METTL3fl/fl mice (conditional knockout [cKO] mice), which were identified by tail genotyping (Figure 3B) and western blot analysis of METTL3 in glomeruli isolated from Cre+/METTL3fl/fl mice (Figure S6A). The 24-h urinary albumin excretion rate of diabetic mice was significantly higher than that of the control group but decreased significantly after METTL3 deletion to only about 50% of the diabetic group (Figure 3C). In addition, cKO of METTL3 in podocytes had no significant effect on blood glucose levels (Figure 3C). Periodic acid-Schiff (PAS) staining results showed that conditional deletion of podocyte METTL3 significantly reduced the mesangial expansion index in diabetic mice (Figure 3D). Electron microscopy results also confirmed that cKO of METTL3 reduced the level of podocyte injury (Figure 3E). Results of western blot and IHC showed that METTL3 deletion restored the loss of DN podocyte markers (Figures 3F and 3G). The results of terminal deoxynucleotidyl transferase deoxyuridine-triphosphate nick end labeling (TUNEL) staining and glomerular western blotting showed that knocking out METTL3 can significantly reduce podocyte apoptosis (Figures 3H and 3I). Furthermore, compared with the diabetic group, the expression of TNF-α, IL-1β, and MCP-1 mRNA was significantly reduced after METTL3 knockout (Figure 3J). To explore the therapeutic potential of silent METTL3, we silenced METTL3 in STZ-induced diabetic mice. In vivo imaging of mice showed that EGFP was significantly enriched in the kidney after injecting adeno-associated virus serotype-9 (AAV9) coated with short hairpin RNA (shRNA)-METTL3-EGFP into the renal pelvis of diabetic mice (Figure S7A). AAV9-shMETTL3 significantly reduced the expression of METTL3 in the kidneys of the diabetic mice (Figures S7B–S7D). The 24-h urinary albumin excretion rate of diabetic mice was significantly higher than that of the control group, while decreased markedly after METTL3 silencing (Figure S7E). Furthermore, knocking down METTL3 had no significant effect on blood glucose (Figure S7E). PAS staining results showed that silencing METTL3 significantly alleviated the mesangial expansion index of diabetic mice (Figure S7F). The electron microscope results confirmed that silencing METTL3 reduced the extent of podocyte injury (Figure S7G). Western blot, IHC, and immunofluorescence results showed that silencing METTL3 restored the loss of podocyte markers in STZ-induced mice (Figures S7H and S7I). TUNEL staining and western blot analysis showed that silencing METTL3 can markedly reduce podocyte apoptosis (Figures S7J and S7K). Concomitantly, the expression of TNF-α, IL-1β, and MCP-1 significantly reduced after METTL3 silencing when compared with the diabetic group (Figure S7L).
Figure 3.

Conditional knockout METTL3 in podocyte in vivo attenuates podocyte injury and albuminuria in STZ-induced diabetic mice
(A) Conditional knockout mice with METTL3 specifically excised in podocytes were produced using the Cre-LoxP recombinant system. (B) Genotyping was determined by tail preparation and PCR. (C) Mouse urine albumin ELISA showed that knockout METTL3 in podocyte significantly reduced STZ-induced 24-h urine albumin excretion rate. Results showed that blood glucose increased significantly in the diabetic group, while knockout METTL3 in podocyte did not affect its levels. (D) PAS staining and quantifications showing typical glomerular structure changes in different groups of mice. Scale bars: black 50 μm; red 20 μm. (E) Transmission electron microscopy (TEM) was used to analyze the representative micrographs and quantification of the average thickness of the glomerular basement membrane (GBM) and the average foot process width in different age groups of mice. Scale bars: 500 nm. (F) IHC of WT-1 and immunofluorescence of synaptopodin showed that knockout METTL3 restored podocyte loss. Statistical analysis of IHC is shown on the right panel. Scale bars: 20 μm. (G) Western blot showing the expression levels of WT-1 and nephrin in different groups. Statistical analysis is shown on the right panel. (H) Western blot of glomerular tissue showing the expression level of cleaved-caspase3. Statistical analysis is shown on the below panel. (I) TUNEL staining of the kidney showed that apoptosis of podocytes was significantly increased in diabetic mice and restored by knocking out METTL3 in podocyte. Scale bars: 20 μm. (J) The relative levels of the inflammatory index of kidney tissue in different groups. Data represent the mean ± SEM for 5–6 mice. ∗p < 0.05, ∗∗p < 0.01, and ∗∗∗p < 0.001. cKO, conditional knockout of METTL3 in podocyte; Ctr, control; WT, wild type.
Silencing METTL3 in vivo significantly reduces kidney injury and podocyte loss in db/db mice
To explore the role of METTL3 in type 2 diabetic mice, we silenced METTL3 in vivo in db/db mice. Immunofluorescence (Figure S8A), IHC imaging (Figure S8B), and western blot analysis (Figure 4A) showed that AAV9-shMETTL3 significantly reduced the expression of METTL3 in the kidney of db/db mice. The 24-h urinary albumin excretion rate of db/db mice was significantly higher than that of the db/m group, while decreased markedly after METTL3 expression was silenced (Figure 4B). Furthermore, knocking down METTL3 had no significant effect on blood glucose levels (Figure 4B). PAS staining results showed that silencing METTL3 significantly alleviated the mesangial expansion index in diabetic mice (Figure 4C). The electron microscope results also confirmed that silencing METTL3 reduced the level of podocyte injury (Figure 4D). Results of western blot and IHC analysis showed that silencing METTL3 restored the loss of podocyte markers in db/db mice (Figures 4E and 4F). The results of TUNEL staining and western blot of glomeruli showed that silencing METTL3 can markedly reduce apoptosis in podocytes (Figures 4G and 4H). Concomitantly, the expression of TNF-α, IL-1β, and MCP-1 was significantly reduced after METTL3 was silenced in the db/db group (Figure 4I).
Figure 4.

METTL3 knockdown in vivo alleviates podocyte injury and albuminuria in db/db mice
(A) Representative western blot and summary data demonstrated the effect of METTL3 knockdown in the kidney of db/db mice. Statistical analysis of western blot is shown on the right panel. (B) Mouse urine albumin ELISA showed that silencing METTL3 significantly reduced 24-h urine albumin excretion rate in db/db mice; the results of serum blood glucose in different groups are also shown. (C) PAS staining and quantifications showing typical glomerular structure changes in different groups of mice. Scale bars: black 50 μm; red 20 μm. (D) TEM was used to analyze the representative micrographs and quantification of the average thickness of the GBM and the average foot process width in different age groups of mice. Scale bars: 500 nm. (E) IHC of WT-1 and podocin showed that silencing METTL3 restored podocyte loss. Statistical analysis is shown on the right panel. Scale bars: 20 μm. (F) Western blot showing the expression levels of WT-1 and nephrin in different groups. Statistical analysis is shown on the right panel. (G) Western blot of glomerular tissue showing the expression level of cleaved-caspase3. Statistical analysis of western blot is shown on the below panel. (H) TUNEL staining of the kidney showed that apoptosis of podocytes was significantly increased and restored by knocking down of METTL3. Scale bars: 20 μm. (I) The relative levels of the inflammatory index of kidney tissue in different groups. Data represent the mean ± SEM for 5–6 mice. ∗p < 0.05, ∗∗p < 0.01, and ∗∗∗p < 0.001. ns, not significant.
METTL3-mediated m6A modification of TIMP2 mRNA maintains its IGF2BP2-dependent stability
In order to determine the molecular mechanism underlying METTL3-mediated DN promotion, we performed RNA sequencing (RNA-seq) and mouse m6A-mRNA epitranscriptomic microarray in MPC5 cells with METTL3 knockdown or control cells following HG stimulation. Silencing METTL3 significantly affected the expression of podocyte genes under HG treatment (Figure 5A). RNA-seq showed that the expression of 131 transcripts was significantly downregulated (fold change> 1.5; p < 0.05) following METTL3 knockdown. Mouse m6A-mRNA epitranscriptomic microarray demonstrated that the m6A methylation modifications of 196 transcripts showed decreased abundance (fold change >1.2; p < 0.05). Interestingly, six transcripts overlapped in the RNA-seq and epitranscriptomic microarray data. Next, we compared these six transcripts with RNA-seq of diabetic kidney tissue induced by STZ. We screened genes whose genes in the diabetes group were 1.5 times higher than those in the normal group and whose p value was less than 0.05 for further overlap screening. We found that only TIMP2 was elevated in the case of diabetes and the level of m6A methylation was significantly regulated by METTL3 and affects its expression (Figure 5B). The m6A abundance of TIMP2 transcript decreased by 1.38-fold when METTL3 was downregulated, and the p = 0.018. Furthermore, we used the m6A prediction website SRAMP (http://www.cuilab.cn/sramp) and found that TIMP2 has multiple suspicious methylation modification sites near the stop codon (Figure 5C). Next, we verified the mRNA levels of TIMP2 following HG stimulation. As shown in Figure 5D, TIMP2 was highly expressed in podocytes and was significantly downregulated in the MPC5 cell line with METTL3 knockout. Consistently, western blot (Figure 5E), real-time PCR (Figure 5F), and IHC (Figure 5G) showed that silencing METTL3 decreased TIMP2 expression under both in vitro and in vivo conditions.
Figure 5.

METTL3-mediated m6A modification of TIMP2 mRNA maintains its IGF2BP2-dependent stability
(A) Heatmap showed differentially expressed genes in RNA sequencing (RNA-seq) in cells with METTL3 knockdown when compared with their corresponding controls stimulated by HG. (B) RNA-seq and mRNA Epitranscriptomic Array (m6A) in podocyte with or without METTL3 knockdown stimulated by HG were performed with intersection analysis with RNA-seq of STZ-induced diabetic mice. (C) Using m6A prediction website SRAMP (http://www.cuilab.cn/sramp) to predict the m6A modification site of TIMP2. (D) qRT-PCR verified the relative expression levels of TIMP2 in different groups with knocked out METTL3. (E) Western blot showed the expression levels of TIMP2 protein in different groups. Quantitative analysis is shown on the right panel. (F) qRT-PCR was used to detect TIMP2 mRNA levels in type 1 and type 2 diabetic mice with METTL3 knockdown. (G) IHC was used to detect TIMP2 expression in type 1 and type 2 diabetic mice with METTL3 knockdown. Quantitative analysis is shown on the right panel. Scale bars: 50 μm. (H) MeRIP-qPCR analysis was employed to demonstrate METTL3-mediated TIMP2 m6A modifications. The m6A modification of TIMP2 was decreased when METTL3 was knocked out. (I) The levels of TIMP2 expression in METTL3 knockout and their corresponding control cells treated with actinomycin D (5 μg/mL) at indicated time points were detected by qRT-PCR. (J) We constructed wild-type or mutant TIMP2-3′ UTR fused with the luciferase reporter, respectively. (K) The transcriptional level of wild-type TIMP2, but not the mutation, significantly decreased in METTL3 knockout cells by luciferase reporter assay. (L) The silencing effect of IGF2BP1/2/3 was demonstrated by RT-PCR. (M) The mRNA levels of TIMP2 in IGF2BP1/2/3 knockdown MPC5 cells were detected by qRT-PCR. (N) IGF2BP2-specific antibody and IgG control antibody were used to detect the enrichment of IGF2BP2 binding TIMP2 m6A modification sites using RIP-qPCR. Data represent the mean ± SEM. ∗p < 0.05, ∗∗p < 0.01, and ∗∗∗p < 0.001. KD, knockdown of METTL3; MUT, mutation; SiIGF2BP1, siRNA-IGF2BP1; SiIGF2BP2, siRNA-IGF2BP2; SiIGF2BP3, siRNA-IGF2BP3; SiNC, siRNA-NC.
Methylated RNA immunoprecipitation (MeRIP)-qPCR results indicated that, compared with the immunoglobulin G (IgG) group, the m6A antibody notably enriched TIMP2 mRNA following HG stimulation. However, the m6A-specific antibody significantly decreased the enrichment of TIMP2 mRNA in METTL3 knockout cells (Figure 5H). Considering that the m6A modification positively regulates the mRNA level of TIMP2, we detected whether m6A modification affects the stability of TIMP2 mRNA. MPC5 cells were treated with the transcription inhibitor actinomycin D (Figure 5I) for indicated intervals, and results showed knockout of METTL3 significantly reduced the stability of TIMP2 mRNA. In order to further verify the m6A modification of TIMP2 mRNA by METTL3, we constructed a luciferase reporter gene containing wild-type or mutant TIMP2. For the mutant TIMP2, the high-confidence GGACA near the stop codon was deleted to cause mutation (Figure 5J). The luciferase reporter assay showed that, in the absence of METTL3, the transcription level of wild-type TIMP2 decreased significantly, while the mutant TIMP2 did not (Figure 5K). These results indicate that the regulation of TIMP2 is controlled by METTL3-related m6A modification. Recently, there was a study reported that IGF2BPs, including IGF2BP1/2/3, a unique family of m6A readers that targets thousands of mRNA transcripts by recognizing m6A motifs, enhances mRNA stability and translation.13 Therefore, we respectively designed three specific siRNAs for each target of IGF2BP1/2/3 (Figure 5L), and results showed that only knocking down IGF2BP2 significantly inhibited the expression of TIMP2 mRNA, while that of IGF2BP1/3 had no apparent effect (Figure 5M). As shown in Figure 5N, compared with the IgG control antibody, the IGF2BP2 specific antibody significantly enriched TIMP2 mRNA, which markedly decreased in podocyte without METTL3 in RIP-qPCR analysis. Therefore, our study indicated IGF2BP2 enhances TIMP2 mRNA stability in a m6A-dependent manner.
TIMP2 inhibition mitigates podocyte injury in type 1 diabetic mice
To further characterize the effect of TIMP2 in DN, we used AAV9-shTIMP2 to generate TIMP2 knocking down mice (Figures 6A, S8C, and S8D). Under in vivo conditions, we found that silencing TIMP2 significantly reduced the 24-h urinary albumin excretion rate of STZ-induced diabetic mice without altering their blood glucose levels (Figure 6B). PAS showed that silencing TIMP2 alleviated mesangial expansion (Figure 6C). The results of electron microscopy demonstrated that silencing TIMP2 significantly reduced podocyte injury (Figure 6D). IHC and western blot results showed that the loss of podocytes in diabetic mice was relieved after TIMP2 silencing (Figures 6E and 6F). Moreover, knocking down TIMP2 expression reduced apoptosis in glomeruli (Figures 6G and 6H) and inhibited kidney inflammation (Figure 6I).
Figure 6.

TIMP2 knockdown in vivo attenuates podocyte injury and albuminuria in STZ-induced DN
(A) Representative western blot and summarized data showing TIMP2 gene knockdown in the kidney. (B) Results of mouse urine albumin ELISA and blood glucose of different groups. (C) PAS staining and quantifications showing typical glomerular structure changes in different groups of mice. Scale bars: black 50 μm; red 20 μm. (D) TEM was used to analyze the representative micrographs and quantification of the average thickness of the GBM and the average foot process width in different age groups of mice. Scale bars: 500 nm. (E) IHC of WT-1 and podocin showed that silencing TIMP2 restored podocyte loss. Quantitative analysis is shown on the right panel. Scale bars: 20 μm. (F) Western blot shows the expression levels of WT-1 and nephrin in different groups. Quantitative analysis is shown on the right panel. (G) Western blot of glomerular tissue showed the expression level of cleaved-caspase3. Quantitative analysis is shown on the below panel. (H) TUNEL staining of the kidney showed that apoptosis in podocytes was significantly increased and restored by knockdown of TIMP2. Scale bars: 20 μm. (I) The relative levels of the inflammatory index of kidney tissue in different groups. Data represent the mean ± SEM for 5–6 mice. ∗p < 0.05, ∗∗p < 0.01, and ∗∗∗p < 0.001.
TIMP2 inhibition mitigates podocyte injury in type 2 diabetic mice
To further characterize the role of TIMP2 in db/db mice, we used AAV9-shTIMP2 to generate TIMP2 knocked down db/db and db/m mice. Results showed that, compared with the db/db group, silencing TIMP2 (Figures S7A, S8E, and S8F) significantly reduced urinary albumin excretion rate (Figure 7B), pathological injury of kidney (Figures 7C and 7D), podocyte loss (Figures 7E and 7F), podocyte apoptosis (Figures 7G and 7H), and inflammation in diabetic mice (Figure 7I).
Figure 7.

TIMP2 knockdown in vivo alleviates podocyte injury and albuminuria in db/db diabetic mice
(A) Representative western blot and summarized data showing gene knockdown of TIMP2 in the kidney of db/db mice. (B) Results of mouse urine albumin ELISA and blood glucose of different groups. (C) PAS staining and quantifications showing typical glomerular structure changes in different groups of mice. Scale bars: black 50 μm; red 20 μm. (D) TEM was used to analyze the representative micrographs and quantification of the average thickness of the GBM and the average foot process width in different age groups of mice. Scale bars: 500 nm. (E) IHC of WT-1 and podocin showed that silencing TIMP2 restored podocyte loss. Quantitative analysis is shown on the right panel. Scale bars: 20 μm. (F) Western blot shows the expression levels of WT-1 and nephrin in different groups. Quantitative analysis is shown on the right panel. (G) Western blot of glomerular tissue showed the expression level of cleaved-caspase3. Quantitative analysis is shown on the below panel. (H) TUNEL staining of the kidney showed that apoptosis of podocytes in db/db mice was significantly increased and restored by knockdown of TIMP2. Scale bars: 20 μm. (I) The relative levels of the inflammatory index of kidney tissue in different groups. Data represent the mean ± SEM for 5–6 mice. ∗p < 0.05, ∗∗p < 0.01, and ∗∗∗p < 0.001.
Regulation of diabetic podocyte inflammation and apoptosis through TIMP2-mediated Notch signaling pathway-dependent pathways by METTL3
To further characterize the role of TIMP2 in DN, we generated three different siRNAs targeting TIMP2 and confirmed the knockdown efficiency of these constructs using qRT-PCR and western blotting (Figures 8A and 8B). Knockdown of TIMP2 significantly improved the expression of nephrin and WT-1 (Figure 8C) and reduced cellular inflammation (Figures 8D and 8E) and apoptosis (Figures 8F and 8G) following HG stimulation. We employed a rescue experiment to further verify whether METTL3 plays a pro-inflammatory and pro-apoptotic effect through TIMP2 in podocytes treated with HG. Results showed that TIMP2 overexpression with METTL3 knockout eliminated the protective effect of METTL3 knockout in podocyte injury, inflammatory response, and podocyte apoptosis under HG stimulation (Figures 8H–8K). Therefore, our data indicated that METTL3 promotes DN podocyte injury by upregulating the expression of TIMP2. To further determine the mechanism of TIMP2 in podocytes stimulated by HG, we performed RNA-seq on podocytes silencing TIMP2, with or without HG stimulation. The results showed that knocking down TIMP2 significantly downregulated several signal transductions, including inflammation and apoptosis. Furthermore, the heatmap showed that the expression of Notch1/2/3/4 were obviously altered by TIMP2 knockdown (Figure 8L). Furthermore, we confirmed this change in podocytes and diabetic mice kidney with or without silenced TIMP2 (Figures 8M–8O). Results showed that knockdown of TIMP2 can significantly reduce the expression of Notch3 and Notch4 (Figures 8M–8O). In addition, knockout of METTL3 significantly reduced the protein and mRNA expression levels of Notch3 and Notch4 in podocytes stimulated by HG, while silencing METTL3 significantly reduced the protein and mRNA expression levels of Notch3 and Notch4 in glomeruli of type 1 and type 2 diabetic mice (Figures S9A–S9F). Rescue experiments also showed that METTL3 mediated the expression of Notch3 and Notch4 in podocytes stimulated by HG through TIMP2 (Figure S9G). Based on these results, we concluded that TIMP2 may promote podocyte injury by upregulating Notch3 and Notch4 expression.
Figure 8.

Inhibition of TIMP2 mitigates podocyte injury by downregulating Notch signaling
(A and B) RT-PCR and western blot analysis were performed to detect the siRNA silencing effect of TIMP2. (C) Representative western blot and summarized data of nephrin and WT-1 in MPC5 cells. (D) Podocyte inflammatory responses of different groups were detected by qRT-PCR. (E) Western blot data showed silencing TIMP2 significantly reduced the phosphorylation of P65 in podocytes. (F) Western blot analysis and quantitative data of cleaved-caspase3 in MPC5 cells. (G) Podocytes with different treatments were stained with FITC-conjugated annexin V and PI and analyzed by flow cytometry to evaluate the role of TIMP2 in the aggravation of apoptosis. (H and I) We overexpressed TIMP2 in podocytes with METTL3 knockout and used western blot analysis to detect the expression levels of WT-1, nephrin, and P-P65. (J) qRT-PCR showed the expression of different groups of inflammatory factors. (K) Western blot analysis showed the expression of different groups of cleaved-caspase3. (L) The heatmap showed the effect of TIMP2 on the mRNA levels of different genes in podocytes treated with HG. (M) Real-time PCR demonstrated the effect of TIMP2 on the mRNA levels of Notch1, Notch2, Notch3, and Notch4 genes in podocytes treated with HG. (N) Western blot analysis and quantitative data of Notch3 and Notch4 in MPC5 cells. (O) Real-time PCR showed the expression of Notch3 and Notch4 in renal tissue from mice with type 1 and type 2 diabetes. Data represent the mean ± SEM for 3–4 independent experiments. ∗p < 0.05, ∗∗p < 0.01, and ∗∗∗p < 0.001. KO-HG, METTL3-KO-HG; KO-OE-HG, METTL3-KO + TIMP2-OE-HG; OE-HG, TIMP2-OE-HG; SiTIMP2, SiRNA-TIMP2; Sg-Vec, SgNC-Vector-NG; Sg-Vec-HG, SgNC-Vector-HG.
Discussion
The m6A modification is the most abundant modification in eukaryotic mRNA and non-coding RNA. It plays a significant role in various human diseases, including cancer progression, diabetes, neurodevelopment disorder, and ischemic heart disease.14, 15, 16, 17, 18, 19, 20 In this study, we demonstrated that m6A levels increased significantly due to the upregulation of the methyltransferase METTL3 in DN. Mechanistically, increased METTL3 in podocytes stimulates the m6A modification of TIMP2 mRNA. Subsequently, the m6A reader IGF2BP2 directly binds to the m6A site on TIMP2 mRNA and maintains the stability of the mRNA. Knockdown of TIMP2 significantly reduces kidney damage and podocyte inflammation and apoptosis in DN. Our data provide a new mechanism underlying diabetic kidney damage and suggest that targeting METTL3 may be an attractive target for DN therapy.
Firstly, we screened suitable cells and necessary methylation-related genes contributing to high-level m6A modification in DN. RNA m6A modification participates in various cellular processes, such as mRNA maturation, protein translation, and molecular structure conversion, and has become a hotspot in the field of diabetic regulation in recent years.21 In this study, we examined the expression of four m6A methyltransferases and two demethylases in mouse models of type 1 and type 2 diabetes and found that the expression of METTL3 was significantly increased in the kidney tissues of type 1 and type 2 diabetic mice. By screening different cell lines, we found that m6A-related modification enzymes in podocytes may mediate crucial important regulatory mechanisms. Here, for the first time, we showed that increased expression of METTL3 was accompanied by deterioration of general DN indicators. Based on the transfection of siRNA targeting WTAP/METTL14/KIAA1429/METTL3 in podocytes to obtain transient knockdown cells, we demonstrated that METTL3 is not only responsible for m6A modifications but also accounts for high TNF-α level in podocytes under HG conditions.
The cytokine TNF coordinates the immune response by activating an inflammatory transcription program, but these signals can also trigger cell death.22 TNF-α has been widely studied to trigger programmed cell death by inducing apoptosis and/or necroptosis.23, 24, 25 In this study, we investigated the expression of TNF-α by silencing different methyltransferases, respectively, and we found that only knockdown of METTL3 significantly relieved the expression of TNF-α in podocytes stimulated by HG. Next, we found that knocking out METTL3 significantly alleviated the inflammation and apoptosis of podocytes in vitro and in vivo. Previous studies have found that the death domain (DD)-receptor-containing signal in the TNF receptor family mainly induces cell apoptosis. The main biochemical functions of the three death receptors Fas, death receptor 4 (DR4), and DR5 related to TNFR1 are activation of caspase and apoptotic cell death.26 Therefore, we speculate that METTL3-mediated podocyte apoptosis may be partly the result of promoting TNF-α expression.
We explored the role of METTL3 in DN. The m6A homeostasis is achieved by the coordinated regulation of the m6A methylase complex and demethylase. In intestinal epithelial cells, chondrocytes, and microglia, the role of METTL3 in regulating inflammation has been verified.27, 28, 29 Our studies have shown that METTL3 primarily mediates the increase in podocyte m6A modification levels, while deleting METTL3 in podocyte can alleviate diabetic kidney injury by mediating inflammation and apoptosis; overexpression of METTL3 aggravates these injuries. In addition, METTL3 upregulation has also been detected in podocytes of DN patients, and it is positively correlated with 24-h urinary albumin excretion and creatinine and negatively correlated with estimated glomerular filtration rate (GFR), suggesting that it could be used as an indicator of disease severity in clinical DN patients. This finding highlights the significance of METTL3 in podocyte pathophysiology in DN. The research results suggest that targeting m6A modification by adjusting the level of METTL3 is a promising strategy for the treatment of DN.
Furthermore, we investigated the detailed mechanism underlying METTL3-mediated regulation of podocyte injury. The m6A reader is involved in controlling the fate of mRNA, and IGF2BP1/2/3 is related to the stability of mRNA methylation. IGF2BPs, including IGF2BP1/2/3, are a unique family of m6A readers that target thousands of mRNA transcripts by recognizing a consistent GGC (m6A) sequence. Different from the function of family protein 2 containing YTH domain that promotes mRNA degradation, IGF2BPs promote the stability and storage of its target mRNAs in an m6A-dependent manner, thereby affecting gene expression.17 For the first time, we showed that only IGF2BP2 was directly bound to the specific m6A site of TIMP2 and controlled the half-life of TIMP2 mRNA in an m6A-dependent manner. However, our previous study found that the expression of IGF2BP2 in type 1 and type 2 diabetic mice did not increase significantly compared with that in the control group. Therefore, further molecular mechanisms of m6A methylation and mRNA fate warrant an in-depth study.
We detected the role played by TIMP2 in DN and its potential mechanisms. Through mouse mRNA epitranscriptomic array (m6A), we found that TIMP2 is a key downstream target of METTL3 in DN. TIMP2 belongs to the tissue inhibitor of metalloproteinase (TIMP) family. TIMP2 is an early biomarker for predicting critical illness in patients, especially sepsis patients and sepsis animals, suggesting that pre-injury or stress conditions often lead to acute kidney injury (AKI).30,31 At the same time, studies have also found that the elevation of TIMP2 induced by HG levels or Ang-II contributes to the pathogenesis of DN; however, the mechanism is unknown. In our present study, we found that the expression of TIMP2 increased in DN podocytes, further aggravating apoptosis and inflammation. We also performed RNA-seq; we found that Notch may be a potential target of TIMP2. Notch signal transduction can mediate inflammation, autophagy, and apoptosis in DN.32, 33, 34 Silencing TIMP2 significantly reduces the activation of the Notch pathway, thereby alleviating the injury of podocytes induced by HG. Therefore, it is necessary to further elucidate the role of Notch signaling and other potential downstream targets of METTL3 epigenetic regulation in podocytes. We attempt to find the mechanism by which TIMP2 regulates Notch signaling. TIMP is an endogenous inhibitor that activates matrix metalloproteinase (MMP). MMP is a large family of zinc-dependent endopeptidases that can degrade ECM proteins, such as collagen, laminin, fibronectin, vitronectin, and proteoglycan, and play an important role in AKI and DN.35,36 The activity of MMP2 and MT1-MMP is influenced by its physiological inhibitor TIMP2.37 Previous studies have found that upregulation of MMP2 by histone H3K9 β-hydroxybutyrylation antagonizes glomerulosclerosis in diabetic rat.38 Results showed HG decreased MT1-MMP gene expression and MMP-2 activation and promoted mesangial matrix accumulation in DN.39 In this study, we also found that METTL3 can regulate the expression of MMP2 and MT1-MMP (Figures S10A–S10C). In vitro, METTL3 knockout can restore the decreased expression of MMP2 and MT1-MMP stimulated by HG in podocytes and thus reduces ECM deposition, including collagen IV and fibronectin. In vivo METTL3 silencing can significantly reduce the expression of collagen IV and fibronectin in STZ-induced diabetic mice and db/db mice (Figures S10D–S10G). It has been found that MT1-MMP negatively regulates Notch signaling by cutting Dll1 to maintain normal B cell development.40 Another study found that MT1-MMP partially regulates the occurrence and maturation of endothelial cells (ECs) cilia by inhibiting Notch hyperactivation.41 It is possible to speculate that TIMP2 may affect the occurrence and development of DN by downregulating Notch signal by MT1-MMP. Notch activation further induces inflammation and apoptosis in DN.32
In conclusion, our findings reveal for the first time that METTL3 is highly expressed in type 1 and type 2 DN and increases the m6A modification level of TIMP2 of podocytes through an IGF2BP2-dependent mechanism to enhance its stability, which mediates DN podocyte inflammation and apoptosis through upregulating Notch3/4 signaling pathway. Our work reveals a new pathogenic mechanism of DN and opens up new avenues to explore effective DN treatment strategies.
Materials and methods
Human renal biopsy samples
The clinical studies were performed in accordance with the principles of the Declaration of Helsinki after obtaining informed consent from the patients. It was approved by the Research Ethics Committee of the First Affiliated Hospital of Anhui Medical University. The kidney biopsy specimens were recruited from the Department of Nephrology, the First Affiliated Hospital of Anhui Medical University. Type 2 diabetes mellitus (DM) patients were selected. The inclusion criteria were as follows: (1) diagnosed with type 2 diabetes; (2) renal biopsy diagnosed as DN; (3) 24-h urine albumin protein >30 mg/24 h; and (4) no obvious symptoms of apyrexial and infection, no cancer, and no autoimmune diseases. The control samples were obtained from patients with healthy kidney poles; they all underwent tumor nephrectomy and were not diagnosed with diabetes or other kidney disease. Fresh renal tissues were fixed with formalin for 24 h and embedded in paraffin until use. The information of DN patients is shown in Table S1.
Chemicals and reagents
The following reagents were used: transfection was performed with Lipofectamine RNAiMAX Reagent (Invitrogen Life Technologies, 13, 778-030) according to the manufacturer’s protocol. The following antibodies were used: anti-β-actin antibody (Proteintech, 66009-1-Ig); anti-m6A antibody (Synaptic Systems, 202,003); anti-METTL3 antibody (Abcam, Ab195352, ZEN-BIOSCIENCE [382,974]); anti-METTL14 antibody (Cell Signaling Technology, 51, 104); anti-WTAP antibody (Proteintech, 10200-1-AP); anti-KIAA1429 antibody (SAB, 29, 774); anti-TIMP2 antibody (Abcam, ab180630); anti-NF-κB p65 antibody (Cell Signaling Technology, 8242); anti-phospho-NF-κB p65 antibody (Cell Signaling Technology, 3033); anti-cleaved caspase3 antibody (Abcam, Ab2302); anti-NOTCH3 antibody (Proteintech, 55114-1-AP); anti-NOTCH4 antibody (Affinity, DF13597); anti-WT-1 antibody (Abcam, ab267377); anti-nephrin antibody (Abcam, ab216341); anti-podocin antibody (Abcam, ab181143); anti-MMP2 antibody (Proteintech, 10373-2-AP); anti-MT1-MMP antibody (Proteintech, 14552-1-AP); anti-IGF2BP2 antibody (Proteintech, 11601-1-AP); anti-col-Ⅳ antibody (Abcam, ab6586); and anti-fibronectin antibody (Abcam, ab6586). STZ was purchased from Sigma Chemical Company (MO, USA). The PAS kits were obtained from Solarbio (Beijing, China). Mouse Albumin ELISA Kit was obtained from Abcam Biotechnology (Cambridge, UK).
Diabetic mice model
All animal experiments were performed in the specific pathogen-free (SPF) animal laboratory of Anhui Medical University according to the NIH Guide for the Care and Use of Laboratory Animals and were approved by the Ethics Committee of Animal Research of Anhui Medical University (Hefei, China). Male C57BL/6J mice (approximately 6‒8 weeks old) were purchased from the Experimental Animal Center, Anhui Medical University. Male db/db mice were purchased from GemPharmatech (Nanjing, China). The experimental mice were maintained under standard conditions. The mice were provided with ad libitum access to food and water in a room with a constant temperature of 22°C ± 2°C and a humidity of 60% with a 12-h day/night cycle. After 7 days of acclimatization, STZ, dissolved in 0.1 M citrate buffer, was intraperitoneally administered daily to mice at a dose of 50 mg/kg after 12 h of food deprivation each day for 5 consecutive days. The type 1 diabetic mice were randomly separated into four groups (n = 5–8): AAV9-scramble-control group; AAV9-scramble-STZ; AAV9-shRNA-control; and AAV9-shRNA-STZ group (Hanbio Biotechnology, China). The 50 UL titer of 1 × 10¹² virus was injected into the renal pelvis using an insulin needle and maintained there for 2 to 3 s. The type 2 diabetic mice were randomly separated into four groups (n = 5–8): AAV9-scramble-db/m group; AAV9-scramble-db/db group; AAV9-shRNA-db/m group; and AAV9-shRNA-db/db group (Hanbio Biotechnology, China). The 100 UL titer of 1 × 10¹² virus was injected into the tail vein using an insulin needle and maintained there for 2 to 3 s. Blood glucose was monitored weekly in mice. At the end of 12 weeks, the 24-h urine samples were collected from the mice kept in metabolic cages. We collected kidney tissue and blood for further analysis. Blood was collected for determination of urea nitrogen and creatinine content. The kidneys were collected for paraffin embedding, electron microscope observation, and molecular biological analysis. Experimental animals were euthanized humanely after the administration of anesthesia.
Generation of podocyte-specific METTL3 knockout mice
METTL3 Flox/Flox (METTL3fl/fl) mouse lines were constructed by GemPharmatech (Nanjing, China). Nphs1-Cre METTL3fl/fl (cKO) mice (cKO) were generated by crossing METTL3 fl/fl mice with mice expressing Cre recombinase (Cre) under the control of the nephrin promoter (Nphs1-Cre).
Cell culture
Conditionally immortalized mouse podocytes (MPC5) were purchased from the Institute of Basic Medical Sciences, Chinese Academy of Medical Sciences. MPC5 was cultured at 33°C in RPMI 1640 containing 10% fetal bovine serum and 20 U/mL mouse recombinant interferon-g (IFN-g) medium. In order to induce differentiation, the podocytes were maintained for 7 days under non-permissive conditions without IFN-γ at 37°C for the experiment. Mouse tubular epithelial cells (mTECs) were kindly provided by Professor Lan HY from Chinese University of Hong Kong. Mouse mesangial cells (SV40) were purchased from the Cell Bank of Chinese Academy of Sciences and cultured in DMEM containing 5% serum. siRNA or overexpression plasmid (Hanbio Biotechnology, China) was transfected into MPC5 cells by adding Lipofectamine RNAiMAX Reagent (Invitrogen) as recommended by the manufacturer (siRNA sequences used in this study are shown in Table S2). We used the negative scrambled siRNA or negative scrambled plasmid (Hanbio Biotechnology, China) as a control. The diluted siRNA or plasmid and Lipofectamine RNAiMAX were combined and incubated for 20 min. The mixture was then added to the cells in OPTI-MEM medium. After incubation for 6 h, the cells were replaced by a complete medium. In this study, different treatments were used as followed: normal glucose (NG) (5.5 mM glucose); mannitol and low glucose (MG) (24.5 mM mannitol + 5.5 mM glucose); HG (30 mM glucose); and AGE (0–200μg/mL)
Western blot
Cells and kidney samples were homogenized and ruptured using ice-cold radio-immunoprecipitation assay (RIPA) buffer containing fresh protease and phosphatase inhibitors (Beyotime, China), and the protein concentration was measured using the bicinchoninic acid (BCA) assay (Beyotime, China). After denaturation, protein samples were subjected to SDS-PAGE, followed by immunoblotting with antibodies. Blots were visualized with an Enhanced ECL Chemiluminescent Substrate Kit (Yeasen, 36222ES76) and the Amersham Imager 600 System.
Quantification of the m6A modification
RNA was extracted from renal samples using the Trizol reagent (Invitrogen, 15,596,018) recommended by the manufacturer. NanoDrop (Thermo Fisher Scientific, MA, USA) was used to analyze the RNA quality. After the sample quality was unified, the changes in the overall m6A levels of mRNA were evaluated using the EpiQuik m6A RNA methylation quantification kit (colorimetric method; Epigentek, P-9005-48) according to the manufacturer's instructions. Poly(A) purified RNA (200 ng) was used for the analysis of each sample. Briefly, 200 ng of RNA was coated on the assay well. Then, the capture antibody solution and the detection antibody solution were added to the measurement wells at appropriate dilution concentrations. The m6A level was quantified calorimetrically by measuring the absorbance at 450 nm and then calculated based on a standard curve.
Dot blot
The RNA sample was boiled in a metal bath at 70°C for 5 min, placed on ice, and quickly cooled, and the RNA sample was spotted on the nylon membrane. Then, the membrane was put in a UV cross-linker for cross-linking for 5 min (UV lamp can be replaced, irradiated for 1 h) to bind RNA to the nylon membrane. The membrane was placed in 5% skimmed milk, sealed on a shaker at room temperature for 2 h, applied with m6A primary antibody, and incubated overnight on a shaker at 4°C. The next day, the membrane was washed three times with Tris-buffered saline with 0.1% Tween 20 detergent (TBST) solution on a shaking table at room temperature, each time for 10 min. Then, the secondary antibody was applied. The other membrane was stained with methylene blue as a control.
Immunohistochemical
After kidney paraffin sections were baked at 70°C for 30 min, the slices were dewaxed gradually, followed by a citrate autoclave for 5 min for antigen retrieval; naturally cooled to room temperature; and then placed in a 3% hydrogen peroxide solution at 37°C for 20 min. Next, 10% goat serum was used to seal in a 37°C incubator for 40 min, and the primary antibody was diluted with PBS according to the concentration specified in the instructions and placed in a humidified refrigerator at 4°C overnight. On the next day, the wet box was taken out to room temperature and reheated for half an hour, followed by PBS rinse three times, and the secondary antibody was added dropwise. After 40 min of incubation at 37°C, 3,3'-diaminobenzidine (DAB) color development was performed. After color development was completed, it was rinsed in running water for 10 min. The nuclei were stained with hematoxylin and photographed with a ZEISS microscope, and the IPWIN60 software was used to quantitatively analyze the immunohistochemical pictures.
RNA immunoprecipitation (RIP)
RIP was performed using the Magna RIP RNA-Binding Protein Immunoprecipitation Kit (Millipore Sigma, 17–701) following the manufacturer's instructions. MPC5 cells were transfected with the negative control or siRNA before treatment with HG concentrations. Briefly, magnetic beads pre-coated with 5 mg of anti-IGF2BP2 normal antibody (Proteintech, 11601-1-AP) or rabbit IgG (Millipore) were incubated with cell lysate at 4°C overnight. The beads containing the immunoprecipitated RNA-protein complex were then treated with proteinase K to remove protein. The RNA was purified using the Trizol method (Thermo Fisher Scientific), and the input was normalized using qRT-PCR (calculation of the fold change for comparison).
RNA isolation and real-time quantitative PCR
Trizol (Invitrogen) was used to extract total RNA from cells or kidney following the manufacturer's instructions. RNA was reverse transcribed into cDNA and amplified using Thermal Cycler system (CFX-6, Bio-Rad, CA, USA). β-actin acted as an internal reference to normalization, and data were expressed as the mean ± SEM. The primers used in this study are shown in Table S3.
m6A MeRIP-qRT-PCR
Total RNA was isolated from METTL3-knockout MPC5 cells or their corresponding controls under HG stimulation. The total RNA was sonicated into 100- to 150-nt fragments RNA and then incubated with m6A antibody to confirm m6A enrichment of the RNA by performing qRT-PCR or high-throughput assays. Briefly, fragmented RNA and 5 μg of m6A antibody or rabbit IgG were combined in 1 mL RIP immunoprecipitation buffer (100 μL of the supernatant, 860 μL of RIP Wash Buffer, 35 μL of 0.5 M EDTA, and 5 μL RNase inhibitor for each reaction) and incubated with shaking at 4°C overnight. m6A IP protease was incubated in proteinase K buffer at 55°C for 30 min with shaking. Trizol was used to extract RNA, and m6A immunopurification of mRNA was performed using the sample for detection using RT-PCR.
CRISPR-Cas9 knockout of METTL3 in MPC5
First, we designed the single guide RNA (sgRNA) targeting METTL3 (http://crispr.mit.edu): mMETTL3-sgRNA1: CGCTTCGCGAGAGATTGCAG; mMETTL3-sgRNA2: ACGCCGTTTCTGCCCTGCGA. Each sgRNA selected at least 10–15 single clones for knockout detection. Next, the primers were designed to amplify the knockout target fragments and were sent for sequencing. A knockout virus was constructed using the Lenti-V2-GFP viral vector. The sensitivity of MPC5 cells to puromycin was tested before infection, and the lowest lethal dose was 1 μg/mL. Cells in the log phase were selected and were cultured in six-well plates by 2 × 10⁵ cells per well. When the cell confluence reached 50%, the complete medium was replaced with a ratio of 1.5 mL 10% FBS + 60 μL virus supernatant, supplemented with 10 μg/mL polybrene to improve the virus infection efficiency. The six-well plates were centrifuged at room temperature for 30 min. After 24 h of infection, the virus infection solution was aspirated and added to complete medium. After 48 h, the corresponding concentration of puromycin was added for screening. The screening was performed for 3–5 days. The medium was changed, and the drug was added every day until all blank control cells were dead. Western blot was performed to analyze the knockout efficiency and select single clones for subsequent amplification.
Glomerulus separation
After anesthesia, the mice were cut along the midabdominal line to separate the abdominal aorta and inferior vena cava. A polyethylene tube was inserted along the abdominal aorta, and a small opening was cut in the inferior vena cava. Preheated 2 mL mixed trypsin and 8 mL magnetic bead solution were injected into the mice abdominal aorta. After all the injection was completed, the kidney was removed and cut into 1 cubic mm pieces and then cut into pieces. Three milliliters of digestive liquid was added, and the pieces incubated were for 30 min at 37°C. The mixture was beaten gently every 5 min. After that, the specimen was placed on ice, and the kidney tissue was washed by a 100-μm filter with Hank’s balanced salt solution (HBSS) buffer. After washing twice, the kidney tissue was centrifuged at 4°C for 300 g for 5 min. The supernatant was discarded, and HBSS was used to re-suspend the precipitate. The precipitate was cleaned twice by magnetic rack, and the protein lysate was added to extract the protein.
Luciferase reporter assay
MPC5 cells in 24-well plates were transfected with luciferase reporter vector fusing TIMP2-3′ UTR with or without wild-type or mutant TIMP2-3′ UTR. For the mutant m6A motif, the high-confidence GGACA near the stop codon was deleted to cause mutation. All cells were collected 48 h after transfection, and the firefly luciferase and Renilla luciferase activities in each well were calculated by the dual luciferase reporter gene analysis system (Promega, E1910). The relative ratio of firefly luciferase activity and Renilla luciferase activity was determined. Each experiment was repeated three times.
TUNEL staining
The one-step TUNEL cell apoptosis detection kit (Servicebio, lot no. XZ203802) was used according to the manufacturer's instructions. In brief, 20 μg/mL proteinase K was added to the tissue of the paraffin section of the kidney after dehydration; washed with PBS; the prepared TUNEL test solution added, which contains 2 μL TdT enzyme and 48 μL fluorescent labeling solution for one sample; and the mixture finally observed by Zeiss microscope.
Flow cytometry
The culture medium was collected into a 15-mL centrifuge tube, and the cells were washed twice with cold PBS and digested with trypsin without EDTA. The medium containing FBS was used to neutralize the digestion in time and the cells collected by centrifugation at 1,000 rpm for 5 min. The cells were washed twice with cold PBS. The cells were suspended in 400μL binding buffer, and 5μL annexin V-fluorescein isothiocyanate (FITC) added to the suspended cells, mixed gently, and incubated for 15 min in a refrigerator at 4°C in the dark. Ten microliters propidium iodide (PI) was added, mixed gently, and incubated at 4°C in the dark for 5 min. Beckman flow cytometer was used to detect cell apoptosis.
RNA-seq and data analysis
After siRNA transfection and HG treated for 24 h, METTL3-knockdown cells and their controls were collected for RNA-seq. Total RNA samples were enriched by Oligo dT, and then, the library was constructed by using KAPA Stranded RNA-Seq Library Prep Kit (Illumina). Sequencing was performed by Illumina NovaSeq 6000 instrument. RNA-seq data were deposited in the Gene Expression Omnibus database (GEO: GSE190436). For TIMP2-knockdown cells, after siRNA transfection and HG treated for 24 h, TIMP2-knockdown cells and their controls were collected for RNA-seq. Total RNA was isolated by Trizol method. RNA integrity was assessed using the Agilent 2100 Bioanalyzer (Agilent Technologies, Santa Clara, CA, USA). Next-generation sequencing was performed by an Illumina NovaSeq 6000 instrument according to the manufacturer's instructions (Illumina, San Diego, CA). The raw sequence reads were deposited in NCBI sequence read archive (SRA) database, with the accession number NCBI: SRR17177962-69.
Mouse m6A-mRNA epitranscriptomic microarray
The sample preparation and microarray hybridization were performed based on the Arraystar's standard protocols. Agilent Feature Extraction software (version 11.0.1.1) was used to analyze acquired array images. Raw intensities of immunoprecipitation (IP) (Cy5 labeled) and supernatant (Sup) (Cy3-labeled) were normalized with average of log2-scaled spike-in RNA intensities. Microarray data were deposited in the Gene Expression Omnibus database (GEO: GSE190516).
Statistical analyses
Data are presented as mean ± SEM as indicated in the figure legends. Statistical significance of differences was analyzed by unpaired t test or one-way ANOVA using GraphPad Prism 8 software. All experiments were performed independently thrice. p < 0.05 was regarded as a statistically significant difference.
Acknowledgments
We thank all the patients enrolled in this study. The authors acknowledge the grants from the National Natural Science Foundation of China (no. 81270813), 2019 Anhui Provincial Key Clinical Specialty Construction Project (Priority Development Specialty), 2019 Anhui Medical University Basic and Clinical Cooperative Research Promotion Project (2019xkjT014), and "Nephrology and Pharmacology Joint Construction Project" (2021lcxk012).
Author contributions
Y.W. and X.M. designed and supervised the study. L.J. drafted the manuscript and performed animal and molecular experiments. X.W., Y.H., and W.Z. constructed animal-feeding experiments. X.L. and X.H. helped with clinical sample collection. H.Z. was responsible for in situ injection of AAV9 in mouse kidney. J. Wen took pictures of the fluorescent mice in vivo. L.G. and J. Wang provided the necessary reagents and suggestions. Y.W., X.M., and X.L. revised the draft. All authors discussed the results and commented on the manuscript.
Declaration of interests
The authors declare no competing interests.
Footnotes
Supplemental information can be found online at https://doi.org/10.1016/j.ymthe.2022.01.002.
Contributor Information
Xiaoming Meng, Email: mengxiaoming@ahmu.edu.cn.
Yonggui Wu, Email: wuyonggui@medmail.com.cn.
Supplemental information
References
- 1.Fineberg D., Jandeleit-Dahm K.A., Cooper M.E. Diabetic nephropathy: diagnosis and treatment. Nat. Rev. Endocrinol. 2013;9:713–723. doi: 10.1038/nrendo.2013.184. [DOI] [PubMed] [Google Scholar]
- 2.Wang X., Yao B., Wang Y., Fan X., Wang S., Niu A., Yang H., Fogo A., Zhang M.-Z., Harris R.C., et al. Macrophage cyclooxygenase-2 protects against development of diabetic nephropathy. Diabetes. 2017;66:494–504. doi: 10.2337/db16-0773. [DOI] [PMC free article] [PubMed] [Google Scholar]
- 3.Najafian B., Alpers C.E., Fogo A.B. Pathology of human diabetic nephropathy. Contrib. Nephrol. 2011;170:36–47. doi: 10.1159/000324942. [DOI] [PubMed] [Google Scholar]
- 4.Tervaert T.W., Mooyaart A.L., Amann K., Cohen A.H., Cook H.T., Drachenberg C.B., Ferrario F., Fogo A.B., Haas M., de Heer E., et al. Pathologic classification of diabetic nephropathy. J. Am. Soc. Nephrol. 2010;21:556–563. doi: 10.1681/ASN.2010010010. [DOI] [PubMed] [Google Scholar]
- 5.Denhez B., Rousseau M., Dancosst D.A., Lizotte F., Guay A., Auger-Messier M., Côté A.M., Geraldes P. Diabetes-induced DUSP4 reduction promotes podocyte dysfunction and progression of diabetic nephropathy. Diabetes. 2019;68:1026–1039. doi: 10.2337/db18-0837. [DOI] [PubMed] [Google Scholar]
- 6.Nagata M. Podocyte injury and its consequences. Kidney Int. 2016;89:1221–1230. doi: 10.1016/j.kint.2016.01.012. [DOI] [PubMed] [Google Scholar]
- 7.Xiong T., Attar M., Gnirck A.C., Wunderlich M., Becker M., Rickassel C., Puelles V.G., Meyer-Schwesinger C., Wiech T., Nies J.F., et al. Interleukin-9 protects from early podocyte injury and progressive glomerulosclerosis in Adriamycin-induced nephropathy. Kidney Int. 2020;98:615–629. doi: 10.1016/j.kint.2020.04.036. [DOI] [PubMed] [Google Scholar]
- 8.Navarro-Gonzalez J.F., Mora-Fernandez C., Muros D.F.M., Garcia-Perez J. Inflammatory molecules and pathways in the pathogenesis of diabetic nephropathy. Nat. Rev. Nephrol. 2011;7:327–340. doi: 10.1038/nrneph.2011.51. [DOI] [PubMed] [Google Scholar]
- 9.Pichler R., Afkarian M., Dieter B.P., Tuttle K.R. Immunity and inflammation in diabetic kidney disease: translating mechanisms to biomarkers and treatment targets. Am. J. Physiol. Ren. Physiol. 2017;312:F716–F731. doi: 10.1152/ajprenal.00314.2016. [DOI] [PMC free article] [PubMed] [Google Scholar]
- 10.Chen X.Y., Zhang J., Zhu J.S. The role of m(6)A RNA methylation in human cancer. Mol. Cancer. 2019;18:103. doi: 10.1186/s12943-019-1033-z. [DOI] [PMC free article] [PubMed] [Google Scholar]
- 11.Meyer K.D., Jaffrey S.R. The dynamic epitranscriptome: N6-methyladenosine and gene expression control. Nat. Rev. Mol. Cell Biol. 2014;15:313–326. doi: 10.1038/nrm3785. [DOI] [PMC free article] [PubMed] [Google Scholar]
- 12.Tong J., Flavell R.A., Li H.B. RNA m(6)A modification and its function in diseases. Front. Med. 2018;12:481–489. doi: 10.1007/s11684-018-0654-8. [DOI] [PubMed] [Google Scholar]
- 13.Huang H., Weng H., Sun W., Qin X., Shi H., Wu H., Zhao B.S., Mesquita A., Liu C., Yuan C.L., et al. Recognition of RNA N(6)-methyladenosine by IGF2BP proteins enhances mRNA stability and translation. Nat. Cell Biol. 2018;20:285–295. doi: 10.1038/s41556-018-0045-z. [DOI] [PMC free article] [PubMed] [Google Scholar]
- 14.Wang Q., Chen C., Ding Q., Zhao Y., Wang Z., Chen J., Jiang Z., Zhang Y., Xu G., Zhang J., et al. METTL3-mediated m(6)A modification of HDGF mRNA promotes gastric cancer progression and has prognostic significance. Gut. 2020;69:1193–1205. doi: 10.1136/gutjnl-2019-319639. [DOI] [PubMed] [Google Scholar]
- 15.Wu Y., Yang X., Chen Z., Tian L., Jiang G., Chen F., Li J., An P., Lu L., Luo N., et al. m(6)A-induced lncRNA RP11 triggers the dissemination of colorectal cancer cells via upregulation of Zeb1. Mol. Cancer. 2019;18:87. doi: 10.1186/s12943-019-1014-2. [DOI] [PMC free article] [PubMed] [Google Scholar]
- 16.Chen Y., Peng C., Chen J., Chen D., Yang B., He B., Hu W., Zhang Y., Liu H., Dai L., et al. WTAP facilitates progression of hepatocellular carcinoma via m6A-HuR-dependent epigenetic silencing of ETS1. Mol. Cancer. 2019;18:127. doi: 10.1186/s12943-019-1053-8. [DOI] [PMC free article] [PubMed] [Google Scholar]
- 17.Cheng M., Sheng L., Gao Q., Xiong Q., Zhang H., Wu M., Liang Y., Zhu F., Zhang Y., Zhang X., et al. The m(6)A methyltransferase METTL3 promotes bladder cancer progression via AFF4/NF-kappaB/MYC signaling network. Oncogene. 2019;38:3667–3680. doi: 10.1038/s41388-019-0683-z. [DOI] [PubMed] [Google Scholar]
- 18.De Jesus D.F., Zhang Z., Kahraman S., Brown N.K., Chen M., Hu J., Gupta M.K., He C., Kulkarni R.N. m(6)A mRNA methylation regulates human beta-cell biology in physiological states and in type 2 diabetes. Nat. Metab. 2019;1:765–774. doi: 10.1038/s42255-019-0089-9. [DOI] [PMC free article] [PubMed] [Google Scholar]
- 19.Li M., Zhao X., Wang W., Shi H., Pan Q., Lu Z., Perez S.P., Suganthan R., He C., Bjørås M., et al. Ythdf2-mediated m(6)A mRNA clearance modulates neural development in mice. Genome Biol. 2018;19:69. doi: 10.1186/s13059-018-1436-y. [DOI] [PMC free article] [PubMed] [Google Scholar]
- 20.Song H., Feng X., Zhang H., Luo Y., Huang J., Lin M., Jin J., Ding X., Wu S., Huang H., et al. METTL3 and ALKBH5 oppositely regulate m(6)A modification of TFEB mRNA, which dictates the fate of hypoxia/reoxygenation-treated cardiomyocytes. Autophagy. 2019;15:1419–1437. doi: 10.1080/15548627.2019.1586246. [DOI] [PMC free article] [PubMed] [Google Scholar]
- 21.Zhao B.S., Roundtree I.A., He C. Post-transcriptional gene regulation by mRNA modifications. Nat. Rev. Mol. Cell Biol. 2017;18:31–42. doi: 10.1038/nrm.2016.132. [DOI] [PMC free article] [PubMed] [Google Scholar]
- 22.Oberst A. MK2 balances inflammation and cell death. Nat. Cell Biol. 2017;19:1150–1152. doi: 10.1038/ncb3619. [DOI] [PubMed] [Google Scholar]
- 23.Ashkenazi A., Salvesen G. Regulated cell death: signaling and mechanisms. Annu. Rev. Cell Dev. Biol. 2014;30:337–356. doi: 10.1146/annurev-cellbio-100913-013226. [DOI] [PubMed] [Google Scholar]
- 24.Vandenabeele P., Galluzzi L., Vanden B.T., Kroemer G. Molecular mechanisms of necroptosis: an ordered cellular explosion. Nat. Rev. Mol. Cell Biol. 2010;11:700–714. doi: 10.1038/nrm2970. [DOI] [PubMed] [Google Scholar]
- 25.Chen A., Feng Y., Lai H., Ju W., Li Z., Li Y., Wang A., Hong Q., Zhong F., Wei C., et al. Soluble RARRES1 induces podocyte apoptosis to promote glomerular disease progression. J. Clin. Invest. 2020;130:5523–5535. doi: 10.1172/JCI140155. [DOI] [PMC free article] [PubMed] [Google Scholar]
- 26.Varfolomeev E., Vucic D. Intracellular regulation of TNF activity in health and disease. Cytokine. 2018;101:26–32. doi: 10.1016/j.cyto.2016.08.035. [DOI] [PubMed] [Google Scholar]
- 27.Zong X., Zhao J., Wang H., Lu Z., Wang F., Du H., Wang Y. Mettl3 deficiency sustains long-chain fatty acid absorption through suppressing Traf6-dependent inflammation response. J. Immunol. 2019;202:567–578. doi: 10.4049/jimmunol.1801151. [DOI] [PMC free article] [PubMed] [Google Scholar]
- 28.Liu Q., Li M., Jiang L., Jiang R., Fu B. METTL3 promotes experimental osteoarthritis development by regulating inflammatory response and apoptosis in chondrocyte. Biochem. Biophys. Res. Commun. 2019;516:22–27. doi: 10.1016/j.bbrc.2019.05.168. [DOI] [PubMed] [Google Scholar]
- 29.Wen L., Sun W., Xia D., Wang Y., Li J., Yang S. The m6A methyltransferase METTL3 promotes LPS-induced microglia inflammation through TRAF6/NF-kappaB pathway. Neuroreport. 2020 doi: 10.1097/WNR.0000000000001550. [DOI] [PubMed] [Google Scholar]
- 30.Engelman D.T., Crisafi C., Germain M., Greco B., Nathanson B.H., Engelman R.M., Shwann T.A. Using urinary biomarkers to reduce acute kidney injury following cardiac surgery. J. Thorac. Cardiovasc. Surg. 2020;160:1235–1246.e2. doi: 10.1016/j.jtcvs.2019.10.034. [DOI] [PubMed] [Google Scholar]
- 31.Johnson A., Zager R.A. Mechanisms underlying increased TIMP2 and IGFBP7 urinary excretion in experimental AKI. J. Am. Soc. Nephrol. 2018;29:2157–2167. doi: 10.1681/ASN.2018030265. [DOI] [PMC free article] [PubMed] [Google Scholar]
- 32.Liu M., Liang K., Zhen J., Zhou M., Wang X., Wang Z., Wei X., Zhang Y., Sun Y., Zhou Z., et al. Sirt6 deficiency exacerbates podocyte injury and proteinuria through targeting Notch signaling. Nat. Commun. 2017;8:413. doi: 10.1038/s41467-017-00498-4. [DOI] [PMC free article] [PubMed] [Google Scholar]
- 33.Niranjan T., Bielesz B., Gruenwald A., Ponda M.P., Kopp J.B., Thomas D.B., Susztak K. The Notch pathway in podocytes plays a role in the development of glomerular disease. Nat. Med. 2008;14:290–298. doi: 10.1038/nm1731. [DOI] [PubMed] [Google Scholar]
- 34.Sun J., Zhao F., Zhang W., Lv J., Lv J., Yin A. BMSCs and miR-124a ameliorated diabetic nephropathy via inhibiting notch signalling pathway. J. Cell Mol. Med. 2018;22:4840–4855. doi: 10.1111/jcmm.13747. [DOI] [PMC free article] [PubMed] [Google Scholar]
- 35.Zhou X., Zang X., Guan Y., Tolbert T., Zhao T.C., Bayliss G., Zhuang S. Targeting enhancer of zeste homolog 2 protects against acute kidney injury. Cell Death Dis. 2018;9:1067. doi: 10.1038/s41419-018-1012-0. [DOI] [PMC free article] [PubMed] [Google Scholar]
- 36.Tan R.J., Liu Y. Matrix metalloproteinases in kidney homeostasis and diseases. Am. J. Physiol. Ren. Physiol. 2012;302:F1351–F1361. doi: 10.1152/ajprenal.00037.2012. [DOI] [PMC free article] [PubMed] [Google Scholar]
- 37.Chernov A.V., Sounni N.E., Remacle A.G., Strongin A.Y. Epigenetic control of the invasion-promoting MT1-MMP/MMP-2/TIMP-2 axis in cancer cells. J. Biol. Chem. 2009;284:12727–12734. doi: 10.1074/jbc.M900273200. [DOI] [PMC free article] [PubMed] [Google Scholar]
- 38.Luo W., Yu Y., Wang H., Liu K., Wang Y., Huang M., Xuan C., Li Y., Qi J. Up-regulation of MMP-2 by histone H3K9 beta-hydroxybutyrylation to antagonize glomerulosclerosis in diabetic rat. Acta Diabetol. 2020;57:1501–1509. doi: 10.1007/s00592-020-01552-2. [DOI] [PubMed] [Google Scholar]
- 39.McLennan S.V., Martell S.Y., Yue D.K. High glucose concentration inhibits the expression of membrane type metalloproteinase by mesangial cells: possible role in mesangium accumulation. Diabetologia. 2000;43:642–648. doi: 10.1007/s001250051353. [DOI] [PubMed] [Google Scholar]
- 40.Jin G., Zhang F., Chan K.M., Xavier W.H., Liu B., Cheah K.S., Liu X., Mauch C., Zhou Z. MT1-MMP cleaves Dll1 to negatively regulate Notch signalling to maintain normal B-cell development. EMBO J. 2011;30:2281–2293. doi: 10.1038/emboj.2011.136. [DOI] [PMC free article] [PubMed] [Google Scholar]
- 41.Jiang Z., Zhou J., Qin X., Zheng H., Gao B., Liu X., Jin G., Zhou Z. MT1-MMP deficiency leads to defective ependymal cell maturation, impaired ciliogenesis, and hydrocephalus. JCI Insight. 2020;5:e132782. doi: 10.1172/jci.insight.132782. [DOI] [PMC free article] [PubMed] [Google Scholar]
Associated Data
This section collects any data citations, data availability statements, or supplementary materials included in this article.