Abstract
This study evaluates DC-pulse nitrogen atmospheric-pressure-plasma-jet processed carbon nanotube (CNT)–reduced graphene oxide (rGO) nanocomposites for gel-electrolyte supercapacitor applications. X-ray photoelectron spectroscopy (XPS) indicates decreased oxygen content (mainly, C–O bonding content) after nitrogen APPJ processing owing to the oxidation and vaporization of ethyl cellulose. Nitrogen APPJ processing introduces nitrogen doping and improves the hydrophilicity of the CNT–rGO nanocomposites. Raman analysis indicates that nitrogen APPJ processing introduces defects and/or surface functional groups on the nanocomposites. The processed CNT–rGO nanocomposites on carbon cloth are applied to the electrodes of H2SO4–polyvinyl alcohol (PVA) gel-electrolyte supercapacitors. The best achieved specific (areal) capacitance is 93.1 F g−1 (9.1 mF cm−2) with 15 s APPJ-processed CNT–rGO nanocomposite electrodes, as evaluated by cyclic voltammetry under a potential scan rate of 2 mV s−1. The addition of rGOs in CNTs in the nanoporous electrodes improves the supercapacitor performance.
This study demonstrates ultrafast (15 s) atmospheric-pressure-plasma-jet (APPJ) processed CNT–rGO nanocomposite gel-electrolyte supercapacitors.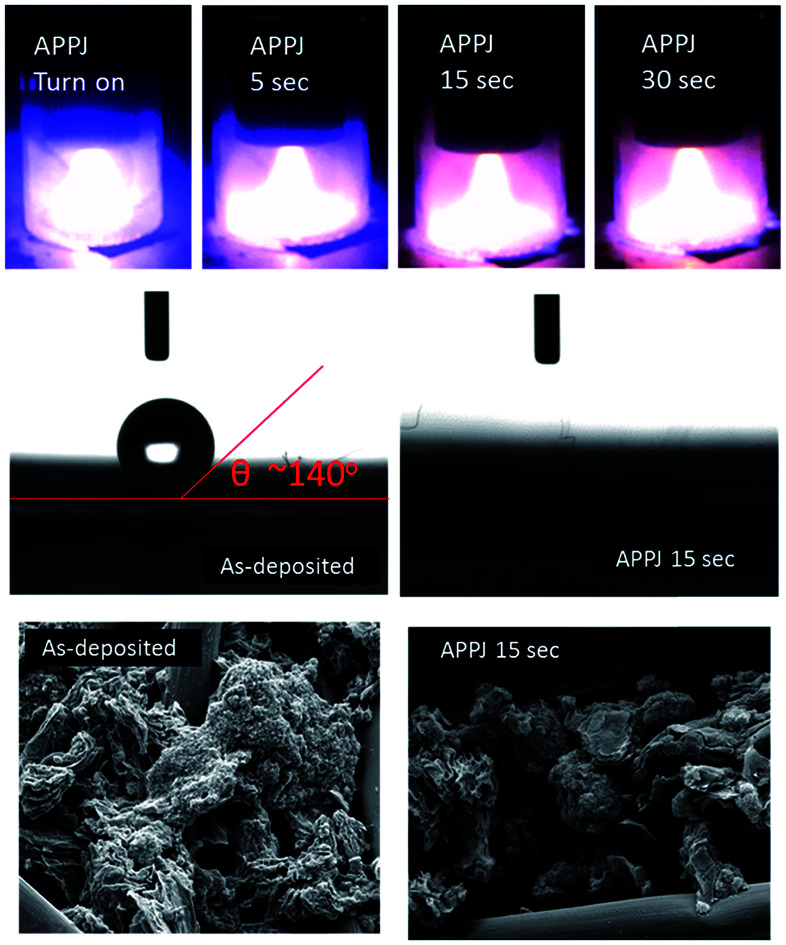
Introduction
Atmospheric-pressure plasma (APP) technology can be operated at atmospheric pressure without using vacuum chambers and pumps that are costly and require routine maintenance. Therefore, it is considered a cost-effective technology. Typical APP technology includes dielectric barrier discharge (DBD), corona discharge, and atmospheric-pressure plasma jet (APPJ).1–3 Thermal plasma jets are operated in local thermal equilibrium (LTE), that is, the equilibrium between the electron temperature and the heavy particle temperature. On the other hand, non-LTE plasma jets or cold plasma jets have a heavy particle temperature ranged of 300–1000 K, which is lower than the electron temperature by at least one order of magnitude. APPJ is operated in open ambient at moderate gas temperatures. This high-reactivity plasma chemistry has attracted much research attention and has resulted in various practical applications. It produces charge particles, neutral metastable species, radicals, and ultraviolet (UV) radiation.4 Owing to these features, APP technology has been applied to food and agriculture processing,5–7 biomedicine,8,9 and materials processing.10–15
Batteries usually possess high energy density but low power density; on the other hand, supercapacitor is the other way around. There have been some attempts to design cells that compromise or keep both advantages.16 Supercapacitors are passive electrochemical energy storage devices that have high power density and long cyclic lifetime. Electrode materials are essential for high-performance supercapacitors. Many studies have focused on developing new electrode materials with economic processing techniques.17–21 Two main charge storage mechanisms are typically involved in supercapacitors: faradaic pseudocapacitance and/or electrical double layer capacitance (EDLC). Pseudocapacitance results from reversible redox reactions on electrode material surfaces, and it usually occurs in metal oxides and conductive polymers.17,22–29 EDLC originates from the charge accumulation at electrolyte/electrode, and it usually occurs in carbonaceous electrode materials.30–33 CNTs has been used for supercapacitors with EDLC due to its high electrical conductivity and superior mechanical elasticity of the tube-shaped structures.34,35 It is recommended that CNTs can be used as a great support for other active materials. Graphene is also introduced to electrochemical devices because of its outstanding electrical and thermal properties. By interlayering CNTs and graphenes, the supercapacitor performance can be greatly improved.36 The high specific surface area and chemical stability of graphene can enhance the supercapacitor performance, while CNTs provide a tubular network for graphene.37 Graphene and CNT composites also have been applied as transparent conductors.38
DC-pulse nitrogen APPJs operated at a substrate temperature of 400–800 °C, which is self-sustained by the plasma jet. They show high reactivity with carbonaceous materials such as reduced graphene oxide (rGO) nanoflakes, carbon nanotubes (CNTs), fibers of carbon cloth, and graphite felts.10,39–45 Strong –CN violet emissions are identified in plasma during the early stage of APPJ processing of carbonaceous materials. This validates the occurrence of vigorous interactions between nitrogen reactive plasma species and carbon-based materials. In addition, the rapid etching of polyimide has been realized using non-LTE APPJs; reactive oxygen species are considered effective for this rapid etching process.46,47 Ultrafast mask-free etching of CNT micro-supercapacitors has also been achieved; in this process, ozone generated by the APPJ serves as the main oxidants.48 In this study, we investigate CNT–rGO nanocomposite gel-electrolyte supercapacitors processed by DC-pulse nitrogen APPJs. Nitrogen APPJs quickly oxidized/vaporized ethyl cellulose binders to form nanoporous CNT–rGO nanocomposites. Owing to the synergetic effects of the reactive nitrogen plasma species and heat, the optimal processing time is merely 15 s. In comparison to our previous study with CNT supercapacitors,39 the addition of rGO into CNT electrodes improves supercapacitor performance.
Experimental details
Preparation of CNT–rGO pastes for screen printing
0.05 g of CNTs (purity: >98%, diameter: 5–20 nm, length: >1 μm, Golden Innovation Business Co., Ltd.), 0.05 g of rGOs (purity 99%, thickness < 5 nm, sheet diameter: 0.1–5 μm, Golden Innovation Business Co., Ltd.), 1.75 g of 10 wt% ethyl cellulose (5–15 mPa s, #46070, Fluka) ethanoic solution, 2.25 g of 10 wt% ethyl cellulose (30–50 mPa s, #46080, Fluka) ethanoic solution, 3.245 g of terpineol (anhydrous, #86480, Fluka), and 1.5 g of ethanol were mixed and stirred at room temperature for 24 h using a magnetic stirrer. Then, 4 ml of this mixture was extracted and condensed at 55 °C for 7 min using a rotovap.
Fabrication of CNT–rGO nanocomposite electrodes on carbon cloth
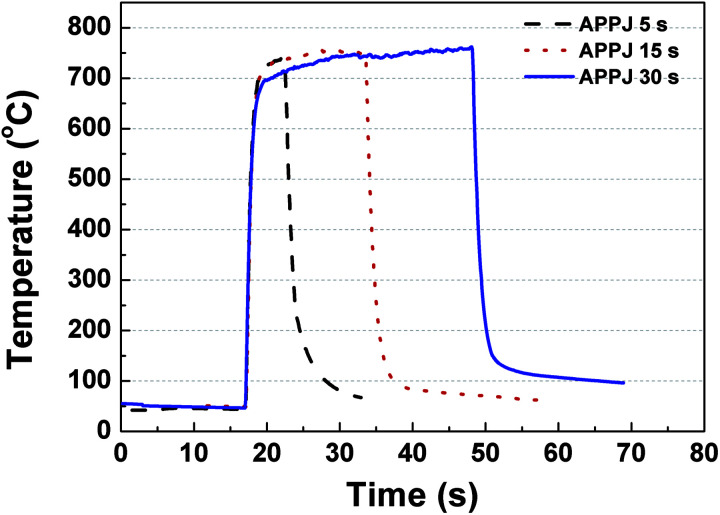
CNT–rGO pastes were screen-printed onto carbon cloth, following which a DC-pulse nitrogen APPJ was applied to process the printed pastes for 0/5/15/30 s. The APPJ operations have been described in our previous study.49Fig. 1 shows the substrate temperature evolution as monitored using a K-type thermocouple equipped with a data acquisition device (USB-6221, National Instruments) connected to a computer. After the APPJ was turned on, the substrate temperature increased rapidly to ∼700 °C and then gradually reached a steady state. The temperature decreased dramatically after the APPJ was turned off. During APPJ processing, the optical emission spectra (OES) were monitored using a spectrometer (Ocean Optics, Flame).
Fig. 1. Substrate temperature evolution under APPJ operation.
Materials characterization of CNT–rGO nanocomposites on carbon cloth
Scanning electron microscopy (SEM, Nova NanoSEM 230, FEI) was used to inspect the CNT–rGO nanocomposites on carbon cloth. X-ray photoelectron spectroscopy (XPS, VGS Thermo Scientific) was used for surface chemical analyses. An electron probe X-ray microanalyzer (EPMA, JEOL JXA-8200) was used for elemental chemical composition analyses. Raman spectroscopy (Renishaw 1000B) was used to inspect the degrees of disordering, defect, and impurity of the CNT–rGO nanocomposites. A goniometer (Model 100SB, Sindatek Instruments Co., Ltd.) was used to measure the water contact angles of the CNT–rGO nanocomposites before/after APPJ processing.
Fabrication of gel-electrolyte supercapacitors
APPJ-processed CNT–rGO nanocomposites on carbon cloth were used as the electrodes of a symmetric supercapacitor. A gel-electrolyte was prepared by mixing 15 ml of 1 M H2SO4 and 1.5 g of polyvinyl alcohol (PVA) at 80 °C for 4 h. The gel-electrolyte was spread onto two pieces of APPJ-processed CNT–rGO nanocomposites on carbon cloth and naturally dried for 24 h. Two pieces of gel-coated electrodes were then pressed together on the gel sides to form a sandwich-type supercapacitor.
Characterization of supercapacitors
Cyclic voltammetry (CV) and CV cycling stability tests with a potential scan window of 0–0.8 V were performed using an electrochemical workstation (Zahner Zennium) by the two-electrode method (CNT-coated carbon cloth electrodes).
Results and discussion
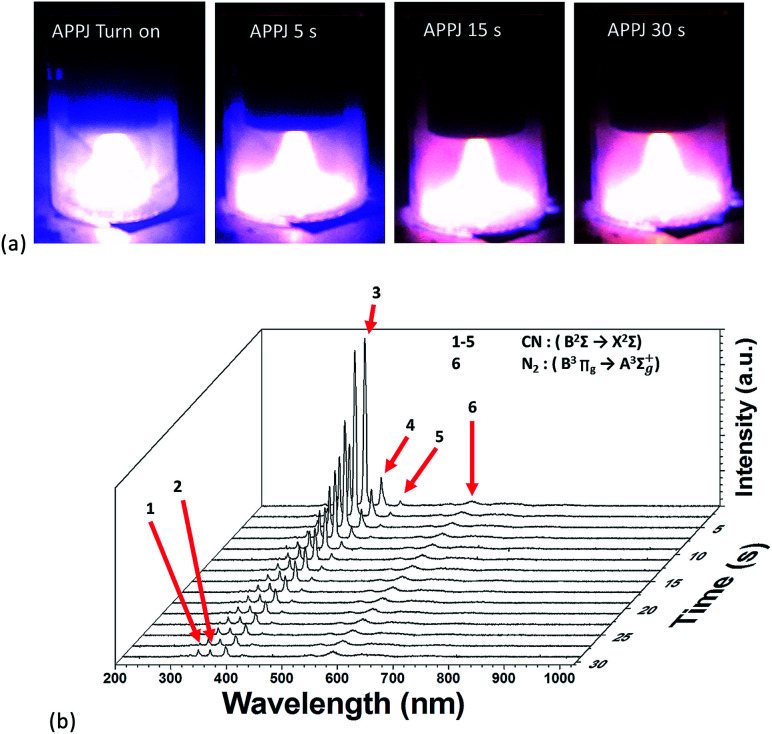
Fig. 2(a) shows a photograph of the APPJ during APPJ processing. After the APPJ was turned on, its color was blue-purple; then, the color quickly turned pink after a short duration. Fig. 2(b) shows the evolution of OES during APPJ processing. The intensity of CN emissions (359, 388, 418, and 453 nm) increased rapidly and then decreased with the APPJ processing time. After a certain period, some remnant N2 2nd positive emissions that overlapped with the CN emissions were present. The other remaining emissions were persistent N2 1st positive emission (B3Πg → A3Σ+u) at wavelengths longer than 530 nm. This suggested the violent reaction of carbonaceous materials with the reactive nitrogen species in plasma. Molecules containing –CN bonds were excited and then relaxed to emit characteristic optical spectra.
Fig. 2. (a) Photographs of APPJs during APPJ processing on screen-printed CNT–rGO nanocomposites. (b) Evolution of OES during APPJ processing on screen-printed CNT–rGO nanocomposites.
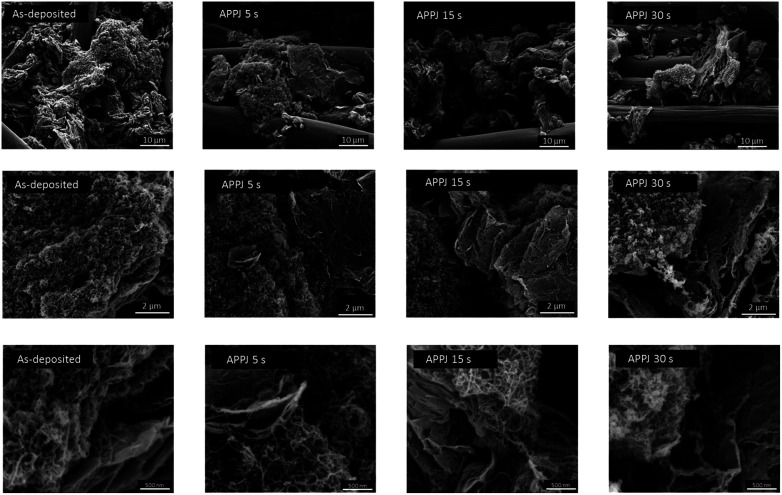
Fig. 3 shows SEM images of as-deposited CNT–rGO nanocomposites (without APPJ-calcination) and CNT–rGO nanocomposites processed by APPJs for various durations. The large-diameter (∼10 μm) cylinder-shaped materials are carbon cloth fibers. CNTs and rGO nanoflakes form nanoporous composite structure.
Fig. 3. SEM images of as-deposited CNT–rGO nanocomposites (without APPJ-calcination) and CNT–rGO nanocomposites processed by APPJ for various durations.
Fig. 4 shows the water contact angle measurement results of the screen-printed CNT–rGO nanocomposites before/after APPJ processing. Without APPJ processing, the screen-printed CNT–rGO shows a water contact angle as large as ∼140°. After APPJ processing for 5 s, the screen-printed CNT–rGO and carbon cloth fibers became highly hydrophilic, and testing water droplets completely penetrated the nanopores.
Fig. 4. Water contact angle of screen-printed CNT–rGO nanocomposites before/after APPJ processing.
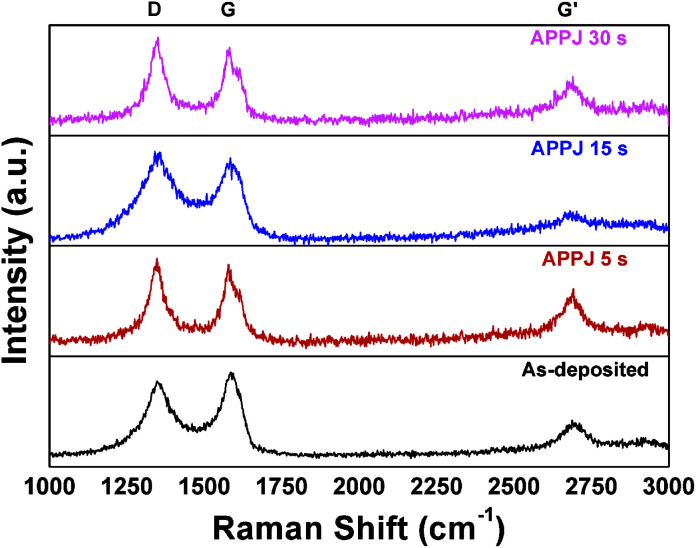
Fig. 5 shows the Raman spectra of the CNT–rGO nanocomposites processed by APPJ for various durations. The D-band (∼1350 cm−1), G-band (∼1580 cm−1), and G′-band (∼2700 cm−1) are identified in the spectra.50–53 The stretching of the C–C bond in graphitic materials contributes to the G-band featuring an sp2 carbon system.51 The D-band typically indicates carbonaceous impurities with sp3 bonding or broken sp2 bonds.50,51 The G′-band is a second-order two-phonon process corresponding to long-range ordering in a sample.50,51 The intensity ratio of the D-band and G-band (ID/IG) is frequently used for purity or defect assessment.50,53ID/IG was 0.92 before APPJ processing, and this ratio increased to 1.07 after APPJ processing. This suggests that reactive species in nitrogen APPJs interact with the CNT–rGO nanocomposites and introduce some defects or surface functional groups to the nanocomposites.
Fig. 5. Raman spectra of CNT–rGO nanocomposites before/after APPJ processing.
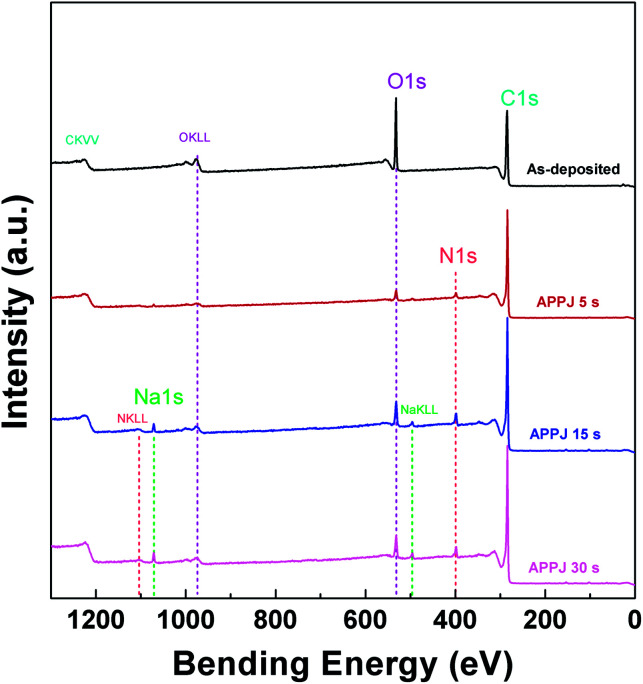
Fig. 6 shows a wide scan of the CNT–rGO nanocomposites before/after APPJ processing. Typical C1s and O1s binding energy peaks are present. These are typical elemental compositions of CNT, rGO, and binders (ethyl cellulose, terpineol, and ethanol). After APPJ processing, N1s and Na1s signals started to appear. Table 1 shows the elemental composition analyzed from XPS and EPMA. EPMA also shows Na signals from all samples including those without APPJ processing. This Na contamination could result from the APPJ, environment, or personal handling. The appearance of the N1s signal indicates nitrogen doping on CNT–rGO nanocomposites and carbon cloth fibers introduced by nitrogen APPJ processing. The overall oxygen content also significantly decreased after APPJ processing, indicating the oxidation and vaporization of terpineol and ethyl cellulose after APPJ processing. As the APPJ processing time increased, the oxygen content recovered slightly, possibly owing to the oxidation process caused by the reaction among reactive plasma species in nitrogen APPJ, environmental oxygen, and the materials.
Fig. 6. XPS wide scan of CNT–rGO nanocomposites on carbon cloth.
C, N, O, and Na relative compositions as measured using XPS and EPMA.
| at% | XPS | EPMA | ||||||
|---|---|---|---|---|---|---|---|---|
| C | N | O | Na | C | N | O | Na | |
| As-deposited | 74.70 | ∼0 | 25.30 | ∼0 | 99.11 | ∼0 | 0.556 | 0.3305 |
| APPJ 5 s | 89.82 | 4.227 | 5.461 | 0.487 | 95.06 | 4.394 | 0.174 | 0.3640 |
| APPJ 15 s | 83.87 | 5.996 | 9.119 | 1.012 | 96.28 | 3.307 | 0.157 | 0.2485 |
| APPJ 30 s | 85.05 | 5.236 | 8.392 | 1.313 | 95.75 | 3.853 | 0.145 | 0.2466 |
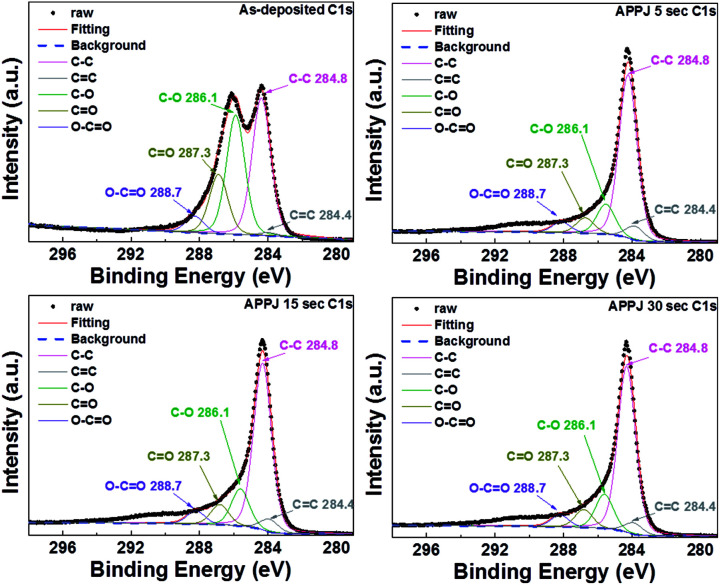
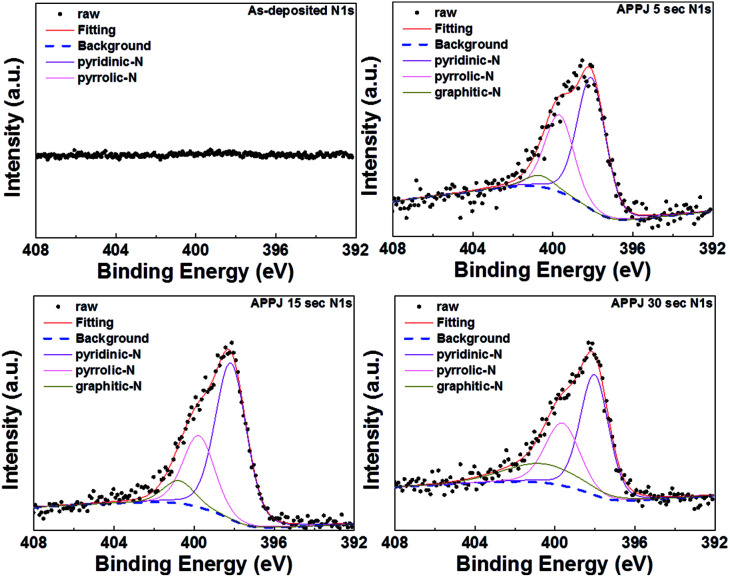
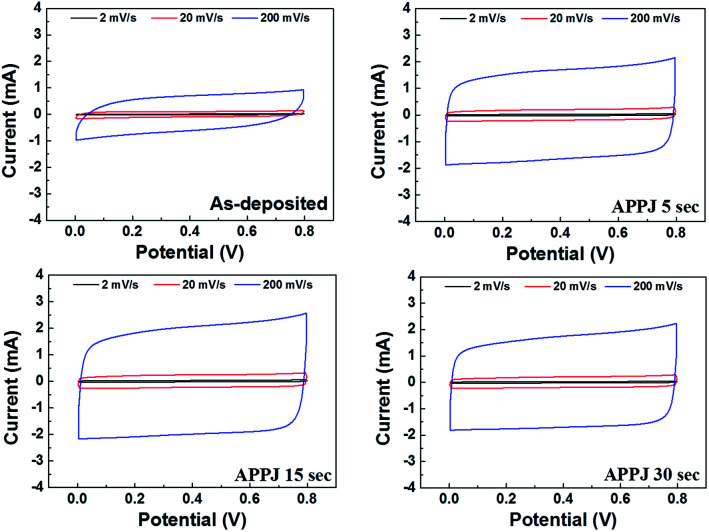
Apparent shape changes of XPS C1s and N1s fine scan spectra were observed for CNT–rGO nanocomposites with/without APPJ processing. Fig. 7 shows the XPS C1s fine scan spectra. The as-deposited CNT–rGO (without APPJ processing) shows a strong C–O peak at ∼286.1 eV. This originates mainly from the ethyl cellulose.54 The C–O peak decreased dramatically after APPJ processing, indicating the removal of a significant amount of ethyl cellulose by the nitrogen APPJ. The C–C content was mainly contributed by CNTs, rGOs, and the carbon cloth fibers. Fig. 8 shows the XPS N1s fine scan spectra of the CNT–rGO nanocomposite before/after APPJ processing. Without APPJ processing, no N1s signal was observed. After APPJ processing, the N1s signal was noted. This suggests that nitrogen APPJ resulted in the nitrogen doping on CNTs, rGOs, and/or carbon cloth fibers. Nitrogen doping in the carbon-based material was considered to benefit the capacitive performance of the supercapacitor because of the introduction of pseudocapacitance.20,55,56 However, pseudocapacitance effect is not noted in our samples; the redox peaks are not observed in the CV curves of Fig. 9. The introduction of nitrogen doping in carbon materials could also improve hydrophilicity.55 The improvement of hydrophilicity could facilitate the contact between the electrolyte and the nanoporous electrode materials, leading to improved capacitance.
Fig. 7. XPS C1s fine scan spectra of CNT–rGO nanocomposites before/after APPJ processing.
Fig. 8. XPS N1s fine scan spectra of CNT–rGO nanocomposites before/after APPJ processing.
Fig. 9. CV curves of supercapacitors with electrodes processed by APPJ for various durations.
Fig. 9 shows the CV results obtained by characterizing the supercapacitors. The specific capacitance can be calculated based on the following equation.17
 |
1 |
where Csp is the specific capacitance; m, the mass of the printed material; v, the potential scan rate; Vb−Va, the potential scan window; and I(V), the response current at voltage V under CV operation. The areal capacitance can be obtained by replacing m with the electrode apparent area A. Table 2 lists the calculated capacitance values based on Fig. 9. APPJ processing significantly improved the performance of supercapacitors. The capacitance value reached a maximum value of 93.1 F g−1 (9.10 mF cm−2) with 15 s APPJ processing. APPJ processing can remove the nonconductive ethyl cellulose binders, thereby improving the capacitance. Furthermore, the improved wettability may facilitate the penetration of the gel-electrolyte into nanopores of the nanocomposites and increase the contact area between the electrolyte and the electrode materials, thereby improving the performance of supercapacitors. In comparison with APPJ-processed CNT supercapacitors,40 the addition of rGOs apparently improved the capacitance values, possibly owing to the larger surface-to-volume ratio of rGO nanoflakes compared with that of CNTs.
Capacitance values evaluated by CV under potential scan rates of 2, 20, and 200 mV s−1.
| Scan rate (mV s−1) | Specific capacitance (F g−1) | Areal capacitance (mF cm−2) | ||||||
|---|---|---|---|---|---|---|---|---|
| As-deposited | APPJ 5 s | APPJ 15 s | APPJ 30 s | As-deposited | APPJ 5 s | APPJ 15 s | APPJ 30 s | |
| 2 | 49.4 | 86.8 | 93.1 | 83.5 | 4.45 | 7.97 | 9.10 | 7.73 |
| 20 | 35.9 | 70.0 | 77.6 | 69.7 | 3.23 | 6.43 | 7.58 | 6.46 |
| 200 | 21.6 | 58.0 | 65.4 | 59.3 | 1.94 | 5.33 | 6.40 | 5.49 |
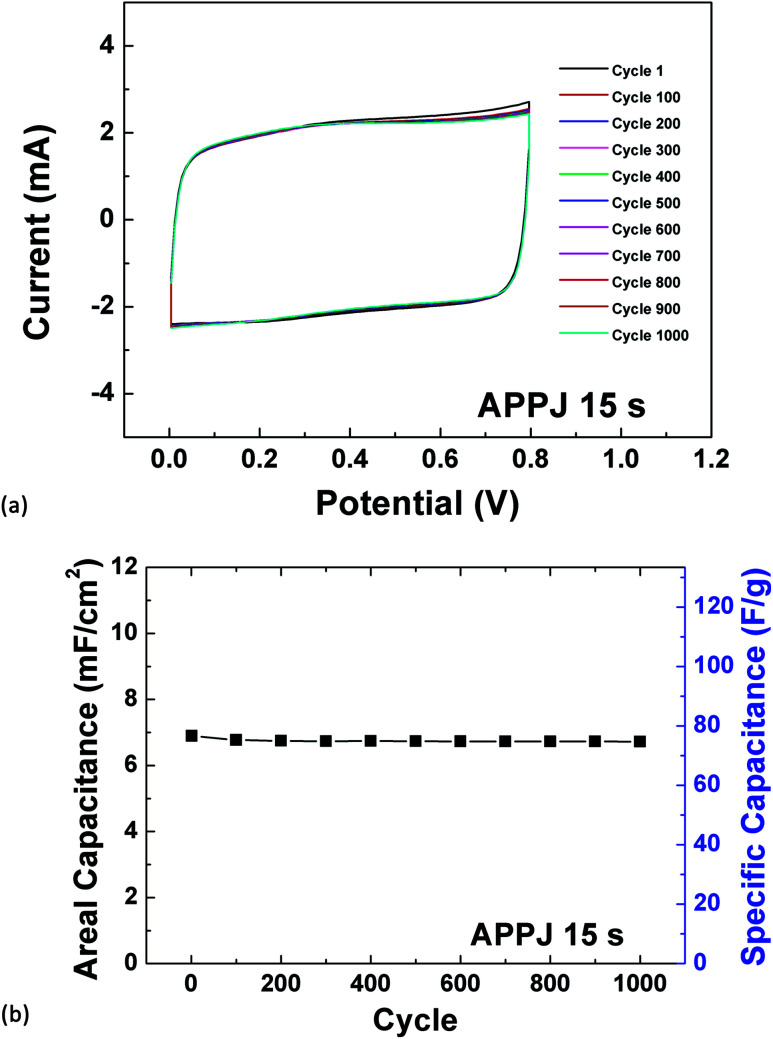
The stability of the best achieved supercapacitor with 15 s APPJ processing was evaluated by cycling CV tests under a potential scan rate of 200 mV s−1. Fig. 10(a) shows the cycling CV curves spaced by 100 cycles. The CV curves almost overlap except for the curves of cycle 1 and cycle 100. Fig. 10(b) shows the capacitance value versus cycle number. The capacitance retention rate is 97.46% after 1000 CV cycling tests. The stability is comparable to that of APPJ-processed CNT supercapacitors whose capacitance retention rate is 94.7% after 1000 CV cycles.
Fig. 10. (a) CV cycling stability test evaluated under a potential scan rate of 200 mV s−1. (b) Capacitance versus cycle number.
Summary
We evaluate CNT–rGO nanocomposite gel-electrolyte supercapacitors processed by DC-pulse nitrogen APPJs. XPS analyses indicate that APPJ processing results in the removal of ethyl cellulose and introduction of nitrogen doping. The hydrophilicity is also significantly improved by the nitrogen APPJ processing; this facilitates the penetration of the gel-electrolyte into nanopores to improve the contact between the electrolyte and the electrode materials, thereby improving the supercapacitor performance. Raman analyses suggest the introduction of defects and/or surface functional groups on CNT–rGO nanocomposites and carbon cloth fibers. The best achieved specific (areal) capacitance is 93.1 F g−1 (9.1 mF cm−2) with 15 s APPJ-processed CNT–rGO nanocomposite electrodes, as evaluated by CV under a potential scan rate of 2 mV s−1. Mixing rGOs into CNTs in the nanoporous electrodes improves the supercapacitor performance.
Conflicts of interest
There are no conflicts to declare.
Supplementary Material
Acknowledgments
The authors gratefully acknowledge the funding support from the Ministry of Science and Technology of Taiwan under grant nos. MOST 105-2221-E-002-047-MY3 and MOST 106-2221-E-002-193-MY2. A cleanroom facility was provided by the Nano-Electro-Mechanical-Systems (NEMS) Research Center at National Taiwan University. We would also like to thank Mr Chung-Yuan Kao and Ms. Yuan-Tzu Lee of the Instrumentation Center at National Taiwan University for their assistance with the EPMA and SEM operations, respectively.
Notes and references
- Schutze A. Jeong J. Y. Babayan S. E. Park J. Selwyn G. S. Hicks R. F. IEEE Trans. Plasma Sci. 1998;26:1685–1694. doi: 10.1109/27.747887. [DOI] [Google Scholar]
- Laroussi M. Akan T. Plasma Processes Polym. 2007;4:777–788. doi: 10.1002/ppap.200700066. [DOI] [Google Scholar]
- Tendero C. Tixier C. Tristant P. Desmaison J. Leprince P. Spectrochim. Acta, Part B. 2006;61:2–30. doi: 10.1016/j.sab.2005.10.003. [DOI] [Google Scholar]
- Winter J. Brandenburg R. Weltmann K. D. Plasma Sources Sci. Technol. 2015:24. [Google Scholar]
- Surowsky B. Schluter O. Knorr D. Food Eng. Rev. 2015;7:82–108. doi: 10.1007/s12393-014-9088-5. [DOI] [Google Scholar]
- Randeniya L. K. de Groot G. J. J. B. Plasma Processes Polym. 2015;12:608–623. doi: 10.1002/ppap.201500042. [DOI] [Google Scholar]
- Zong Z. C. Zhou R. W. Liu D. P. Song Y. Niu J. H. Plasma Processes Polym. 2016;13:402–409. doi: 10.1002/ppap.201500067. [DOI] [Google Scholar]
- Park G. Y. Park S. J. Choi M. Y. Koo I. G. Byun J. H. Hong J. W. Sim J. Y. Collins G. J. Lee J. K. Plasma Sources Sci. Technol. 2012:21. [Google Scholar]
- Gaunt L. F. Beggs C. B. Georghiou G. E. IEEE Trans. Plasma Sci. 2006;34:1257–1269. doi: 10.1109/TPS.2006.878381. [DOI] [Google Scholar]
- Chen J. Z. Liao W. Y. Hsieh W. Y. Hsu C. C. Chen Y. S. J. Power Sources. 2015;274:894–898. doi: 10.1016/j.jpowsour.2014.10.097. [DOI] [Google Scholar]
- Homola T. Dzik P. Vesely M. Kelar J. Cernak M. Weiter M. ACS Appl. Mater. Interfaces. 2016;8:33562–33571. doi: 10.1021/acsami.6b09556. [DOI] [PubMed] [Google Scholar]
- Bonova L. Zahoranova A. Kovacik D. Zahoran M. Micusik M. Cernak M. Appl. Surf. Sci. 2015;331:79–86. doi: 10.1016/j.apsusc.2015.01.030. [DOI] [Google Scholar]
- Penkov O. V. Khadem M. Lim W. S. Kim D. E. J. Coat. Technol. Res. 2015;12:225–235. doi: 10.1007/s11998-014-9638-z. [DOI] [Google Scholar]
- Chou C. Y. Chang H. M. Liu H. W. Yang Y. J. Hsu C. C. Cheng I. C. Chen J. Z. RSC Adv. 2015;5:45662–45667. doi: 10.1039/C5RA05014F. [DOI] [Google Scholar]
- Wu T. J. Chou C. Y. Hsu C. M. Hsu C. C. Chen J. Z. Cheng I. C. RSC Adv. 2015;5:99654–99657. doi: 10.1039/C5RA21669A. [DOI] [Google Scholar]
- Jiang H. Zhang H. X. Fu Y. Guo S. J. Hu Y. J. Zhang L. Liu Y. Liu H. L. Li C. Z. ACS Nano. 2016;10:1648–1654. doi: 10.1021/acsnano.5b07367. [DOI] [PubMed] [Google Scholar]
- Gund G. S. Dubal D. P. Chodankar N. R. Cho J. Y. Gomez-Romero P. Park C. Lokhande C. D. Sci. Rep. 2015;5:12454. doi: 10.1038/srep12454. [DOI] [PMC free article] [PubMed] [Google Scholar]
- Xu C. H. Shen P. Y. Chiu Y. F. Yeh P. W. Chen C. C. Chen L. C. Hsu C. C. Cheng I. C. Chen J. Z. J. Alloys Compd. 2016;676:469–473. doi: 10.1016/j.jallcom.2016.03.185. [DOI] [Google Scholar]
- Liao C. Y. Kuok F. H. Chen C. W. Hsu C. C. Chen J. Z. Journal of Energy Storage. 2017;11:237–241. doi: 10.1016/j.est.2017.03.007. [DOI] [Google Scholar]
- Gao Z. Liu X. Chang J. Wu D. Xu F. Zhang L. Du W. Jiang K. J. Power Sources. 2017;337:25–35. doi: 10.1016/j.jpowsour.2016.10.114. [DOI] [Google Scholar]
- Chen Q. Li X. M. Zang X. B. Cao Y. C. He Y. J. Li P. X. Wang K. L. Wei J. Q. Wu D. H. Zhu H. W. RSC Adv. 2014;4:36253–36256. doi: 10.1039/C4RA05553E. [DOI] [Google Scholar]
- Moussa M. El-kady M. F. Zhao Z. Majewski P. Ma J. Nanotechnology. 2016;27:442001. doi: 10.1088/0957-4484/27/44/442001. [DOI] [PubMed] [Google Scholar]
- Yang C. Zhang L. L. Hu N. T. Yang Z. Wei H. Xu Z. C. J. Wang Y. Y. Zhang Y. F. Appl. Surf. Sci. 2016;379:206–212. doi: 10.1016/j.apsusc.2016.04.058. [DOI] [Google Scholar]
- Chen N. L. Ren Y. P. Kong P. P. Tan L. Feng H. X. Luo Y. C. Appl. Surf. Sci. 2017;392:71–79. doi: 10.1016/j.apsusc.2016.07.168. [DOI] [Google Scholar]
- Song Z. X. Zhang Y. J. Liu W. Zhang S. Liu G. C. Chen H. Y. Qiu J. S. Electrochim. Acta. 2013;112:120–126. doi: 10.1016/j.electacta.2013.08.155. [DOI] [Google Scholar]
- Aadil M. Shaheen W. Warsi M. F. Shahid M. Khan M. A. Ali Z. Haider S. Shakir I. J. Alloys Compd. 2016;689:648–654. doi: 10.1016/j.jallcom.2016.08.029. [DOI] [Google Scholar]
- Zhang Y. Zu L. Lian H. Q. Hu Z. K. Jiang Y. H. Liu Y. Wang X. D. Cui X. G. J. Alloys Compd. 2017;694:136–144. doi: 10.1016/j.jallcom.2016.09.302. [DOI] [Google Scholar]
- Kore R. M. Lokhande B. J. J. Alloys Compd. 2017;725:129–138. doi: 10.1016/j.jallcom.2017.07.145. [DOI] [Google Scholar]
- Qin Q. Q. Du X. D. Xu C. X. Huang S. G. Wang W. J. Zhang Y. Yan J. Liu J. Q. Wu Y. C. J. Electrochem. Soc. 2017;164:A1952–A1957. doi: 10.1149/2.0771709jes. [DOI] [Google Scholar]
- Zhang L. L. Zhao X. Chem. Soc. Rev. 2009;38:2520–2531. doi: 10.1039/B813846J. [DOI] [PubMed] [Google Scholar]
- Jeong H. M. Lee J. W. Shin W. H. Choi Y. J. Shin H. J. Kang J. K. Choi J. W. Nano Lett. 2011;11:2472–2477. doi: 10.1021/nl2009058. [DOI] [PubMed] [Google Scholar]
- Zhu Y. W. Murali S. Stoller M. D. Ganesh K. J. Cai W. W. Ferreira P. J. Pirkle A. Wallace R. M. Cychosz K. A. Thommes M. Su D. Stach E. A. Ruoff R. S. Science. 2011;332:1537–1541. doi: 10.1126/science.1200770. [DOI] [PubMed] [Google Scholar]
- Wang L. Sun L. Tian C. Tan T. Mu G. Zhang H. Fu H. RSC Adv. 2012;2:8359–8367. doi: 10.1039/C2RA20845H. [DOI] [Google Scholar]
- Obreja V. V. Phys. E. 2008;40:2596–2605. doi: 10.1016/j.physe.2007.09.044. [DOI] [Google Scholar]
- Baughman R. H. Zakhidov A. A. De Heer W. A. Science. 2002;297:787–792. doi: 10.1126/science.1060928. [DOI] [PubMed] [Google Scholar]
- Jiang H. Lee P. S. Li C. Energy Environ. Sci. 2013;6:41–53. [Google Scholar]
- Yu D. Dai L. J. Phys. Chem. Lett. 2009;1:467–470. doi: 10.1021/jz9003137. [DOI] [Google Scholar]
- Tung V. C. Chen L.-M. Allen M. J. Wassei J. K. Nelson K. Kaner R. B. Yang Y. Nano Lett. 2009;9:1949–1955. doi: 10.1021/nl9001525. [DOI] [PubMed] [Google Scholar]
- Kuok F. H. Kan K. Y. Yu I. S. Chen C. W. Hsu C. C. Cheng I. C. Chen J. Z. Appl. Surf. Sci. 2017;425:321–328. doi: 10.1016/j.apsusc.2017.06.286. [DOI] [Google Scholar]
- Kuok F. H. Liao C. Y. Wan T. H. Yeh P. W. Cheng I. C. Chen J. Z. J. Alloys Compd. 2017;692:558–562. doi: 10.1016/j.jallcom.2016.09.056. [DOI] [Google Scholar]
- Yang C.-H. Kuok F.-H. Liao C.-Y. Wan T.-H. Chen C.-W. Hsu C.-C. Cheng I.-C. Chen J.-Z. Mater. Res. Express. 2017;4:025504. doi: 10.1088/2053-1591/aa5ed5. [DOI] [Google Scholar]
- Liu H. W. Liang S. P. Wu T. J. Chang H. Kao P. K. Hsu C. C. Chen J. Z. Chou P. T. Cheng I. C. ACS Appl. Mater. Interfaces. 2014;6:15105–15112. doi: 10.1021/am503217f. [DOI] [PubMed] [Google Scholar]
- Chang S. H. Liou J. S. Liu J. L. Chiu Y. F. Xu C. H. Chen B. Y. Chen J. Z. J. Power Sources. 2016;336:99–106. doi: 10.1016/j.jpowsour.2016.10.058. [DOI] [Google Scholar]
- Chen J. Z. Wang C. Hsu C. C. Cheng I. C. Carbon. 2016;98:34–40. doi: 10.1016/j.carbon.2015.10.078. [DOI] [Google Scholar]
- Wan T. H. Chiu Y. F. Chen C. W. Hsu C. C. Cheng I. C. Chen J. Z. Coatings. 2016;6:44. doi: 10.3390/coatings6040044. [DOI] [Google Scholar]
- Jeong J. Y. Babayan S. E. Tu V. J. Park J. Henins I. Hicks R. F. Selwyn G. S. Plasma Sources Sci. Technol. 1998;7:282–285. doi: 10.1088/0963-0252/7/3/005. [DOI] [Google Scholar]
- Jeong J. Y. Babayan S. E. Schutze A. Tu V. J. Park J. Henins I. Selwyn G. S. Hicks R. F. J. Vac. Sci. Technol., A. 1999;17:2581–2585. [Google Scholar]
- Liu L. Ye D. Yu Y. Liu L. Wu Y. Carbon. 2017;111:121–127. doi: 10.1016/j.carbon.2016.09.037. [DOI] [Google Scholar]
- Xu C. H. Chiu Y. F. Yeh P. W. Chen J. Z. Mater. Res. Express. 2016;3:085002. doi: 10.1088/2053-1591/3/8/085002. [DOI] [Google Scholar]
- DiLeo R. A. Landi B. J. Raffaelle R. P. J. Appl. Phys. 2007:101. [Google Scholar]
- Dresselhaus M. S. Jorio A. Hofmann M. Dresselhaus G. Saito R. Nano Lett. 2010;10:751–758. doi: 10.1021/nl904286r. [DOI] [PubMed] [Google Scholar]
- Singh D. K. Iyer P. K. Giri P. K. Diamond Relat. Mater. 2010;19:1281–1288. doi: 10.1016/j.diamond.2010.06.003. [DOI] [Google Scholar]
- Bokobza L. Zhang J. eXPRESS Polym. Lett. 2012;6:601–608. doi: 10.3144/expresspolymlett.2012.63. [DOI] [Google Scholar]
- Kuok F. H., Master degree thesis, National Taiwan University, 2017 [Google Scholar]
- Jiang Z.-j. Jiang Z. Chen W. J. Power Sources. 2014;251:55–65. doi: 10.1016/j.jpowsour.2013.11.031. [DOI] [Google Scholar]
- Sun L. Wang L. Tian C. Tan T. Xie Y. Shi K. Li M. Fu H. RSC Adv. 2012;2:4498–4506. doi: 10.1039/C2RA01367C. [DOI] [Google Scholar]


