Abstract
The development of rapid, highly sensitive detection methods for neuron-specific enolase (NSE) and S100-β protein is very important as the levels of NSE and S100-β protein in the blood are closely related to brain injury. Therefore, we can use NSE and S100-β protein concentration detection to realize the preliminary judgment of brain injury. In this paper, we report that a simple label-free three dimensional hierarchical plasmonic nano-architecture has been designed for the sensitive surface-enhanced Raman scattering immunosensor detection of NSE and S100-β. Owing to the active group of the hollow gold nanospheres (HAuNPs), the redox molecules 4-mercaptobenzoic acid (4-MBA) and Nile blue A (NBA) absorb antibodies and provide signal generation. The prepared HAuNPs@4-MBA and HAuNPs@NBA are used as probes to easily construct a surface-enhanced Raman scattering immunosensor. When protein biomarkers are present, the sandwich nanoparticles are captured over the substrate, forming a confined plasmonic field, leading to an enhanced electromagnetic field in intensity and in space. As a result, the Raman reporter molecules are exposed to a high density of “hot spots”, which remarkably amplify the Raman signal, improving the sensitivity of the surface-enhanced Raman scattering immunosensor. Under the optimized conditions, the linear range of the proposed immunosensor is from 0.2 to 22 ng mL−1 for both NSE and S100-β. The lowest detectable concentration is 0.1 and 0.06 ng mL−1 for NSE and S100-β, respectively. The assay results for serum samples with the proposed method were in a good agreement with the standard enzyme-linked immunosorbent assay method. The proposed immunosensor is promising in clinical diagnosis. This method, which utilizes the surface-enhanced Raman scattering of HAuNPs, has great potential in the detection of biomarkers, which are vital in medical diagnoses and disease monitoring.
The development of rapid, highly sensitive detection methods for neuron-specific enolase (NSE) and S100-β protein is very important as the levels of NSE and S100-β protein in the blood are closely related to brain injury.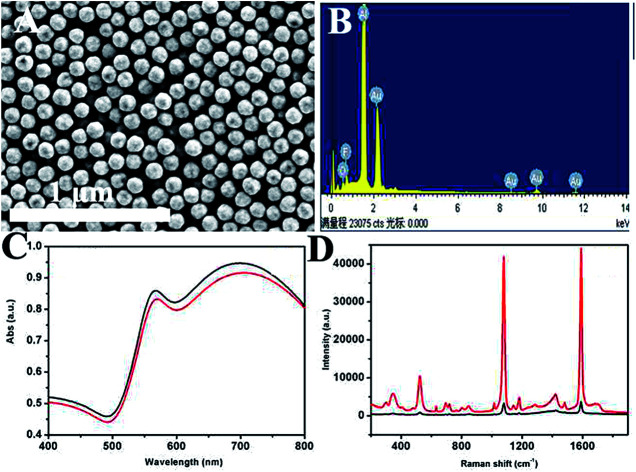
Introduction
Traumatic brain injury (TBI) is a leading cause of death and disability in the developed world.1 Approximately 2.8 million TBI-related emergency department (ED) visits, hospitalizations and deaths have occurred.2 The current ED standard of care for the initial assessment of a patient's potential TBI includes employment of the Glasgow Coma Scale (GCS), in which a clinician numerically assesses the brain impairment based on the bedside physical examination, and computed tomography (CT) scans.3,4 These screening tools are presently used for initial clinical management and prognosis of TBI. However, they cannot provide information on pathophysiological processes, and they are not very sensitive or specific, particularly in the case of mild or moderate TBI.5 On the other hand, some ED patients with traumatic injuries and a poor GCS score are subject to brain impairment due to intoxication from alcohol and/or drugs instead of from a true brain injury. Although early CT scans are useful for detection of intracerebral hemorrhage, they are often less effective at early detection of the more common cerebral contusions and diffuse axonal injury. Additionally, there is growing concern regarding radiation exposure from the use of screening CT scans in patients with possible TBI.6,7 Magnetic resonance imaging (MRI) is much more sensitive for early detection of TBI and does not expose patients to radiation. However, these studies are expensive and time-consuming, often require patient sedation, and are frequently unavailable in the ED. Early and accurate diagnosis of TBI is clinically important, as currently routine yet potentially unnecessary screening imaging might be avoided. Additionally, many patients with even mild TBI may experience short- or long-term sequelae, including changes in attention and memory and emotional disturbances, which may benefit from early diagnosis and intervention.8–10 Importantly, TBI clinical trials, such as those testing potential early therapies aimed at, for example, decreasing secondary injury, have been severely hampered by the dilemma of early diagnosis of true TBI as opposed to intoxication, with this “noise” requiring an increase in sample size and expense, and possible dilution of the measurable effects of the potential therapy. Measurement of protein biomarkers can provide an alternative route for rapid and accurate disease diagnosis. Protein biomarkers are present in human fluids, such as blood, saliva, or urine, which makes the tests much less invasive, rapid, and inexpensive and avoids the radiation involved with CT scans as well as the time, sedation, and expense of MRIs.11–15
The most common TBI biomarkers are glial fibrillary acidic protein (GFAP), S100-β, and neuron-specific enolase (NSE), which are released into circulation after brain damage occurs. Several methods have been employed to measure the protein biomarkers, including enzyme-linked immunosorbent assay (ELISA), western blot, and agarose gel electrophoresis.16–18 However, those methods generally involve time-consuming operation processes and large sample volumes, and require expensive instruments, which cannot be used as point-of-care (POC) analytical tools for rapid and low-cost clinical diagnosis.19,20
Surface-enhanced Raman scattering has become a powerful and sensitive analytical technique for chemical and biomedical analysis; compared with traditional immunoassays, surface-enhanced Raman scattering has some especial advantages.21–24 Firstly, surface-enhanced Raman scattering has better anti-interference resistance to other molecules in complex sample systems owing to its fingerprint characteristic.25,26 Second, surface-enhanced Raman scattering can highly enhance the Raman signals with good stability, convenience and reproducibility.27–30 As a result, surface-enhanced Raman scattering has been widely used in the detection of proteins for immunoassays.31–34
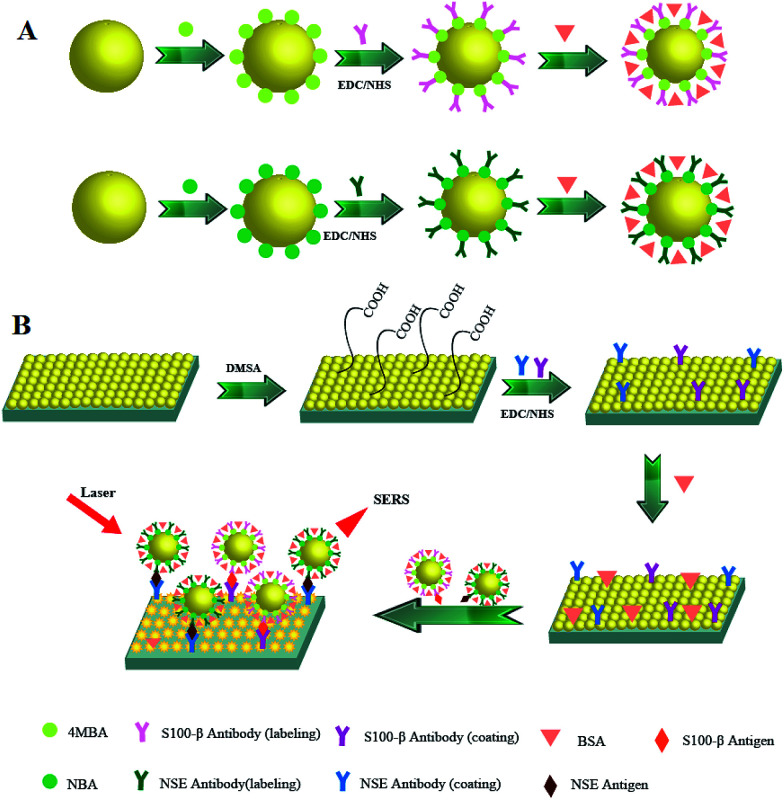
In this paper, a surface-enhanced Raman scattering immunoassay system with high sensitivity and effectivity is constructed for the detection of NSE and S100-β, which involves the combination of hollow gold nanospheres (HAuNPs) surface-enhanced Raman scattering probes and HAuNPs immunoassay substrates instead of using silver nanomaterial. Considering the easy oxidation of silver nanomaterial, gold nanomaterial is more stable, which is more suitable for biological monitoring.35–37 This study is quite new in terms of synthesis of HAuNPs and configuration of a surface-enhanced Raman scattering immunotest for the simultaneous detection of biomarkers. During the process of surface-enhanced Raman scattering, the antigen molecules connect with HAuNPs surface-enhanced Raman scattering probes and HAuNPs immunoassay substrates through the specific immune recognition between antigen and antibody. As the Raman reporter and linking group, the Raman signal of 4-mercaptobenzoic acid (4-MBA) and Nile blue A (NBA) are amplified early and also influenced by the concentration of antigen molecules. The result exhibits a broad linear range (0.2 to 22 ng mL−1) with correlation coefficients (R2) of 0.996 and 0.998. SERS based on HAuNPs is a very promising technique for the detection of proteins (Scheme 1).
Scheme 1. Illustration of SERS-based immunoassay for NSE and S100-β detection: (A) fabrication process of SERS tags. (B) Fabrication process of NSE and S100-β PcAb-conjugated substrate and the resulting sandwich for SERS detection.
Experimental
Materials
Silica colloids suspension, γ-amino-propyl-triethoxysilane, 1-[3-(dimethylamino)propyl]-3-carbodiimide hydrochloride and N-hydroxysuccinimide were purchased from Sigma. Dimercaptosuccinic acid and bovine serum albumin were purchased from Aladdin Ltd. (Shanghai, China). Chloroauric acid tetrahydrate, hydrogen peroxide (30%), 4-mercaptobenzoic acid and Nile blue A were purchased from Shanghai Chemical Reagent Co., Ltd., China. Neuron-specific enolase and S100-β and anti-NSE antibodies I and II and anti-S100-β antibodies I and II were purchased from Linc-Bio Science Co. (Shanghai, China). All other chemical reagents were of analytical grade or higher and were used without further purification. Aqueous solutions were prepared using Milli-Q water from a Milli-Q system (resistivity ≥ 18 MΩ). All chemicals were used as received without further purification.
Ethics statement
All experiments were performed in compliance with the National Health and Family Planning Commission of the People's Republic of China, and approved by the ethics committee at Taishan Medical University. Informed consents were obtained from the human participants of this study.
Synthesis of hollow gold nanospheres
The gold–silica with a silica core was synthesized as previously reported. Briefly, silica (0.013 g mL−1) was firstly dispersed in 40 mL of ethanol and amino-functionalized by γ-amino-propyl-triethoxysilane (1% v/v in ethanol) at 80 °C. ∼2 nm gold nanoparticles were synthesized by etrakis hydroxymethyl phosphonium chloride reducing chloroauric acid. Functionalized silica was added to the gold nanoparticles under stirring to form the gold–silica composite. The growing solution was prepared by mixing 750 mL of deionized water, 200 mg of potassium carbonate, and 12 mL of 1% chloroauric acid and then stirring for 30 min. The gold–silica composite and hydrogen peroxide were added in turn to the growing solution while stirring. The gold–silica was concentrated by centrifugation at 3000 rpm for 20 min and redispersed in 10 mL of water for further use.
For corroding the silica core, 3 μL of freshly prepared HF aqueous solution (0.02 M) was added to etch the 7 mL of gold–silica suspension (OD 700 nm = 1.0) at room temperature for 10 min with gentle stirring, the silica colloidal spheres completely dissolved and a hollow interior appeared to form hollow gold–silica. Their diameters were calculated from 100 particles from SEM images.
Preparation of hollow gold nanosphere immunoassay substrate
The fabrication of APTES-functionalized indium tin oxide conductive glass was carried out according to the literature procedures in our previous paper and the literature reported by Enders et al.38,39 All indium tin oxide conductive glass slips were washed with aqua regia and ultrapure water at least five times. The slips were further cleaned in ethanol with sonication three times and dried at 70 °C for 2 h in an air oven. The cleaned indium tin oxide conductive glass slips were vertically immersed in a 1% (v/v) ethanol solution of γ-amino-propyl-triethoxysilane in anhydrous ethanol at 70 °C for 2 h, three times in ethanol with sonication to remove excess silane, and dried for 2 h at 100 °C in an air oven.
Then, the functional indium tin oxide conductive glass slide was separated lengthways into two cross-links of the two portions. For the fabrication of the immunosensor, slips were vertically dipped overnight into the colloidal suspension of HAuNPs under gentle stirring to obtain the HAuNPs layers. Finally, the substrate was washed with ultrapure water three times and dried for 30 min at 30 °C. Thus, a suitable gold–silica substrate was obtained.
For surface functionalization, the obtained HAuNPs substrate was incubated in an sodium hydroxide solution (4 mM) containing 2 mM dimercaptosuccinic acid for 4 h and then washed with phosphate-buffered saline to remove free dimercaptosuccinic acid. The carboxy groups in the dimercaptosuccinic acid-modified substrate were activated by immersion in a solution containing 150 mM ethylene dichloride and 30 mM N-hydroxysuccinimide for 30 min with phosphate-buffered saline. Subsequently, the substrate was incubated in NSE and S100-β coating antibody molecules for 4 h and then washed with phosphate-buffered saline to remove free antibody molecules. Finally, in order to avoid nonspecific binding during the immunoassay, the substrate was immersed into bovine serum albumin solution (1% in phosphate-buffered saline) to block the residual vacant portion and then washed with phosphate-buffered saline.
SERS immunoassay for NSE and S100-β antigen detection
Briefly, the as-prepared nanoparticles were washed twice with distilled water. 100 μL of as-prepared HAuNPs was dispersed in 400 μL of distilled water. 50 μL of dimercaptosuccinic acid (10−6 mol L−1) was added after stirring for 30 minutes and washed twice, then co-incubated with 60 μL of NBA aqueous solution (10−5 mol L−1) for 30 minutes. The NBA-adsorbed HAuNPs were re-dispersed in 500 μL of phosphate-buffered saline (pH = 7.4), and subsequently co-incubated with 20 μL of NSE labeling antibody (10 μg mL−1) for 1 hour. Finally, HAuNPs@NBA@NSE labelled antibody nanoparticles were sealed with bovine serum albumin (1 wt%) to cover up the antibody positive sites.
Secondly, we prepared HAuNPs@4-MBA@S100-β labeling antibody nanoparticles. Briefly, the as-prepared nanoparticles were washed with distilled water twice. 100 μL of as-prepared nanoparticles was dispersed in 400 μL of distilled water, then co-incubated with 50 μL of 4-MBA aqueous solution (10−6 mol L−1) for 30 minutes. The 4-MBA-adsorbed HAuNPs were re-dispersed in 500 μL of phosphate-buffered saline (pH = 7.4) and subsequently co-incubated with 20 μL of S100-β labeling antibody (10 μg mL−1) for 1 hour. Finally, HAuNPs@4-MBA@S100-β labelled antibody nanoparticles were sealed with bovine serum albumin (1 wt%) to cover up the antibody positive sites.
The HAuNPs substrate was mixed with 1 mL of two kinds of labeling antibody (10 μg mL−1) for 1 h. Finally, it was sealed with bovine serum albumin (1 wt%) to cover up the antibody positive sites.
Equivalent labeling probes and coating substrates were merged together forming a 1 mL mixture solution. Then different amounts of S100-β and NSE antigens were added. After co-incubating for 2 h and washing with phosphate-buffered saline, these samples were dried at room temperature for subsequent Raman signal obtaining.
Characterization
Scanning electron microscopy measurements were made using an Xl30 Esem Feg scanning electron microscope at an accelerating potential of 20 kV. Fourier transform infrared spectroscopy measurements were made on a Fourier transform infrared spectroscopy spectrometer tensor 27 (Bruker Optik GmbH, Ettlingen, Germany). The Raman experiments were collected using a Renishaw Invia Reflex system equipped with Peltier-cooled charge-coupled device detectors and a Leica microscope. Raman measurements were performed with an excitation line provided by a He–Ne laser (785 nm wavelength) via a 50× long working distance objective lens, of which the NA is 0.50. In each sample, five random spots were selected to detect their Raman signals. The final signal was obtained from the average signal of these random spots.
Results and discussion
Synthesis and characterization of hollow gold nanospheres
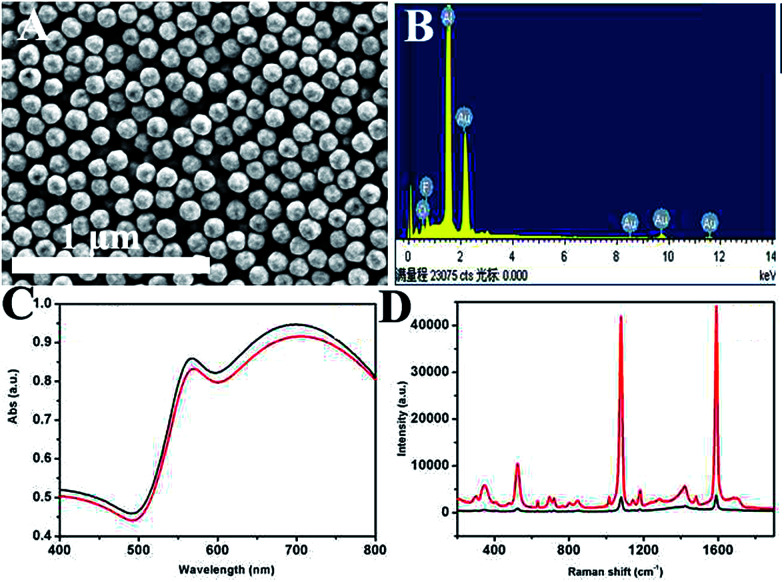
Fig. 1A shows a typical scanning electron microscope image of the prepared product. It can be seen that the as-prepared HAuNPs have regular spherical morphology and uniform size distribution. This image demonstrates that the diameter of gold–silica is 170 nm, with ∼110 nm for the HAuNPs. Fig. 1B shows that the successful fabrication of HAuNPs can be directly demonstrated by energy-dispersive X-ray (EDX) spectroscopy. The result indicates that only element Au is present in the HAuNPs. It confirms that the silica core had disappeared and HAuNPs were formed. Fig. 1C shows the ultraviolet-visible absorption spectra of AuNPs (black) and HAuNPs (red) in water, which have a peak at about 700 nm. Fig. 1D shows the absorbance spectra of AuNPs (black) and HAuNPs (red). Here, their plasmon absorbance intensity was nearly unchanged. On the other hand, the maximum absorption wavelength of HAuNPs had a slight blue shift compared to that of AuNPs, which may be caused by the change of the refractive index. By changing the wall thickness of the AuNPs, the maximum absorption wavelength of HAuNPs can be adjusted to obtain the maximum resonance with an excitation light source. As mentioned in previous reports, HAuNPs show strong enhancement effects from individual particles because hot spots can be localized on the pinholes in the HAuNPs structures. Fig. 1D shows SERS spectra for 4-MBA-labeled AuNPs and HAuNPs. The results show that the Raman intensity of 4-MBA-labeled HAuNPs at 1080 cm−1 is 10 times higher than that of AuNPs, indicating the excellent SERS enhancement effect of HAuNPs.
Fig. 1. (A) SEM images of prepared hollow gold shell nanoparticles. (B) EDX spectra of hollow gold shell nanoparticles. (C) UV-vis absorption spectrum of AuNPs (black) and HAuNPs (red). (D) SERS spectra for 4-MBA-labeled AuNPs (black) and HAuNPs (red).
Characterization of hollow gold nanosphere tags
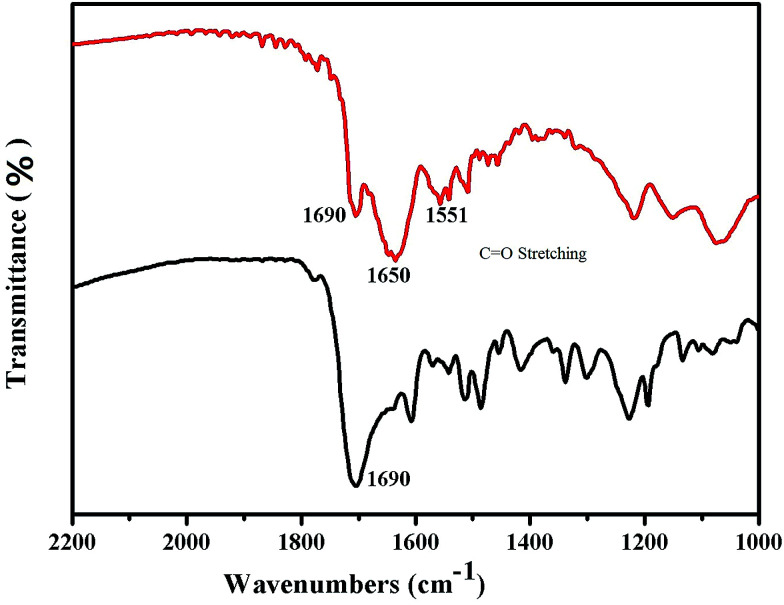
Fig. 2 shows the Fourier transform infrared spectroscopy results for the Raman reporter modified HAuNPs. To further confirm the successful conjugation of HAuNPs, the Fourier transform infrared spectra of 4-MBA-labeled HAuNPs (black) and HAuNPs surface-enhanced Raman scattering probes (red) were measured and are shown in Fig. 2. The black line 1690 cm−1 peak in the Fourier transform infrared spectrum of 4-MBA-labeled HAuNPs is assigned to the C O stretching vibration in the carboxy groups of 4-MBA, indicating the conjugation of 4-MBA. Furthermore, the red line 1650 cm−1 and 1551 cm−1 peaks in the Fourier transform infrared spectrum of the HAuNPs surface-enhanced Raman scattering probes are due to C O symmetric and asymmetric stretching modes, respectively, in amino bonds, which are present in the S100-β antibody molecules and also formed by the chemical combination of carboxy groups in the S100-β antibody molecules with carboxy groups in 4-MBA. Based on the above results, 4-MBA and S100-β labeling antibody molecules are successfully conjugated to the surface of the HAuNPs.
Fig. 2. Infrared spectra of the hollow gold shell nanoparticles modified with 4-MBA (black) and S100-β antibodies (red).
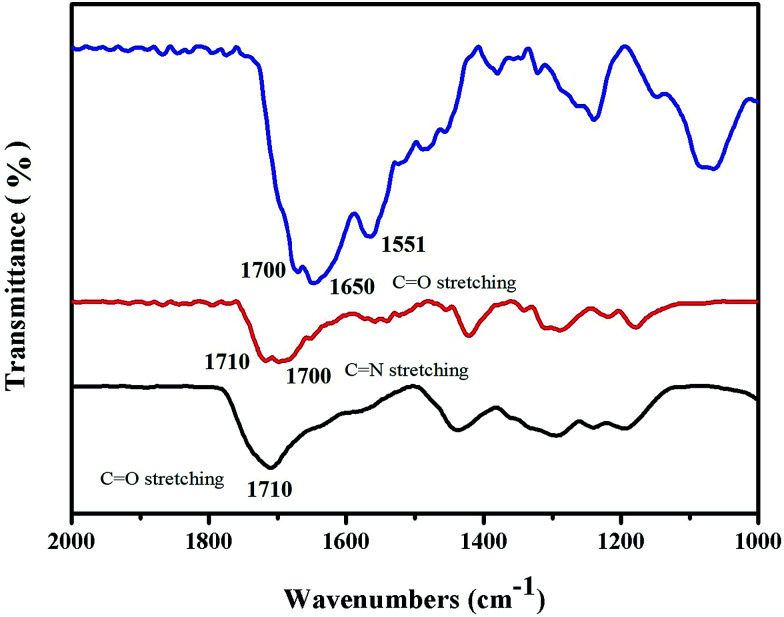
Fig. 3 shows the successful conjugation of the HAuNPs tags with the Fourier transform infrared spectra of NBA-labeled HAuNPs. The black line 1710 cm−1 peak in the Fourier transform infrared spectrum of NBA-labeled HAuNPs tags is assigned to the C O stretching vibration in the carboxy groups of dimercaptosuccinic acid. The red line 1700 cm−1 peak in Fourier transform infrared spectrum of NBA-labeled HAuNPs tags is assigned to the C N stretching vibration in the carboxy groups of NBA. Furthermore, the blue line 1650 cm−1 and 1551 cm−1 peaks in the Fourier transform infrared spectrum of the HAuNPs surface-enhanced Raman scattering tags are due to C O symmetric and asymmetric stretching modes, respectively, in amino bonds, which are present in the NSE antibody molecules and also formed by the chemical combination of carboxy groups in NSE antibody molecules with carboxy groups in NBA. Based on the above results, NBA and NSE labeling antibody molecules are successfully conjugated to the surface of HAuNPs.
Fig. 3. Infrared spectra of HAuNPs (black) and HAuNPs modified with NBA (red) and NSE (blue) antibodies.
Characterization of hollow gold nanosphere substrates
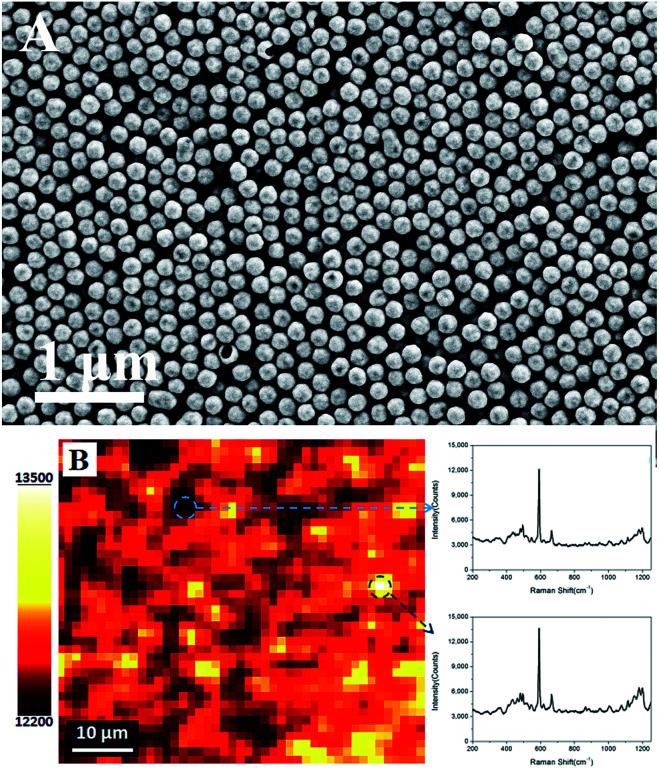
Fig. 4A shows that the HAuNPs are distributed fairly uniformly on the indium tin oxide conductive glass surface. To better characterize the uniformity of the surface-enhanced Raman scattering signal, a Raman mapping experiment was carried out after the surface had been coated with NBA. Fig. 4B shows the surface-enhanced Raman scattering mapping of the HAuNPs substrate, using the largest NBA band at 592 cm−1 as the mapping signal. The scan area was 25 × 30 μm2, the step size was 1.4 μm, the laser power was 2 mW, and the acquisition time at each point was 10 s. The deviation of surface-enhanced Raman scattering intensities from the strongest point to the weakest point is less than 6%, indicating that the HAuNPs substrate has a very uniform surface-enhanced Raman scattering enhancement effect over the whole surface.
Fig. 4. (A) SEM image of the hollow gold shell nanoparticles substrate. (B) Surface-enhanced Raman scattering mapping of the substrate using the surface-enhanced Raman scattering peak intensity (592 cm−1) of NBA. The acquisition time was 10 s, and the laser power was 2 mW.
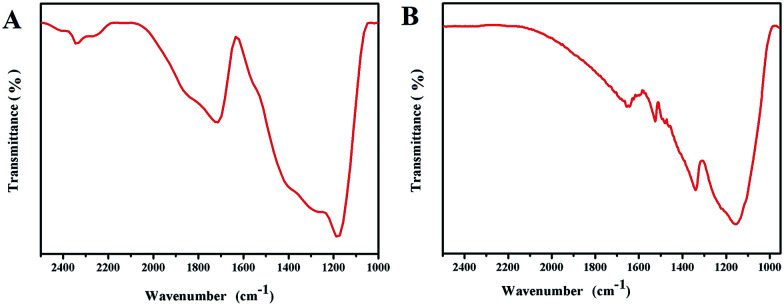
The above analysis indicates that the obtained HAuNPs substrate has good uniformity and reproducibility, which is the premise for immunoassays based on surface-enhanced Raman scattering of HAuNPs. To further confirm the successful conjugation of the HAuNPs substrate, the Fourier transform infrared spectra of the dimercaptosuccinic acid-labeled HAuNPs substrate and the HAuNPs immunoassay substrate (HAuNPs substrate@NBA@S100-β@NSE antibody) were measured. Fig. 5A and B show the Fourier transform infrared spectra. The 1700 cm−1 peak in the Fourier transform infrared spectra is attributed to the C N stretching vibration in carboxy groups of NBA. The 1710 cm−1 peak in the Fourier transform infrared spectrum of the dimercaptosuccinic acid-labeled HAuNPs substrate is assigned to the C O stretching vibration in carboxy groups of dimercaptosuccinic acid. The 1650 cm−1 and 1551 cm−1 peaks in the Fourier transform infrared spectrum of the HAuNPs immunoassay substrate are due to C O symmetric and asymmetric stretching modes in amido bonds, which are present in the S100-β and NSE coating antibody molecules and also formed by the chemical combination of carboxy groups in the S100-β and NSE antibody molecules with carboxy groups in dimercaptosuccinic acid. Based on the above results, dimercaptosuccinic acid and S100-β and NSE coating antibody molecules are successfully conjugated to the surface of the HAuNPs substrate. Under the action of specific binding, combining can overcome the effects of the steric problems.
Fig. 5. (A) Infrared spectrum of dimercaptosuccinic acid-labeled hollow gold shell nanoparticles. (B) Infrared spectrum of antibody-labeled hollow gold shell nanoparticles substrate.
SERS spectra analysis and immunoassay detection
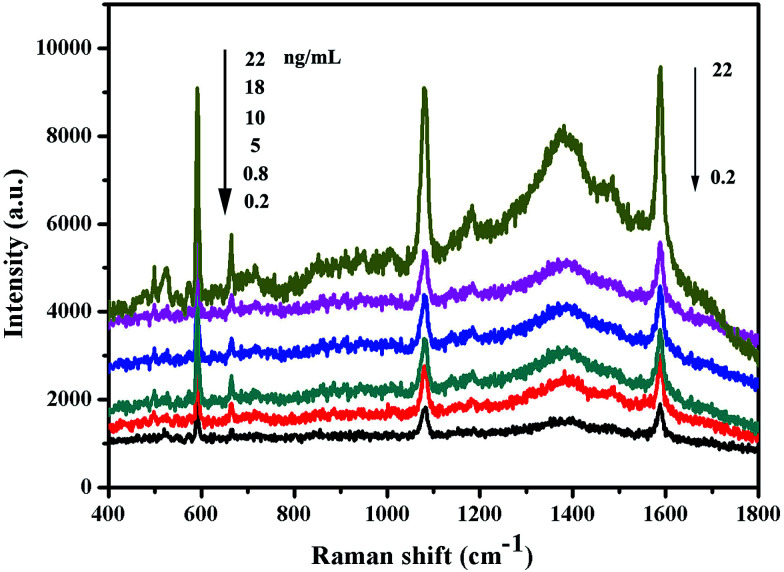
Under optimal conditions, the performance of the multiplexed immunoassay was evaluated with S100-β and NSE. Fig. 6 shows that the surface-enhanced Raman scattering immunoassay decreased as the concentrations of S100-β and NSE increased.
Fig. 6. SERS spectra of the multiplex immunosensor after incubation with various concentrations of S100-β and NSE.
Based on the specific combination of antigen and antibody, HAuNPs surface-enhanced Raman scattering tags can conjugate with HAuNPs immunoassay substrates. The Raman signals of 4-MBA and NBA are the same as the amount of the connected antibody, which is equal to the concentration of antigen molecules. Therefore, the surface-enhanced Raman scattering intensity of the reporter molecules can be indirectly identified as the antigen concentration. During the process of the immunoassays, the S100-β and NSE molecules were applied with different concentrations (0.2 to 22 ng mL−1). Under light excitation the Raman signal of 4-MBA and NBA used as the Raman reporter and linking group is greatly amplified and influenced by the concentration of the antigen molecules. The surface-enhanced Raman scattering spectra in Fig. 6 indicate that there is a positive correlation between the surface-enhanced Raman scattering peak intensity at 1077 cm−1 for 4-MBA and 592 cm−1 for NBA and antigen concentrations ranging from 0.2 to 22 ng mL−1. From the results, we can learn that the surface-enhanced Raman scattering immunoassay for S100-β antigen based on HAuNPs is sensitive and effective.
SERS spectra analysis clinical application
The feasibility of the prepared immunosensor for possible clinical application is investigated by analyzing human serum samples from students of Tumour Hospital. The immunoassay for human serum samples was investigated by analyzing three real samples in comparison with enzyme-linked immunosorbent assay technique. Each human serum sample was analyzed ten times. The analytical performance of the proposed immunosensor was compared with the S100-β and NSE immunosensors reported previously. Table 1 demonstrates that there is no signification difference between the results given by the two methods. The results and the relative errors between the two methods ranged from −1.25 to 8.81% for S100-β and from −4.17 to 8.48% for NSE. As a result, the prepared immunosensor could be reasonably applied in the clinical determination of S100-β and NSE.
Assay results of clinical serum samples using the SERS and the enzyme-linked immuno sorbent assay methods.
| Analyte number | S100-β | NSE | ||
|---|---|---|---|---|
| SERS (ng mL−1) | ELISA (ng mL−1) | SERS (ng mL−1) | ELISA (ng mL−1) | |
| 1 | 1.17 ± 0.016 | 1.21 ± 0.011 | 1.05 ± 0.011 | 1.02 ± 0.001 |
| 2 | 4.16 ± 0.021 | 4.14 ± 0.014 | 3.72 ± 0.017 | 3.46 ± 0.01 |
| 3 | 8.71 ± 0.017 | 8.75 ± 0.011 | 8.58 ± 0.012 | 8.61 ± 0.007 |
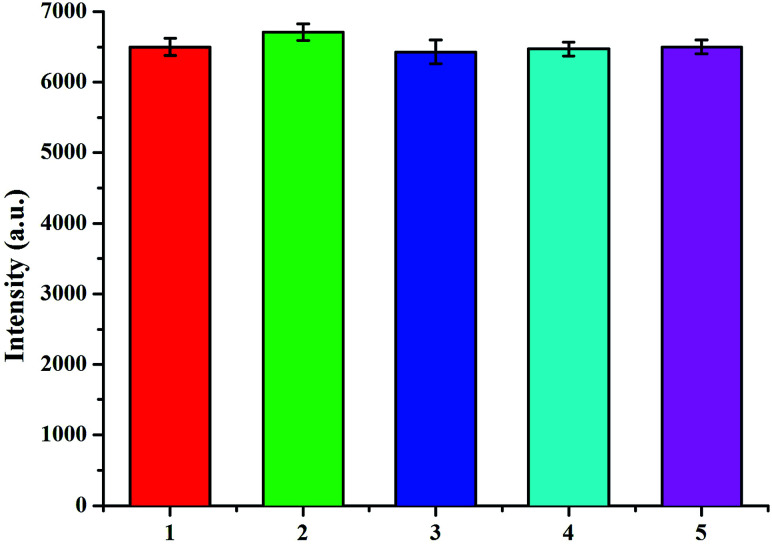
The selectivity of the surface-enhanced Raman scattering immunoassay is important in biological sample analysis so interference study was conducted using bovine serum albumin (2), glucose (3), carcinoembryonic antigen (4), and neuron-specific enolase (5). The Raman signal of the surface-enhanced Raman scattering immunoassay with 2 ng mL−1 of S100-β and NSE mixture solution and 10 ng mL−1 of the above interfering substances was respectively measured. Fig. 7 shows that the change in the Raman intensity with the interfering substances is 1.7% less than that without interferences. These observations indicate that the immunoassay exhibits acceptable selectivity for the determination of S100-β and NSE.
Fig. 7. Raman intensity of the SERS immunoassay with 2 ng mL−1 S100-β and NSE mixture solution + 10 ng mL−1 serum albumin (2), glucose (3), carcinoembryonic antigen (4) and neuron-specific enolase (5).
The reproducibility and accuracy of the immunoassay were evaluated by the surface-enhanced Raman scattering. Five equal indium tin oxide conductive glass substrates were prepared for the detection of 10 ng mL−1 S100-β and NSE. The relative standard deviation of the measurements for the five electrodes is 4.9% and 6.3%. The results indicate that the accuracy and reproducibility of the fabricated immunosensor are acceptable.
The stability of the sensors was evaluated over a period of 10 days of storage (at 4 °C). After 2 days and 10 days, the surface-enhanced Raman scattering signal of the immunosensor decreases to approximately 92% and 83% of its initial value, respectively. Regeneration plays a key role in the application and development of immunosensors. After the immunosensor is used to detect S100-β and NSE, the immunosensor is treated with 1 M urea solution for 5 min to break the antibody–antigen linkage. The indium tin oxide conductive substrate is resused for five consecutive measurements of one sample after the immunosensor is regenerated and a relative standard deviation of 6.7% was obtained at an S100-β concentration of 10 ng mL−1. The results indicate that the immunosensor can be regenerated and used again. Based on the above-mentioned observations, our proposed immunosensor could be applied for determination of S100-β and NSE in clinical diagnosis.
Conclusions
In summary, a surfactant-free and template-free method for the high-yield synthesis of HAuNPs was reported. Meanwhile, a simple label-free surface-enhanced Raman scattering multiplexed immunosensor based on HAuNPs was developed for simultaneous detection of S100-β and NSE. The proposed immunosensor shows excellent performance for S100-β and NSE detection with a remarkable detection limit, good stability, and wide linear range, and exhibits a good correlation with enzyme-linked immunosorbent assay. Such HAuNPs surface-enhanced Raman scattering substrate may hold great promise for applications in areas including biosensing, environmental monitoring and clinical diagnostics.
Conflicts of interest
There are no conflicts to declare.
Supplementary Material
Acknowledgments
We gratefully acknowledge support from the National Natural Science Foundation of China (Grant: 81701179) and Joint special fund of Shandong natural fund (Grant: ZR2015HL050).
Notes and references
- Sha M. Y. Xu H. Penn S. G. Cromer R. SERS nanoparticles: a new optical detection modality for cancer diagnosis. Nanomedicine. 2007;2(5):725–734. doi: 10.2217/17435889.2.5.725. [DOI] [PubMed] [Google Scholar]
- Hu C. Liu Y. Qin J. Nie G. Lei B. Xiao Y. Zheng M. Rong J. Fabrication of reduced graphene oxide and sliver nanoparticle hybrids for Raman detection of absorbed folic acid: a potential cancer diagnostic probe. ACS Appl. Mater. Interfaces. 2013;5(11):4760–4768. doi: 10.1021/am4000485. [DOI] [PubMed] [Google Scholar]
- Jun B. H. Noh M. S. Kim J. Kim G. Kang H. Kim M. S. Seo Y. T. Baek J. Kim J. H. Park J. Multifunctional Silver-Embedded Magnetic Nanoparticles as SERS Nanoprobes and Their Applications. Small. 2010;6(1):119–125. doi: 10.1002/smll.200901459. [DOI] [PubMed] [Google Scholar]
- Liu Z. Guo Z. Zhong H. Qin X. Wan M. Yang B. Graphene oxide based surface-enhanced Raman scattering probes for cancer cell imaging. Phys. Chem. Chem. Phys. 2013;15(8):2961–2966. doi: 10.1039/C2CP43715E. [DOI] [PubMed] [Google Scholar]
- Wang Z. Zong S. Yang J. Li J. Cui Y. Dual-mode probe based on mesoporous silica coated gold nanorods for targeting cancer cells. Biosens. Bioelectron. 2011;26(6):2883–2889. doi: 10.1016/j.bios.2010.11.032. [DOI] [PubMed] [Google Scholar]
- Zong S. Wang Z. Yang J. Wang C. Xu S. Cui Y. A SERS and fluorescence dual mode cancer cell targeting probe based on silica coated Au@Ag core–shell nanorods. Talanta. 2012;97:368–375. doi: 10.1016/j.talanta.2012.04.047. [DOI] [PubMed] [Google Scholar]
- Lee S. Chon H. Lee M. Choo J. Shin S. Y. Lee Y. H. Rhyu I. J. Son S. W. Oh C. H. Surface-enhanced Raman scattering imaging of HER2 cancer markers overexpressed in single MCF7 cells using antibody conjugated hollow gold nanospheres. Biosens. Bioelectron. 2009;24(7):2260–2263. doi: 10.1016/j.bios.2008.10.018. [DOI] [PubMed] [Google Scholar]
- Cai W. Gao T. Hong H. Sun J. Applications of gold nanoparticles in cancer nanotechnology. Nanotechnol., Sci. Appl. 2008;1:17. doi: 10.2147/NSA.S3788. [DOI] [PMC free article] [PubMed] [Google Scholar]
- Cao Y. C. Jin R. Mirkin C. A. Nanoparticles with Raman spectroscopic fingerprints for DNA and RNA detection. Science. 2002;297(5586):1536–1540. doi: 10.1126/science.297.5586.1536. [DOI] [PubMed] [Google Scholar]
- Lu W. Arumugam S. R. Senapati D. Singh A. K. Arbneshi T. Khan S. A. Yu H. Ray P. C. Multifunctional oval-shaped gold-nanoparticle-based selective detection of breast cancer cells using simple colorimetric and highly sensitive two-photon scattering assay. ACS Nano. 2010;4(3):1739–1749. doi: 10.1021/nn901742q. [DOI] [PMC free article] [PubMed] [Google Scholar]
- Huefner A. Kuan W.-L. Barker R. A. Mahajan S. Intracellular SERS nanoprobes for distinction of different neuronal cell types. Nano Lett. 2013;13(6):2463–2470. doi: 10.1021/nl400448n. [DOI] [PMC free article] [PubMed] [Google Scholar]
- Fales A. M. Yuan H. Vo-Dinh T. Silica-coated gold nanostars for combined surface-enhanced Raman scattering (SERS) detection and singlet-oxygen generation: a potential nanoplatform for theranostics. Langmuir. 2011;27(19):12186–12190. doi: 10.1021/la202602q. [DOI] [PMC free article] [PubMed] [Google Scholar]
- Rodríguez-Lorenzo L. Krpetic Z. Barbosa S. Alvarez-Puebla R. A. Liz-Marzán L. M. Prior I. A. Brust M. Intracellular mapping with SERS-encoded gold nanostars. Integr. Biol. 2011;3(9):922–926. doi: 10.1039/C1IB00029B. [DOI] [PubMed] [Google Scholar]
- Yuan H. Fales A. M. Khoury C. G. Liu J. Vo-Dinh T. Spectral characterization and intracellular detection of Surface-Enhanced Raman Scattering (SERS)-encoded plasmonic gold nanostars. J. Raman Spectrosc. 2013;44(2):234–239. doi: 10.1002/jrs.4172. [DOI] [PMC free article] [PubMed] [Google Scholar]
- Cialla D. März A. Böhme R. Theil F. Weber K. Schmitt M. Popp J. Surface-enhanced Raman spectroscopy (SERS): progress and trends. Anal. Bioanal. Chem. 2012;403(1):27–54. doi: 10.1007/s00216-011-5631-x. [DOI] [PubMed] [Google Scholar]
- Bajorath J. Molecular organization, structural features, and ligand binding characteristics of CD44, a highly variable cell surface glycoprotein with multiple functions. Proteins: Struct., Funct., Bioinf. 2000;39(2):103–111. doi: 10.1002/(SICI)1097-0134(20000501)39:2<103::AID-PROT1>3.0.CO;2-G. [DOI] [PubMed] [Google Scholar]
- Martin T. A. Harrison G. Mansel R. E. Jiang W. G. The role of the CD44/ezrin complex in cancer metastasis. Crit. Rev. Oncol. Hematol. 2003;46(2):165–186. doi: 10.1016/S1040-8428(02)00172-5. [DOI] [PubMed] [Google Scholar]
- El-Sayed I. H. Huang X. El-Sayed M. A. Surface plasmon resonance scattering and absorption of anti-EGFR antibody conjugated gold nanoparticles in cancer diagnostics: applications in oral cancer. Nano Lett. 2005;5(5):829–834. doi: 10.1021/nl050074e. [DOI] [PubMed] [Google Scholar]
- Yu X. Wang J. Feizpour A. Reinhard B. r. M. Illuminating the lateral organization of cell-surface CD24 and CD44 through plasmon coupling between Au nanoparticle immunolabels. Anal. Chem. 2013;85(3):1290–1294. doi: 10.1021/ac303310j. [DOI] [PMC free article] [PubMed] [Google Scholar]
- Li J. Wu J. Zhang X. Liu Y. Zhou D. Sun H. Zhang H. Yang B. Controllable synthesis of stable urchin-like gold nanoparticles using hydroquinone to tune the reactivity of gold chloride. J. Phys. Chem. C. 2011;115(9):3630–3637. [Google Scholar]
- Frens G. Controlled nucleation for the regulation of the particle size in monodisperse gold suspensions. Nature. 1973;241(105):20–22. [Google Scholar]
- Song C. Wang Z. Zhang R. Yang J. Tan X. Cui Y. Highly sensitive immunoassay based on Raman reporter-labeled immuno-Au aggregates and SERS-active immune substrate. Biosens. Bioelectron. 2009;25(4):826–831. doi: 10.1016/j.bios.2009.08.035. [DOI] [PubMed] [Google Scholar]
- Peng R. Si Y. Deng T. Zheng J. Li J. Yang R. Tan W. A novel SERS nanoprobe for the ratiometric imaging of hydrogen peroxide in living cells. Chem. Commun. 2016;52(55):8553–8556. doi: 10.1039/C6CC03412H. [DOI] [PubMed] [Google Scholar]
- Jang L.-S. Keng H.-K. Modified fabrication process of protein chips using a short-chain self-assembled monolayer. Biomed. Microdevices. 2008;10(2):203–211. doi: 10.1007/s10544-007-9126-7. [DOI] [PubMed] [Google Scholar]
- Wissink M. Beernink R. Pieper J. Poot A. Engbers G. Beugeling T. Van Aken W. Feijen J. Immobilization of heparin to EDC/NHS-crosslinked collagen. Characterization and in vitro evaluation. Biomaterials. 2001;22(2):151–163. doi: 10.1016/S0142-9612(00)00164-2. [DOI] [PubMed] [Google Scholar]
- Banholzer M. J. Millstone J. E. Qin L. Mirkin C. A. Rationally designed nanostructures for surface-enhanced Raman spectroscopy. Chem. Soc. Rev. 2008;37(5):885–897. doi: 10.1039/B710915F. [DOI] [PMC free article] [PubMed] [Google Scholar]
- Wustholz K. L. Henry A.-I. McMahon J. M. Freeman R. G. Valley N. Piotti M. E. Natan M. J. Schatz G. C. Duyne R. P. V. Structure – Activity Relationships in Gold Nanoparticle Dimers and Trimers for Surface-Enhanced Raman Spectroscopy. J. Am. Chem. Soc. 2010;132(31):10903–10910. doi: 10.1021/ja104174m. [DOI] [PubMed] [Google Scholar]
- Su Q. Q. Ma X. Y. Dong J. Jiang C. Y. Qian W. P. A Reproducible SERS Substrate Based on Electrostatically Assisted APTES-Functionalized Surface-Assembly of Gold Nanostars, ACS Appl. Mater. Interfaces. 2011;3(6):1873–1879. doi: 10.1021/am200057f. [DOI] [PubMed] [Google Scholar]
- Talley C. E. Jusinski L. Hollars C. W. Lane S. M. Huser T. Intracellular pH sensors based on surface-enhanced Raman scattering. Anal. Chem. 2004;76(23):7064–7068. doi: 10.1021/ac049093j. [DOI] [PubMed] [Google Scholar]
- Wang Y. Yan B. Chen L. SERS tags: novel optical nanoprobes for bioanalysis. Chem. Rev. 2012;113(3):1391–1428. doi: 10.1021/cr300120g. [DOI] [PubMed] [Google Scholar]
- Tkachenko A. G. Xie H. Coleman D. Glomm W. Ryan J. Anderson M. F. Franzen S. Feldheim D. L. Multifunctional gold nanoparticle-peptide complexes for nuclear targeting. J. Am. Chem. Soc. 2003;125(16):4700–4701. doi: 10.1021/ja0296935. [DOI] [PubMed] [Google Scholar]
- Boca S. Rugina D. Pintea A. Barbu-Tudoran L. Astilean S. Flower-shaped gold nanoparticles: synthesis, characterization and their application as SERS-active tags inside living cells. Nanotechnology. 2011;22(5):055702. doi: 10.1088/0957-4484/22/5/055702. [DOI] [PubMed] [Google Scholar]
- Huang X. El-Sayed I. H. Qian W. El-Sayed M. A. Cancer cell imaging and photothermal therapy in the near-infrared region by using gold nanorods. J. Am. Chem. Soc. 2006;128(6):2115–2120. doi: 10.1021/ja057254a. [DOI] [PubMed] [Google Scholar]
- Jain P. K. Huang X. El-Sayed I. H. El-Sayed M. A. Noble metals on the nanoscale: optical and photothermal properties and some applications in imaging, sensing, biology, and medicine. Acc. Chem. Res. 2008;41(12):1578–1586. doi: 10.1021/ar7002804. [DOI] [PubMed] [Google Scholar]
- Gong X. Tang J. Ji Y. Wu B. Wu H. Liu A. Adjustable plasmonic optical properties of hollow gold nanospheres monolayers and LSPR-dependent surface-enhanced Raman scattering of hollow gold nanosphere/graphene oxide hybrids. RSC Adv. 2015;5(53):42653–42662. doi: 10.1039/C5RA08057F. [DOI] [Google Scholar]
- Adams S. Thai D. Mascona X. Schwartzberg A. M. Zhang J. Z. Key factors affecting the reproducibility of synthesis and growth mechanism of near-infrared absorbing hollow gold nanospheres. Chem. Mater. 2014;26(23):6805–6810. doi: 10.1021/cm5033892. [DOI] [Google Scholar]
- Chandra M. Dowgiallo A. M. Knappenberger Jr K. L. Controlled plasmon resonance properties of hollow gold nanosphere aggregates. J. Am. Chem. Soc. 2010;132(44):15782–15789. doi: 10.1021/ja106910x. [DOI] [PubMed] [Google Scholar]
- Wang Y. Yang Q. R. Sun J. Nie M. M. Dong J. Qian W. P. Gold nanoflowers modified ITO glass as SERS substrate for carbon tetrachloride-induced acute liver injury in vitro detection. RSC Adv. 2016;6(116):115189–115195. doi: 10.1039/C6RA22706F. [DOI] [Google Scholar]
- Enders D. Nagao T. Pucci A. Nakayama T. Aono M. In situ surface-enhanced infrared absorption spectroscopy for the analysis of the adsorption and desorption process of Au nanoparticles on the SiO2/Si surface. Langmuir. 2007;23(11):6119–6125. doi: 10.1021/la063239n. [DOI] [PubMed] [Google Scholar]


