Abstract
An anthraquinone – graphene structure was fabricated and applied for the removal of lead(ii) from aqueous solution. The equilibrium occurred in about 10 min revealing the high adsorption rate at the beginning of the process. The maximum Pb(ii) adsorption capacity of the Fe3O4@DHAQ_GO nanocomposite was about 283.5 mg g−1 that was observed at 323 K and pH 5.5. The Pb(ii) adsorption ability increased with the increasing pH. The isotherm and kinetic studies indicated that the Sips isotherm model and the linear form of the pseudo-second kinetic model had a better fit with the experimental results. The positive value of ΔH0 indicated endothermic interactions between Pb(ii) and Fe3O4@DHAQ_GO. The negative ΔG0 indicated that the reactions are spontaneous with a high affinity for Pb(ii). The positive ΔS0 values indicated increasing randomness at the solid–solute interface during the adsorption process. The selective removal of Pb(ii) by the nanocomposite confirms the presence of higher-affinity binding sites for Pb(ii) than Cd(ii), Co(ii), Zn(ii), and Ni(ii) ions. Furthermore, the Fe3O4@DHAQ_GO nanocomposite revealed an excellent preferential adsorbent for Pb(ii) spiked in drinking water samples containing natural ion matrices. EDTA-2NA 0.01 N was found to be a better elution agent than HCl 0.1 M for the nanocomposite regeneration. After five adsorption/desorption cycles using EDTA-2NA 0.01 N, more than 84% of the adsorbed Pb(ii) was still desorbed in 30 min. Capturing sub-ppm initial concentrations of Pb(ii) and the capability to selectively remove lead from drinking water samples make the Fe3O4@DHAQ_GO nanocomposite practically convenient for water treatment purposes. High adsorption capacity and facile chemical synthesis route are the other advancements.
The Fe3O4@DHAQ_GO nanocomposite can serve as an efficient adsorbent for the selective removal of lead from polluted water.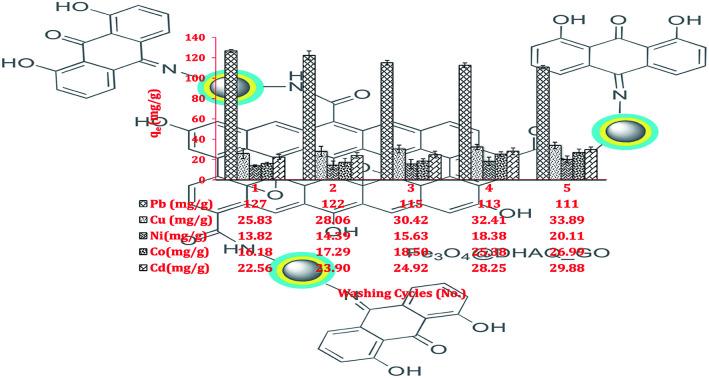
1. Introduction
Lead ions are a severe environmental concern and can contaminate drinking water resources.1,2 The maximum contaminant level (MCL) of Pb2+ for drinking water is 10 ppb set by EPA and national standard organizations.3,4 The strict limitations on discharge effluents containing Pb2+ into natural water bodies are due to the high toxicity potential for vital organs such as brain and kidney.2
Different methods are currently applied for the removal of high concentrations of lead ion that can be found in industrial wastewaters;5–8 whereas only a few methods e.g. using functionalized adsorbents9,10 and membrane technologies11 can be adapted for the capturing of low concentrations (around 1 ppm) commonly occurring in drinking water sources. Furthermore, avoiding alteration of the natural ion matrices of drinking waters during the removal of a certain target contaminant is a consideration especially for membrane-based water treatment technologies.12,13 New generation adsorbents such as graphene oxide and carbon nanotubes show metal adsorption capacities much more than those of traditional adsorbents.14 For example, the ordinary adsorption capacity of activated carbon is less than 70 mg g−1, whereas graphene oxide nanosheets are capable of reaching an adsorption capacity of 4000 mg g−1.15
Graphene oxide is an emerging carbon-based nanomaterial that has revealed the promising adsorptive properties. Despite the graphene (G) and reduced graphene oxide (RGO), the graphene oxide (GO) creates a highly stable aqueous dispersion.16 This property leads to increase the effective contacts with target contaminants without vigorous mechanical mixing. The dispersability properties of GO is attributed to the plenty hydrophilic functional groups covering the GO flakes.17 The GO flake surface contains various functional groups including epoxy and hydroxide, whereas the edge of flakes mainly contains the carboxylic groups.18
In recent years, using Pb2+ selective membrane electrodes (ISE) have been extensively studied with different active materials to determine lead ion concentration in water and wastewater.19,20 The active materials are mainly consisting of ligands or Schiff bases, which are known as ionophores.21 It has been revealed that some ionophores such as anthraquinone,22–24 methacrylate,25 and nucleic acids26 have the selective affinity to lead ion. The main drawback regarding to the most of ionophores is their hydrophobic nature which makes them unusable to create aqueous solution for the lead ion removal.27 Using GO flakes as the aqueous dispersion agents can provide an appropriate platform for the attachment of ionophores and producing a water dispersible GO-ionophore composite.
1,8-Dihydroxyanthraquinone (DHAQ), namely Dantron is a dye intermediate and a medicine.27,28 Furthermore, some works report the high affinity of DHAQ as a ligand to form stable complexes with Pb2+.20,24 In this study, DHAQ was used as an ionophore agent in the structure of Fe3O4@SiO2–GO to form the Fe3O4@DHAQ_GO nanocomposite and aimed to have Pb2+ selective removal property from aqueous solutions.
2. Materials and methods
2.1. Materials
Graphite powder (particle size 20 μm), tetraethyl orthosilicate (TEOS), (3-aminopropyl) triethoxysilane (APTES), n-hydroxysuccinimide (NHS), 1-ethyl-3-(3-dimethyl aminopropyl) carbodiimide (EDC·HCl), and 1,8-dihydroxyanthraquinone (DHAQ) were purchased from Sigma-Aldrich, Ltd. Co. All other chemicals such as sodium nitrate (NaNO3), potassium permanganate (KMnO4), sulfuric acid (H2SO4), hydrochloric acid (HCl), hydrogen peroxide aqueous solution (H2O2), iron chloride hexahydrate (FeCl3, 6H2O), and iron chloride tetrahydrate (FeCl2, 4H2O) were of reagent grade and used without further purification.
2.2. Preparation of Fe3O4@SiO2_GO
Our previous work reported the fabrication of graphene oxide (GO), Fe3O4 magnetic nanoparticles, Fe3O4@SiO2_NH2 nanoparticles, and Fe3O4@SiO2_GO nanocomposite.1 The preparation of GO was based on using sulfuric acid as digestion agent, and H2O2 for the oxidation of graphite.29 Co-precipitation method was used to prepare Fe3O4 magnetic nanoparticles.30 Then, NH2-groups were applied as linkers to create covalent bonds between Fe3O4 magnetic nanoparticles and GO. Consequently, covering APTES and TEOS on the Fe3O4 magnetic nanoparticles produces Fe3O4@SiO2_NH2.31,32 Finally, a condensation reaction between the carboxylic groups (COO–) of GO and the amine groups (NH2–) of Fe3O4@SiO2 was prepared for the fabrication of Fe3O4@SiO2_GO nanocomposite.32
2.3. Preparation of Fe3O4@DHAQ_GO
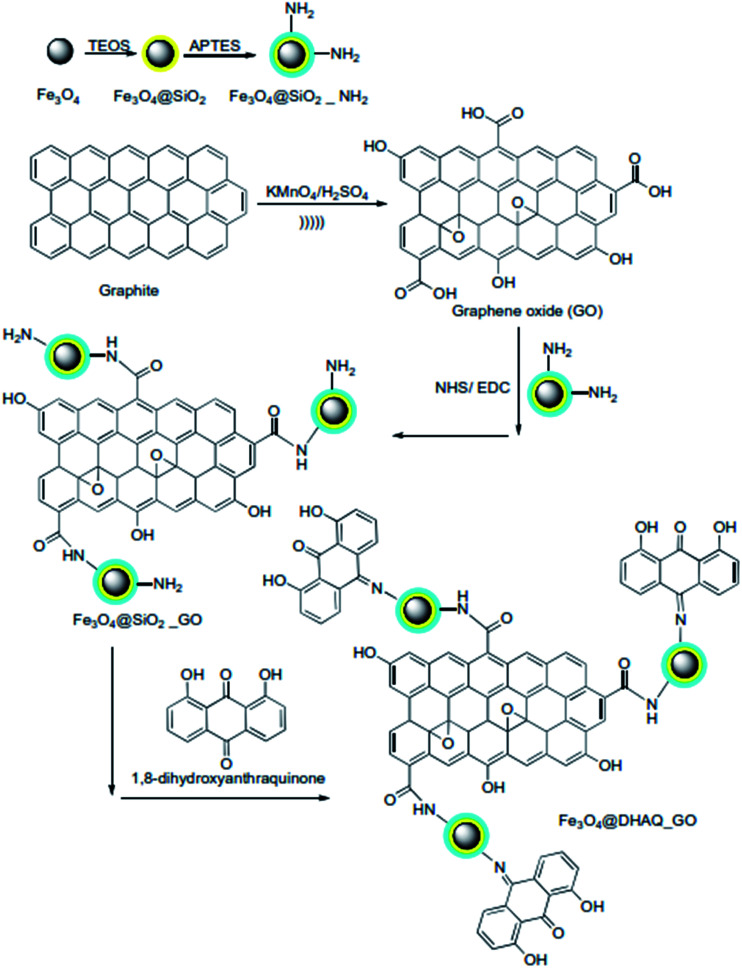
200 mg DHAQ was added into 50 mL DMF followed by mild stirring for 3 hours. Then, 200 mg EDS and 100 mg NHS were added and pH was adjusted between 4 to 6 followed by vigorous mixing for 2 hours at room temperature. After that, 0.5 g Fe3O4@SiO2_GO was dispersed into the mixture and mixing was continued up to 12 hours. Finally, dispersed solid was separated via centrifuge (12 000 rpm, 10 min), washed with deionized water, and dried to obtain Fe3O4@DHAQ_GO. Schematic of the synthesis path applied for the fabrication of Fe3O4@DHAQ_GO nanocomposite was presented in Fig. 1. As revealed, 1,8-dihydroxyanthraquinone attaches to amine group linked with Fe3O4 nanoparticle.
Fig. 1. Schematic of the chemical path to synthesis Fe3O4@DHAQ_GO nanocomposite.
2.4. Instrumentation
The prepared nanocomposite was characterized applying SEM (MIRA3, TESCAN®, Czech), AFM (SPM, VEECO®, USA), FTIR (Spectrum One, Perkin-Elmer®, USA), XRD (Philips®, Netherlands), UV-Visible spectrophotometer (Perkin-Elmer®, USA), TEM (EM900, Zeiss®, Germany), TGA (TGA 4000, Perkin-Elmer®, USA), and pHpzc. The initial and final concentration of Hg(ii) were measured by using an ICP-OES (ARCOS, SPECTRO®, Germany). pH was adjusted by using a MITEC-965 (micra®, India) pH meter. A thermostatic shaker (Innova 4340, Eppendorf, Germany) was used to study the batch experiments.
2.5. Characterization
A Hitachi-S4160 scanning microscope were used to provide SEM images (Tokyo, Japan). The AFM measurements were obtained by using a Nanoscope V multimode atomic force microscope (Veeco Instruments, USA). Samples prepared for the AFM measurements contained dispersions of GO/methanol solutions (70 mg mL−1) smeared on a fresh mica surface and allowed drying in the air.33
2.6. Adsorption experiments
A typical adsorption experiment was established by adding 10 mg Fe3O4@DHAQ_GO into a 100 mL solution containing Pb2+ ions at room temperature. Varied initial concentrations of Pb2+, from 1 mg L−1 to 10 mg L−1, were used and for all the Pb2+ aliquots, the pH value was kept on 7 applying buffer solutions. The mixing rate was constant at 150 rpm for the all solutions.
An external magnetic field was used for the removal of adsorbent after the adsorption time. The equilibrium adsorption capacity (qe, mg g−1) of Pb2+ was determined by the following equation.
 |
1 |
where, C0 and Ct are the Pb2+ initial and final concentrations (mg L−1), xads is the adsorbent mass (g), V is the reactor volume (L), and 1000 is a conversion factor.
A Spectro Arcos ICP-optical emission spectrometer (SPECTRO Analytical Instruments, Kleve, Germany) was used for the measurement of Pb2+ concentrations.
The parameters of isotherm and kinetic equations were determined by applying Solver engine of Microsoft Excel spreadsheet software34 based on nonlinear forms of the equations.
2.7. Selectivity study
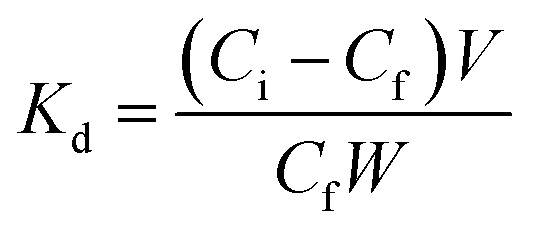
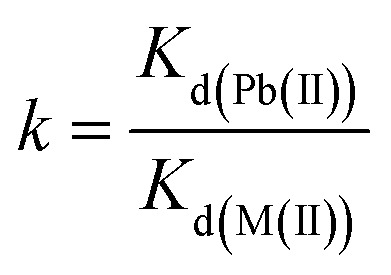
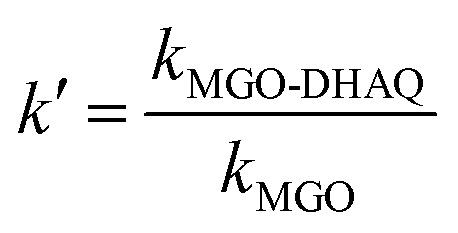
Two independent studies were conducted to investigate the capability of Fe3O4@DHAQ_GO nanocomposite for the selective capturing of Pb2+ from water: binary ion study; including aliquots contained binary ion matrices (Pb2+/Cu2+, Pb2+/Cd2+, Pb2+/Zn2+, and Pb2+/Co2+) and selective removal of Pb2+ from natural water samples; including drinking water samples spiked with Pb2+ ions. The concentration of metal ions was measured by using ICP-OES. The distribution coefficient Kd (mL g−1), selectivity coefficient k, and the relative selectivity coefficient k were determined by eqn (2)–(4), respectively.
 |
2 |
 |
3 |
 |
4 |
where, Ci and Cf are the initial and final concentrations of metal ions, respectively. Kd(Pb(II)) and Kd(M(ii)) are the distribution coefficient of Pb2+ and metal (M) ions, respectively. kMGO-DHAQ and kMGO are the selectivity coefficient of Fe3O4@DHAQ_GO and Fe3O4@SiO2–GO, respectively.
2.8. Desorption and regeneration
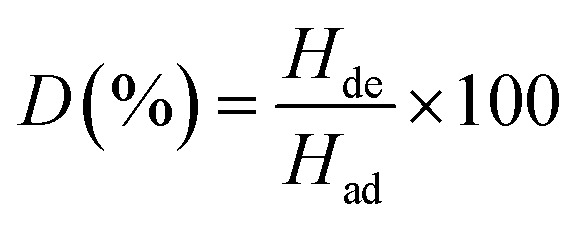
Pb2+ in solution (25 mL, 2.45 mg L−1) was adsorbed onto Fe3O4@DHAQ_GO (30 mg L−1) at pH 7 for 1 h and then the adsorbents were separated by applying an external magnetic field and the residual quantity of metal ions was determined by ICP-OES. After that, the adsorbents were regenerated in 25 mL Erlenmeyer flask containing 10 mL 0.02 mol L−1 eluent to completely leach metal ions at room temperature for 6 h. The concentration of metal ions released from adsorbent into the aqueous phase was measured by ICP-OES. Desorption ratio (D) was determined by using the following equation:
 |
5 |
where, Hde (mg L−1) is the amount of metal ion desorbed into the elution medium. Had (mg L−1) is the amount of metal ion adsorbed onto the Fe3O4@DHAQ_GO nanocomposite.
3. Results and discussion
It is well known that various derivatives of anthraquinone are able to form stable complexes with a variety of metal ions in some non-aqueous solvents35,36 and anthraquinone–lead(ii) complexes are among the most stable ones.37,38 Applying the graphene oxide provides the active sites for the anthraquinone that can be covalently bonded and produced a hydrophilic property which is appropriate for the adsorption of Pb2+ in the aqueous solution.
3.1. Characterization studies
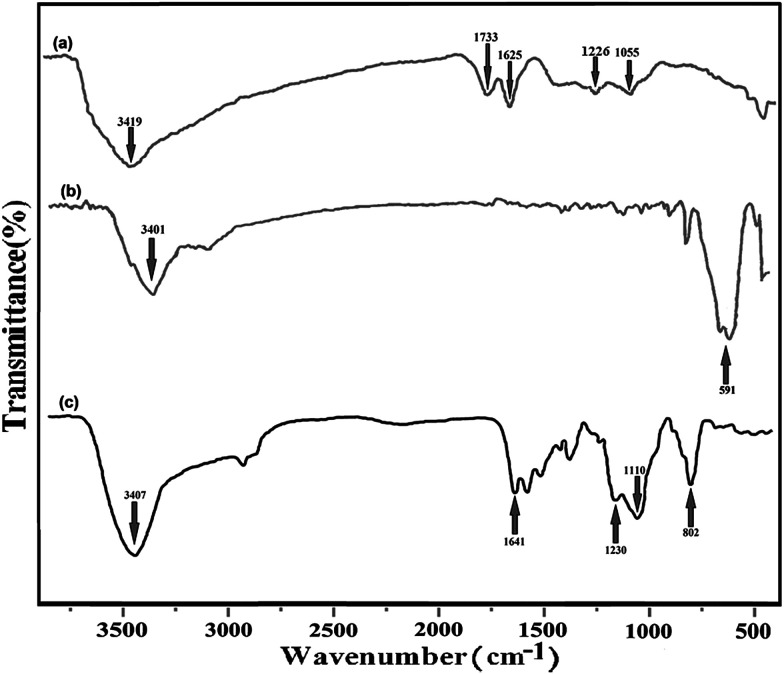
The FT-IR spectra for GO, Fe3O4@SiO2–GO, and Fe3O4@DHAQ_GO are presented in Fig. 2. The stretchings C–O (1055 cm−1), C–OH (1226 cm−1), C–O carbonyl (1733 cm−1), and O–H hydroxide (3419 cm−1)39–41 can be observed in the FT-IR spectrum of GO (Fig. 2(a)). The stretching assigned to the adsorbed water molecules is observed at 1621 cm−1 assigning also to the skeletal vibrations of un-oxidized graphite.42,43
Fig. 2. FT-IR spectra of GO (a), Fe3O4@SiO2–GO (b), and Fe3O4@DHAQ_GO (c).
In Fig. 2(b), the spectrum of Fe3O4@SiO2–GO is depicted. It shows the vibration of Fe–O stretching at 591 cm−1 and an intense stretching around 3400 cm−1. Although, it can be attributed to the remaining water on the surfaces of Fe3O4 nanoparticles.44
Fig. 2(c) depicts the FT-IR spectrum of Fe3O4@DHAQ_GO. As shown, a vibration is observed at 3401 cm−1 assigning to the N–H stretching. Furthermore, the peak at 1733 cm−1, observed in Fig. 2(a), is disappeared and a new wide peak of C N stretching is appeared at 1641 cm−1. The vibration of C–N stretching is appeared at 1230 cm−1.45 The obvious peaks at 802 and 1110 cm−1 can be attributed to the Si–O vibrations. The FTIR spectra confirmed that APTES functionalized Fe3O4 has been bonded covalently to GO nanosheets via the amide linkage.46
Fig. S1† depicts field emission SEM images of GO, Fe3O4@SiO2–GO, and Fe3O4@DHAQ_GO nanoparticles. From Fig. S1(a),† it can be observed that GO is partially transparent and 2- or 3-layered graphene oxides are formed.47,48 From Fig. S1(b),† the spherical Fe3O4@SiO2–NH2 nanoparticles having 50–60 nm diameters are identified, which finally have been enveloped by GO layers producing aggregated morphologies of Fe3O4@DHAQ_GO as shown in Fig. S1(c)†.
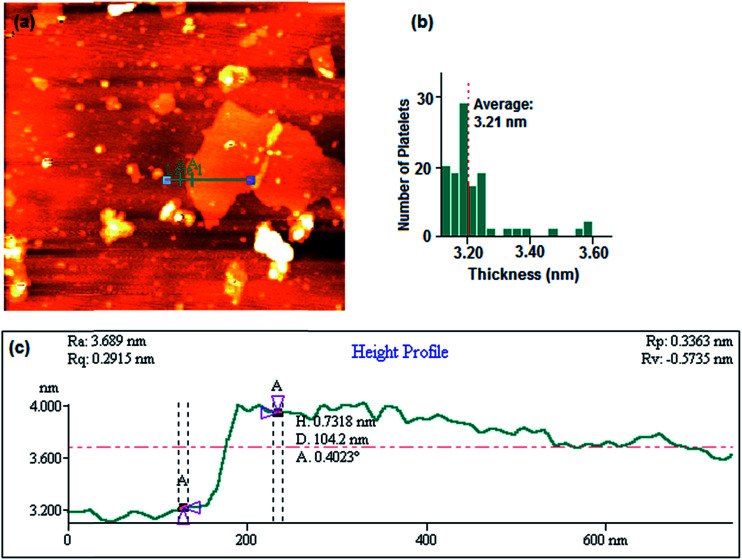
Fig. 3 illustrates the tapered mode AFM topography scan. A single platelet of GO laid on a freshly cleaved mica surface can be observed in Fig. 3(a) and (b) represents a frequency histogram of platelets thicknesses having the mean thickness of 3.21 nm. Height profile of the green line (Line 1 in Fig. 3(a)) presents a height of 0.732 nm in cross-section A–A as shown in Fig. 3(c).
Fig. 3. Tapered mode AFM topography scan. Exfoliated graphene oxide deposited on a freshly cleaved mica surface (a), histogram of platelet thicknesses from images of 138 platelets (the mean thickness is 3.21 nm) (b), height profile through the green line (Line 1) presented in (a). Cross-section A–A through the sheet shown in (a) exhibiting a height of 0.732 nm (c).
Fig. S2† presents thermal gravimetric analysis (TGA) of Fe3O4 magnetic nanoparticles, Fe3O4@SiO2–GO, Fe3O4@DHAQ_GO, and graphene oxide. As revealed, major weight losses were occurred between 150 and 350 °C attributing to CO, CO2 released from labile functional groups.48,49 Slower rate of mass loss was detected between 350 and 650 °C assigning to the removal of some stable oxygenated functional groups. Similar trends of weight loss were observed in Fe3O4@SiO2–GO and Fe3O4@DHAQ_GO. The Fe3O4@DHAQ_GO weight loss was 13.5% more than those of Fe3O4@SiO2–GO in 740 °C attributing to the presence of 1,8-dihydroxyanthraquinone in the structure of Fe3O4@DHAQ_GO.50
Fig. S3† shows the XRD patterns of GO and Fe3O4@SiO2–GO. GO sharp diffraction peaks observable at 2θ = 12.24° and 42.83° are attributed to the reflections of (002) and (101), respectively. Furthermore, six typical peaks at about 2θ = 30.4, 35.6, 43.1, 54.1, 57.7 and 62.5° are observed for Fe3O4@SiO2–GO, attributing to indices (220), (311), (400), (422), (511) and (440), respectively. Appropriate match of intensities and positions of above mentioned diffraction peaks confirming by pure magnetite JCPDS card (75-1610).51 As represented in XRD patterns corresponding to Fe3O4@SiO2–GO, the reflection peak (002) belonging to GO was disappeared. It is assumed that the GO sheets cover the Fe2O3 nanoparticles and it hinders the stacking of sheets to create a crystalline arrangement.52
The vibration sample magnetization (VSM) was used to determine the magnetic characteristics of fabricated materials contained Fe3O4. Fig. S4† shows that the maximum saturation magnetizations of Fe3O4 NPs, Fe3O4-APTES, GO@SiO2–Fe3O4, and Fe3O4@DHAQ_GO were 53.2, 40.1, 19.7, and 13.5 emu g−1, respectively. Decreasing the maximum saturation magnetizations can be ascribed to the Fe3O4 nanoparticles covering consecutively by APTES, SiO2–GO, and DHAQ.
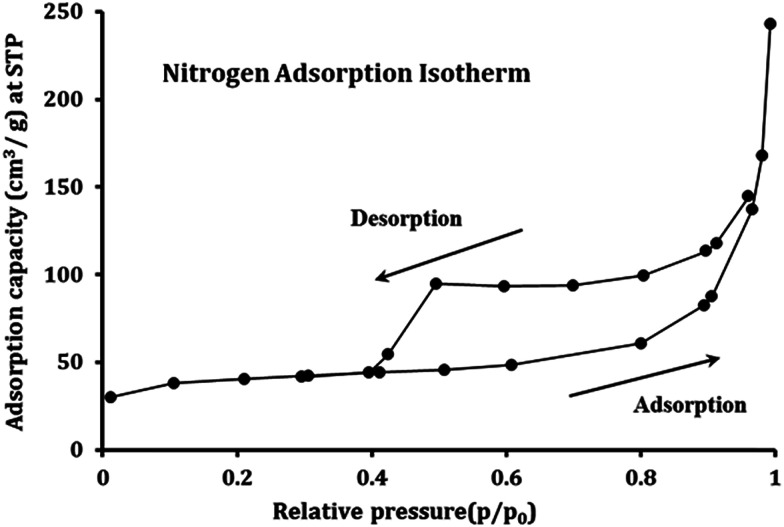
Fig. 4 presents the nitrogen adsorption isotherm of Fe3O4@DHAQ_GO nanocomposite. The surface area of 215 m2 g−1 was obtained that is relatively lowered than those reported for pristine GO.53 It seems that the agglomeration of Fe3O4 NPs and GO nanosheets tend to an shrinking effect on the GO nanosheets causing the decrease of free surface area48 as observed in Fig. S1.† The average pore size of Fe3O4@DHAQ_GO was determined to be about 9.26 nm identifying the mesopore structure of the adsorbent.
Fig. 4. Nitrogen adsorption–desorption isotherms for Fe3O4@DHAQ_GO nanocomposite.
3.2. Adsorption experiments
3.2.1. Adsorption isotherm
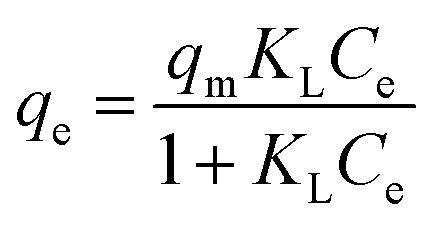
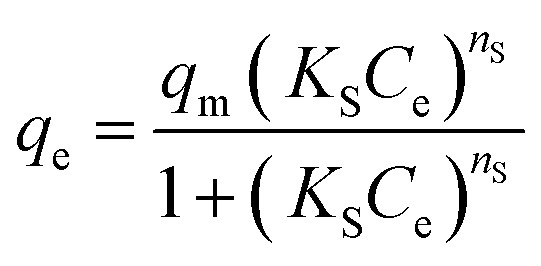
The isotherm models Langmuir (eqn (6)), Freundlich (eqn (7)), and Sips (eqn (8)) were applied to investigate the effect of equilibrium concentrations of Pb2+ (Ce) on the equilibrium adsorption capacities (qe) of Fe3O4@DHAQ_GO nanocomposite.
 |
6 |
| qe = KfC1/neF | 7 |
 |
8 |
where, KL is the Langmuir adsorption constant (L mg−1) and qm represents the maximum adsorption capacity attributing to the complete monolayer coverage of the adsorbent (mg g−1). Furthermore, KF (mg g−1) and nF (unit less) are the Freundlich constants. KS (L g−1) and nS are the Sips equation parameters denoting the affinity constant and surface heterogeneity, respectively.54,55
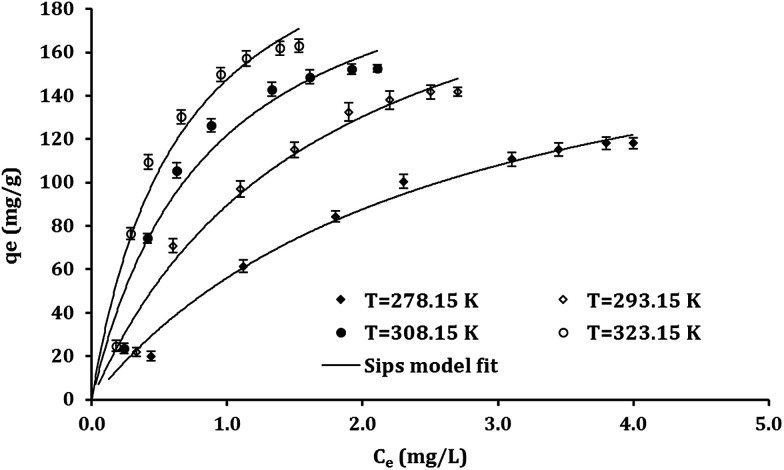
As represented from Table 1, the R2 values indicated that Sips model has better fit with the experimental results then Langmuir and Freundlich models. Fig. 5 depicts the nonlinear functions of Sips model fitted to the experimental points obtained from the batch studies in different temperatures.
Model parameters obtained from non-linear fitting the experimental equilibrium data with the isotherm models (adsorbent dosage 55 mg L−1, pH 7, contact time 60 min).
| T (K) | q exp (mg g−1) | Langmuir | Freundlich | Sips | |||||||
|---|---|---|---|---|---|---|---|---|---|---|---|
| q m (mg g−1) | K L | R L 2 | n F | K F | R F 2 | q m (mg g−1) | K S | n S | R 2 | ||
| 278 | 118 | 200.7 | 0.38 | 0.98 | 1.7 | 55.5 | 0.97 | 119.1 | 0.76 | 1.61 | 0.99 |
| 293 | 141 | 239.4 | 0.59 | 0.96 | 1.7 | 85.3 | 0.96 | 142.5 | 1.24 | 1.69 | 0.98 |
| 308 | 152 | 225.3 | 1.17 | 0.93 | 2.01 | 114 | 0.93 | 151.6 | 2.12 | 2.36 | 0.99 |
| 323 | 163 | 243.1 | 1.54 | 0.93 | 1.96 | 142 | 0.93 | 164.3 | 3.06 | 2.38 | 0.99 |
Fig. 5. Adsorption isotherms of Pb2+ on Fe3O4@DHAQ_GO nanocomposite at different temperatures. (Adsorbent dosage 100 mg L−1; volume of solution 100 mL; pH 7; Pb2+ initial concentration range 1–10 mg L−1). Points: experimental data at given temperature, lines: Sips model.
The Sips equation containing three parameters having the capability to apply for both the homogeneous and heterogeneous systems.56 The surface heterogeneity of adsorbent should be considered if the deviation of nS values from 1 is observed.55,57 However, the Sips isotherm reach a constant level at high concentrations while a pattern of Freundlich model can be observed at low concentrations.57
As revealed from Table 1, the Pb2+ adsorption capacities of Fe3O4@DHAQ_GO nanocomposite were increased by the increasing of temperature assigning to decrease water viscosity along with the increasing of Pb2+ collisions between the sites of nanocomposite and Pb2+ ions. The maximum adsorption capacities (qm) obtained by Langmuir isotherm were overestimated (e.g. 243.1 in 323 K) while those of Sips model (e.g. 164.3 in 323 K) represents a good fit to the experimental data (also, see Fig. 5) which can be due to the heterogeneity characteristic considered in the Sips model.58 Increasing the deviations of nS and nF values from unity can be assigned to develop the nanocomposite surface heterogeneity over raising the temperature.57
3.2.2. Kinetic studies
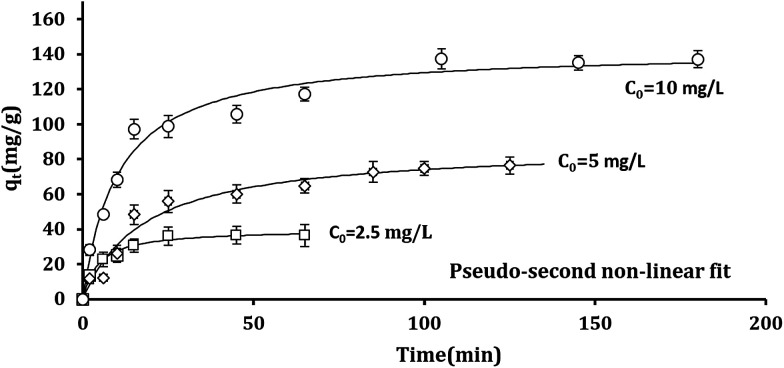
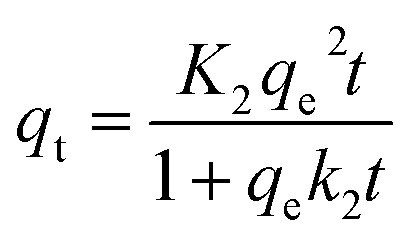
The sorption capacities (qt) of Fe3O4@DHAQ_GO exposed with Pb2+ initial concentrations 2.5, 5, and 10 mg L−1 were studied over corresponding times. The kinetic models; Lagergren-first-order (eqn (9)) and pseudo-second-order (eqn (10)) were applied for determining the appropriate function to describe the kinetic behavior of the batch systems.
| qt = qe(1 − exp(−k1t)) | 9 |
 |
10 |
where, qt and qe are the sorption capacity (mg g−1) at time t and at the equilibrium time, respectively. k1 and k2 correspond to the pseudo-first-order and pseudo-second-order rate constants, respectively.59,60
Fig. 6 illustrates fitting the non-linear forms of pseudo-second kinetic model to the experimental points. As shown, the equilibrium was took place sooner for the batch systems underwent lower Pb2+ initial concentrations.
Fig. 6. Nonlinear forms of pseudo-second kinetic model fitted on experimental points at different Pb2+ initial concentrations (adsorbent dosage 100 mg g−1; volume of solution 100 mL; pH 7; T = 298 K).
Table S1† presents kinetic parameters of Pb2+ removal obtained by using the non-linear forms of pseudo-first and pseudo-second kinetic models (eqn (9) and (10)). As found in Table S1,† according to the R2 values, the pseudo-second model has better fit to the experimental points and K2 are increased by increasing the temperature, both are the evidences favor the chemisorption occurring.61–63
3.2.3. Thermodynamic parameters
Changing in free energy (ΔG0), enthalpy (ΔH0), and entropy (ΔS0) can be determined by the following equations:
| ΔG0 = −RT ln Kc | 11 |
 |
12 |
where, R is the gas constant (8.314 J mol−1 K−1), Kc (qe/Ce) is equilibrium constant at different temperatures, and T is the absolute temperature (K). Eqn (11) calculates ΔG0 values assigning to the obtained temperature shown in Table 2.
Thermodynamic parameters for the adsorption of Pb2+ onto the Fe3O4@DHAQ_GO nanocomposite (adsorbent dosage 55 mg L−1, contact time 60 min, pH 7).
| T | K L (L g−1) | q m (mg g−1) | ΔG0 (kJ mol−1) | ΔS0 (J mol−1 K) | ΔH0 (kJ mol−1) |
|---|---|---|---|---|---|
| 278 | 0.388 | 200.7 | −13.79 | 135.97 | 24.07 |
| 293 | 0.598 | 239.4 | −15.58 | — | — |
| 308 | 1.178 | 225.3 | −18.12 | — | — |
| 323 | 1.546 | 243.1 | −19.73 | — | — |
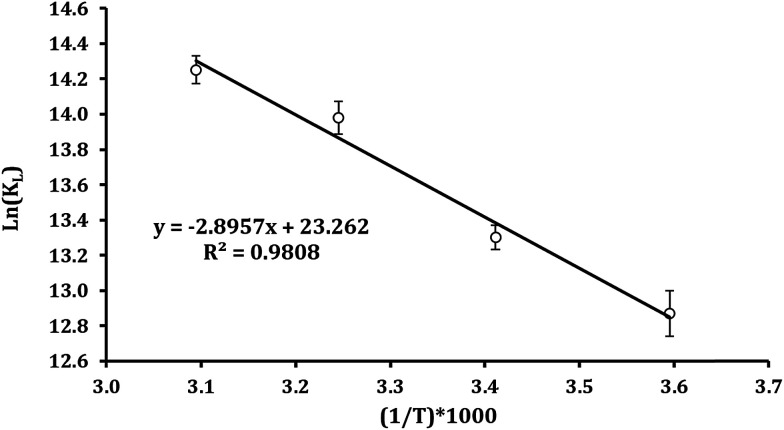
Enthalpy (ΔH0) and entropy (ΔS0) can be determined by plotting ln(Kc) versus 1/T as revealed in Fig. 7. Furthermore, (ΔH0) and (ΔS0) can obtained be from the slope and intercept of linear form of eqn (12), respectively.64–66
Fig. 7. Effect of temperature on the adsorption of Pb2+ ions by Fe3O4@DHAQ_GO nanocomposite.
Table 2 represents that ΔG0 has negative amounts assigning to different temperatures. So, it can be concluded that Pb2+ adsorption on Fe3O4@DHAQ_GO nanocomposite proceeds spontaneously.
Fan et al. (2013) found that obtained ΔG0 is ranged from −10.26 to −16.24 kJ mol−1 at 303–323 K.67 Also, Kumar et al. (2014) reported that the changes of free energy ΔG0 at 298 K are −6.46 kJ mol−1. As shown in Table 2, ΔG0 is −19.73 kJ mol−1 at 323 K having an appropriate agreement with the findings of Fan et al. (2013). Similar finding were reported by other researchers.68–70
As represented in Table 2, increasing the temperature tends to lower values assigned to ΔG0 confirming that the adsorption is more efficient at the higher temperatures.71,72 The enthalpy (ΔH0) value was 24.07 kJ mol−1 having the positive value of ΔH0 that indicates the endothermic nature of the adsorption. The entropy (ΔS0) was obtained with a positive value proving the increase of randomness during Pb2+ adsorption process.73,74
3.3. Selectivity study
Two independent studies were conducted to evaluate the selectivity properties of Fe3O4@DHAQ_GO nanocomposite for the separation of Pb2+ ions from aqueous ion matrices. The first one was capturing Pb2+ ions from four different aqueous solutions so that each solution contains Pb2+ and one other divalent metal ion. Consequently, four binary ion matrices were prepared, including Pb2+/Cu2+, Pb2+/Cd2+, Pb2+/Zn2+, and Pb2+/Co2+.
The second study was conducted for the assessment selective removal of Pb2+ in drinking water samples containing natural ion matrices. Certain amounts of Pb2+ ion were spiked into 30 different drinking water samples collected from various groundwater sources. Batch experiments were conducted based on the optimized values of variables pH, dosage, temperature, and the initial concentration.
3.3.1. Selective removal of Pb2+ from binary ion matrices
The above mentioned aliquots containing binary ions were exposed to the functionalized (Fe3O4@DHAQ_GO) and pristine (GO@SiO2–Fe3O4) nanocomposite through independent batch experiments. Table 3 shows the results of distribution coefficient Kd (mL g−1), selectivity coefficient k, and the relative selectivity coefficient k obtained from eqn (2)–(4), respectively. As observed, the values of selectivity coefficient k is more than 19 for all binary ion comparisons. It means that Fe3O4@DHAQ_GO nanocomposite has a more notable preference for capturing Pb2+ ions compared with that of coexistence ions. For instance, Fe3O4@DHAQ_GO nanocomposite could capture Pb2+ ions 19.66 times more selectively than Cu2+ ions. Cai et al. reported a k value of 11.66 for Pb2+/Cu2+ binary ions. Furthermore, Msaadi et al. and Zhu et al. reported similar findings for Pb2+ ions removal using ion-imprinted nanocomposites.75,76
Selectivity parameters of Pb2+ comparative loading by Fe3O4@DHAQ_GO and Fe3O4@SiO2–GO sorbents at pH 7, and T = 298 K (acetic acid/sodium acetate buffer).
| Metal ion | Fe3O4@DHAQ_GO | GO@Fe3O4 | K | ||||
|---|---|---|---|---|---|---|---|
| q e (mg g−1) | k d (L g−1) | K Fe3O4@DHAQ_GO | q e (mg g−1) | k d (L g−1) | k GO@SiO2–Fe3O4 | ||
| Pb2+ | 132 | 41.88 | 19.37 | 47 | 8.14 | 0.99 | 19.66 |
| Cu2+ | 15 | 2.16 | 50 | 8.26 | |||
| Pb2+ | 133 | 36.81 | 31.89 | 37 | 5.74 | 1.34 | 23.72 |
| Ni2+ | 9 | 1.15 | 30 | 4.27 | |||
| Pb2+ | 123 | 34.73 | 19.41 | 24 | 3.67 | 0.71 | 27.20 |
| Co2+ | 12 | 1.79 | 32 | 5.15 | |||
| Pb2+ | 119 | 32.38 | 15.09 | 21 | 3.21 | 0.58 | 26.09 |
| Cd2+ | 15 | 2.15 | 35 | 5.54 | |||
3.3.2. Selective removal of Pb2+ from drinking water samples
Table S2† shows a set of multiple regression models ranked according the Akaike's Information Criterion (AIC). Table 4 represents the coefficients of the model obtained rank 1 in Table S2.† As observed, cations formed the drinking water matrices (Na+, K+, Ca2+, Mg2+) obtained negative values confirming their competition with Pb2+ ion to occupy the active sites of Fe3O4@DHAQ_GO nanocomposite. The large value assigned to the intercept (105.47) ensured notable preference of Fe3O4@DHAQ_GO nanocomposite for the separation of Pb2+ ion from drinking water.
Ranking list of linear multiple regression models applied to describe the effect of main natural water ions on mercury removal efficiency by Akaike's Information Criterion (AIC).
| Model elementsa | Coefficient | Standard error | T value | Pr(>|t|) | P-value |
|---|---|---|---|---|---|
| Intercept | 105.47 | 5.23 | 20.15 | 0.0001 | 0.001 |
| NO3− | 0.70 (a) | 0.43 | 1.62 | 0.120 | 0.1 |
| SO42− | 0.17 (b) | 0.05 | 2.8 | 0.009 | 0.001 |
| Cl− | 0.31 (c) | 0.08 | 3.66 | 0.001 | 0.001 |
| HCO3− | 0.15 (d) | 0.04 | 3.51 | 0.002 | 0.001 |
| Na+ | −0.29 (e) | 0.14 | −1.95 | 0.064 | 0.05 |
| K+ | −0.47 (f) | −0.27 | −1.75 | 0.093 | 0.05 |
| Mg2+ | −1.15 (g) | −0.29 | −3.89 | 0.0008 | 0.001 |
| Ca2+ | −0.73 (h) | −0.15 | −4.69 | 0.0001 | 0.001 |
Multiple R2: 0.81, adjusted R2: 0.73.
3.4. Desorption and regeneration
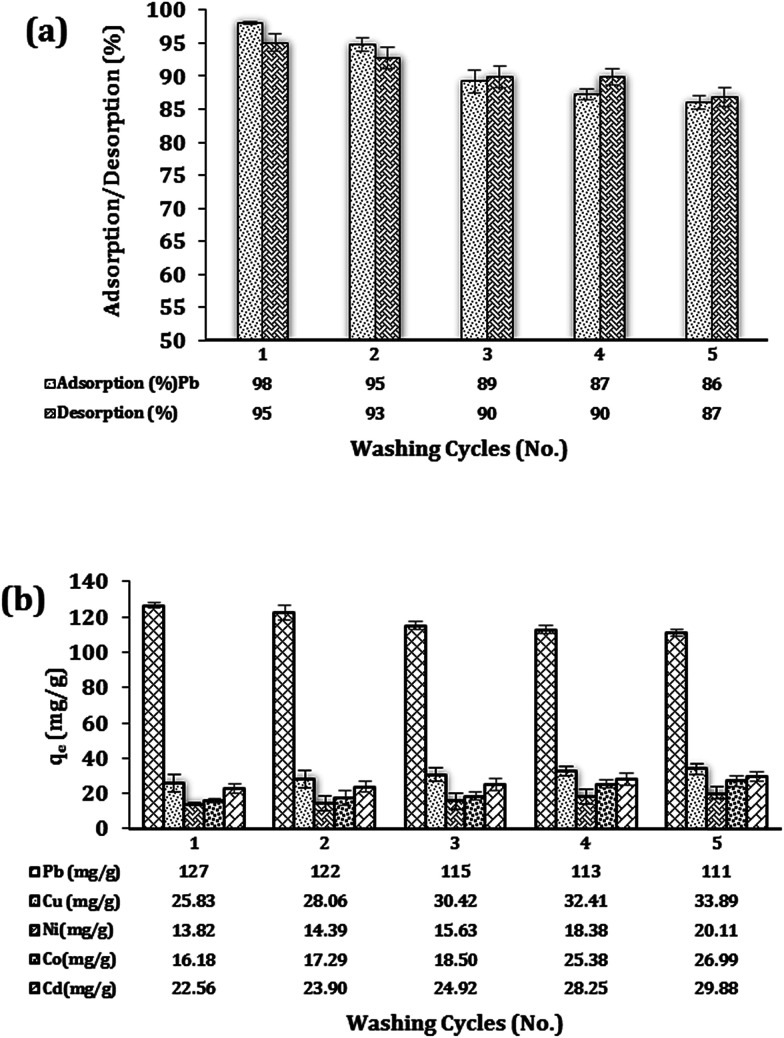
Fig. 8(a) depicts the repeated adsorption/desorption of Pb2+ ions using batch experiments exposed with Fe3O4@DHAQ_GO nanocomposite in single ion aqueous solution. As shown, after 5 consecutive regeneration steps, the nanocomposite could remove 86 percent of Pb2+ ions so that only 12 percent of removal loss was observed.
Fig. 8. Reusability studies; repeated adsorption/desorption of Pb2+ by Fe3O4@DHAQ_GO nanocomposite (a). The consecutive adsorption capacities (mg g−1) of Fe3O4@DHAQ_GO nanocomposite for Pb(ii), Cu(ii), Ni(ii), Co(ii), and Cd(ii) ions during the five adsorption/desorption cycles (b). C0 ≃ 50 mg L−1, adsorbent dosage = 0.4 g L−1, pH 7, contact time 30 min, desorption agent: EDTA-2Na 0.01 N.
Fig. 8(b) shows the results of Fe3O4@DHAQ_GO regeneration study in an aqueous ion matrix consisting of five divalent metals. This experiment aims to investigate the presence of four coexistence ions (Cu2+, Ni2+, Co2+, Cd2+) in the case of their effect on lead removal and to assess the capability of the nanocomposite for the retaining of lead adsorption capacity after several washing steps in the presence of other cations. As observed, the removal capacities of Pb2+ ion was remained more than 111 mg g−1 over five regeneration steps using the desorption agent EDTA-2NA 0.01 N. Furthermore, increasing the sorption capacity assigned to the four coexistence ions were almost negligible confirming the notable stability of the nanocomposite structure over several regeneration experiments.
The stability of the Pb2+ and Fe3O4@DHAQ_GO complex was confirmed via the adsorption/desorption experiments. The conventional methods for evaluating the regeneration and reusability of adsorbents are according to the consecutive adsorption/desorption steps in batch volumes containing deionized water solution inoculated with the target pollutant. Consequently, the effects of coexistence ions are neglected, especially when the reusability of adsorbents having selectivity properties is considered.77
Here, we put forward a facile approach to investigate the reusability of Fe3O4@DHAQ_GO in aqueous ion matrices containing different competitor divalent cations (Fig. 8). Yu et al. reported applying EDTA-2Na 0.015 N as washing agent over three cycles regeneration steps. Results showed the notable interference of Cd2+ (ref. 78) while, in our work, the minimum interfering of the coexistence cations was observed.
4. Conclusions
In this work, a novel hydrophilic nanocomposite based on GO was synthesized comprising an anthraquinone derivative having selective removal capability for lead. Fe3O4 nanoparticles was used as a magnetic agent to facilitate the separation of nanocomposite from aqueous solution. Also, GO was used as a dispersible platform to obtain the hydrophilic property for the nanocomposite and preparing enough surface area to proceed the adsorptive mechanisms. The morphology and structure of the obtained adsorbent was characterized by UV-Vis, FT-IR, SEM, XRD, and TGA. The synthesis rout was simple and DHAQ was an environmental friendly compound without toxic effect. The selectivity characteristics of the nanocomposite was evaluated through two different methods including controlled ion matrices and the natural ion matrices obtained from drinking water samples. Furthermore, the regeneration and reusability studies were conducted in the presence of coexistence ions. It seems that Fe3O4@DHAQ_GO nanocomposite can be a promising selective removal agent for the removal of lead from polluted waters and industrial discharges.
Conflicts of interest
There are no conflicts to declare.
Supplementary Material
Acknowledgments
This research was part of a PhD dissertation of the first author and has been financially supported by a grant (No. 28232-27-01-94) from Tehran University of Medical Sciences, Tehran, Iran. The authors would like to express their thanks to the Department of Environmental Health Engineering, School of Public Health, Tehran University of Medical Sciences for their collaboration.
Electronic supplementary information (ESI) available. See DOI: 10.1039/c7ra13603j
References
- Khazaei M. Nasseri S. Ganjali M. R. Khoobi M. Nabizadeh R. Mahvi A. H. Nazmara S. Gholibegloo E. J. Environ. Health Sci. Eng. 2016;14:1. doi: 10.1186/s40201-016-0243-1. [DOI] [PMC free article] [PubMed] [Google Scholar]
- WHO, Journal, 2003
- EPA, Drinking Water Contaminants, http://www.epa.gov/safewater/contaminants/index.html, 1/30/2010., (accessed 9/13/2015, 2015)
- ISIRI, Journal, 2014
- Karimi H. International Journal of Water and Wastewater Treatment. 2017;3 [Google Scholar]
- Li Q., Liu T. and Deng P., in, Characterization of Minerals, Metals, and Materials, Springer, 2015, pp. 667–674 [Google Scholar]
- Kamaraj R. Ganesan P. Vasudevan S. Int. J. Environ. Sci. Technol. 2015;12:683–692. doi: 10.1007/s13762-013-0457-z. [DOI] [Google Scholar]
- Vasudevan S. Lakshmi J. Sozhan G. Environ. Sci. Pollut. Res. 2012;19:2734–2744. doi: 10.1007/s11356-012-0773-8. [DOI] [PubMed] [Google Scholar]
- Aliyari E. Alvand M. Shemirani F. Anal. Methods. 2015;7:7582–7589. doi: 10.1039/C5AY01088H. [DOI] [Google Scholar]
- Ghadiri S. K. Nasseri S. Nabizadeh R. Khoobi M. Nazmara S. Mahvi A. H. J. Mol. Liq. 2017;242:1111–1117. doi: 10.1016/j.molliq.2017.06.122. [DOI] [Google Scholar]
- Gholami A. Moghadassi A. Hosseini S. Shabani S. Gholami F. J. Ind. Eng. Chem. 2014;20:1517–1522. doi: 10.1016/j.jiec.2013.07.041. [DOI] [Google Scholar]
- Rezaee R. Nasseri S. Mahvi A. Nabizadeh R. Mousavi S. Rashidi A. Jafari A. Nazmara S. J. Environ. Health Sci. Eng. 2015;13:1–11. doi: 10.1186/s40201-015-0157-3. [DOI] [PMC free article] [PubMed] [Google Scholar]
- Madadrang C. J. Kim H. Y. Gao G. Wang N. Zhu J. Feng H. Gorring M. Kasner M. L. Hou S. ACS Appl. Mater. Interfaces. 2012;4:1186–1193. doi: 10.1021/am201645g. [DOI] [PubMed] [Google Scholar]
- Ganesan P. Kamaraj R. Sozhan G. Vasudevan S. Environ. Sci. Pollut. Res. 2013;20:987–996. doi: 10.1007/s11356-012-0928-7. [DOI] [PubMed] [Google Scholar]
- Li W. Gao S. Wu L. Qiu S. Guo Y. Geng X. Chen M. Liao S. Zhu C. Gong Y. Sci. Rep. 2013;3:2125. doi: 10.1038/srep02125. [DOI] [PMC free article] [PubMed] [Google Scholar]
- Kim J. Cote L. J. Huang J. Acc. Chem. Res. 2012;45:1356–1364. doi: 10.1021/ar300047s. [DOI] [PubMed] [Google Scholar]
- Kim J. Cote L. J. Kim F. Yuan W. Shull K. R. Huang J. J. Am. Chem. Soc. 2010;132:8180–8186. doi: 10.1021/ja102777p. [DOI] [PubMed] [Google Scholar]
- Paredes J. Villar-Rodil S. Martinez-Alonso A. Tascon J. Langmuir. 2008;24:10560–10564. doi: 10.1021/la801744a. [DOI] [PubMed] [Google Scholar]
- Gismera M. J. Sevilla M. T. Procopio J. R. Anal. Sci. 2006;22:405. doi: 10.2116/analsci.22.405. [DOI] [PubMed] [Google Scholar]
- Tavakkoli N. Khojasteh Z. Sharghi H. Shamsipur M. Anal. Chim. Acta. 1998;360:203–208. doi: 10.1016/S0003-2670(97)00685-5. [DOI] [Google Scholar]
- Rezayi M. Karazhian R. Abdollahi Y. Narimani L. Sany S. B. T. Ahmadzadeh S. Alias Y. Sci. Rep. 2014;4 doi: 10.1038/srep04664. [DOI] [PMC free article] [PubMed] [Google Scholar]
- Barzegar M. Mousavi M. F. Khajehsharifi H. Shamsipur M. Sharghi H. IEEE Sens. J. 2005;5:392–397. doi: 10.1109/JSEN.2005.844337. [DOI] [Google Scholar]
- Li X.-G. Ma X.-L. Huang M.-R. Talanta. 2009;78:498–505. doi: 10.1016/j.talanta.2008.11.045. [DOI] [PubMed] [Google Scholar]
- Goswami A. Singh A. K. Talanta. 2002;58:669–678. doi: 10.1016/S0039-9140(02)00374-0. [DOI] [PubMed] [Google Scholar]
- Alizadeh T. Hamidi N. Ganjali M. R. Rafiei F. J. Environ. Chem. Eng. 2017;5:4327–4336. doi: 10.1016/j.jece.2017.08.009. [DOI] [Google Scholar]
- Niu X. Zhong Y. Chen R. Wang F. Liu Y. Luo D. Sens. Actuators, B. 2018;255:1577–1581. doi: 10.1016/j.snb.2017.08.167. [DOI] [Google Scholar]
- Zhang Z. Shi D. Ding H. Zheng H. Chen H. Int. J. Environ. Sci. Technol. 2015;12:3351–3362. doi: 10.1007/s13762-015-0762-9. [DOI] [Google Scholar]
- Shen Y. Xu Q. Gao D. Shi H. Ozone: Sci. Eng. 2017;39:219–232. doi: 10.1080/01919512.2017.1301245. [DOI] [PMC free article] [PubMed] [Google Scholar]
- Hummers Jr W. S. Offeman R. E. J. Am. Chem. Soc. 1958;80:1339. doi: 10.1021/ja01539a017. [DOI] [Google Scholar]
- Hamadi H. Gholami M. Khoobi M. International Journal of Heterocyclic Chemistry. 2011;1:23–34. [Google Scholar]
- Tartaj P. Serna C. J. J. Am. Chem. Soc. 2003;125:15754–15755. doi: 10.1021/ja0380594. [DOI] [PubMed] [Google Scholar]
- He F. Fan J. Ma D. Zhang L. Leung C. Chan H. L. Carbon. 2010;48:3139–3144. doi: 10.1016/j.carbon.2010.04.052. [DOI] [Google Scholar]
- Cote L. J. Kim F. Huang J. J. Am. Chem. Soc. 2008;131:1043–1049. doi: 10.1021/ja806262m. [DOI] [PubMed] [Google Scholar]
- Hossain M. A. Ngo H. H. Guo W. J. Water Sustainability. 2013;3:223–237. [Google Scholar]
- Wu F.-y. Hu M.-h. Wu Y.-m. Tan X.-f. Zhao Y.-q. Ji Z.-j. Spectrochim. Acta, Part A. 2006;65:633–637. doi: 10.1016/j.saa.2005.12.022. [DOI] [PubMed] [Google Scholar]
- Hoffman M. M. Kryjevski A. B. Sykes A. G. Kilin D. S. Mol. Phys. 2016;114:562–575. [Google Scholar]
- Riahi S. Mousavi M. Shamsipur M. Sharghi H. Electroanalysis. 2003;15:1561–1565. doi: 10.1002/elan.200302662. [DOI] [Google Scholar]
- Reza Pouretedal H. Forghaniha A. Sharghi H. Shamsipur M. Synth. React. Inorg. Met.-Org. Chem. 1998;31:2591–2605. [Google Scholar]
- Titelman G. I. Gelman V. Bron S. Khalfin R. L. Cohen Y. Bianco-Peled H. Carbon. 2005;43:641–649. doi: 10.1016/j.carbon.2004.10.035. [DOI] [Google Scholar]
- Stankovich S. Piner R. D. Nguyen S. T. Ruoff R. S. Carbon. 2006;44:3342–3347. doi: 10.1016/j.carbon.2006.06.004. [DOI] [Google Scholar]
- Abkenar S. D. Khoobi M. Tarasi R. Hosseini M. Shafiee A. Ganjali M. R. J. Environ. Eng. 2014;141:04014049. doi: 10.1061/(ASCE)EE.1943-7870.0000878. [DOI] [Google Scholar]
- Cataldo F. Fullerenes, Nanotubes, Carbon Nanostruct. 2003;11:1–13. doi: 10.1081/FST-120018670. [DOI] [Google Scholar]
- Sun X. Liu Z. Welsher K. Robinson J. T. Goodwin A. Zaric S. Dai H. Nano Res. 2008;1:203–212. doi: 10.1007/s12274-008-8021-8. [DOI] [PMC free article] [PubMed] [Google Scholar]
- Yang X. Wang Y. Huang X. Ma Y. Huang Y. Yang R. Duan H. Chen Y. J. Mater. Chem. 2011;21:3448–3454. doi: 10.1039/C0JM02494E. [DOI] [Google Scholar]
- Xu Y. Liu Z. Zhang X. Wang Y. Tian J. Huang Y. Ma Y. Zhang X. Chen Y. Adv. Mater. 2009;21:1275–1279. doi: 10.1002/adma.200801617. [DOI] [Google Scholar]
- Li Y. Wang X.-Y. Jiang X.-P. Ye J.-J. Zhang Y.-W. Zhang X.-Y. J. Nanopart. Res. 2015;17:1–12. doi: 10.1007/s11051-014-2856-6. [DOI] [Google Scholar]
- Zhao G. Ren X. Gao X. Tan X. Li J. Chen C. Huang Y. Wang X. Dalton Trans. 2011;40:10945–10952. doi: 10.1039/C1DT11005E. [DOI] [PubMed] [Google Scholar]
- Khazaei M. Nasseri S. Ganjali M. R. Nabizadeh R. Mahvi A. H. Gholibegloo E. Khoobi M. Nazmara S. Desalin. Water Treat. 2017;83:144–158. doi: 10.5004/dwt.2017.21066. [DOI] [Google Scholar]
- Stankovich S. Dikin D. A. Piner R. D. Kohlhaas K. A. Kleinhammes A. Jia Y. Wu Y. Nguyen S. T. Ruoff R. S. Carbon. 2007;45:1558–1565. doi: 10.1016/j.carbon.2007.02.034. [DOI] [Google Scholar]
- Broker G. A. Bettens R. P. A. Tiekink E. R. T. CrystEngComm. 2008;10:879–887. doi: 10.1039/B800797G. [DOI] [Google Scholar]
- Aliyari E. Alvand M. Shemirani F. RSC Adv. 2016;6:64193–64202. doi: 10.1039/C6RA04163A. [DOI] [Google Scholar]
- Tarlani Azar M. Leili M. Taherkhani F. Bhatnagar A. Desalin. Water Treat. 2016;57:24430–24443. doi: 10.1080/19443994.2016.1138890. [DOI] [Google Scholar]
- Stankovich S. Dikin D. A. Dommett G. H. Kohlhaas K. M. Zimney E. J. Stach E. A. Piner R. D. Nguyen S. T. Ruoff R. S. Nature. 2006;442:282–286. doi: 10.1038/nature04969. [DOI] [PubMed] [Google Scholar]
- Repo E. Warchol J. K. Kurniawan T. A. Sillanpää M. E. T. Chem. Eng. J. 2010;161:73–82. doi: 10.1016/j.cej.2010.04.030. [DOI] [Google Scholar]
- Guo L. Li G. Liu J. Yin P. Li Q. Ind. Eng. Chem. Res. 2009;48:10657–10663. doi: 10.1021/ie9010782. [DOI] [Google Scholar]
- Repo E. Warchoł J. K. Bhatnagar A. Sillanpää M. J. Colloid Interface Sci. 2011;358:261–267. doi: 10.1016/j.jcis.2011.02.059. [DOI] [PubMed] [Google Scholar]
- Repo E., Doctor of Science, Lappeenranta University of Technology Laboratory of Green Chemistry, 2011 [Google Scholar]
- Ma Y. La P. Lei W. Lu C. Du X. Desalin. Water Treat. 2016;57:5004–5012. doi: 10.1080/19443994.2014.998292. [DOI] [Google Scholar]
- Dalvand A. Gholibegloo E. Ganjali M. R. Golchinpoor N. Khazaei M. Kamani H. Hosseini S. S. Mahvi A. H. Environ. Sci. Pollut. Res. 2016;23:16396–16405. doi: 10.1007/s11356-016-6708-z. [DOI] [PubMed] [Google Scholar]
- Vasudevan S. Lakshmi J. Water Sci. Technol.: Water Supply. 2011;11:142–150. doi: 10.2166/ws.2011.032. [DOI] [Google Scholar]
- Ho Y. S. McKay G. Process Biochem. 1999;34:451–465. doi: 10.1016/S0032-9592(98)00112-5. [DOI] [Google Scholar]
- Kamaraj R. Davidson D. J. Sozhan G. Vasudevan S. J. Taiwan Inst. Chem. Eng. 2014;45:2943–2949. doi: 10.1016/j.jtice.2014.08.006. [DOI] [Google Scholar]
- Vasudevan S. Lakshmi J. Kamaraj R. Sozhan G. Asia-Pac. J. Chem. Eng. 2013;8:162–171. doi: 10.1002/apj.1657. [DOI] [Google Scholar]
- Yao Z.-Y. Qi J.-H. Wang L.-H. J. Hazard. Mater. 2010;174:137–143. doi: 10.1016/j.jhazmat.2009.09.027. [DOI] [PubMed] [Google Scholar]
- Vasudevan S. Lakshmi J. Can. J. Chem. Eng. 2012;90:1017–1026. doi: 10.1002/cjce.20585. [DOI] [Google Scholar]
- Naushad M. Vasudevan S. Sharma G. Kumar A. ALOthman Z. Desalin. Water Treat. 2016;57:18551–18559. doi: 10.1080/19443994.2015.1090914. [DOI] [Google Scholar]
- Fan L. Luo C. Sun M. Li X. Qiu H. Colloids Surf., B. 2013;103:523–529. doi: 10.1016/j.colsurfb.2012.11.006. [DOI] [PubMed] [Google Scholar]
- Hadi Najafabadi H. Irani M. Roshanfekr Rad L. Heydari Haratameh A. Haririan I. RSC Adv. 2015;5:16532–16539. doi: 10.1039/C5RA01500F. [DOI] [Google Scholar]
- Zhang Y. Yan L. Xu W. Guo X. Cui L. Gao L. Wei Q. Du B. J. Mol. Liq. 2014;191:177–182. doi: 10.1016/j.molliq.2013.12.015. [DOI] [Google Scholar]
- Kamaraj R. Davidson D. J. Sozhan G. Vasudevan S. RSC Adv. 2015;5:39799–39809. doi: 10.1039/C5RA03339J. [DOI] [Google Scholar]
- Unuabonah E. Adebowale K. Olu-Owolabi B. J. Hazard. Mater. 2007;144:386–395. doi: 10.1016/j.jhazmat.2006.10.046. [DOI] [PubMed] [Google Scholar]
- Kamaraj R. Pandiarajan A. Jayakiruba S. Naushad M. Vasudevan S. J. Mol. Liq. 2016;215:204–211. doi: 10.1016/j.molliq.2015.12.032. [DOI] [Google Scholar]
- Li Y.-H. Di Z. Ding J. Wu D. Luan Z. Zhu Y. Water Res. 2005;39:605–609. doi: 10.1016/j.watres.2004.11.004. [DOI] [PubMed] [Google Scholar]
- Vasudevan S. Lakshmi J. Environ. Eng. Sci. 2012;29:563–572. doi: 10.1089/ees.2010.0429. [DOI] [Google Scholar]
- Zhu L. Zhu Z. Zhang R. Hong J. Qiu Y. J. Environ. Sci. 2011;23:1955–1961. doi: 10.1016/S1001-0742(10)60611-0. [DOI] [PubMed] [Google Scholar]
- Msaadi R. Ammar S. Chehimi M. M. Yagci Y. Eur. Polym. J. 2017;89:367–380. doi: 10.1016/j.eurpolymj.2017.02.029. [DOI] [Google Scholar]
- Yu J. Zheng J. Lu Q. Yang S. Zhang X. Wang X. Yang W. Colloid Polym. Sci. 2016;294:1585–1598. [Google Scholar]
- Yu J. Zheng J. Lu Q. Yang S. Wang X. Zhang X. Yang W. Iran. Polym. J. 2016;25:1009–1019. doi: 10.1007/s13726-016-0487-8. [DOI] [Google Scholar]
Associated Data
This section collects any data citations, data availability statements, or supplementary materials included in this article.


