

Abstract
Objective:
Availability of long-term acute care hospitals (LTACHs) has been associated with hospital discharge practices. It is unclear if LTACH availability can influence patient-care decisions. We sought to determine the association of LTACH availability at different hospitals with the likelihood of tracheostomy.
Design:
Retrospective cohort study.
Setting:
California Patient Discharge Database, 2016-2018.
Patients:
Adult patients receiving mechanical ventilation (MV) for respiratory failure.
Interventions:
None.
Measurements and Main Results:
Using the California Patient Discharge Database 2016-2018, we identified all mechanically ventilated patients and those who received tracheostomy. We determine the association between tracheostomy and the distance between each hospital and the nearest LTACH and the number of LTACH beds within 20 miles of each hospital.
Measurements and Main Results:
Among 281,502 hospitalizations where a patient received MV, 22,899 (8.1%) received a tracheostomy. Patients admitted to a hospital closer to an LTACH compared to those furthest from an LTACH had 38.9% (95% CI 33.3-44.6%) higher odds of tracheostomy (Closest Hospitals 8.7% vs Furthest Hospitals 6.3%, aOR=1.65 95% CI 1.40-1.95). Patients had a 32.4% (95% CI 27.6-37.3%) higher risk of tracheostomy when admitted to a hospital with more LTACH beds in the immediate vicinity (Most LTACH beds within 20 miles 8.9% vs Fewest LTACH beds 6.7%, aOR=1.54 95% CI 1.31-1.80). Distance to the nearest LTACH was inversely correlated with hospital risk-adjusted tracheostomy rates (ρ=−0.25, p<0.0001). The number of LTACH beds within 20 miles was positively correlated with hospital risk-adjusted tracheostomy rates ((ρ=0.22, p<0.0001)).
Conclusions:
Proximity and availability of LTACH beds was associated with patient odds of tracheostomy and hospital tracheostomy practices. These findings suggest a hospital effect on tracheostomy decision-making over and above patient case-mix. Future studies focusing on shared decision-making for tracheostomy are needed to ensure goal-concordant care for prolonged mechanical ventilation.
Keywords: tracheostomy, respiration artificial, ventilator weaning, critical care outcomes, long term acute care hospital, health services research
Introduction
Long-term acute care hospitals (LTACHs) were developed in the 1980s with the goal of providing care for patients who have prolonged acute care needs beyond those typically provided in short-term acute care hospitals. LTACHs began as 40 chronic disease specialty hospitals designed for patients requiring ≥ 25 days of hospitalization but have now ballooned to more than 400 hospitals with $5.4 billion in annual Medicare spending as of 2014.(1, 2) The majority of LTACHs are privately owned by for-profit companies with wide geographic variability in LTACH availability.(1, 3, 4) Hospitals in areas with greater LTACH bed availability have higher hospital LTACH discharge rates for all hospitalized patients in lieu of skilled nursing facilities resulting in higher healthcare expenditures without substantial differences in patient outcomes.(1–3, 5, 6)
While LTACH availability may affect final discharge decisions, it is unclear if it affects patient care during an acute hospitalization. Prolonged mechanical ventilation (MV) facilitated by tracheostomy is a common cause for transfer to LTACHs for critically ill patients.(2, 4) The percentage of mechanically ventilated patients who undergo tracheostomy has significantly increased in the United States to 11.3% of MV patients in 2017, and the overwhelming majority of patients with a tracheostomy are discharged to LTACHs.(7, 8) In some circumstances, tracheostomies can facilitate faster hospital discharge (i.e. short hospital length of stay) to LTACHs if such facilities are available. However, many patients with tracheostomies suffer significant short and long-term morbidity and mortality making it a highly value-centric decision that should be driven by patient values and goals.(9) It is unclear if LTACH bed availability is associated with the likelihood of tracheostomy for patients requiring MV.
We conducted an inferential analysis to determine the association between LTACH availability and patient odds of tracheostomy and hospital tracheostomy rates. We hypothesized that hospitals with greater LTACH availability were more likely to perform tracheostomies.. Evidence of external influence on patient tracheostomy decisions would raise concern about the patient-centered approach for patients requiring prolonged MV.
Methods
See Online Supplemental Methods for full study details.
Study Design:
We conducted a population-based retrospective cohort study using the California Patient Discharge Database (PDD) 2016-2018.(10) Using ICD-10-CM procedure codes (eTable 1), we identified adult patients (≥18 years) who received MV and tracheostomy.(11, 12) We excluded patients admitted to hospitals with an average MV case-volume <25 cases/year, those with a Diagnosis-Related Group for tracheostomy related to head and neck disease (011, 012, and 013), and those with a do-not-resuscitate (DNR) order at the time of admission (Figure 1).(13) We identified LTACH hospitals and bed capacity from the California Health and Human Services Agency and direct communications with facilities.(14)
Figure 1: Study Design.
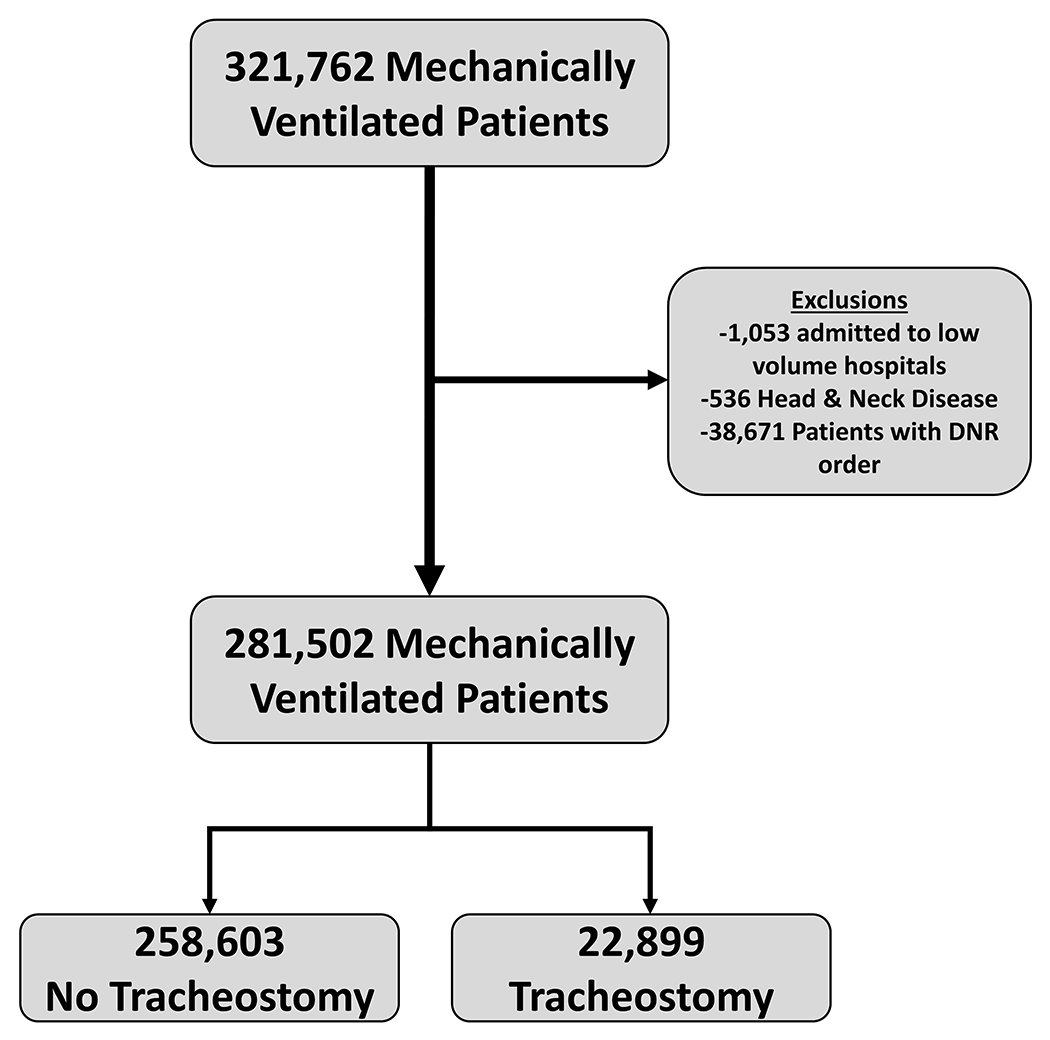
In California from 2016-2018, 321,762 hospitalizations with mechanical ventilation were identified. After exclusions were applied, we identified 281,502 hospitalizations with mechanical ventilation. Among these patients, 22,889 hospitalizations with a tracheostomy were identified.
Exposures and Outcomes:
We investigated the association of tracheostomy with LTACH availability (eTable 2). The primary exposure was LTACH availability defined as (1) the distance from a hospital to the nearest LTACH and (2) the number of LTACH beds within 20 miles of a hospital. The primary outcome was patient odds of tracheostomy. The secondary outcome was the association between LTACH bed availability as a continuous variable with hospital risk-adjusted tracheostomy rates.
Statistical Analysis:
We reported mean, standard deviations (SD), medians, interquartile ranges (IQR), and percentages as appropriate, comparing unadjusted variables using Student’s t test, Wilcoxon Rank sum test, and Chi-Square tests. Hospital risk-adjusted tracheostomy rates were calculated with hierarchical logistic regression models with the hospital as a random intercept, risk-adjusting for patient demographics (including insurance status), individual Elixhauser comorbidities, acute organ failure present on admission as a surrogate of severity of illness, and multiple conditions associated with increased risk of tracheostomy (eTable 3–4).(12, 15, 16) Patients with missing data were excluded from regression analyses. No imputations were performed. The combination of patient age, surgical status, comorbidities, acute organ failures, and conditions associated with respiratory failure without the primary exposure variable had strong predictive capability for tracheostomy (AUC=0.74), approaching APACHE II and III’s ability to predict hospital mortality.(17)
Distance from a hospital to the nearest LTACH and the number of LTACH beds available within 20 miles of a hospital were divided into quartiles for analysis given non-linear relationships. For distance to the nearest LTACH, Quartile 1 represented the closest and Quartile 4 represented the furthest hospitals. For LTACH bed-density, Quartile 1 had the most beds within 20 miles and Quartile 4 had the least beds (eTable 2). These models were designed to idenitfy inferential associations between LTACH availability and odds of tracheostomy.
We used hierarchical regression models to determine the association between (1) patient odds of tracheostomy and distance to the nearest LTACH and (2) patient odds of tracheostomy and LTACH bed availability within 20 miles of the admission hospital divided into quartiles. In addition to the standard risk-adjustment described above, models were also adjusted for the distance between patients’ home and the LTACH closest to the hospital to which they are admitted. Adjusted odds ratios (aOR) reflect results of multivariable models. Spearman correlation tests determined the correlation between hospital risk-adjusted tracheostomy rates and (1) hospital distance to the nearest LTACH and (2) number of LTACH beds within 20 miles of a hospital.
Sensitivity Analyses:
We conducted several sensitivity analyses to address potential unmeasured confounding including limiting the cohort to those with longer periods of MV, restricting the analysis to patients with Medicare, excluding patients transferred to another hospital, and using different distances (10 miles and 50 miles) to establish LTACH bed-density near a hospital. Statistical sensitivity analyses were conducted to address potential model overfit and, separately, to model distance to LTACH availability as continuous variables rather than categorical. Finally, in order to address the potential for unmeasured confounding, we report the e-value, a measure of how strong an unmeasured confounder would have to be to shift the observed effect estimate to the null (see Online Supplemental Methods section for details).
All statistical testing was two-tailed and performed with a critical alpha=0.05 threshold with SAS v9.4 (SAS Institute, Cary, NC). The study was approved by the California Committee for Protection of Human Subjects (15-2-1869) (Sacramento, CA) and deemed exempt by the Colorado Multiple Institution Review Board (20–2514) (Aurora, CO).
Results
We identified 281,502 hospitalizations during the study period in which a patient received MV across 284 hospitals (Figure 1), with 22,899 (8.1%) receiving a tracheostomy. Hospital risk-adjusted tracheostomy rates varied between hospitals (median 6.8%, range 2.2-18.2%) (Figure 2). Based on information from the Center for Medicare and Medicaid Services (CMS) and the California Hospital Association, we identified 30 non-federal LTACHs. The median number of beds per LTACH was 83.5 (IQR 58.0-109.0). The median distance from a hospital to the nearest LTACH was 8.9 miles (IQR 4.1-26.8). Twenty hospitals (7.0%) were in the same zip code as their nearest LTACH (i.e. calculated distance was 0 miles). Thirty-five hospitals (12.3%) were more than 50 miles from the closest LTACH with 11 hospitals (3.9%) being ≥100 miles from the nearest LTACH (eFigure 2). No LTACHs were located in rural areas.
Figure 2: Variation in Hospital Risk-Adjusted Tracheostomy Rates.
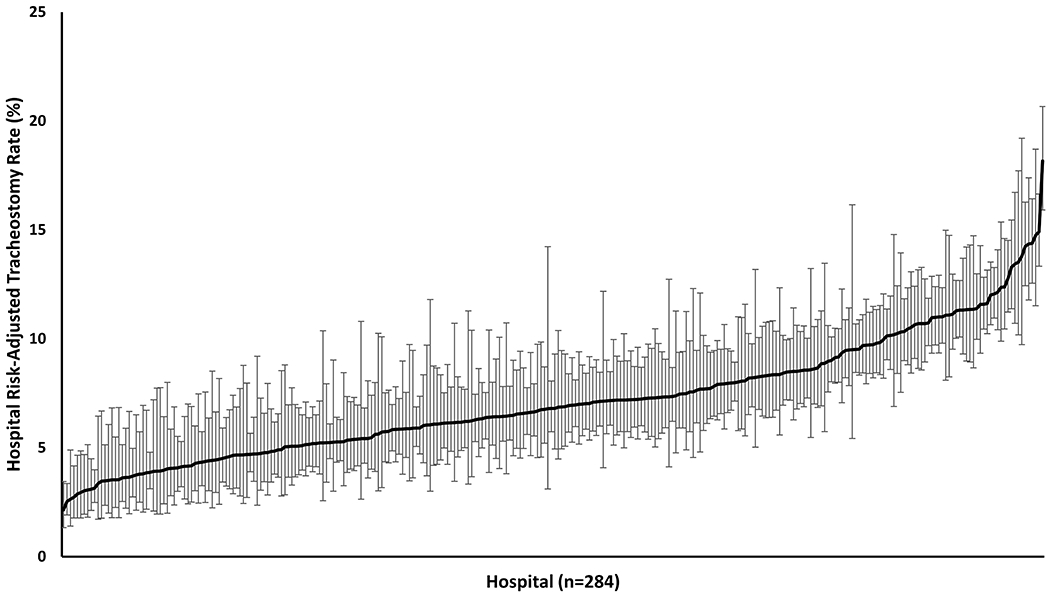
This figure demonstrates the wide between-institution variability in hospital tracheostomy practices. Risk-adjusted rates have been adjusted for patient case-mix differences. The mean hospital risk-adjusted tracheostomy rate was 7.15% (SD=2.82%). Error bar indicate a 95% confidence interval around an individual hospital’s risk-adjusted tracheostomy estimate.
Patient Characteristics:
There were few differences between patients admitted to hospitals closer to LTACHs compared to those admitted to hospitals with LTACHs further away (Table 1). Hospitals closer to LTACHs tended to have fewer white patients and more patients from racial/ethnic minorities. Nearly one-third of MV patients had a major surgical procedure during their hospitalization. There was little difference in payer mix across distance quartiles. Median Elixhauser Comorbidity scores and rates of shock, acute renal failure, pneumonia, and trauma had little clinically meaningful variation across quartiles. Hospital mortality was also higher in hospitals with greater LTACH availability (eTable 5–6).
Table 1:
Patient Characteristics
| Distance From Hospital to Nearest LTACH | ||||||
|---|---|---|---|---|---|---|
|
| ||||||
| Variable | All Patients | Quartile 1 | Quartile 2 | Quartile 3 | Quartile 4 | p-value |
|
| ||||||
| Hospitals (n) | 284 | 71 | 71 | 71 | 71 | NA |
|
| ||||||
| Distance Range (miles) | N/A | <4.1 | 4.1-8.8 | 8.9-26.8 | ≥26.8 | NA |
|
| ||||||
| Patients (n) | 281,502 | 82,037 | 74,960 | 75,498 | 49,007 | NA |
|
| ||||||
| Mean Age (y) (SD) | 61.5 (17.5) | 61.3 (17.5) | 62.7 (17.6) | 61.2 (17.6) | 60.2 (17.3) | <0.0001 |
|
| ||||||
| Female (%) | 41.6 | 40.6 | 42.3 | 41.8 | 41.9 | <0.0001 |
|
| ||||||
| Race/Ethnicity (%) | <0.0001 | |||||
| White | 47.8 | 38.8 | 44.7 | 55.1 | 55.9 | |
| Black | 11.6 | 15.7 | 13.6 | 9.1 | 7.2 | |
| Hispanic | 25.7 | 29.3 | 25.7 | 22.1 | 25.4 | |
| Asian | 10.1 | 11.5 | 11.7 | 8.4 | 7.1 | |
| Other | 5.0 | 5.8 | 4.3 | 5.2 | 4.4 | |
|
| ||||||
| Primary Insurance Payer | 49.7 | 53.5 | 51.6 | 50.1 | <0.0001 | |
| Medicare | 51.3 | 29.8 | 25.3 | 26.0 | 29.6 | |
| Medicaid | 27.5 | 16.4 | 17.7 | 18.1 | 15.2 | |
| Private Insurance | 17.0 | 1.8 | 1.8 | 1.7 | 1.4 | |
| Self-Pay | 1.7 | 2.3 | 1.7 | 2.7 | 3.6 | |
| Other | 2.5 | |||||
|
| ||||||
| Major Therapeutic Surgical Procedure (%) | 31.2 | 31.9 | 31.1 | 31.4 | 29.6 | <0.0001 |
|
| ||||||
| Median Elixhauser Comorbidity Score (IQR) | 10.0 (4.0-17.0) | 10.0 (5.0-17.0) | 11.0 (5.0-18.0) | 10.0 (4.0-16.0) | 9.0 (3.0-15.0) | <0.0001 |
|
| ||||||
| Shock POA (%) | 31.3 | 31.4 | 31.8 | 30.8 | 31.3 | 0.06 |
|
| ||||||
| Acute Renal Failure POA (%) | 34.6 | 35.4 | 35.0 | 33.7 | 33.9 | <0.0001 |
|
| ||||||
| Acute Metabolic Acidosis POA (%) | 24.1 | 23.6 | 22.7 | 24.8 | 25.8 | <0.0001 |
|
| ||||||
| Pneumonia POA (%) | 27.5 | 27.0 | 28.3 | 26.8 | 28.3 | 0.007 |
|
| ||||||
| Septic Shock POA (%) | 20.5 | 21.0 | 21.6 | 19.5 | 19.7 | <0.0001 |
|
| ||||||
| Acute COPD Exacerbation POA (%) | 11.6 | 11.2 | 10.4 | 11.3 | 14.3 | <0.0001 |
|
| ||||||
| Trauma POA (%) | 0.6 | 0.6 | 0.6 | 0.7 | 0.7 | 0.015 |
|
| ||||||
| Stroke POA (%) | 0.1 | 0.1 | 0.1 | 0.1 | 0.1 | 0.256 |
Abbreviations: LTACH – long-term acute care hospital. n – number. y – year. SD – standard deviation. IQR – interquartile range. POA – present on admission. COPD – chronic obstructive pulmonary disease.
Patient Odds of Tracheostomy:
Patients had higher odds of tracheostomy when admitted to a hospital with greater LTACH availability (Table 2). Patients admitted to hospitals closest to LTACHs had a 38.9% (95% CI 33.3-44.6%) higher relative risk of tracheostomy than patients admitted to hospitals furthest from a LTACH (Closest Hospitals (Quartile 1) 8.7% vs Furthest Hospitals (Quartile 4) 6.3%, absolute risk difference 2.4%, 95% CI 2.2-2.7%). After adjusting for patient demographics and case-mix, patients admitted to hospitals closest to an LTACH had nearly 50% higher odds of tracheostomy (Closest Hospitals vs Furthest Hospitals aOR=1.65, 95% CI 1.40-1.95) (Table 2, eTable 7). Patients admitted to hospitals with more LTACH beds within a 20 mile radius had a 32.4% (95% CI 27.6-37.3%) higher risk of tracheostomy than hospitals with the fewest LTACH beds within 20 miles (Most LTACH Beds (Quartile 1) 8.9% vs Fewest LTACH Beds (Quartile 4) 6.7%, absolute risk difference 2.3%, 95% CI 1.9-2.5%). In adjusted analysis, patients admitted to hospitals with more LTACH beds in close proximity had higher odds of tracheostomy (aOR=1.54, 95% CI 1.31-1.80) (Table 2, eTable 8). Pairwise comparisons between Quartiles 2 & 3 with Quartile 4 as a reference also showed significant associations (eTable 7–8).
Table 2:
Patient Odds of Tracheostomy Based on LTACH Availability
| LTACH Availability Measure | Tracheostomy (%)A | aOR (95% CI)B |
|---|---|---|
| Distance to Nearest LTACH | ||
| Quartile 1 (<4.1 miles) | 8.74 | 1.65 (1.40 – 1.95) |
| Quartile 2 (4.1-8.8 miles) | 9.06 | 1.57 (1.33 – 1.85) |
| Quartile 3 (8.9-26.8 miles) | 7.74 | 1.33 (1.13 – 1.58) |
| Quartile 4 (≥26.8 miles) | 6.30 | REFERENCE |
|
| ||
| No. LTACH Beds within 20 Miles | ||
| Quartile 1 (>656 beds) | 8.92 | 1.54 (1.31 – 1.80) |
| Quartile 2 (181-656 beds) | 8.39 | 1.32 (1.13 – 1.55) |
| Quartile 3 (1-180 beds) | 8.28 | 1.46 (1.22 – 1.75) |
| Quartile 4 (0 beds) | 6.74 | REFERENCE |
Hospital-Level Correlations:
Hospital risk-adjusted tracheostomy rates were correlated with LTACH availability. Hospitals that were closer to an LTACH had higher risk-adjusted tracheostomy rates (ρ=−0.25, 95% CI −0.36 - −0.14, p<0.0001). Hospitals with more LTACH beds in close proximity also had higher risk-adjusted tracheostomy rates (ρ=0.22, 95% CI 0.11-0.33, p<0.0001) (Figure 3).
Figure 3: Hospital Correlations.
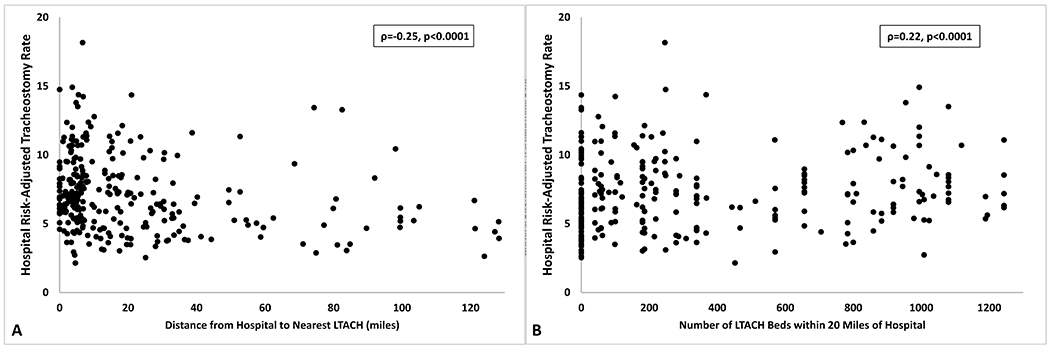
This figure presents hospital-level correlations between hospital risk-adjusted tracheostomy rates and the primary exposure variables of (Panel A) distance to the nearest LTACH in miles and (Panel B) the number of LTACH beds in a 20 mile radius. (Panel A) Hospitals that were closer to an LTACH (ρ=−0.26, p<0.0001) and (Panel B) those that had more LTACH beds within a 20-mile radius (ρ=−0.22, p<0.0001) had higher hospital risk-adjusted tracheostomy rates. Abbreviation: LTACH – long-term acute care hospital.
Sensitivity Analyses:
All sensitivity analyses demonstrated similar associations of higher risk-adjusted odds of tracheostomy with greater LTACH availability (see Online Supplemental Results). Additionally, the e-value calculation revealed that an unmeasured confounder would have to have an odds ratio of 2.69 to shift the primary association of odds of tracheostomy and distance to the nearest LTACH to the null.(18–20)
Discussion
While tracheostomy may be a simple procedure, tracheostomies also represent a significant care transition and are often bundled with the chronic critical illness, possible prolonged MV, and possible long-term hospitalization. We found significant association between greater LTACH availability and increased odds of an individual patient receiving a tracheostomy. We also observed a weak correlation between hospital risk-adjusted tracheostomy rates and LTACH bed availability. These findings suggest that hospital factors have a significant influence on tracheostomy decision-making, decisions that should be among the most patient-centered value-based in healthcare. Our analysis was robust to multiple sensitivity analyses.
To our knowledge, this is the first study investigating how proximity to an LTACH can influence patient care decisions. We observed similar tracheostomy rates to previously published estimates ranging from 10-12% of MV patients.(7, 8) For patients who require prolonged MV, tracheostomy can be a critical transition point enabling transfer to LTACH. Hospitals with very few LTACHs in close proximity may delay tracheostomy in the hopes of eventual extubation. Patients who have been extubated may be more easily transferred to skilled nursing facilities as opposed to needing a specialized LTACH. We speculate that hospitals with greater ability to transfer patients to LTACHs may more aggressively recommend tracheostomy, enabling more rapid discharges to an LTACH even when not entirely aligned with a patient’s goals. The decision of on whom and when to perform a tracheostomy is highly susceptible to hospital influence as multiple clinical studies have shown that even experienced practitioners struggle with identifying which patients will require a tracheostomy.(21–23) Additionally, tracheostomy is one of the most highly reimbursed procedures in the U.S., currently ranking fifth out of the top 50 charges for surgical procedures in the U.S.(24) The high charge with relatively low resource utilization in comparison to procedures like joint or valve replacements may create unconscious financial incentives for tracheostomy. Our results suggest that hospital-factors affect decisions that should be entirely patient-centered.
Hospitals closer to LTACHs tended to have fewer white patients and higher percentages of underrepresented minorities compared to hospitals further from an LTACH. This may reflect the fact that a large percentage of LTACHs are located in major urban centers with higher percentages of underrepresented minorities. Despite demographics differences across quartiles, we were able to adjust the models for racial/ethnic differences but future studies should investigate potential inequities. While we assumed that LTACH availability influenced hospital practices, it is possible that distance to an LTACH could have influenced surrogate decision-making. Individuals from more underprivileged backgrounds may rely on public transportation to visit loved ones and greater distance to an LTACH could influence surrogate decision-making. Similarly, longer commute times to visit a loved one may affect a surrogate’s decision-making process especially if they have an hourly-paid job or employment without paid time off.
While the absolute differences between quartiles may be small, they represent a large fraction of all tracheostomies and potentially a large number of tracheostomies driven by hospital culture. For example, the absolute differences in tracheostomy rates between hospitals closest to an LTACH and those furthest from an LTACH was 2.44%. Quartile 1 hospitals had 82,037 patients, which would suggest the possibility of 2,002 excess tracheostomies during the study period compared to Quartile 4 hospitals. It is unclear how many of these might have been driven by hospital factors rather than patient values but the small absolute difference translates into a large number of tracheostomies with significant long-term healthcare related costs.(9)
While our analyses strongly suggest a “hospital effect”, definitive causal links cannot be drawn. The hospital-level correlations, while weak to moderate strength within the context of healthcare associations, support hospital culture based influences. However, it is still possible that robust patient-centered discussions are happening in all hospitals and that the associations we observed with LTACH availability are artificial or indicative of differences in patients/families that live closer to hospitals with greater LTACH availability. However, the e-value and the multiple sensitivity analyses make it unlikely that these factors could completely negate our findings. Further study is necessary to understand the mechanism driving patient-selection for tracheostomy.
An alternative explanation for our findings could be that families are not as willing to consider tracheostomy (and discharge to LTACH) in hospitals further from an LTACH. If a patient/family lives far from an LTACH, a family may choose against a tracheostomy if it means transferring the patient to a facility that is difficult for them to visit. However, previous work has suggested that families are only minimally aware of the need for long-term hospitalization following tracheostomy, and that it is not something often discussed prior to the procedure.(25)
Death could be viewed as a potential competing risk. However, we observed higher mortality in hospitals with greater LTACH availability and odds of tracheostomy. If competing risks were driving our findings, we would expect lower mortality in hospitals with higher rates of tracheostomy. Additionally the sensitivity analyses restricting the cohort to those with longer periods of MV also makes competing risk with death less likely.
Based on our analysis, it is not possible to determine the temporal relationship between LTACH presence and hospital tracheostomy practices. We speculate that the presence of LTACHs and ease of transfer influence hospital-based care. An alternative explanation could be that LTACHs open near hospitals with higher tracheostomy rates to meet demand. However, in communications with the California Hospital Association, no more than two new LTACHs opened between 2010 and 2018. Additionally, “tracheostomy rate” is not a common reported measure, making it less likely that an LTACH opening would target hospitals with higher tracheostomy rates. Furthermore, prolonged MV represents less than 30% of critically ill patients transferred to an LTACH.(2) When non-critically ill patients are also considered, prolonged MV represents a small percentage of total admissions to an LTACH making it less likely that LTACHs would base their location solely around tracheostomy practices.
Our study has several limitations. We used the California PDD, the largest, most diverse, administrative database that includes all ages and all payers but this may have introduced a selection bias. While the findings may not be generalizable to all states, the PDD accounted for patient’s insurance status which greatly affects eligibility for LTACHs and included all ages as nearly half of patients with tracheostomy for acute respiratory failure are <65 years.(7) The PDD allowed us to exclude patients admitted with a DNR order as they were less likely to receive a tracheostomy and DNR utilization varies between hospitals.(26) Our findings may not be applicable to states with no or relatively few LTACHs. We used ICD-10 billing codes to identify procedures and diagnoses, which may lead to misclassification or selection bias. However, we used codes that have been previously validated or are associated with high-charge procedures that are less likely to be miscoded. The total number of beds in an LTACH is also not equivalent to the number of ventilator beds. In communications with the facilities in California, most indicated that the number of beds that could handle ventilators was based on staffing and not a fixed number. As such, the total number of beds was felt to be an adequate surrogate for weaning capacity. Our study predates COVID-19. It is unclear how longer periods of MV, increased numbers of individuals receiving MV, and process issues related to COVID-19 may affect associations between LTACH availability and tracheostomy practices. Finally, our analysis is designed to identify inferential associations; future studies are needed to understand models that can predict who is likely to receive a tracheostomy.
As with all retrospective investigations, our analysis is also subject to residual confounding. We used administrative data to adjust for patient case-mix as the PDD does not contain physiologic measures. However, physiologic measures tend to predict hospital mortality to which tracheostomy can be a competing outcome.(27–30) Iwashyna et al has demonstrated that physiologic measures and abnormalities, such as APACHE or SOFA scores, lose their predictive value over time. After 10 days in the ICU, which would include almost all patients who eventually receive a tracheostomy, age and chronic health status become more predictive of outcomes related to prolonged critical illness and the PDD is able to adequately capture these characteristics.(30) The risk-adjustment using administrative data in this study has similar performance characteristics to more physiology-based scores, similar to prior studies.(31, 32) We also did not have access to other clinical information such as duration of MV, degree of hypoxia, etc. These other clinical factors likely influence the decision-making process. Our findings merely support the conclusion that LTACH availability plays a role in affecting institutional practices related to tracheostomy decisions. Hospital factors such as ability to perform tracheostomies and physician-level factors are additional potential confounders for which we were unable to adjust. However, we performed extensive sensitivity analyses designed to investigate the possibility of unmeasured confounding and we report a high e-value making it unlikely that unmeasured confounding would invalidate our findings.
Conclusion
In this population-based study, we demonstrated that patients in hospitals with greater LTACH availability performed more tracheostomies. Why should between-hospital differences in tracheostomy practices matter? On the surface, tracheostomy is a simple surgical procedure. However, nearly nine out of ten patients with a tracheostomy require discharge to a long-term care facility and half of patients ≥65 years die within 6 months.(7, 9) While tracheostomy is often a life-prolonging procedure, for many patients it can lead to recurrent hospitalizations, complications, and possibly long-term life support. Given the long-term implications of prolonged MV, decisions related to tracheostomy should be driven by patient/family values to ensure goal-concordant care. Hospital-level factors associated with the likelihood of tracheostomy raise the possibility that not all tracheostomy-related decisions are patient-centered or goal-concordant. Future studies aimed at understanding the tracheostomy decision-making process and efforts to promote shared decision-making for tracheostomy could increase the likelihood of goal-concordant patient-centered care.
Supplementary Material
Acknowledgments
Funding Source:
ABM is supported by NIH K23HL141704 (Primary funding source). DM is supported by NIH R01HL136403. ISD is supported by NIH R01NR016459. No authors have any conflicts of interest to report for this study.
Footnotes
Conflicts of interest/Competing interests: All authors confirm that they have no financial or intellectual conflicts of interest or competing interests.
Copyright Form Disclosure: Dr. Mehta’s institution received funding from the National Institutes of Health (NIH); he received support for article research from the NIH. Drs. Matlock and Douglas have disclosed that they do not have any potential conflicts of interest.
References
- 1.Einav L, Finkelstein A, Mahoney N: Long-Term Care Hospitals: A Case Study in Waste. Chicago, IL, University of Chicago, Becker Friedman Institute for Economics, 2020. February 27, 2020 (revision). [Google Scholar]
- 2.Kahn JM, Benson NM, Appleby D, Carson SS, et al. : Long-term acute care hospital utilization after critical illness. JAMA 2010; 303(22):2253–2259 [DOI] [PMC free article] [PubMed] [Google Scholar]
- 3.Kahn JM, Werner RM, Carson SS, Iwashyna TJ: Variation in long-term acute care hospital use after intensive care. Med Care Res Rev 2012; 69(3):339–350 [DOI] [PMC free article] [PubMed] [Google Scholar]
- 4.Makam AN, Nguyen OK, Xuan L, Miller ME, et al. : Factors Associated With Variation in Long-term Acute Care Hospital vs Skilled Nursing Facility Use Among Hospitalized Older Adults. JAMA Intern Med 2018; 178(3):399–405 [DOI] [PMC free article] [PubMed] [Google Scholar]
- 5.Hall WB, Willis LE, Medvedev S, Carson SS: The implications of long-term acute care hospital transfer practices for measures of in-hospital mortality and length of stay. Am J Respir Crit Care Med 2012; 185(1):53–57 [DOI] [PMC free article] [PubMed] [Google Scholar]
- 6.Kahn JM, Davis BS, Le TQ, Yabes JG, et al. : Variation in mortality rates after admission to long-term acute care hospitals for ventilator weaning. J Crit Care 2018; 46:6–12 [DOI] [PMC free article] [PubMed] [Google Scholar]
- 7.Mehta AB, Syeda SN, Bajpayee L, Cooke CR, et al. : Trends in Tracheostomy for Mechanically Ventilated Patients in the United States, 1993–2012. Am J Respir Crit Care Med 2015; 192(4):446–454 [DOI] [PMC free article] [PubMed] [Google Scholar]
- 8.HCUPnet. Available at: http://hcupnet.ahrq.gov/. Accessed October 25, 2017
- 9.Mehta AB, Walkey AJ, Curran-Everett D, Douglas IS: One-Year Outcomes Following Tracheostomy for Acute Respiratory Failure. Crit Care Med 2019; 47(11):1572–1581 [DOI] [PMC free article] [PubMed] [Google Scholar]
- 10.California Office of Statewide Health Planning and Development: Patient Discharge Data. Available at: https://www.oshpd.ca.gov/HID/Patient-Discharge-Data.html. Accessed May 29, 2017
- 11.Quan H, Parsons GA, Ghali WA: Validity of procedure codes in International Classification of Diseases, 9th revision, clinical modification administrative data. Med Care 2004; 42(8):801–809 [DOI] [PubMed] [Google Scholar]
- 12.Quan H, Sundararajan V, Halfon P, Fong A, et al. : Coding algorithms for defining comorbidities in ICD-9-CM and ICD-10 administrative data. Med Care 2005; 43(11):1130–1139 [DOI] [PubMed] [Google Scholar]
- 13.Goldman LE, Chu PW, Osmond D, Bindman A: Accuracy of do not resuscitate (DNR) in administrative data. Med Care Res Rev 2013; 70(1):98–112 [DOI] [PubMed] [Google Scholar]
- 14.Hospital Characteristics List for California Providers. Available at: https://data.chhs.ca.gov/dataset/hospital-characteristics-list-for-california-providers. Accessed January 13, 2020
- 15.Beta Elixhauser Comorbidity Software for ICD-10-CM. Available at: https://www.hcup-us.ahrq.gov/toolssoftware/comorbidityicd10/comorbidity_icd10.jsp. Accessed October 25, 2017
- 16.Houchens R, Chu B, Steiner C: Hierarchical Modeling using HCUP Data. HCUP Methods Series Report # 2007-01 Online. Online, U.S. Agency for Healthcare Research and Quality., 2007. [Google Scholar]
- 17.Sadaka F, EthmaneAbouElMaali C, Cytron MA, Fowler K, et al. : Predicting Mortality of Patients With Sepsis: A Comparison of APACHE II and APACHE III Scoring Systems. J Clin Med Res 2017; 9(11):907–910 [DOI] [PMC free article] [PubMed] [Google Scholar]
- 18.Haneuse S, VanderWeele TJ, Arterburn D: Using the E-Value to Assess the Potential Effect of Unmeasured Confounding in Observational Studies. JAMA 2019; 321(6):602–603 [DOI] [PubMed] [Google Scholar]
- 19.Mathur MB, Ding P, VanderWeele TJ: Website and R package for computing E-Values. Epidemiology (Cambridge, Mass) 2018; In Press [DOI] [PMC free article] [PubMed] [Google Scholar]
- 20.VanderWeele TJ, Ding P: Sensitivity Analysis in Observational Research: Introducing the E-Value. Ann Intern Med 2017; 167(4):268–274 [DOI] [PubMed] [Google Scholar]
- 21.Terragni PP, Antonelli M, Fumagalli R, Faggiano C, et al. : Early vs late tracheotomy for prevention of pneumonia in mechanically ventilated adult ICU patients: a randomized controlled trial. JAMA 2010; 303(15):1483–1489 [DOI] [PubMed] [Google Scholar]
- 22.Young D, Harrison DA, Cuthbertson BH, Rowan K, et al. : Effect of early vs late tracheostomy placement on survival in patients receiving mechanical ventilation: the TracMan randomized trial. JAMA 2013; 309(20):2121–2129 [DOI] [PubMed] [Google Scholar]
- 23.Blot F, Similowski T, Trouillet JL, Chardon P, et al. : Early tracheotomy versus prolonged endotracheal intubation in unselected severely ill ICU patients. Intensive Care Med 2008; 34(10):1779–1787 [DOI] [PubMed] [Google Scholar]
- 24.Learish J: Most Expensive Medical Procedures in the U.S., Ranked. Available at: https://www.cbsnews.com/pictures/most-expensive-medical-procedures-without-insurance. Accessed July 8, 2020
- 25.Cox CE, Martinu T, Sathy SJ, Clay AS, et al. : Expectations and outcomes of prolonged mechanical ventilation. Crit Care Med 2009; 37(11):2888–2894 [DOI] [PMC free article] [PubMed] [Google Scholar]
- 26.Mehta AB, Cooke CR, Douglas IS, Lindenauer PK, et al. : Association of Early Do-Not-Resuscitate Orders with Unplanned Readmissions among Patients Hospitalized for Pneumonia. Annals of the American Thoracic Society 2017; 14(1):103–109 [DOI] [PMC free article] [PubMed] [Google Scholar]
- 27.Knaus WA, Draper EA, Wagner DP, Zimmerman JE: APACHE II: a severity of disease classification system. Crit Care Med 1985; 13(10):818–829 [PubMed] [Google Scholar]
- 28.Knaus WA, Wagner DP, Draper EA, Zimmerman JE, et al. : The APACHE III prognostic system. Risk prediction of hospital mortality for critically ill hospitalized adults. Chest 1991; 100(6):1619–1636 [DOI] [PubMed] [Google Scholar]
- 29.Minne L, Abu-Hanna A, de Jonge E: Evaluation of SOFA-based models for predicting mortality in the ICU: A systematic review. Crit Care 2008; 12(6):R161. [DOI] [PMC free article] [PubMed] [Google Scholar]
- 30.Iwashyna TJ, Hodgson CL, Pilcher D, Bailey M, et al. : Timing of onset and burden of persistent critical illness in Australia and New Zealand: a retrospective, population-based, observational study. Lancet Respir Med 2016; 4(7):566–573 [DOI] [PubMed] [Google Scholar]
- 31.Courtright KR, Halpern SD, Bayes B, Harhay MO, et al. : Adaptation of the Acute Organ Failure Score for Use in a Medicare Population. Crit Care Med 2017; 45(11):1863–1870 [DOI] [PMC free article] [PubMed] [Google Scholar]
- 32.Courtright KR, Raneses E, Harhay MO, Kipnis P, et al. : External Validation of a Claims-Based ICU Risk-Adjustment Methodology. Am J Respir Crit Care Med 2016:A3620–A3620 [Google Scholar]
Associated Data
This section collects any data citations, data availability statements, or supplementary materials included in this article.