Abstract
Drug-induced liver injury (DILI), caused by drugs, herbal agents or nutritional supplements, is a major issue for patients and the pharmaceutical industry. It has been a leading cause of clinical trials failure and withdrawal of FDA approval. In this research, we focused on in silico estimation of chemical DILI potential on humans based on structurally diverse organic chemicals. We developed a series of binary classification models using five different machine learning methods and eight different feature reduction methods. The model, developed with the support vector machine (SVM) and the MACCS fingerprint, performed best both on the test set and external validation. It achieved a prediction accuracy of 80.39% on the test set and 82.78% on external validation. We made this model available at http://opensource.vslead.com/. The user can freely predict the DILI potential of molecules. Furthermore, we analyzed the difference of distributions of 12 key physical–chemical properties between DILI-positive and DILI-negative compounds and 20 privileged substructures responsible for DILI were identified from the Klekota–Roth fingerprint. Moreover, since traditional Chinese medicine (TCM)-induced liver injury is also one of the major concerns among the toxic effects, we evaluated the DILI potential of TCM ingredients using the MACCS_SVM model developed in this study. We hope the model and privileged substructures could be useful complementary tools for chemical DILI evaluation.
Drug-induced liver injury (DILI), caused by drugs, herbal agents or nutritional supplements, is a major issue for patients and the pharmaceutical industry.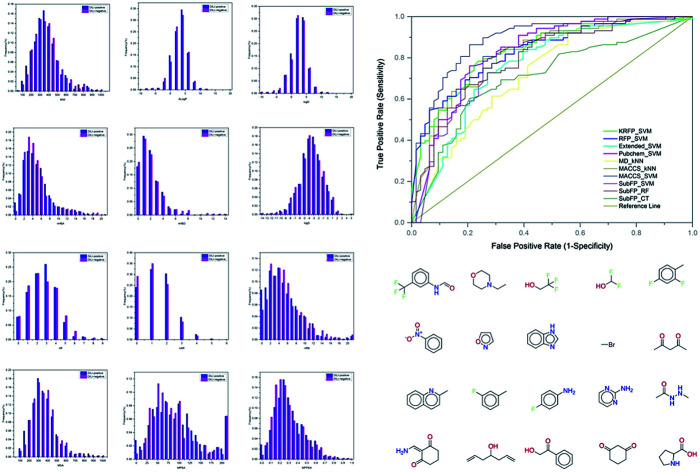
Introduction
The liver plays a central role in transforming and clearing xenobiotics (particularly drugs) and is susceptible to the toxicity from these agents. Drug-induced liver injury (DILI) is the term used for liver damage caused by drugs, herbal agents or nutritional supplements.1 DILI has become one of the most important concerns in modern drug development as it is a leading cause of drugs failing clinical trials and being withdrawn from the market.2 DILI is also an important issue in traditional Chinese medicines (TCMs),3–5 which have been widely used in the ethnic Chinese population and have become increasingly popular in Western society.6–8 The early estimation of the DILI potential of drug candidates and herbal agents is important and very useful for improving the efficiency of drug development. In the past decades, DILI data has been systematically recorded in numerous public databases,9 such as LiverTox,10 Liver Toxicity Knowledge Base (LTKB),11 Toxicogenomics Project-Genomics Assisted Toxicity Evaluation System (Open TG-GATEs),12 the liver toxicological map (LTMap)13 and Hepatox.14 These databases have become valuable resources in the study of DILI and the rational use of drugs.
There is a great deal of interest worldwide in developing fast and accurate experimental and computational approaches to evaluate the risk of DILI.2,15 Since biological and chemical experimentations are too time-consuming and expensive, in silico techniques, such as quantitative structure–activity relationship (QSAR), have been widely used to reduce the cost of the chemical risk assessment. Compared with experimental methods, QSAR models are applicable to virtual molecules even before they are isolated or synthesized.16 Cheng et al.17 reported the first QSAR model for DILI prediction in 2003. They built a training set containing 382 drug and drug-like compounds with dose–response data and developed a classifier with recursive partitioning trees. The final models were applied to a set of 54 compounds collected after the models were created. In total, 81% of the compounds were classified correctly by the ensemble method. In 2014, Chen et al.18 and Ekins19 reviewed the QSAR-based models for human hepatotoxicity. These models were trained with very different toxicity data using various modeling approaches.15,20–26 Several models were developed in the next few years. In 2016, Mulliner et al.27 developed a systematic approach to construct interrelated models for hepatotoxicity with a general applicability scope from a repository of 3712 compounds and associated human and animal hepatotoxicity data. To our knowledge, this is the largest existing dataset for DILI modeling. Zhang et al.28 reported an excellent study focused on predicting the risk of DILI in humans. They developed the models using a comprehensive data set containing 1317 compounds (785 DILI-positive compounds and 532 DILI-negative compounds). In total, 88 compounds collected from a benchmark DILI database-Liver Toxicity Knowledge Base (LTKB) were used for model validation and some key substructure patterns correlated with drug-induced liver toxicity were also identified as structural alerts. More recently, Kotsampasakou et al.1 presented a DILI prediction model generated with Random Forest and 2D molecular descriptors on a dataset of 966 compounds. They considered the quality of the training data and carefully curated the datasets for DILI both with respect to the chemical structures and for their class labels (DILI positive, DILI negative). Most of the published QSAR models suffer from low statistical performance or small data sets and the usefulness of these models was restricted because of poor availability.29–31 Moreover, considering the species specificity in chemical toxicity between rodent animals and human beings, it should be more useful to develop the models based on reliable data on human DILI.
In the present study, we focused on the following tasks: (1) the development of human DILI models based on structurally diverse organic chemicals; (2) the analysis of the difference in structural characteristics between the DILI positive and negative chemicals; (3) the application of the QSAR model to predict the DILI potential of TCM components.
Materials and methods
Data collection and preparation
As mentioned before, in this study, we focused on DILI potential of chemicals on humans. Thus, only human DILI data were collected. The data for model building were collected from two papers.23,28 Liew et al.23 collected available drugs in the market listed in the U.S. FDA Orange Book and checked the adverse hepatic effects using the Micromedex Healthcare Series; a total of 1274 compounds were collected with DILI class labels. Zhang et al.28 obtained a large diverse DILI database containing 1317 unique molecules from publications and LTKB. To ensure the consistency of data quality, we prepared Liew's data with a procedure similar to Zhang. First, the chemical structures and hepatotoxicity effects were carefully checked. Then, the removed mixtures, inorganic and organometallic compounds, and salts were converted to their parent forms. Finally, the duplicates were removed and the molecules with molecular weight higher than 40 and lower than 1000 were filtered. Finally, 2144 chemicals were obtained. The compounds were randomly divided into a training set and a test set with the ratio of 4 : 1. The training set contained 1731 compounds and the test set contained 413 compounds. In order to further evaluate the predictive ability of the models, an external validation set were extracted from the study reported by Ivanov et al.32 After pretreatment and removal of duplicates, the external validation set contained 151 compounds. Our datasets for model training and validation were larger and more structurally diverse than most of the previous studies.
Calculation of molecular descriptors and fingerprints
Molecular descriptors are quantitative representations of structural and physicochemical features of molecules. Herein, we calculated 12 key physicochemical properties, which were widely adopted in chemical toxicity prediction,33–35 including molecular weight (MW), Ghose–Crippen log Kow (A log P), molecular solubility (log S), the number of hydrogen bond acceptors (nHBA), the number of hydrogen bond donors (nHBD), log D, molecular surface area (MSA), molecular polar surface area (MPSA), molecular fractional polar surface area (MFPSA), the number of rotatable bonds (nRTB), the number of rings (nR) and the number of aromatic rings (nAR). These properties formed a set of molecular descriptors and were used as a feature reduction method for model building.
Recently, molecular fingerprints have also been widely used in chemical toxicity prediction because the fingerprint sequences perform effectively on symbolizing chemical fragments and the procedure is highly efficient.36–38 Herein, we calculated seven types of commonly used fingerprints, including the Estate fingerprint (Estate, 79 bits), CDK fingerprint (FP, 1024 bits), CDK extended fingerprint (Extended, 1024 bits), Klekota–Roth fingerprint (KRFP, 4860 bits), MACCS keys (MACCS, 166 bits), PubChem fingerprint (PubChem, 881 bits) and Substructure fingerprint (SubFP, 307 bits).
All the descriptors and fingerprints were calculated by the open source software package PaDEL-Descriptor,38 which has both a graphical user interface and command line interfaces. PaDEL-Descriptor can work on all major platforms (Windows, Linux, MacOS), and supports more than 90 different molecular file formats. It is a useful addition to the currently available molecular descriptor calculation software and it has been commonly used in drug discovery.
Model building
Among a multitude of available modeling methods, we applied five machine learning algorithms, including support vector machine (SVM),39 k-nearest neighbor (kNN),40 Naive Bayes (NB),41 C4.5 decision tree (DT)42 and random forest (RF).43 These algorithms are highly effective, robust and have been extensively used in QSAR modeling. In this study, the SVM algorithm was implemented in the open source LIBSVM (LIBSVM 3.16 package)44 and the other four algorithms were performed in Orange (version 2.7, freely available at https://orange.biolab.si/orange2/).
SVM is an excellent kernel-based tool for classification and regression introduced by Vapnik et al.39 The purpose of SVM training is to find an optimal hyperplane, which could discriminate molecules from different categories.28 SVM maps the input vectors into a higher dimensional feature space by using a kernel function.23 Herein, we used the Gaussian radial basis function (RBF) kernel. The parameters C and g for RBF kernel were sought with a grid search method based on 5-fold cross-validation.
The kNN algorithm is a method for classifying objects based on the closest training examples in the feature space. It is a type of instance-based learning or lazy learning, where the function is only approximated locally and all computation is deferred until classification. An object is classified by a majority vote of its neighbors, with the object being assigned to the class most common amongst its k nearest neighbors. In this study, the closeness was measured by Euclidean distance metrics and the parameter of k = 5 was used.
The NB classifier is based on Bayes' theorem with independent assumptions between predictors. A NB model is easy to build, with no complicated iterative parameter estimations, which makes it particularly useful for very large datasets.
C4.5 DT is an algorithm developed by Ross Quinlan that generates Decision Trees (DT), which can be used for classification problems. It improves Quinlan's earlier ID3 algorithm by dealing with both continuous and discrete attributes, missing values and pruning trees after construction. RF is an ensemble learning method for classification and regression that is operated by constructing a multitude of decision trees at training time. The mode of the classes output by individual trees is taken as the overall output.
The parameters of C4.5 DT, RF and NB algorithms were default in the Orange toolbox.
Assessment of model performance
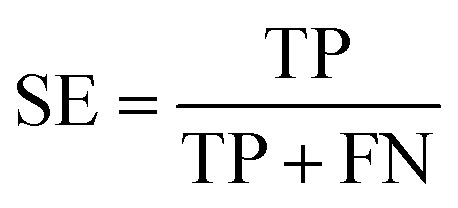
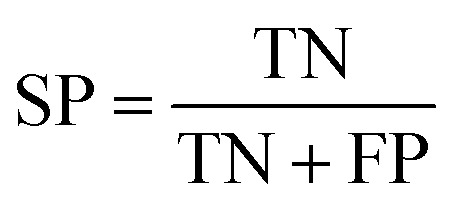
Several statistical parameters were used for assessment of model performance, including prediction accuracy (Q), sensitivity (SE), specificity (SP) and the Matthew's correlation coefficient (MCC), which are defined respectively in eqn (1)–(4).
 |
1 |
 |
2 |
 |
3 |
 |
4 |
TP, TN, FP and FN represent the numbers of true DILI-positives, true DILI-negatives, false DILI-positives and false DILI-negatives, respectively. SE stands for the prediction accuracy for DILI-positives and SP stands for the prediction accuracy for DILI-negatives. The MCC value is generally regarded as a balanced measure, which can be used even if the classes have very different sizes. It returns a value between −1 and 1. A coefficient of 1 represents a perfect prediction, 0 no better than random prediction and −1 indicates total disagreement between prediction and observation.34
In addition, we plotted the receiver operating characteristic (ROC) curve, which was used to graphically present the model behavior. The ROC curve can show the separation ability of a binary classification model by iteratively setting the possible threshold of classification.36 The values of the area under the ROC curves (AUC) were also computed. AUC is equal to the probability that a classifier will rank a randomly chosen positive instance higher than a randomly chosen negative instance. The principle is that if the plot has a surface area of 1, the classifier is perfect and if the area equals 0.5, the classifier is useless and random.34
Identification of privileged substructures or structural alerts
Structural alerts (SAs) or privileged substructures are defined as molecular frameworks, whose presence alerts investigators to the potential toxicities of chemicals.45 Chemical mutagenicity is one of the most widely studied end points for structural alerts. As early in 1988, Ashby found strong associations between chemical structures and their mutagenicity to Salmonella and suggested 11 substructures for alerts.46 Although only a few substructures were identified from a small data set by Ashby, it was widely accepted and developed.47 As an expert system, SAs are important risk assessment tools since they are derived directly from mechanistic knowledge.48 They can help identify key substructures to certain toxicity and avoid potential toxic compounds in the very early stages of drug development. SAs have been widely applied not only in drug discovery, but also in other fields such as cosmetic research and environmental protection.47 Several groups of SAs have been reported for different toxic endpoints.16,34,35,49–54
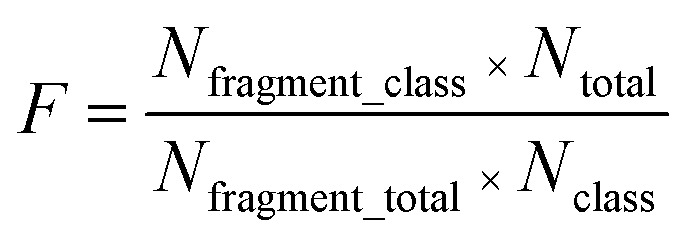
We identified the privileged substructures responsible for DILI with substructure fragment analysis50 methods based on KRFP fingerprints. If a substructure presented more frequently in DILI-positive chemicals than DILI-negative chemicals, this substructure would be regarded as a privileged substructure. The frequency of a substructure is defined as follows:
 |
5 |
where Nfragment_class is the number of chemicals containing the substructure in each class; Ntotal is the total number of chemicals; Nfragment_total is the total number of chemicals containing the substructure; Nclass is the number of chemicals in each class.
Results and discussion
Data analysis
After careful preparation, a total of 2295 organic compounds were extracted from data collection. As summarized in Table 1, the training set contained 1731 compounds (980 DILI-positives and 751 DILI-negatives) and the test set contained 413 compounds (270 DILI-positives and 143 DILI-negatives). Moreover, 151 compounds (88 DILI-positives and 63 DILI-negatives) were used as an external validation set.
The statistics of chemicals in the training set and external validation set.
| Data sets | DILI-positive | DILI-negative | Total |
|---|---|---|---|
| Training set | 980 | 751 | 1731 |
| Test set | 270 | 143 | 413 |
| External validation set | 88 | 63 | 151 |
| Total | 1338 | 957 | 2295 |
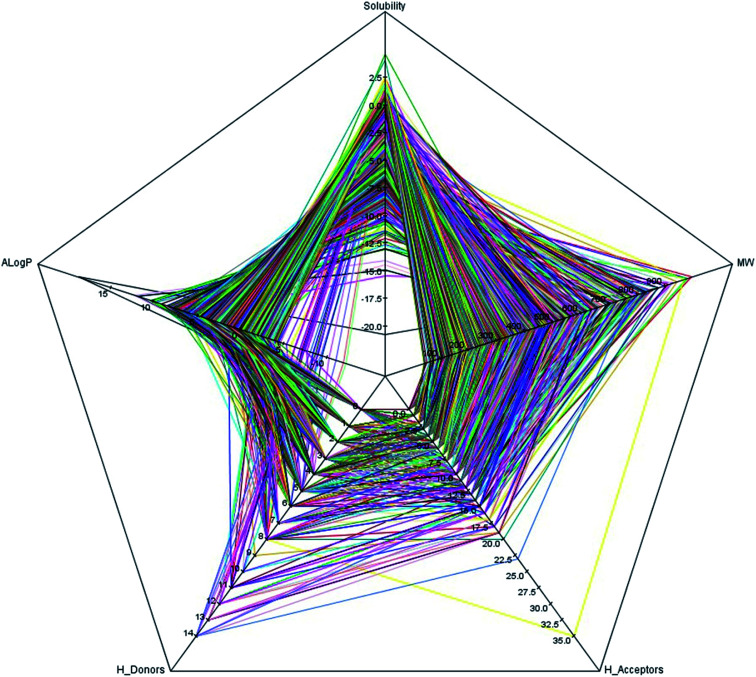
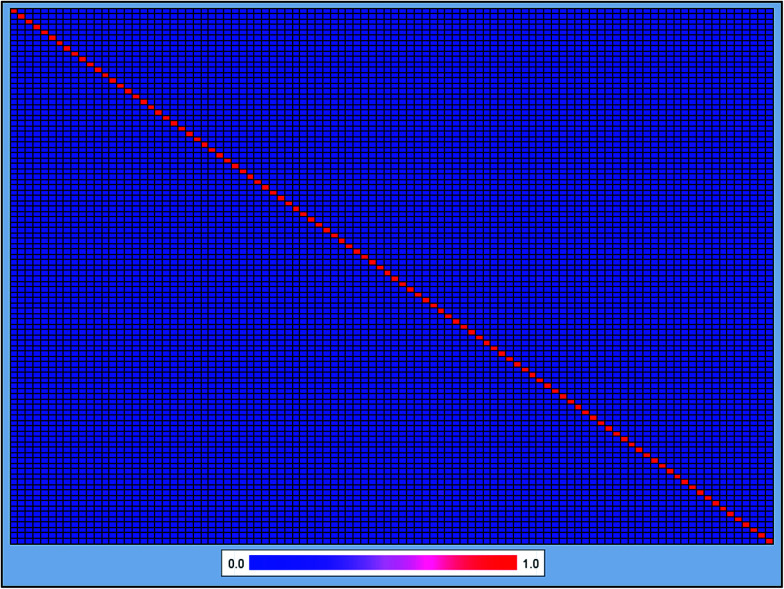
It is well known that the diversity of chemical structures is a key issue for global model building. QSAR models based on a relatively small dataset or homologous compounds always resulted in poor generalization abilities. In this study, we applied the radar chart to explore the chemical space of the entire data set as shown in Fig. 1. The MW values ranged from 43.07 to 994.19, the nHBA values ranged from 0 to 35, the nHBD values ranged from 0 to 14, the A log P values ranged from −12.21 to 18.77, and the log S values ranged from −20.78 to 4.58. These data suggested that the 2295 compounds in our data set covered a sufficiently large chemical space. We also calculated the Tanimoto similarity index55 based on the ECFP-4 fingerprint, which has been widely used to evaluate similarities among chemicals. The average Tanimoto similarity index was 0.128, indicating that the chemical structures in our data set were evidently diverse. We plotted the heat map of the Tanimoto similarity index of 100 randomly filtered molecules as shown in Fig. 2.
Fig. 1. The radar chart of five simple descriptors: molecular solubility (log S), A log P, molecular weight (MW), the number of hydrogen bond acceptors (nHBA) and the number of hydrogen bond donors (nHBD) for the entire data set of 2295 compounds are presented. Each color line represents a compound.
Fig. 2. Heat map of molecular similarity plotted by the Tanimoto similarity index using ECFC-4 fingerprint of 100 randomly filtered molecules. The average Tanimoto similarity index was 0.128. The x-axis and y-axis represent the 100 randomly filtered molecules.
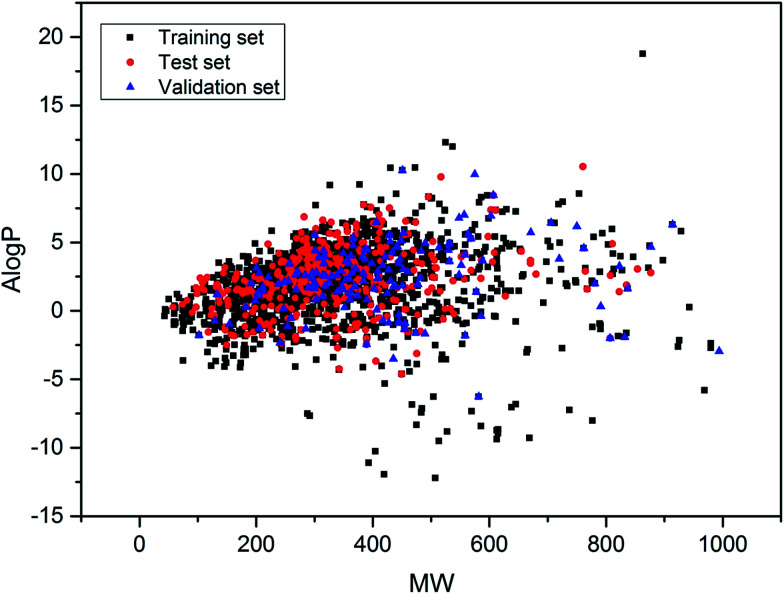
Furthermore, the data sets distributed in the chemical space defined by molecular weight (MW) and Ghose–Crippen log Kow (A log P) were analyzed. The distribution scatter diagram is presented in Fig. 3, which illustrated that the test and validation sets shared a similar chemical space with the training set.
Fig. 3. Chemical space defined by molecular weight and A log P of data sets. Black squares stand for the training set, red circles stand for the test set and blue triangles stand for the external validation set.
Results of model building
Five machine learning methods were employed for model building based on seven types of fingerprint and a set of molecular descriptors. Thus, a total of 40 classification models were developed by combination. As shown in Table 2, most of the models provided good predictive results on the test set. The prediction accuracy values ranged from 62.47% to 80.39%. Among them, the model developed by the SVM algorithm combined with MACCS keys gave the best result with a prediction accuracy of 80.39%, sensitivity of 88.15%, a specificity of 65.73%, an AUC of over 0.85 and MCC of over 0.55. Another three models (MACCS_kNN, FP_SVM and KRFP_SVM) also gave good results with Q values of over 75% and MCC values of over 0.5.
Performances of classification models on test set.
| Models | Q | SE | SP | AUC | MCC |
|---|---|---|---|---|---|
| Estate_kNN | 0.7167 | 0.7333 | 0.6853 | 0.7300 | 0.4047 |
| Estate_SVM | 0.7240 | 0.8667 | 0.4545 | 0.7633 | 0.3556 |
| Estate_RF | 0.7215 | 0.7741 | 0.6224 | 0.7826 | 0.3922 |
| Estate_NB | 0.6925 | 0.7370 | 0.6084 | 0.7334 | 0.3382 |
| Estate_CT | 0.6804 | 0.7074 | 0.6294 | 0.7164 | 0.3259 |
| Extend_NN | 0.7022 | 0.6741 | 0.7552 | 0.7740 | 0.4090 |
| Extend_SVM | 0.7482 | 0.8481 | 0.5594 | 0.8090 | 0.4261 |
| Extend_RF | 0.7264 | 0.6926 | 0.7902 | 0.8309 | 0.4600 |
| Extend_NB | 0.6174 | 0.5333 | 0.7762 | 0.7157 | 0.2978 |
| Extend_CT | 0.6513 | 0.6370 | 0.6783 | 0.6720 | 0.3005 |
| FP_kNN | 0.7119 | 0.6815 | 0.7692 | 0.7808 | 0.4294 |
| FP_SVM | 0.7893 | 0.8667 | 0.6434 | 0.8630 | 0.5247 |
| FP_RF | 0.6877 | 0.6185 | 0.8182 | 0.8401 | 0.4164 |
| FP_NB | 0.6174 | 0.5407 | 0.7622 | 0.7129 | 0.2907 |
| FP_CT | 0.6949 | 0.6963 | 0.6923 | 0.6812 | 0.3726 |
| MACCS_kNN | 0.7651 | 0.7333 | 0.8252 | 0.8243 | 0.5332 |
| MACCS_SVM | 0.8039 | 0.8815 | 0.6573 | 0.8578 | 0.5568 |
| MACCS_RF | 0.6828 | 0.6370 | 0.7692 | 0.8271 | 0.3866 |
| MACCS_NB | 0.6465 | 0.5667 | 0.7972 | 0.7566 | 0.3487 |
| MACCS_CT | 0.6901 | 0.7037 | 0.6643 | 0.7162 | 0.3544 |
| Pubchem_kNN | 0.7240 | 0.7148 | 0.7413 | 0.7794 | 0.4368 |
| Pubchem_SVM | 0.7748 | 0.8444 | 0.6434 | 0.8341 | 0.4957 |
| Pubchem_RF | 0.7264 | 0.6741 | 0.8252 | 0.8036 | 0.4751 |
| Pubchem_NB | 0.6562 | 0.5963 | 0.7692 | 0.7298 | 0.3485 |
| Pubchem_CT | 0.6610 | 0.6519 | 0.6783 | 0.6694 | 0.3151 |
| SubFP_kNN | 0.7191 | 0.7333 | 0.6923 | 0.7756 | 0.4111 |
| SubFP_SVM | 0.7651 | 0.8704 | 0.5664 | 0.8438 | 0.4624 |
| SubFP_RF | 0.7312 | 0.7519 | 0.6923 | 0.8111 | 0.4310 |
| SubFP_NB | 0.6973 | 0.6815 | 0.7273 | 0.7742 | 0.3902 |
| SubFP_CT | 0.7482 | 0.7593 | 0.7273 | 0.7691 | 0.4708 |
| KRFP_kNN | 0.7119 | 0.7074 | 0.7203 | 0.7848 | 0.4099 |
| KRFP_SVM | 0.7821 | 0.8926 | 0.5734 | 0.8234 | 0.5001 |
| KRFP_RF | 0.7119 | 0.7778 | 0.5874 | 0.7934 | 0.3646 |
| KRFP_NB | 0.6780 | 0.6556 | 0.7203 | 0.7298 | 0.3581 |
| KRFP_CT | 0.6634 | 0.6889 | 0.6154 | 0.6619 | 0.2937 |
| MD_kNN | 0.7288 | 0.7444 | 0.6993 | 0.7827 | 0.4294 |
| MD_SVM | 0.7094 | 0.8963 | 0.3566 | 0.7282 | 0.3060 |
| MD_RF | 0.6780 | 0.9667 | 0.1329 | 0.6948 | 0.1884 |
| MD_NB | 0.6247 | 0.7370 | 0.4126 | 0.6397 | 0.1533 |
| MD_CT | 0.6659 | 0.6852 | 0.6294 | 0.6645 | 0.3029 |
MCC is a single performance measure, which is less influenced by imbalanced data. Considering the apparent imbalance between positive and negative data in this study, we paid special attention to the MCC and Q values. According to the values of Q and MCC, ten models (MACCS_SVM, FP_SVM, KRFP_SVM, Pubchem_SVM, MACCS_kNN, SubFP_SVM, Extend_SVM, SubFP_CT, SubFP_RF and MD_kNN) were regarded as top performance models with the best predictive results (with Q > 72.88% and MCC > 0.4294) on the test data.
Performance of models on external validation
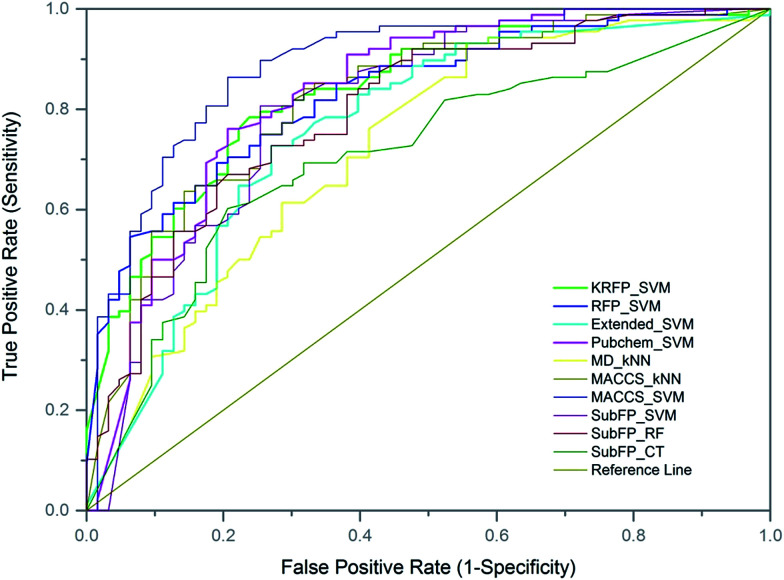
To further evaluate the predictive ability of the top-10 performed models, 151 compounds, independent of the training and test sets, were used for external validation. Since the data in the external set were completely independent from the model construction, the performance of the models on the external validation could demonstrate the predictive capability objectively. The results of the models on external validation are listed in Table 3 and the ROC curve is shown in Fig. 4. All the models, except SubFP_CT and MD_kNN, performed well with their Q values over 70% and their MCC values over 0.40. The MACCS_SVM model, which performed best on the test set, also achieved the best prediction accuracy of 82.78% on external validation and the values of SE, SP, AUC and MCC were 93.18%, 68.25%, 0.89 and 0.65, respectively. In addition, another three models (Pubchem_SVM, MACCS_kNN and SubFP_SVM) also provided good results on the validation set with Q values of over 75% and MCC of over 0.50. Compared with most of the existing DILI models from other groups, our models, particularly the MACCS_SVM model, showed better predictive ability. Numerous QSAR models have been developed for DILI prediction in the past, but none of them are available for public use. We made the MACCS_SVM model available at http://opensource.vslead.com. The user can freely predict the DILI potential of molecules by uploading a .smi file or printing the molecular SMILES formula. To maintain our web server available for public use, the size of upload .smi file is limited to 100 kb.
Performances of the top-10 classification models on external validation.
| Models | Q | SE | SP | AUC | MCC |
|---|---|---|---|---|---|
| MACCS_SVM | 0.8278 | 0.9318 | 0.6825 | 0.8880 | 0.6470 |
| FP_SVM | 0.7483 | 0.8750 | 0.5714 | 0.8303 | 0.4754 |
| KRFP_SVM | 0.7417 | 0.8523 | 0.5873 | 0.8326 | 0.4606 |
| Pubchem_SVM | 0.7881 | 0.9091 | 0.6190 | 0.8289 | 0.5625 |
| MACCS_kNN | 0.7616 | 0.8068 | 0.6984 | 0.8194 | 0.5077 |
| SubFP_SVM | 0.7616 | 0.8864 | 0.5873 | 0.8045 | 0.5044 |
| Extend_SVM | 0.7219 | 0.8523 | 0.5397 | 0.7604 | 0.4174 |
| SubFP_CT | 0.6755 | 0.7159 | 0.6190 | 0.7060 | 0.3342 |
| SubFP_RF | 0.7351 | 0.7841 | 0.6667 | 0.7950 | 0.4530 |
| MD_kNN | 0.6556 | 0.6818 | 0.6190 | 0.7233 | 0.2986 |
Fig. 4. Representation of receiver operating characteristics (ROC) curve for models on external validation set. The AUC value for each model: MACCS_SVM (0.8880), FP_SVM (0.8303), KRFP_SVM (0.8326), Pubchem_SVM (0.8289), MACCS_kNN (0.8194), SubFP_SVM (0.8045), Extend_SVM (0.7604), SubFP_CT (0.7060), SubFP_RF (0.7950), MD_kNN (0.7233).
Effects of machine learning algorithms and fingerprints used in model building
In this study, we used five different machine learning methods (SVM, C4.5 DT, RF, kNN and NB) for model building. From the performance of the models on test sets and external validation, we found that the SVM algorithm clearly dominated and provided the largest number of top-performing models. Among the 10 best performing models, 6 were developed by SVM. The kNN algorithm contributed two top-performing models and the other two models that performed well were developed by DT and RF.
It is not surprising that SVM algorithm performed best on DILI model building. It is well known that SVM algorithm is the most suitable tool for small sample, nonlinear and high dimensional pattern problems. With appropriately chosen kernel and corresponding parameters, this algorithm could provide a good out-of-sample generalization even when the training sample has some bias. Moreover, all the features in the fingerprints were saved to avoid the loss of information in our study. The high dimensional samples highlighted the advantages of SVM on high dimensional pattern problems. This also resulted in the SVM displaying a better performance than other machine learning methods for model building. This result is in agreement with our previously published study, which also concluded that the SVM is a good classification algorithm for chemical toxicity prediction.34,50,51,56,57
Eight different patterns, including 7 fingerprint types and a set of molecular descriptors containing 12 key physical–chemical properties, were used for molecular characterization. The fingerprints performed better than the molecular descriptors. Only one top-performing model was developed with molecular descriptors, while 9 top-performing models were developed with fingerprints. The MACCS and SubFP fingerprints accounted for half of the models with the best performance. In particular, the model built with MACCS and SVM achieved the best predictive results both on the test set and external validation. MACCS and SubFP fingerprints contained a great deal of structural information as they were generated based on the well-defined structural fragments dictionary. In consideration of this result, MACCS and SubFP fingerprints were recommended as the preferential attributes for chemical DILI model building.
Relevance of selected chemical descriptor to DILI
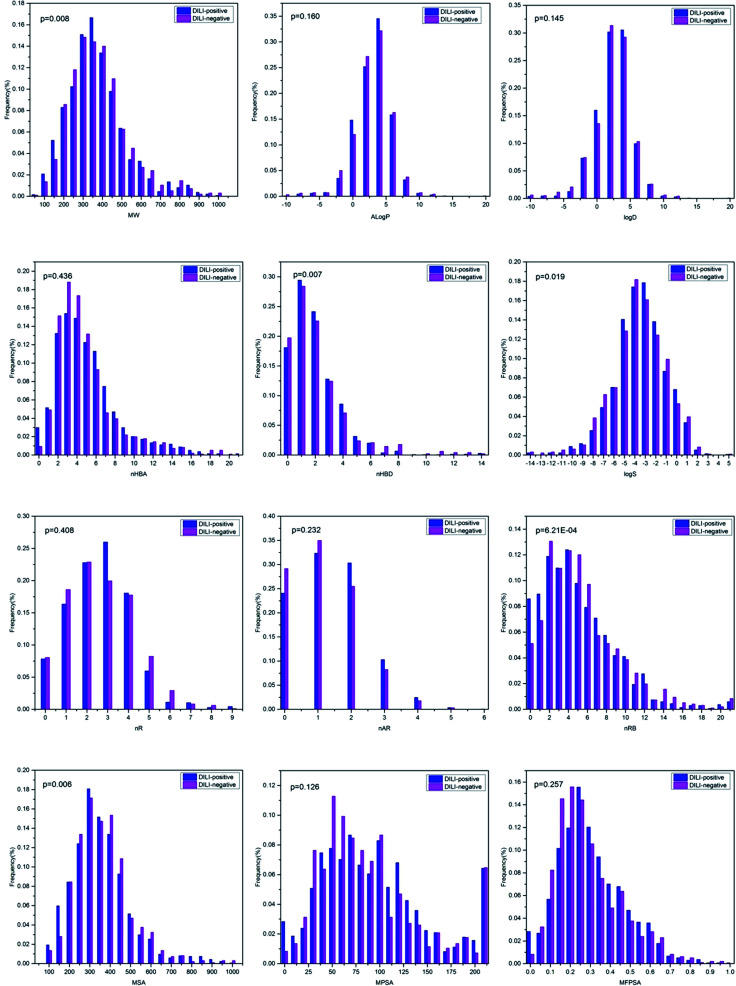
Although the models based on molecular descriptors did not perform satisfactorily when compared with those based on fingerprints, these physicochemical properties still present a great deal of useful information for distinguishing DILI-positive compounds from DILI-negative compounds. The relationships between the DILI-potential of 2295 chemicals and 12 key physicochemical descriptors are presented in Fig. 5.
Fig. 5. Distributions of twelve key molecular properties, including molecular weight (MW), Ghose–Crippen log Kow (A log P), log D, the number of hydrogen bond acceptors (nHBA), the number of hydrogen bond donors (nHBD), molecular solubility (log S), the number of rings (nR), the number of aromatic rings (nAR), the number of rotatable bonds (nRTB), molecular surface area (MSA), molecular polar surface area (MPSA) and molecular fractional polar surface area (MFPSA) for the high HBT chemicals and none HBT chemicals.
MW and MSA were regarded as simple estimations of molecular size and complexity. The MW distribution was between 43.07 and 994.19 with a mean of 347.53. The mean values of MW were 343.88 and 352.63 for DILI-positive and DILI-negative compounds, respectively, with a p-value of 0.008. This indicates that DILI-negative chemicals are likely to have higher MW value. MSA was distributed from 92.56 to 722.37 with a mean of 293.68. The mean values of MSA were 329.59 and 279.02 for DILI-positive and DILI-negative compounds, respectively, with a p-value of 0.006. A log P and log D represent the lipophilicity of a compound. In our dataset, A log P was distributed between −12.21 and 18.77 with a mean of 2.01 and log D was distributed between −23.78 and 18.77 with a mean of 1.38. The mean values of A log P were 2.03 and 1.99 for DILI-positive and DILI-negative compounds and the mean values of log D were 1.42 and 1.33 for DILI-positive and DILI-negative compounds, respectively. The p-values between the mean A log P and log D for the DILI-positive and DILI-negative chemicals were 0.160 and 0.145, respectively, indicative of no or low significant difference. Hydrogen bonding ability was commonly represented by nHBA and nHBD. As shown in Fig. 3, the mean values of nHBA were 5.08 and 4.90 for DILI-positive and DILI-negative compounds, respectively, with a p-value of 0.436. The mean values of nHBD were 1.96 and 2.12 for DILI-positive and DILI-negative compounds, respectively. The value of nHBD of chemicals indicated high significant difference of the mean nHBA of DILI-positive and DILI-negative chemicals with the lower p-value of 0.007. Moreover, the values of log S and value of nR of chemicals indicated a high significant difference of the mean nR of DILI-positive and DILI-negative chemicals with the low p-values of 0.019 and 3.21 × 10⁻⁴, respectively. Moreover, the p-values between the mean nR, nAR, MPSA and MFPSA for the DILI-positive and DILI-negative chemicals were 0.408, 0.232, 0.126 and 0.257, respectively, indicative of no or low significant difference.
The results indicated that these physical and chemical properties have a weak differentiating effect on DILI potential although no individual property can be a key factor for chemical DILI potential. In fact, DILI is a complex chemical and biological process comprising numerous steps. It is very difficult to explain the DILI mechanism using individual or several simple chemical descriptors. This should be the primary reason why the models based on MD did not perform well.
Results of structural alerts identification
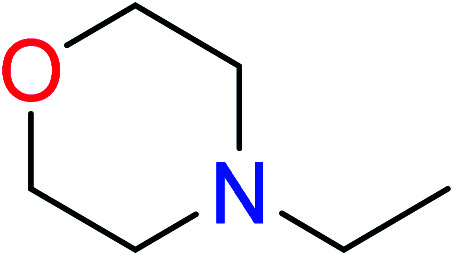
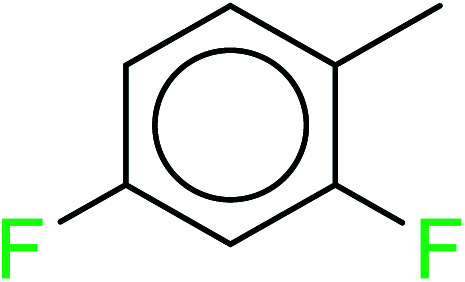
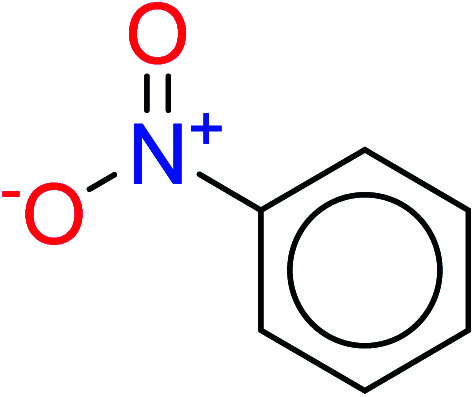
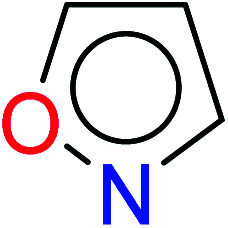
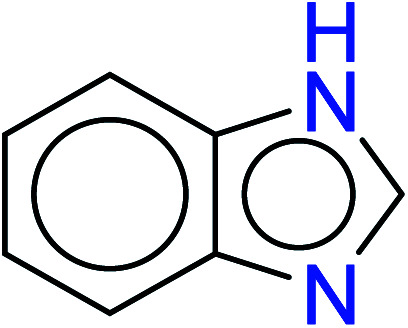
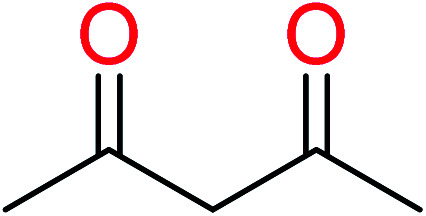
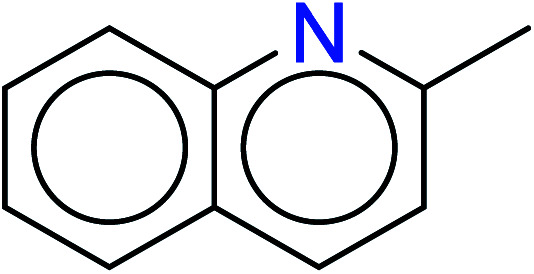
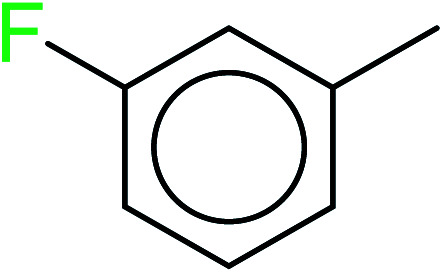
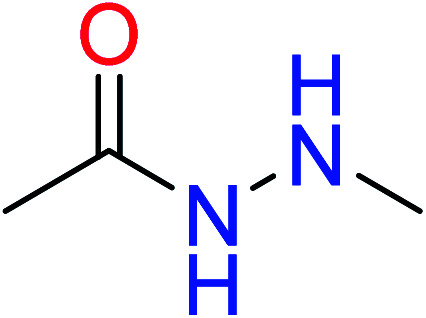
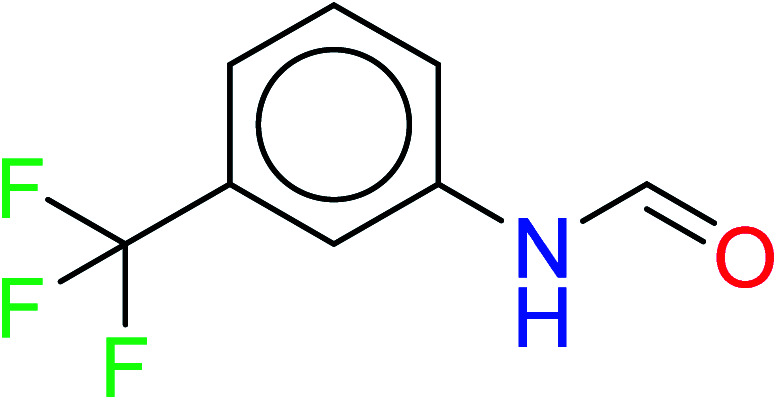
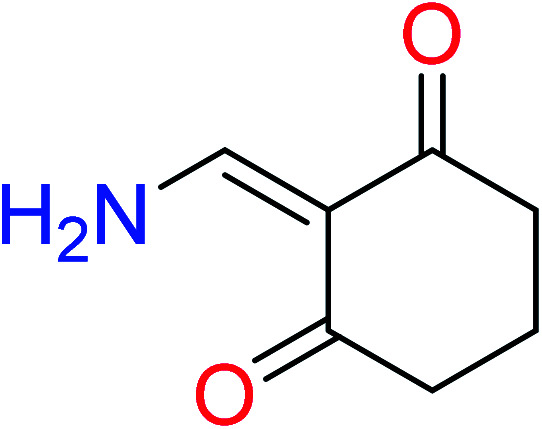
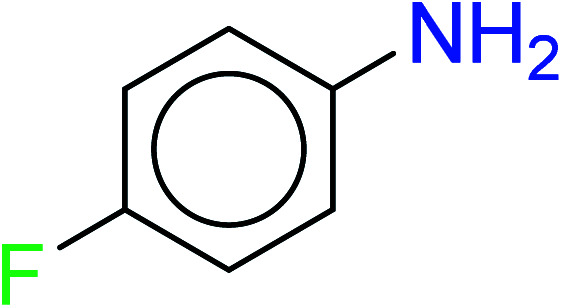
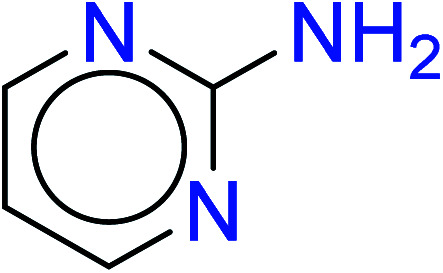
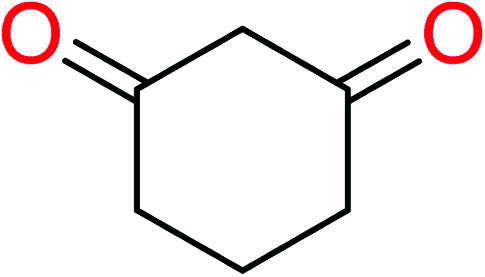
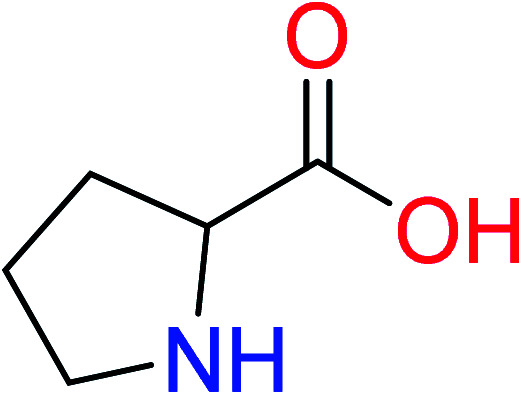
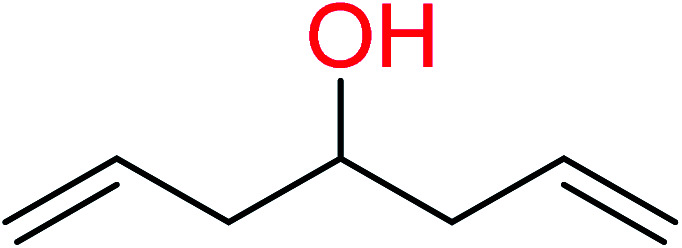
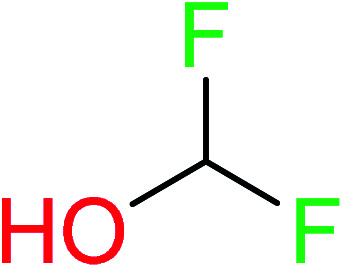
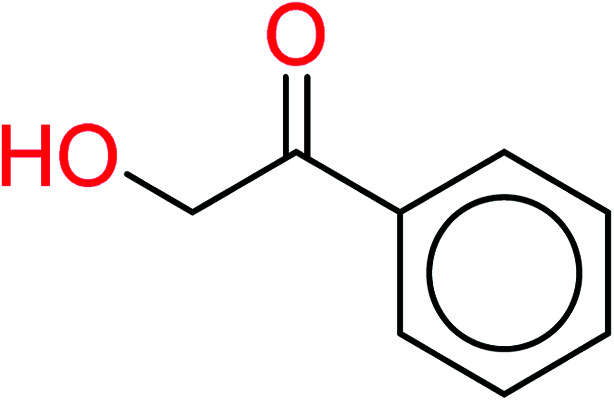
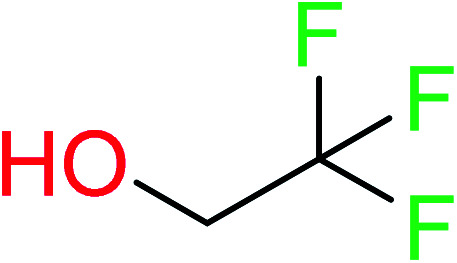
In order to visually explore the structural features of DILI-positive and DILI-negative chemicals, several privileged substructures responsible for DILI were identified by substructure frequency analysis from the substructures in the KRFP fingerprint. KRFP is a very good chemical substructure fingerprint enriching compound biological activity.37 Herein, only the substructures presented in 10 or more compounds were analyzed. The frequency of each KRFP substructure appearing in DILI-positive and DILI-negative compounds was calculated; 20 representative substructures stood out and are listed in Table 4. These substructures appeared far more frequently in the DILI-positive compounds than in the DILI-negative compounds. It is worth mentioning that only four substructures (no. 2, no. 12, no. 17 and no. 18) are classified as DILI-positive compounds.
The privileged substructures from KRFP and SubFP fingerprints responsible for HBT.
| ID | Bit | N positive | F positive | N negative | F negative | General structure |
|---|---|---|---|---|---|---|
| 1 | KR644 | 10 | 1.56 | 1 | 0.22 |
|
| 2 | KR1799 | 11 | 1.72 | 0 | 0 |
|
| 3 | KR2934 | 38 | 1.42 | 8 | 0.42 |
|
| 4 | KR3182 | 15 | 1.43 | 3 | 0.40 |
|
| 5 | KR3206 | 13 | 1.49 | 2 | 0.32 |
|
| 6 | KR3223 | 13 | 1.49 | 2 | 0.32 |

|
| 7 | KR3288 | 13 | 1.59 | 1 | 0.17 |
|
| 8 | KR3569 | 12 | 1.47 | 2 | 0.34 |
|
| 9 | KR3586 | 30 | 1.47 | 5 | 0.34 |
|
| 10 | KR3953 | 13 | 1.49 | 2 | 0.32 |
|
| 11 | KR4045 | 10 | 1.56 | 1 | 0.22 |
|
| 12 | KR4232 | 10 | 1.72 | 0 | 0 |
|
| 13 | KR4252 | 29 | 1.55 | 3 | 0.22 |
|
| 14 | KR4274 | 33 | 1.42 | 7 | 0.42 |
|
| 15 | KR4396 | 11 | 1.57 | 1 | 0.20 |
|
| 16 | KR4651 | 15 | 1.51 | 2 | 0.28 |
|
| 17 | KR4689 | 12 | 1.72 | 0 | 0 |
|
| 18 | KR4692 | 11 | 1.72 | 0 | 0 |
|
| 19 | KR4778 | 10 | 1.56 | 1 | 0.22 |
|
| 20 | KR4808 | 10 | 1.56 | 1 | 0.22 |
|
In these privileged substructures, six fragments are fluorine-containing groups. The carbon–fluorine bond is metabolically stable in general and fluorine usually acts as a bioisostere of the hydrogen atom. The presence of fluorine atoms always results in an extreme increase of the drug lipophilicity, which could enrich the intracellular concentration of hepatotoxic drugs.28 In total, 11 fragments are amine or nitro derivatives (two substructures, no. 11 and no. 13, are both fluorine-containing groups and amine derivatives). They could bind to proteins through covalent bonds with cysteine residues via Michael addition reactions and result in DILI.58
These identified privileged substructures could be regarded as structural alerts responsible for DILI and we hope that they could be used to predict the DILI potential of new compounds.
Prediction of DILI for TCM components
Since DILI is one of the major concerns among the TCM-induced toxic effects and the safety assessment of TCM is costly and time-consuming, we attempted to estimate the DILI potential of ingredients in TCM using the best model (MACCS_SVM) developed in this study. The chemical components of TCM were extracted from the TCMDatabase@Taiwan.59 We collected 33 679 compounds isolated from 8445 TCM plants. After preparation, 21 518 unique chemicals were extracted. Before the DILI prediction of TCM components, an applicability domain (AD) experiment was performed. The AD analysis was performed on the basis of the ranges distances approach using the Ambit Discovery software (version 0.04, available free of cost at http://ambit.sourceforge.net/download_ambitdiscovery.html). It was observed that 17 276 compounds were predicted to be in the domain of the MACCS_SVM model. In total, 10 745 (62.20%) TCM components were predicted as DILI-positive.
These compounds are present in 5678 TCM plants. In total, 227 predicted DILI-positive compounds are present in more than 10 TCM plants. Among them, stigmasterol is the most frequently detected ingredient, which is present in 99 TCM plants. Moreover, another nine TCM compounds, namely, quercetin, gallic acid, oleanolic acid, scopoletin, berberine, kaempferol, ursolic acid, palmatine and eugenol are present in more than 40 TCM plants. There are 140 TCM plants containing more than 20 predicted DILI-positive compounds. Morus alba contains the most predicted DILI-positive compounds; a total of 104 constituents present in Morus alba. In addition, another 12 TCM plants, namely, Zingiber officinale, Ligusticum chuanxiong, Salvia miltiorrhiza, Houttuynia cordata, Artemisia annua L., Angelica sinensis, Schisandra chinensis (Turcz.) Baill., Tripterygium wilfordii, Taxus baccata, Panax notoginseng, Artemisia capillaries and Panax ginseng C. A. Mey. contain more than 50 predicted DILI-positive compounds.
The compounds predicted as DILI-positive and the TCM plants containing a larger number of these components should be paid close attention to avoid DILI in humans.
Conclusions
In the present study, we focused on the in silico prediction of human DILI potential. A large diverse data set containing 2295 unique compounds with human DILI data was collected for model building and validation. A series of binary classification models were developed using five different machine learning methods and eight different feature reduction methods (seven types of fingerprints and a set of molecular descriptors containing 12 physicochemical properties). The model developed with MACCS fingerprints using SVM algorithms performed best both on the test set and external validation set. The user can predict the DILI potential of molecules freely at http://opensource.vslead.com.
The structural characteristics of the DILI-positive chemicals and DILI-negative chemicals were also analyzed. The distributions of the 12 key physicochemical properties showed more or less difference between DILI-positive and DILI-negative compounds. Furthermore, 20 substructures identified from KRFP fingerprints are present far more frequently in DILI-positive compounds than DILI-negative compounds. Thus, these substructures could be regard as structural alerts responsible for DILI. In addition, we predicted the DILI potential of ingredients in TCM using the MACCS_SVM model developed in this study.
We hope that the in silico models and structural alerts could provide critical information and be useful tools for predicting DILI potential of new chemicals.
Conflicts of interest
The authors declare no competing financial interest.
Supplementary Material
Acknowledgments
This work was supported by Beijing Postdoctoral Research Foundation (Grant 2017-ZZ-074) and the Special Promotion For Scientific Small and Medium Enterprise of Beijing (Grant Z16010101204).
References
- Kotsampasakou E. Montanari F. Ecker G. F. Toxicology. 2017;389:139–145. doi: 10.1016/j.tox.2017.06.003. [DOI] [PMC free article] [PubMed] [Google Scholar]
- Chen M. Vijay V. Shi Q. Liu Z. Fang H. Tong W. Drug Discovery Today. 2011;16:697–703. doi: 10.1016/j.drudis.2011.05.007. [DOI] [PubMed] [Google Scholar]
- Kane J. A. Kane S. P. Jain S. Gut. 1995;36:146–147. doi: 10.1136/gut.36.1.146. [DOI] [PMC free article] [PubMed] [Google Scholar]
- Teschke R. J. Clin. Transl. Hepatol. 2014;2:80–94. doi: 10.14218/JCTH.2014.00003. [DOI] [PMC free article] [PubMed] [Google Scholar]
- Wang J. Xiao X. Du X. Zou Z. Song H. Guo X. Zhongguo Zhong Yao Za Zhi. 2014;39:5–9. [PubMed] [Google Scholar]
- Chang L. Huang N. Chou Y. Lee C. Kao F. Huang Y. BMC Health Serv. Res. 2008;8:170. doi: 10.1186/1472-6963-8-170. [DOI] [PMC free article] [PubMed] [Google Scholar]
- Jordan S. A. Cunningham D. G. Marles R. J. Toxicol. Appl. Pharmacol. 2010;243:198–216. doi: 10.1016/j.taap.2009.12.005. [DOI] [PubMed] [Google Scholar]
- Ko R. J. J. Chin. Med. Assoc. 2004;67:109–116. [PubMed] [Google Scholar]
- Luo G. Shen Y. Yang L. Lu A. Xiang Z. Arch. Toxicol. 2017:1–11. doi: 10.1007/s00204-017-2024-8. [DOI] [PubMed] [Google Scholar]
- Hoofnagle J. H. Serrano J. Knoben J. E. Navarro V. J. Hepatology. 2013;57:873. doi: 10.1002/hep.26175. [DOI] [PMC free article] [PubMed] [Google Scholar]
- Chen M. Zhang J. Wang Y. Liu Z. Kelly R. Zhou G. Fang H. Borlak J. Tong W. Clin. Pharmacol. Ther. 2013;93:409. doi: 10.1038/clpt.2013.16. [DOI] [PubMed] [Google Scholar]
- Igarashi Y. Nakatsu N. Yamashita T. Ono A. Ohno Y. Urushidani T. Yamada H. Nucleic Acids Res. 2015;43:D921. doi: 10.1093/nar/gku955. [DOI] [PMC free article] [PubMed] [Google Scholar]
- Li X. Wu L. Liu Y. Ni A. Lu X. Fan X. J. Appl. Toxicol. 2014;34:805–809. doi: 10.1002/jat.2893. [DOI] [PubMed] [Google Scholar]
- Mao Y. Chin. Hepatol. 2014:575–576. [Google Scholar]
- Fourches D. Barnes J. C. Day N. C. Bradley P. Reed J. Z. Tropsha A. Chem. Res. Toxicol. 2010;23:171–183. doi: 10.1021/tx900326k. [DOI] [PMC free article] [PubMed] [Google Scholar]
- Wang Q. Li X. Yang H. Cai Y. Wang Y. Wang Z. Li W. Tang Y. Liu G. RSC Adv. 2017;7:6697–6703. doi: 10.1039/C6RA25267B. [DOI] [Google Scholar]
- Cheng A. Dixon S. L. J. Comput.-Aided Mol. Des. 2003;17:811–823. doi: 10.1023/B:JCAM.0000021834.50768.c6. [DOI] [PubMed] [Google Scholar]
- Chen M. Bisgin H. Tong L. Hong H. Fang H. Borlak J. Tong W. Biomarkers Med. 2014;8:201–213. doi: 10.2217/bmm.13.146. [DOI] [PubMed] [Google Scholar]
- Ekins S. J. Pharmacol. Toxicol. Methods. 2014;69:115–140. doi: 10.1016/j.vascn.2013.12.003. [DOI] [PubMed] [Google Scholar]
- Chen M. Hong H. Fang H. Kelly R. Zhou G. Borlak J. Tong W. Toxicol. Sci. 2013;136:242–249. doi: 10.1093/toxsci/kft189. [DOI] [PubMed] [Google Scholar]
- Cruz-Monteagudo M. Cordeiro M. N. D. S. Borges F. J. Comput. Chem. 2008;29:533–549. doi: 10.1002/jcc.20812. [DOI] [PubMed] [Google Scholar]
- Ekins S. Williams A. J. Xu J. J. Drug Metab. Dispos. 2010;38:2302. doi: 10.1124/dmd.110.035113. [DOI] [PubMed] [Google Scholar]
- Liew C. Lim Y. Yap C. J. Comput.-Aided Mol. Des. 2011;25:855. doi: 10.1007/s10822-011-9468-3. [DOI] [PubMed] [Google Scholar]
- Liu J. Mansouri K. Judson R. S. Martin M. T. Hong H. Chen M. Xu X. Thomas R. S. Shah I. Chem. Res. Toxicol. 2015;28:738–751. doi: 10.1021/tx500501h. [DOI] [PubMed] [Google Scholar]
- Liu Z. Shi Q. Ding D. Kelly R. Fang H. Tong W. PLoS Comput. Biol. 2011;7:e1002310. doi: 10.1371/journal.pcbi.1002310. [DOI] [PMC free article] [PubMed] [Google Scholar]
- Rodgers A. D. Zhu H. Fourches D. Rusyn I. Tropsha A. Chem. Res. Toxicol. 2010;23:724–732. doi: 10.1021/tx900451r. [DOI] [PMC free article] [PubMed] [Google Scholar]
- Mulliner D. Schmidt F. Stolte M. Spirkl H.-P. Czich A. Amberg A. Chem. Res. Toxicol. 2016;29:757–767. doi: 10.1021/acs.chemrestox.5b00465. [DOI] [PubMed] [Google Scholar]
- Zhang C. Cheng F. Li W. Liu G. Lee P. W. Tang Y. Mol. Inf. 2016;35:136–144. doi: 10.1002/minf.201500055. [DOI] [PubMed] [Google Scholar]
- Przybylak K. R. Cronin M. T. Expert Opin. Drug Metab. Toxicol. 2012;8:201–217. doi: 10.1517/17425255.2012.648613. [DOI] [PubMed] [Google Scholar]
- Zhu X. Sedykh A. Liu S. J. Appl. Toxicol. 2014;34:281–288. doi: 10.1002/jat.2879. [DOI] [PubMed] [Google Scholar]
- Kim E. Nam H. BMC Bioinf. 2017;18:227. doi: 10.1186/s12859-017-1638-4. [DOI] [PMC free article] [PubMed] [Google Scholar]
- Ivanov S. Semin M. Lagunin A. Filimonov D. Poroikov V. Mol. Inf. 2017;36:1600142. doi: 10.1002/minf.201600142. [DOI] [PubMed] [Google Scholar]
- Hou T. Wang J. Expert Opin. Drug Metab. Toxicol. 2008;4:759–770. doi: 10.1517/17425255.4.6.759. [DOI] [PubMed] [Google Scholar]
- Li X. Zhang Y. Chen H. Li H. Zhao Y. J. Chem. Inf. Model. 2017;57:2948–2957. doi: 10.1021/acs.jcim.7b00476. [DOI] [PubMed] [Google Scholar]
- Zhang C. Zhou Y. Gu S. Wu Z. Wu W. Liu C. Wang K. Liu G. Li W. Lee P. W. Tang Y. Toxicol. Res. 2016;5:570–582. doi: 10.1039/C5TX00294J. [DOI] [PMC free article] [PubMed] [Google Scholar]
- Cheng F. Yu Y. Zhou Y. Shen Z. Xiao W. Liu G. Li W. Lee P. W. Tang Y. J. Chem. Inf. Model. 2011;51:2482–2495. doi: 10.1021/ci200317s. [DOI] [PubMed] [Google Scholar]
- Klekota J. Roth F. P. Bioinformatics. 2008;24:2518–2525. doi: 10.1093/bioinformatics/btn479. [DOI] [PMC free article] [PubMed] [Google Scholar]
- Yap C. J. Comput. Chem. 2011;32:1466–1474. doi: 10.1002/jcc.21707. [DOI] [PubMed] [Google Scholar]
- Cortes C. Vapnik V. Mach. Learn. 1995;20:273–297. [Google Scholar]
- Cover T. Hart P. IEEE Trans. Inf. Theory. 1967;13:21–27. doi: 10.1109/TIT.1967.1053964. [DOI] [Google Scholar]
- Watson P. J. Chem. Inf. Model. 2008;48:166–178. doi: 10.1021/ci7003253. [DOI] [PubMed] [Google Scholar]
- Quinlan J. R., C4.5: Programs for Machine Learning, Margan Kaufmann, San Francisco, 1993 [Google Scholar]
- Breiman L. Mach. Learn. 2001;45:5–32. doi: 10.1023/A:1010933404324. [DOI] [Google Scholar]
- Chang C. Lin C. ACM Trans. Intell. Syst. Technol. 2011;2:1–27. doi: 10.1145/1961189.1961199. [DOI] [Google Scholar]
- Ashby J. Environ. Mutagen. 1985;7:919–921. doi: 10.1002/em.2860070613. [DOI] [PubMed] [Google Scholar]
- Ashby J. Tennant R. W. Mutat. Res. 1988;204:17–115. doi: 10.1016/0165-1218(88)90114-0. [DOI] [PubMed] [Google Scholar]
- Yang H. Li J. Wu Z. Li W. Liu G. Tang Y. Chem. Res. Toxicol. 2017;30:1355–1364. doi: 10.1021/acs.chemrestox.7b00083. [DOI] [PubMed] [Google Scholar]
- Benigni R. Bossa C. Mutat. Res. Rev. Mutat. Res. 2008;659:248–261. doi: 10.1016/j.mrrev.2008.05.003. [DOI] [PubMed] [Google Scholar]
- Cheng F. Shen J. Yu Y. Li W. Liu G. Lee P. W. Tang Y. Chemosphere. 2011;82:1636–1643. doi: 10.1016/j.chemosphere.2010.11.043. [DOI] [PubMed] [Google Scholar]
- Li X. Chen L. Cheng F. Wu Z. Bian H. Xu C. Li W. Liu G. Shen X. Tang Y. J. Chem. Inf. Model. 2014;54:1061–1069. doi: 10.1021/ci5000467. [DOI] [PubMed] [Google Scholar]
- Li X. Zhang Y. Chen H. Li H. Zhao Y. RSC Adv. 2017;7:41330–41338. doi: 10.1039/C7RA08415C. [DOI] [Google Scholar]
- Sun L. Zhang C. Chen Y. Li X. Zhuang S. Li W. Liu G. Lee P. W. Tang Y. Toxicol. Res. 2015;4:452–463. doi: 10.1039/C4TX00174E. [DOI] [Google Scholar]
- Xu C. Cheng F. Chen L. Du Z. Li W. Liu G. Lee P. W. Tang Y. J. Chem. Inf. Model. 2012;52:2840–2847. doi: 10.1021/ci300400a. [DOI] [PubMed] [Google Scholar]
- Zhang C. Cheng F. Sun L. Zhuang S. Li W. Liu G. Lee P. W. Tang Y. Chemosphere. 2015;122:280–287. doi: 10.1016/j.chemosphere.2014.12.001. [DOI] [PubMed] [Google Scholar]
- Butina D. J. Chem. Inf. Comput. Sci. 1999;39:747–750. doi: 10.1021/ci9803381. [DOI] [Google Scholar]
- Li X. Du Z. Wang J. Wu Z. Li W. Liu G. Shen X. Tang Y. Mol. Inf. 2015;34:228–235. doi: 10.1002/minf.201400127. [DOI] [PubMed] [Google Scholar]
- Li X. Zhang Y. Li H. Zhao Y. Mol. Inf. 2017;36:1700074. doi: 10.1002/minf.201700074. [DOI] [PubMed] [Google Scholar]
- Sanderson J. P. Naisbitt D. J. Farrell J. Ashby C. A. Tucker M. J. Rieder M. J. Pirmohamed M. Clarke S. E. Park B. K. J. Immunol. 2007;178:5533. doi: 10.4049/jimmunol.178.9.5533. [DOI] [PubMed] [Google Scholar]
- Chen C. PLoS One. 2011;6:e15939. doi: 10.1371/journal.pone.0015939. [DOI] [PMC free article] [PubMed] [Google Scholar]


