Abstract
A zeolitic 4A type material was successfully prepared from natural basalt rock by applying an alkali fusion process and hydrothermal synthesis. In particular, the optimum synthetic conditions were examined at different crystallization times. Several methods such as XRD, SEM, EDX, and N2 and CO2 adsorption analysis were used to characterize the synthesized 4A type zeolite. In addition, CO2 adsorption equilibrium capacities for this basalt base zeolite were measured over temperature ranges from 283 to 303 K and pressure ranges from 0.1 to 1500 kPa in a volumetric adsorption apparatus. Then the results were compared to those of commercial zeolite. Moreover, to further investigate the surface energetic heterogeneity of the prepared zeolite, the isosteric heat of adsorption and adsorption energy distribution was determined. We found that basalt based zeolite 4A shows a CO2 adsorption equilibrium capacity of 5.9 mmol g−1 (at 293 K and 1500 kPa) which is much higher than the 3.6 mmol g−1 of the commercial zeolite as its micro-pore surface area, micro-pore volume and surface heterogeneity indicate.
A zeolitic 4A type material was successfully prepared from natural basalt rock by applying an alkali fusion process and hydrothermal synthesis.
1. Introduction
Recently, global warming has become a representative environmental issue in the world, and carbon dioxide (CO2) is one of the major greenhouse gases.1 Most emissions of CO2 to the atmosphere from electric power generation plants and industrial sectors are in the form of flue gas from combustion processes. Since CO2 is often the major impurity in natural gas, its presence can reduce the energy content of natural gas. Therefore, the separation and capture of CO2 from flue gas is an effective way to control the CO2 emission.2
The most common technology used to remove CO2 from natural gas is amine absorption in gas–liquid contactors.3 However, the absorption systems involve highly corrosive solvents that require high temperature to regenerate the amine solvent. Thus, the pressure swing adsorption (PSA) has been applied widely as a possible technology for CO2 separation from natural gas. Especially, the PSA system as an adsorption process of CO2 is required for suitable adsorbents with high selectivity and adsorption capacity.4 Presently, various porous materials such as zeolite, activated carbon (AC), metal–organic framework (MOF), meso-porous TiO2, and amine impregnated mesoporous silicate have been extensively applied for the CO2 separation and capture by adsorption process.5 Among those materials, the zeolite, with its high selectivity, long-term stability, and high adsorption capacity, is well known as an environmentally stable adsorbent for removing CO2.6 Moreover, the synthetic zeolite can easily be obtained from alumino-silicates source such as sand, quartz, clay, kaolin, fly ash, and volcanic rocks by applying a hydrothermal synthesis procedure based on the solubility of aluminum–silicon containing components in alkaline materials.7 The earth's surface contains approximately 8.5% of rocks that are basalt, a widespread porous materials included in the alumino-silicates.8 To date, the basalt fibers have been widely used for heat- and sound-insulation materials. However, very few attempts have been made to synthesize the nanostructured porous adsorbent from basalt rock.
In this work, we investigate the synthesis and adsorption properties of zeolite from the basalt rock in South Korea, using alkaline material as sodium hydroxide in the alkali fusion process for elution the alumino-silicates. A 4A-type zeolite was successfully prepared by hydrothermal synthesis with eluted alumino-silicates from basalt. In particular, the crystallization time that strongly affects the properties of the zeolite product was examined in the preparation process of zeolite. In addition to the common characteristics of the zeolite, this paper also systemically investigated the adsorption properties of CO2 on zeolite product such as adsorption equilibrium, isosteric heat of adsorption, and adsorption energy distribution. The zeolite product prepared from basalt may be employed as an efficient adsorbent for CO2 removal.
2. Materials and methods
2.1 . Preparation
The basalt rock obtained from Hantan riverside in Cheorwon-gun, South Korea, was grinded into powders using Jaw Crucher (Pulverrisette 1, Fritsch Co.), and it was further milled to a mean particle size of approximately 30 μm by disk mill machine (Pulverrisette 13, Fritsch Co.). The micronized basalt was pretreated by means of an acid aqueous treatment. At this stage, the basalt was refluxed with a 1 M hydrochloric acid (Aldrich Co.) aqueous solution (10 g of basalt powder/200 ml of HCL solution) at 80 °C for 2 h to remove iron oxide that is known to be undesirable for zeolite synthesis.9 The basalt was dried at 120 °C for 12 h before the zeolite synthesis. The amorphous SiO2 and Al2O3 components in basalt were used as the precursor source of zeolite (Si and Al). The preliminary synthesis procedure started by mixing 10 g of pretreated basalt power with 20 g of ground sodium hydroxide (Aldrich Co.). The mixture was alkalized in air at 500 °C for 1 h in a furnace. The alkalized product was grinded and transferred to a 250 ml media bottle with a screw cap containing 100 ml of distilled water, which was then mixed at room temperature for 2 h. The extracted solution was separated into supernatant and solid by filtration (0.4 μm PTFE membrane filter). For supernatant solution, alumino-silicate was poured into a 250 ml round flask reactor with x g sodium aluminum oxide (NaAlO2, Aldrich Co.), in which the zeolite synthesis process was performed at 90 °C for durations of 2, 4, 8, 12 and 24 h for separate experiments. In this process, the mixtures were stirred at 500 rpm by mechanical stirrer. Then, solid part separated by filtration was thoroughly washed with distilled water, and dried at 120 °C for 12 h.
2.2 . Characterization and CO2 adsorption studies
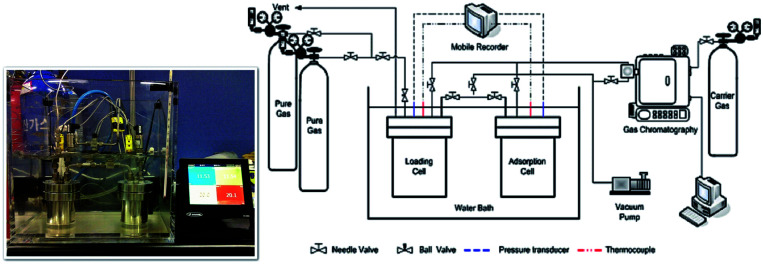
The textural structure and the composition of the synthesized materials were characterized by using X-ray diffraction (XRD), field emission scanning microscopy (FE-SEM, S-4700, Hitachi Co.), and energy dispersive X-ray spectroscopy (EDX) techniques. The XRD patterns were obtained on a D/MAX-2500 (Rigaku Co.) unit with Cu-Kα radiation (λ = 1.540 Å) and interpreted with the help of the X-ray powder pattern database of the International Zeolite Association.10 The crystallite size was calculated from the XRD results applying Scherrer equation.11 The specific surface area and pore volume were determined on the basis of the nitrogen (77 K) and carbon dioxide (298 K) adsorption (nano Porosity-XG, MiraeSI Co.) isotherm data. The high pressure carbon dioxide (CO2) adsorptions were measured using the volumetric system.12Fig. 1 shows the schematic diagram of CO2 adsorption apparatus, which is mainly composed of adsorption and loading cells. In order to connect the two cells, 1/4 inch tubes and valves were used. Those experimental cells in a water bath consist of stainless-steel with a volume of 152 ml and 150 ml, respectively. The temperature in both reservoirs is measured by using K-type thermocouple within ±0.01 K accuracy; the pressure in both cell compartments was measured with a pressure transducer. The temperature and pressure were recorded at constant time intervals with a recorder (MV100, Yokogawa Co., Japan). During adsorption in a water bath (SWB-20, Jeio Tech., South Korea), the two cells and all the lines were immersed and maintained at ±0.02 K, which were controlled using a refrigerated circulator (RBC-11, Jeio Tech., South Korea). Before the adsorbent was weighed into the adsorption cell, it was treated at 573.15 K for 12 h under high vacuum to remove the pollutants adsorbed on the adsorbent. The adsorbent weighed within 10 mg accuracy was then placed in the adsorption cell. The moisture and impurities remaining in the cells were again eliminated by using a vacuum pump for 3 h before the adsorbate was introduced into the adsorption cell. The CO2 adsorption experiment started after the temperature and pressure in the two cells reached the equilibrium levels. In this work, the adsorption equilibrium is assumed to be established when the temperature and pressure in the cells remain constant. At that point, the equilibrium temperature and pressure values were recorded and they were used to calculate the adsorption equilibrium amount. The mass balance equation based on the pressure–volume–temperature (PVT) relation was given by eqn (1):
 |
1 |
where, P is pressure, V is volume, Z is the compressibility factor, R is the gas constant, T is temperature, l is the loading cell, a is the adsorption cell, q is the adsorbed amount, and M is the molecule weight, respectively. The number, 1 and 2, represents the initial and the final adsorption equilibrium state.
Fig. 1. Schematic of high pressure CO2 adsorption apparatus.
3. Results and discussion
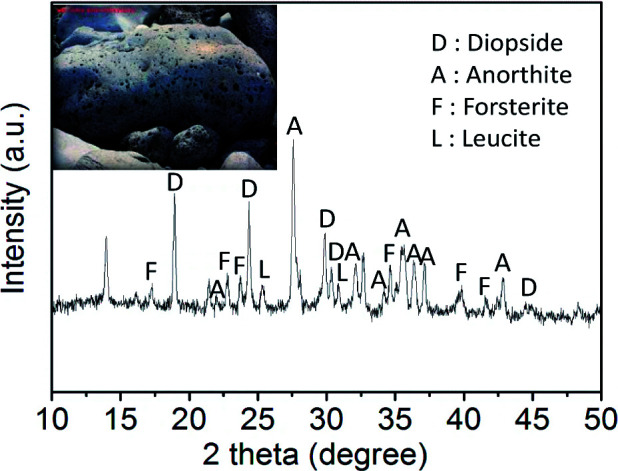
The basic properties of basalt rock are summarized in Table 1. The inside picture of Table 1 shows the basalt rock used in synthesizing zeolite in this study. The mineralogical compositions of basalt rock were determined by considering the XRD patterns. The XRD patterns reveal that the basalt rock is mainly composed of diopside (CaMg(SiO3)2, JCPDS card no. 11-0654), anorthite ((Ca,Na) (Al,Si)2Si2O8, JCPDS card no. 20-0528), forsterite ((Mg,Fe)2SiO4, JCPDS card no. 31-0795), and leucite (K(AlSi2O6), JCPDS card no. 15-0047), which is identical to the findings of previous mineralogical studies.13 The EDX results showed the following average chemical composition of micronized basalt: O: 48.23; Al: 12.31; Si: 19.89; Ca: 6.17; Mg: 4.66; Na: 2.55; K: 3.15; Fe: 3.04. Here the Si/Al molar ratio was determined to be about 1.6, which means that the micronized basalt is suitable for the synthesis of zeolite 4A with the molar ratio of 1.0.14
XRD pattern and elemental composition of basalt rock.
| Basalt image (inlet) and XRD pattern | Compound | Weight% |
|---|---|---|
|
Oxygen (O) | 48.23 |
| Aluminum (Al) | 12.31 | |
| Silicon (Si) | 19.89 | |
| Calcium (Ca) | 6.17 | |
| Magnesium (Mg) | 4.66 | |
| Sodium (Na) | 2.55 | |
| Potassium (K) | 3.15 | |
| Iron (Fe) | 3.04 |
To synthesize high-purity zeolite 4A from micronized basalt, this work used the alkali fusion process to convert the basalt into sodium alumino-silicate. Fig. 2 shows the FE-SEM morphology of micronized basalt (a) and alkali fused basalt (b). Although Fig. 2(a) shows that the morphology of basalt looks as though it is heterogeneous and composed of irregular and aggregated particles, Fig. 2(b) shows a different morphology found from alkali fused basalt, in which the basalt is composed of uniform and interconnected particles. These results clearly indicate that the micronized basalt is thoroughly alkali-fused through the alkali fusion process.
Fig. 2. FE-SEM images of micronized basalt (raw material: (a)) and alkali fused basalt (precursor for synthesis of zeolite: (b)).
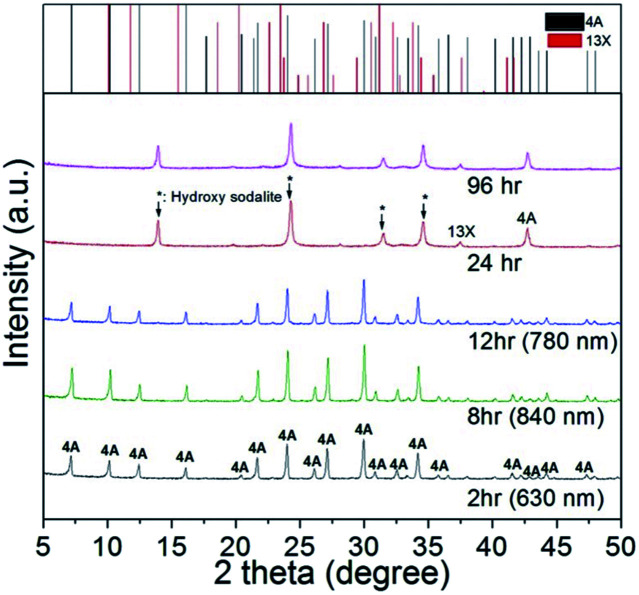
The alumino-silicate fused materials obtained after the alkali fusion are amorphous, and they are changed to a crystalline state when zeolite 4A is subjected to hydrothermal crystallization. At this point, a sufficient addition of sodium-alumina was also necessary to synthesize zeolite 4A with Na/Si/Al ratio of 1.0.15 A close scrutiny of the analytical results presented in Fig. 3 and 4 reveals that hydrothermal crystallization time plays a key role of influencing the crystallinity of zeolite. Fig. 3 shows the XRD patterns of zeolite products synthesized with different crystallization time at 90 °C. They indicate that at lower crystallization time (<12 h), the zeolite 4A (i.e., Na4A: JCPDS card no. 43-0142)16 is in the main crystalline phase, while at a longer crystallization time (>24 h), the zeolite 4A is changed to hydroxyl sodalite zeolite17 and zeolite 13X.18 In addition, the zeolite 4A synthesized in this study has a crystallite size ranging from 630 nm to 780 nm. This means that the zeolite 4A synthesized at crystallization time of 8 h has the largest crystallite size of 840 nm. Table 2 shows the chemical composition results of the zeolite product prepared with different crystallization times at 90 °C by EDX analysis. From the EDX results, it was confirmed that the basalt based zeolite prepared from the alumino-silicate fused materials consists of Na, O, Si, and Al and the basalt based zeolite product has a Na-based zeolite structure.
Fig. 3. XRD patterns of zeolite products prepared from basalt at different crystallization time. *(↓) Crystallite size calculated from Scherrer equation.
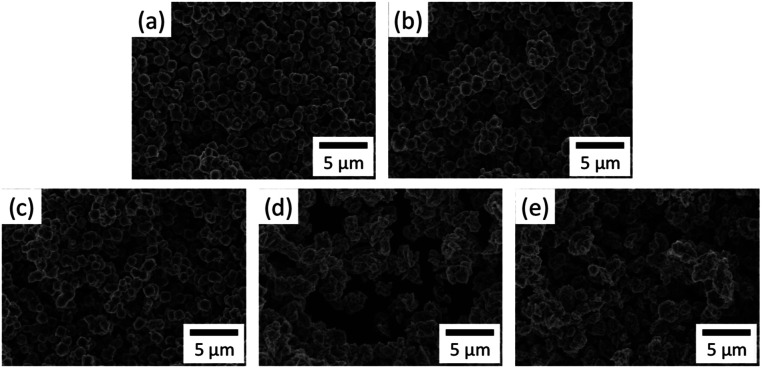
Fig. 4. FE-SEM images from zeolite products prepared at different crystallization time: (a) 2 h, (b) 8 h, (c) 12 h, (d) 24 h, (e) 96 h.
Chemical composition of zeolite products prepared at different crystallization time.
| Compound | Crystallization time | ||||
|---|---|---|---|---|---|
| 2 h | 8 h | 12 h | 24 h | 96 h | |
| At% | At% | At% | At% | At% | |
| Oxygen (O) | 62.31 | 61.56 | 61.98 | 61.98 | 62.04 |
| Sodium (Na) | 12.30 | 13.01 | 13.33 | 13.70 | 14.12 |
| Aluminum (Al) | 12.58 | 12.52 | 12.01 | 11.94 | 11.24 |
| Silicon (Si) | 12.81 | 12.91 | 12.68 | 12.38 | 12.60 |
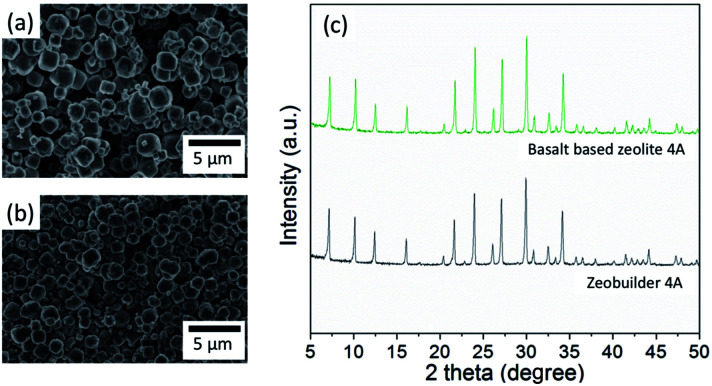
Fig. 4 shows the FE-SEM images from zeolite products prepared at different crystallization times. As compared in this figure, the zeolite prepared from the crystallization time of 2 h to 12 h has the regular cubic shape of Na4A with an average particle size of 2 μm. However, the zeolite synthesized after the crystallization time of 24 h has the irregular shape of hydroxyl sodalite and zeolite 13X with the average particle size of 2.5 μm. These findings suggest that the zeolite prepared at the crystallization time of 8 h has a high crystallinity and uniform shape of Na4A structure similar to that of commercial zeolite 4A (i.e. zeobuilder 4A,19 Zeobuilder Co., Ltd., South Korea; Fig. 5). Thus in this work we chose the zeolite synthesized at a crystallization time of 8 h (denoted as basalt based zeolite 4A here) for further textural characterization and adsorption study.
Fig. 5. FE-SEM images of commercial zeolite (a) and basalt based zeolite 4A (b). XRD patterns of commercial zeolite (i.e., Zeobuilder 4A) and basalt based zeolite 4A (c).
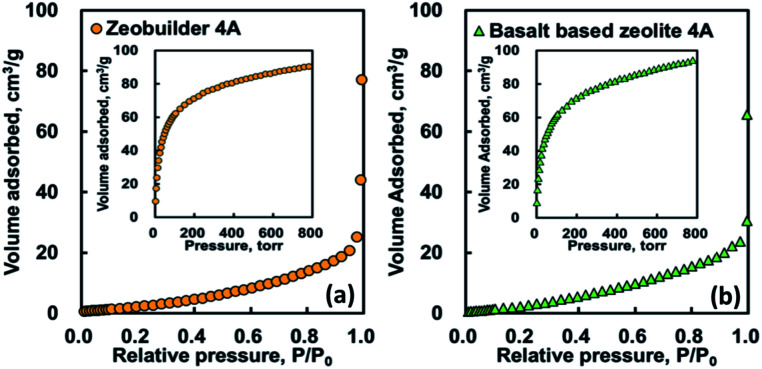
Nitrogen and carbon dioxide adsorption analyses were useful for a comparative study of the textural properties of nanostructured porous solids. Fig. 6 shows the nitrogen and carbon dioxide (see, inset of Fig. 6) adsorption isotherm curves for zeobuilder 4A and basalt based zeolite 4A, respectively. As shown in this figure, the nitrogen adsorption amount measured at 77 K are very small in both cases and the isotherm curves increased unfavourably with relative pressure, following the type V of the IUPAC definition.20 Previous characterization studies have already confirmed that the low temperature N2 adsorption is not useful in examining the porous materials with very narrow micropores because of the limitation of diffusion related to the kinetic diameter and kinetic energy of the probe molecule.21,22 Thus the CO2 adsorption has been alternatively used to characterize the supermicropore materials due to the absence of kinetic effects. Unlike the N2 adsorption, the isotherm shapes of CO2 adsorption are of type I, which suggests the existence of very narrow microporosity. Table 3 compares the porous textural properties of the zeolites, which were determined from nitrogen and carbon dioxide adsorption isotherm results. These findings clearly indicate that low temperature N2 adsorption analysis is not suitable for ultramicroporous zeolites. It is also found from the CO2 adsorption analysis that the tested zeolites possess a comparable amount of micropore surface area and micropore volume which play a role as a useful site for removing the CO2.
Fig. 6. Nitrogen (77 K) and carbon dioxide (298 K) isotherms for zeobuilder 4A (a) and basalt based zeolite 4A (b).
Textural properties of commercial zeolite 4A and basalt based zeolite 4A.
| Sample | N2 (77 K) | CO2 (298 K) | |||
|---|---|---|---|---|---|
| Surface area (m2 g−1) | Pore volume (cm3 g−1) | Surface area (m2 g−1) | Pore volume (cm3 g−1) | ||
| BETa | Total | DRb | DRb | DRb | |
| Zeobuilder 4A | 14 | 0.07 | 0 | 684 | 0.324 |
| Basalt based zeolite 4A | 19 | 0.05 | 0 | 726 | 0.345 |
Brunauer–Emmett–Teller.
Dubinin–Radushkevich.
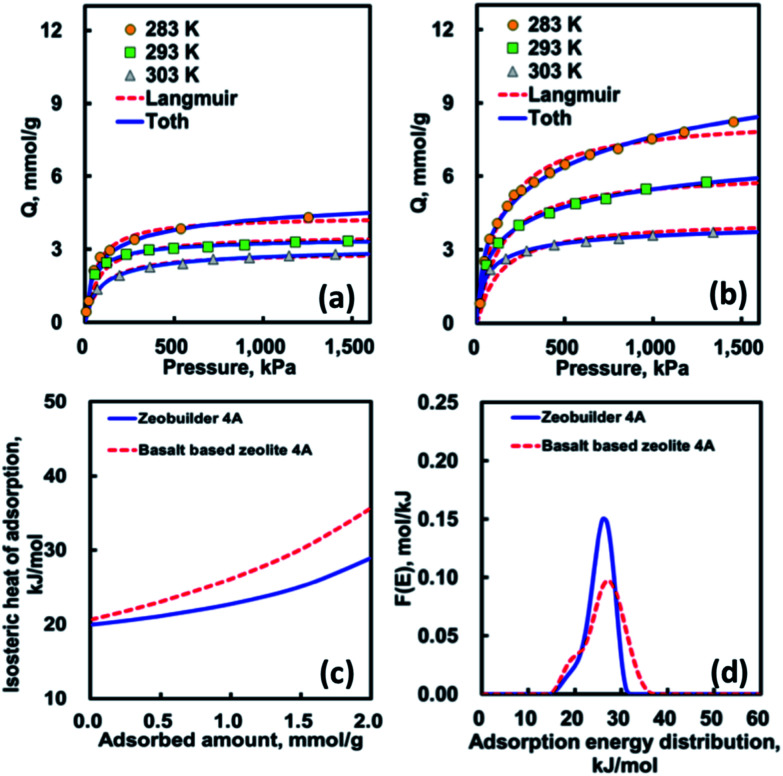
Fig. 7(a) and (b) show the CO2 adsorption isotherm data for two different zeolites together with the isotherm fitting results. As shown in this figure, the adsorption equilibrium amounts decreased as the system temperature increased. In addition, the basalt based zeolite 4A represents the adsorption equilibrium amount higher than zeobuilder 4A, which is closely related to its relatively larger micropore surface area and micropore volume. Table 4 lists the optimized isotherm parameters determined by using a pattern search algorithm and the sum of residuals (SOR). As compared in Fig. 7(a) and (b) and Table 4, the Toth isotherm equation represents the fitting results better than that of the Langmuir isotherm equation. In addition, the system heterogeneity parameter t in the Toth equation is lower than the unity of one in all cases.23 This means that the surfaces of both zeolites are energetically heterogeneous rather than homogeneous. Moreover, the surface of the basalt based zeolite 4A is more heterogeneous than that of the zeobuilder 4A.
Fig. 7. Adsorption isotherm of carbon dioxide on (a) zeobuilder 4A and (b) basalt based zeolite 4A: Toth equation (solid line); Langmuir equation (dotted line). Isosteric heat of adsorption (c) and adsorption energy distribution curves (d) for carbon dioxide: zeobuilder 4A (solid line); basalt based zeolite 4A (dotted line).
Isotherm parameters.
| Model | Temperature [K] | Zeobuilder 4A | Basalt based zeolite 4A | ||||
|---|---|---|---|---|---|---|---|
| 283 | 293 | 303 | 283 | 293 | 303 | ||
| Langmuira | q m [mmol g−1] | 4.346 | 3.565 | 2.903 | 8.446 | 6.217 | 4.210 |
| b [kPa−1] | 0.017 | 0.014 | 0.011 | 0.0076 | 0.0075 | 0.0074 | |
| SORc | 0.068 | 0.139 | 0.016 | 0.455 | 0.250 | 0.308 | |
| Tothb | q m [mmol g−1] | 5.920 | 3.538 | 3.183 | 18.508 | 9.385 | 4.333 |
| b [kPa−1] | 0.061 | 0.045 | 0.017 | 0.057 | 0.053 | 0.046 | |
| t [–] | 0.444 | 0.711 | 0.722 | 0.297 | 0.376 | 0.563 | |
| SORc | 0.044 | 0.003 | 0.004 | 0.180 | 0.010 | 0.006 | |
q = qmbC/1 + bC.
q = qmbC/(1 + (bC)t)1/t.
SOR = ∑(qexp − qcal)2/2.
Fig. 7(c) shows that the isosteric heat of adsorption (IHA) for CO2 as a function of adsorbed amount is also a useful thermodynamic variable in characterizing the porous solid. We used the Clausius–Clapeyron equation in evaluating the isosteric heat of adsorption.23 The average isosteric heat values are approximately 23 kJ mol−1 (basalt based zeolite 4A) and 21 kJ mol−1 (zeobuilder 4A), respectively. The IHA curves slightly increased with the increasing adsorption amount, revealing the existence of different levels of adsorption energy and the relative dominance of the adsorbate–adsorbate interaction in this system. On the other hand, the adsorption heat values of CO2 at zero coverage are approximately 21 kJ mol−1 (basalt based zeolite 4A) and 20 kJ mol−1 (zeobuilder 4A), which are only about 41–45% of values reported by the other research groups.24–26 It is, however, interesting to note that the values obtained in this work are in very good agreement with other published adsorption enthalpy values for single cation site,25,26 which indicate that the CO2 molecule mainly adsorbs on single cation sites present in basalt based zeolite 4A and zeobuilder 4A.
To further understand the surface energetic heterogeneity of the samples, we used the adsorption energy distribution function (AEDF), which was calculated using the generalized nonlinear regularization method with the Langmuir isotherm equation as a kernel.27–31 As shown in Fig. 7(d), it is clear that the shapes of AEDFs slightly differ from each other, confirming the presence of the different types of adsorption energy. This means that the shape of AEDF curve for basalt based zeolite is much broader and lower than that of the zeobuilder. These findings imply that the surface of basalt based zeolite 4A is more energetically heterogeneous than that of zeobuilder 4A. Similar to those of average IHA, the maximum peaks of the AEDF for both adsorbents are 26.9 kJ mol−1 (basalt based zeolite 4A) and 26.0 kJ mol−1 (zeobuilder 4A), respectively. It is, therefore, reasonable to suggest that the CO2 adsorption properties are highly dependent on the structural and energetic heterogeneity for microporous zeolite surfaces.
4. Conclusions
We have successfully synthesized a basalt rock based 4A type zeolite by using the facile alkali fusion and the hydrothermal processes. The 4A type zeolite obtained at optimum synthetic conditions (basalt based zeolite 4A) represents a high DR surface area and DR pore volume comparable to those of commercial zeolite. Thus the basalt based zeolite 4A shows high adsorption capacities for carbon dioxide. It is also found from the isosteric heats and the adsorption energy distributions that the surface of basalt based zeolite 4A are energetically more heterogeneous than those of commercial zeolite. Our results indicate that the basalt rock can be a useful precursor for synthesizing the nanostructured zeolite, showing a great potential for removal of carbon dioxide.
Conflicts of interest
There are no conflicts to declare.
Supplementary Material
Acknowledgments
This work was supported by the Basic Science Research Program through the National Research Foundation of Korea (NRF) funded by the Ministry of Education (2017R1D1A3B03034385).
Notes and references
- Azar C. Rodhe H. Science. 1997;276:1818–1819. doi: 10.1126/science.276.5320.1818. [DOI] [Google Scholar]
- Kenarsari S. D. Yang D. Jiang G. Zhang S. Wang J. Russell A. G. Wei Q. Fan M. RSC Adv. 2013;3:22739–22773. doi: 10.1039/C3RA43965H. [DOI] [Google Scholar]
- Jensen N. K. Rufford T. E. Watson G. Zhang D. K. Chan K. I. May E. F. J. Chem. Eng. Data. 2012;57:106–113. doi: 10.1021/je200817w. [DOI] [Google Scholar]
- Cavenati S. Grande C. A. Rodrigues A. E. J. Chem. Eng. Data. 2004;49:1095–1101. doi: 10.1021/je0498917. [DOI] [Google Scholar]
- Guo L. Yang J. Hu G. Hu X. DaCosta H. Fan M. Nano Energy. 2016;25:1–8. doi: 10.1016/j.nanoen.2016.04.038. [DOI] [Google Scholar]
- Cheung O. Hedin N. RSC Adv. 2014;4:14480–14494. doi: 10.1039/C3RA48052F. [DOI] [Google Scholar]
- Tschernich R. W., Zeolites of the World, Geoscience Press, Phoenix, 1992 [Google Scholar]
- Ammar N. S. Ismail A. I. M. El-Shafey O. I. Desalin. Water Treat. 2016;57:5089–5099. doi: 10.1080/19443994.2014.1003101. [DOI] [Google Scholar]
- Xiao M. Hu X. Gong Y. Gao D. Zhang P. Liu Q. Liu Y. Wang M. RSC Adv. 2015;5:100743–100749. doi: 10.1039/C5RA17856H. [DOI] [Google Scholar]
- Maitre R. W. L., Igneous Rocks: A Classification and Glossary of Terms: Recommendations of the International Union of Geological Sciences Sub commission on the Systematics of Igneous Rocks, Cambridge University Press, Cambridge, 2005 [Google Scholar]
- Singh A. K., Advanced X-ray Techniques in Research and Industries, IOS Press, Amsterdam, 2005 [Google Scholar]
- S Ahn H. C Jang S. Y Choi D. Kim S. H. Choi D. K. Korean Chem. Eng. Res. 2006;44:460–467. [Google Scholar]
- Rayalu S. S., Meshram S. U., Hasan M. Z. and Kaul S. N., Fly Ash Based Zeolite Technology: An Illustration of Waste to Wealth, Proceedings of the Fifteenth International Conference on Solid Waste Technology and Management, Philadelphia, 1999 [Google Scholar]
- Kang S. J. Egashira K. Yoshida A. Appl. Clay Sci. 1998;13:117–135. doi: 10.1016/S0169-1317(98)00019-2. [DOI] [Google Scholar]
- Loiola A. R. Andrade J. C. R. A. Sasaki J. M. da Silva L. R. D. J. Colloid Interface Sci. 2012;367:34–39. doi: 10.1016/j.jcis.2010.11.026. [DOI] [PubMed] [Google Scholar]
- Gougazeh M. Buhl J.-C. J. Assoc. Arab Univ. Basic Appl. Sci. 2014;15:35–42. [Google Scholar]
- Zhou C. Alshameri A. Yan C. Qiu X. Wang H. Ma Y. J. Porous Mater. 2013;20:587–594. doi: 10.1007/s10934-012-9631-9. [DOI] [Google Scholar]
- Sanchez-Hernandez R. Lopez-Delgado A. Padilla I. Galindo R. Lopez-Andres S. Microporous Mesoporous Mater. 2016;226:267–277. doi: 10.1016/j.micromeso.2016.01.037. [DOI] [Google Scholar]
- Chung K. H. Park H. Jeon K. J. Park Y. K. Jung S. C. Catalysts. 2016;6:1–12. doi: 10.3390/catal6120216. [DOI] [Google Scholar]
- Rouquerol F., Rouqueorol J. and Sing K., Adsorption by Powders and Porous Solids-Principles, Methodology and Applications, Academic Press, London, 1999 [Google Scholar]
- Breck D. W., Zeolite Molecular Sieves: Structure, Chemistry, and Use, Wiley, New York, 1974 [Google Scholar]
- Jensen N. K. Rufford T. E. Watson G. Zhang D. K. Chan K. I. May E. F. J. Chem. Eng. Data. 2012;57:106–113. doi: 10.1021/je200817w. [DOI] [Google Scholar]
- Do D. D., Adsorption Analysis: Equilibria and Kinetics, Imperial College Press, London, 1998 [Google Scholar]
- Palomino M. Corma A. Rey F. Valencia S. Langmuir. 2010;26:1910–1917. doi: 10.1021/la9026656. [DOI] [PubMed] [Google Scholar]
- Zukal A. Arean C. O. Delgado M. R. Nachtigall P. Pulido A. Mayerová J. Cejka J. Microporous Mesoporous Mater. 2011;146:97–105. doi: 10.1016/j.micromeso.2011.03.034. [DOI] [Google Scholar]
- Grajciar L. Cejka J. Zukal A. Arean C. O. Palomino G. T. Nachtigall P. ChemSusChem. 2012;5:2011–2022. doi: 10.1002/cssc.201200270. [DOI] [PubMed] [Google Scholar]
- Jaroniec M. and Madey R., Physical Adsorption on Heterogeneous Solids, Elsevier, Amsterdam, 1988 [Google Scholar]
- Rudzinski W. and Everett D., Adsorption of Gases on Heterogeneous Solid Surfaces, Academic Press, London, 1991 [Google Scholar]
- Nahm S. W. Shim W. G. Park Y. K. Kim S. C. Chem. Eng. J. 2012;210:500–509. doi: 10.1016/j.cej.2012.09.023. [DOI] [Google Scholar]
- Hwang K. J. Im C. Cho D. W. Yoo S.-J. Lee J.-W. Shim W.-G. RSC Adv. 2012;2:3034–3038. doi: 10.1039/C2RA01218A. [DOI] [Google Scholar]
- Hwang K. J. Park J. Y. Kim Y. J. Kim G. Choi C. Jin S. Kim N. Lee J. W. Shim W. G. Sep. Sci. Technol. 2015;50:1757–1767. doi: 10.1080/01496395.2015.1014056. [DOI] [Google Scholar]


