Abstract
Acute lung injury (ALI) is a severe respiratory disease. To date, no medical interventions have been proven effective in improving the outcome. Reduning injection (RDN) showed a potential effect in the therapy of ALI. However, seldom does research concern the holistic pharmacological mechanisms of RDN on ALI. A metabolomic strategy, based on two consecutive extractions of the lung tissue, has been developed to investigate therapeutic mechanisms of RDN on ALI model rat. The extraction procedure was an aqueous extraction with methanol–water followed by organic extraction with dichloromethane–methanol. According to the lipophilicity of extracts, aqueous extracts were analyzed on the T3 column and organic extracts on the C18 column. Partial least-squares discriminant analysis was utilized to identify differences in metabolic profiles of rats. A total of 14 potential biomarkers in lung tissue were identified, which mainly related to phospholipid metabolism, sphingolipid metabolism, nucleotide metabolism and energy metabolism. The combined analytical method provides complementary metabolomics information for exploring the action mechanism of RDN against ALI. And the obtained results indicate metabolomics is a promising tool for understanding the holism and synergism of traditional Chinese medicine.
A metabolomic strategy has been developed to investigate the therapeutic mechanistic insights of RDN on the ALI.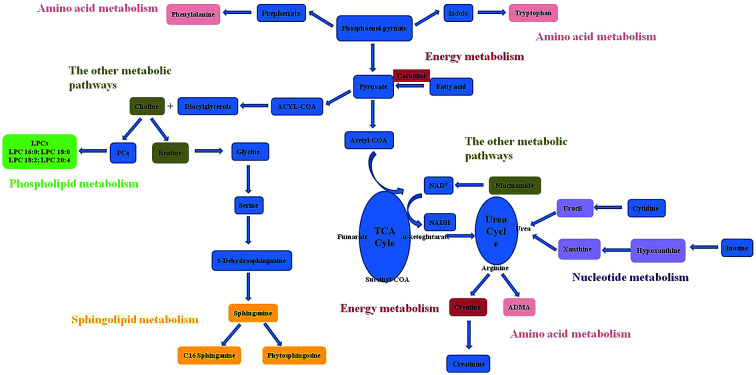
Introduction
Acute lung injury (ALI) is a clinical complication of microbial infection. It is characterized by excess production of inflammatory factors in lung tissue followed by severe hypoxemia and pulmonary edema, which even can cause acute respiratory distress syndrome (ARDS).1,2 ALI has gradually become a global public health problem due to its high incidence, morbidity and mortality. Despite extensive studies about the relevant pathogenesis having been reported to date, no effective therapeutic agents are available for ALI. Therefore, Traditional Chinese Medicine (TCM) that had synergistic effects in combination is likely to be a feasible alternative.3
Reduning injection (RDN), a patented TCM formula injection, was extracted from three herbs: Artemisia annua L., Gardenia jasminoides E. and Lonicera japonica T. These components possess potential antiviral, significant anti-inflammatory and immunomodulatory activities.4–6 Clinical studies demonstrated that RDN was effective in curing pneumonia and acute upper respiratory infection. Recently, Tang et al. reported that RDN showed promising protective effects against lipopolysaccharide-induced acute lung injury in rats.7 Although some studies proved that RDN significantly attenuated pulmonary inflammation, the mechanism in vivo was still unclear. Therefore, it is necessary to establish a method to understand how it can play an integrated role in the therapeutical effect of ALI model using some holistic techniques.
Metabolomics studies living systems from the whole system instead of isolated parts, and the strategy is well coincident with the systemic and integrity feature of TCM.8 And the tissue-targeted metabolomics that offers a unique perspective on localized metabolic information has caught increasing attention.9 As we know, it is important to ensure wide metabolite coverage in the metabolomics analysis. However, because of the diverse physicochemical properties of small molecules in specific biological samples, wide metabolites coverage has proven difficult to achieve. Challenges are even greater when it comes to tissue samples, where tissue lysis and metabolite extraction could induce significant variation in composition. And some studies have indicated that two consecutive extractions provided better results in terms of the reproducibility and number of metabolites extracted.10,11
Some advanced data acquiring methods, such as LC-MS, NMR, GC and so on can offering complementary information in analytical domain.11,12 MS has the advantages of low detection limits, large dynamic range and better spectral resolution, so, it can provide sensitive and reliable detection for both large biomolecules and small molecules.13,14 In this study, rat tissue samples were collected from normal, ALI model and RDN-treated group. And a global metabolomic strategy was established to broaden metabolites coverage that based on two consecutive extractions of the lung tissue with a combined UPLC-MS untargeted analysis technology. Meanwhile, multivariate statistical analysis in combination with pattern recognition techniques and metabolic pathway analysis were adopted to gain potential tissue markers for ALI. Therefore, this present study would contribute to gain the therapeutic mechanistic insights of RDN on the ALI.
Materials and methods
Chemicals and materials
RDN injection was provided by Jiangsu Kanion Pharmaceutical Co., Ltd. (Jiangsu, China). Lipopolysaccharide (LPS) (Escherichia coli 0111:B4) was purchased from Sigma Chemical (St. Louis, USA). TNF-α (Lot 5322916) was purchased from BD Biosciences (San Diego, USA) and IL-6 (Lot 116478033) was purchased from eBioscience (Vienna, Austria). BCA Protein Assay Kit (P0011) was obtained from Beyotime Institute of Biotechnology (Jiangsu, China). Acetonitrile of HPLC grade was supplied by Tedia (Fairfield, OH, USA). Formic acid of HPLC grade was supplied by Dikma Crop. (Richmond Hill, NY, USA). Purified water was obtained from Wahaha Co., Ltd. (Hangzhou, China).
Animal experiment
21 male Sprague-Dawley rats were purchased from Experimental Animal Center of Shenyang Pharmaceutical University (Shenyang, China). All animal procedures were performed in accordance with the Guidelines for Care and Use of Laboratory Animals of Shenyang Pharmaceutical University and approved by the Animal Ethics Committee of Shenyang Pharmaceutical University. All rats were kept under standard animal conditions (temperature: 17–25 °C; humidity: 45–60%; 12 h light–dark cycle). During the one-week habituation, all of the rats were guaranteed with free access to food and water. Animals were separated randomly into three groups (n = 7/group) as follows: control group, model group and treatment group. All the animals were treated by intravenous injection. LPS (7.5 mg kg−1) was administered to induce acute lung injury. In the treatment group, rats were given a single dose of RDN (5 mL kg−1) 30 min after LPS challenged.
Sample collection
At 6 h after LPS administration, the rats were sacrificed with intraperitoneal injection of 10% chloral hydrate. The right lung was immediately excised, washed with physiological saline and stored at −80 °C until further metabolomics measurement. And the left lung was subjected to bronchoalveolar lavage for the measurement of total protein, IL-6 and TNF-α. The left lung was lavaged with 2.0 mL of ice-cold phosphate buffered saline in total three times. The bronchoalveolar lavage fluid (BALF) was immediately centrifuged (500 × g, 10 min, 4 °C), and the supernatants were stored at −80 °C.
Biochemical analysis
Total protein in BALF was determined by the bicinchoninic acid (BCA) method using bovine serum albumin as a standard. The concentrations of IL-6 and TNF-α were measured by standard enzyme-linked immunosorbent assay (ELISA).
Sample preparation
To reduce potential changes of sample composition before extraction, tissue samples should be thawed on ice. Extraction of aqueous metabolites was performed by adding 1.0 mL of MeOH–water (1 : 1, v/v) to each 5 mL Eppendorf containing tissue sample (100 ± 5 mg), and then homogenizing (ice-bath) by homogenizer for approximately 3 min. After centrifugation at 13 000 rpm for 15 min, 300 μL supernatant was transferred into a 1.5 mL Eppendorf and the residue was used for the organic extraction. The supernatant was further precipitated with 450 μL of methanol followed by 1 min of vortexing and centrifugation at 13 000 rpm for 15 min. The supernatant was transferred and evaporated to dryness at 40 °C under a gentle stream of nitrogen, and stored at −20 °C until analysis.
For the organic extraction, 1.0 mL solution of DCM–MeOH (3 : 1, v/v) was added to the residue of aqueous metabolites, and then homogenized (ice-bath) for approximately 3 min. After centrifugation at 13 000 rpm for 15 min, the 300 μL supernatant was transferred into a 1.5 mL Eppendorf. Samples were evaporated to dryness at 40 °C under a gentle stream of nitrogen and stored at −20 °C until analysis.
UPLC-MS analysis of aqueous and organic extracts
For the aqueous extracts and organic extracts, the dried residue was reconstituted with 100 μL of H2O–ACN (1 : 1, v/v). The samples were vortexed for 1 min and centrifuged (13 000 rpm, 10 min). The supernatants were collected for analysis.
A Waters ACQUITY™ ultra performance liquid chromatography system (Waters Corp., Milford, USA) coupled with a Micromass Quattro Micro™ API mass spectrometer (Waters Corp., Milford, MA, USA) was used for the samples analysis. The aqueous extracts were analyzed on the ACQUITY UPLC HSS T3 (2.1 mm × 100 mm, 1.8 μm), and the organic extracts were analyzed on the ACQUITY UPLC BEH C18 (2.1 mm × 100 mm, 1.7 μm). During the whole process of LC separation, the mobile phase was 0.1% formic acid in water (A) and 0.1% formic acid in acetonitrile (B). The gradients of T3 and C18 column were shown in Table S1.† The column temperature was maintained at 40 °C and the autosampler was set 4 °C. The flow rate was 0.2 mL min−1. The injection volume was 5 μL.
Mass spectrometry was performed by electrospray ionization source (ESI) in positive mode with full scan mode from m/z 100 to 1000 amu. The optimal MS parameters were as follows: capillary voltage 3.0 kV, cone voltage 35 V, source temperature 120 °C, and desolvation temperature 350 °C. Nitrogen was used as the desolvation and cone gas with a flow rate of 400 and 30 L h−1. MS/MS experiments were carried out to identify potential biomarkers. The argon was employed as collision gas for the collision energy from 10 to 40 eV.
Method validation
The methods were validated for precision of injection, method repeatability, post-preparative stability of sample, and system stability. A total of 300 μL from each sample was added together to make a quality control (QC) sample, thus providing a sample with true representation of the breadth of metabolites.12,15 This sample was injected at least 10 times at the initiating run, in order to condition the column. For the precision of injection, the same QC sample was analyzed for six replicates. Six different QC samples were used for the method repeatability which was determined for evaluating the precision of the developed method. The post-preparative stability of sample was determined by analyzing six prepared QC samples left at autosampler (maintained at 4 °C) for 24 h compared with fresh-prepared QC samples (n = 6). The system stability was evaluated by analyzing a QC sample every 7 experimental samples throughout the analytical run.
Data analysis
The data was preprocessed using Micromass Markerlynx Applications Manager version 4.1 (Waters Corp., Milford, USA) in order to produce three-dimensional table with the retention time, m/z and intensity. The mass and retention time window were set for 0.5 Da and 1.00 min, respectively. The total area normalization for each sample was performed by dividing the integrated area of each analyte by the sum of all peak areas of analytes present in the sample. The normalized data was transferred to SIMCA-P 11.5 software package (Umetrics, Umea, Sweden) for the partial least squares discriminant analysis (PLS-DA). To reduce noise and improve the information content of the data, Pareto (Par) scaling was performed on spectral intensity across all the samples.
The Student's t test was used to reveal significant variation of metabolites between groups (P < 0.05). For the potential biomarkers identification, the m/z measurements were matched to metabolites from online MS databases (METLIN: http://metlin.scripps.edu/; HMDB: http://www.hmdb.ca/; MassBank: http://www.massbank.jp/) followed by the comparison of MS/MS fragmentation pattern. For pathway mapping, the KEGG (http://www.genome.jp/) database was used.
Results and discussion
Optimization of the UPLC conditions
At first, we try to use the HILIC column to analysis aqueous metabolites. However, the optimized LC method couldn't provide the chromatograms with good resolution of adjacent peaks and low background noise. Subsequently, various columns were evaluated to obtain satisfying resolutions, optimized responses and good peak shapes for the aqueous metabolites. More interestingly, the ACQUITY UPLC HSS T3 column showed improved retention of certain polar metabolites, such as hypoxanthine, betaine. Therefore, the T3 column was selected for the analysis of aqueous metabolites in our experiment. T3 boned with a difunctional C18 silane to an intermediate ligand density (1.6 μmol m−2) results in retaining and separating polar compounds better than C18 column boned with high ligand-density C18 phases (3.2 μmol m−2), owning that ligand density decreased would lead to the silanol activity increased.16 In this study, it was proved that T3 separation could be a suitable complementary method for C18 analysis. Moreover, T3 column was applied for the analysis of polar metabolites in some published studies.10,11 And the reasons that the HILIC column isn't suitable for the separation of aqueous metabolites in our experiment remain subject to speculation and require further detailed investigations.
The influences of mobile phase, column temperature and other parameters were also studied in preliminary experiments. The effect of formic acid in both water and acetonitrile on the response and peak shape was investigated and 0.1% was found to be the best.
Biochemistry results
ALI is characterized by the release of chemokines and pro-inflammatory cytokines from activated macrophages and neutrophils, as well as the increase of protein content in BALF. The results of biochemistry measurement in BALF, including total protein, IL-6 and TNF-α are shown in Table 1. Compared with control group, the concentrations of protein, IL-6 and TNF-α were significantly increased in the model group. Following RDN treatment, the levels of all indicators were decreased compared with model group.
Measurement of total protein, IL-6 and TNF-α in the BALF.
| Groups | Total protein (mg mL−1) | IL-6 (pg mL−1) | TNF-α (pg mL−1) |
|---|---|---|---|
| Control group | 0.14 ± 0.03 | 21.31 ± 3.61 | 18.82 ± 2.45 |
| Model group | 0.18 ± 0.02a | 34.15 ± 5.88b | 25.63 ± 4.00b |
| Treatment group | 0.15 ± 0.01d | 29.10 ± 3.06c | 20.70 ± 2.74d |
P < 0.01 compared with control group.
P < 0.001 compared with control group.
P < 0.05 compared with model group.
P < 0.01 compared with model group.
The data were presented as the mean ± SD. Two groups were analyzed using a Student's t test. Differences were considered to be significant at P < 0.05.
Method validation
For conventional bioanalysis, the Food and Drug Administration recommends that a RSD of 15% of the nominal value be applied (except for concentrations close to the limit of quantitation, where 20% is considered to be adequate) and for biomarkers an upper limit of 30% can be accepted. The criteria that highly variable ions (RSD of greater than 30%) should be rejected as unacceptable for the purpose of biomarker discovery should been applied.12
For the aqueous extracts, extracted ion chromatographic peaks of five ions in positive ion mode (with the retention time and m/z pairs of 1.4–103.9, 5.8–710.0, 9.0–218.0, 15.0–119.0, 19.0–524.3) were selected for the method validation. The RSDs of retention time for precision of injection, repeatability and system stability were estimated to be 0–0.1%, 0–0.2% and 0–0.5%; while the RSDs of peak area were within the range of 1.3–6.4%, 2.9–11.6% and 6.7–14.0%. The REs of peak area for the post-preparative stability were between −13.9 to 13.2%.
For the organic extracts, extracted ion chromatographic peaks of five ions in positive ion mode (with the retention time and m/z pairs of 3.8–290.3, 8.7–346.5, 11.4–496.3, 16.5–637.2, 21.4–732.5) were selected for the method validation. The RSDs of retention time for precision of injection, repeatability and system stability were estimated to be 0–0.5%, 0–0.3% and 0–0.6%; while the RSDs of peak area were within the range of 2.2–8.4%, 2.9–11.1% and 3.9–11.4%. The REs of peak area for the post-preparative stability were between −14.0 to 12.4%. All results indicated that the above methods were robust with good repeatability and stability.
Metabolic profiling analysis
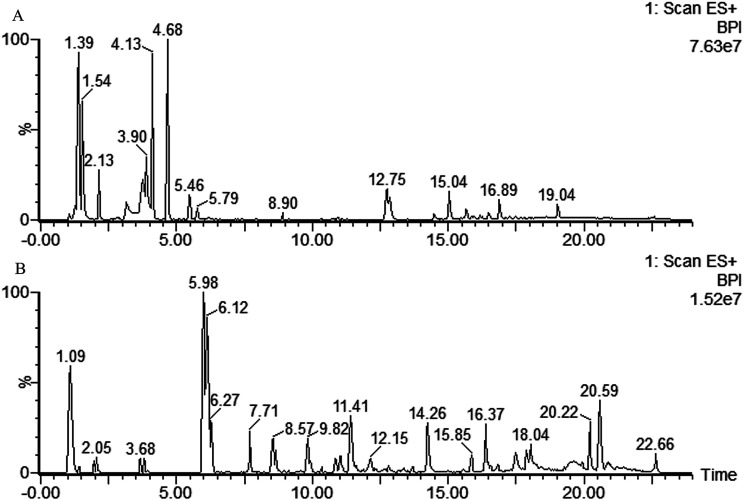
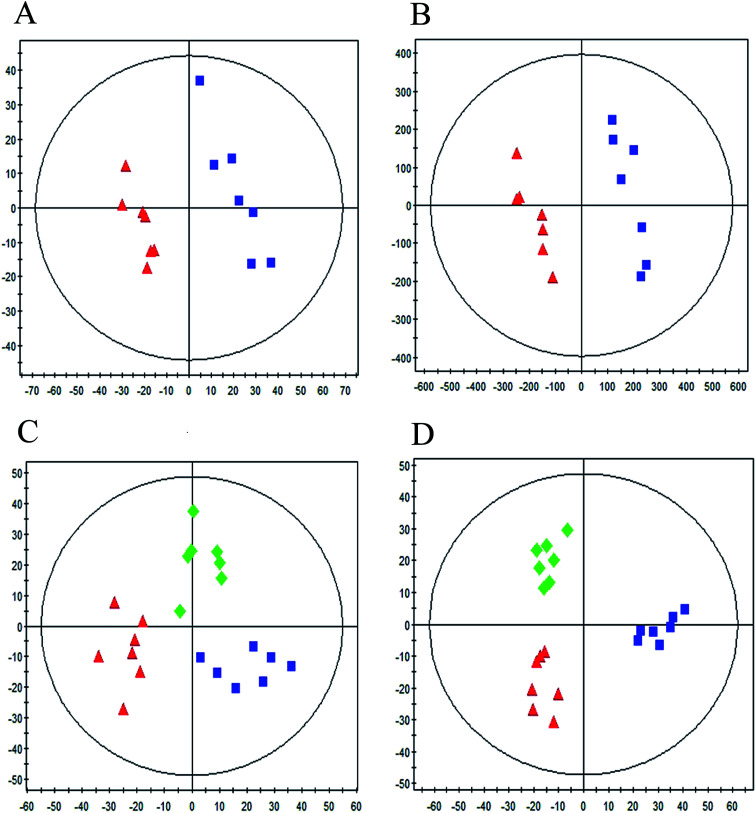
Typical UPLC/MS base peak intensity (BPI) chromatogram of the QC sample from aqueous extracts and organic extracts are shown in Fig. 1A and B. A supervised PLS-DA technique was implemented to search distinct metabolites between model and control groups. Complete separation between the control group and model group was observed in score plot from PLS-DA (Fig. 2A and B), which indicated the ALI rat model was successfully established. The parameter R2Y (0.98 in aqueous extracts; 0.98 in organic extracts) indicated that the established model was capable of differentiating control group from model group. The parameter Q2 (0.65 in aqueous extracts; 0.96 in organic extracts) showed that the established model owned strong predictability.
Fig. 1. Typical base peak intensity (BPI) chromatograms of QC samples in positive mode. (A) Aqueous extracts analyzed by T3 column, (B) organic extracts analyzed by C18 column.
Fig. 2. PLS-DA score plot between control group, model group and RDN treatment group based on the aqueous extracts (A), (C) and organic extracts (B), (D) in positive mode ( : control group,
  : model group,
  : treatment group).
In order to evaluate whether RDN influenced the metabolic pattern of ALI, the PLS-DA model was further constructed to analyze control group, model group and RDN treatment group from the aqueous extracts and organic extracts (Fig. 2C, R2Y = 0.81, Q2 = 0.54; Fig. 2D, R2Y = 0.91, Q2 = 0.84). It can be seen from the score plot that the treatment group had a tendency back to control group, which implied that RDN have intervened the metabolic process of ALI model to some degree.
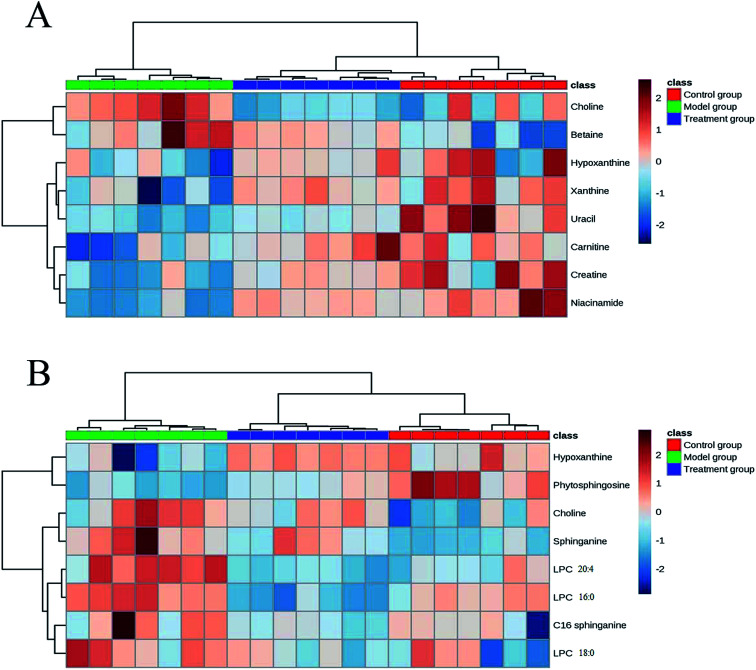
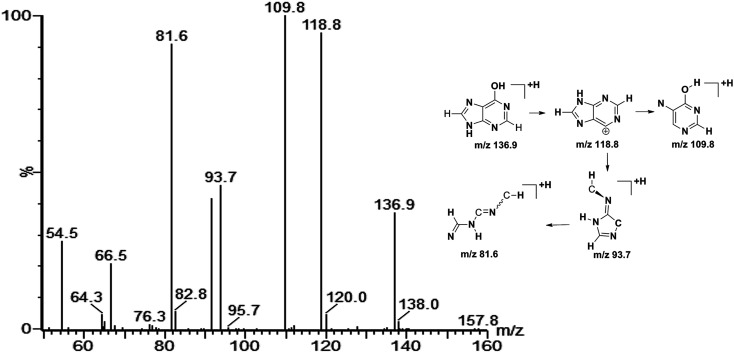
On the basis of the VIP threshold (VIP > 1.0) and P < 0.05 in Student's t test, 14 potential biomarkers were identified (Table 2).17 Then, the changed tendencies of the identified potential biomarkers were depicted in the heatmap for each treatment group (Fig. 3). Identification of metabolites as potential biomarkers can be a significant challenge. The application of MS/MS techniques can be deployed to glean structural information via fragmentation, and mass measurements can be used to generate probable empirical formulae. Potential biomarker candidates can be tentatively identified by consulting online databases such as METLIN, HMDB and MassBank database. These databases will provide a list of candidates on the basis of molecular weight. Further confidence can be obtained through MS/MS techniques to glean structural information. For confirmation of structure for a potential biomarker, a comparison with an authentic standard for both retention time and MS/MS fragmentation data are required. In our experiment, a few biomarkers had been identified by standard samples, such as betaine, LPC 16 : 0 and LPC 18 : 0. The quasi-molecular ion with m/z 136.9 was chosen to illustrate the biomarker identification process. Firstly, MS/MS experiment of the protonated ion at m/z 136.9 was performed to obtain structural information, and the major fragments were m/z 118.8, 109.8, 93.7 and 81.6. Secondly, the quasi-molecular ion was used to generate probable formula from online databases. Finally, the MS/MS spectrum of possible metabolite candidate in the database was searched and compared. The major fragments showed extremely good agreement with the spectrum of hypoxanthine in the METLIN database. In this study, we didn't use any software or program to improve the data match with online databases. The MS/MS spectrum of m/z 136.9 and the possible fragment mechanism is showed in Fig. 4. Based on the process stated above, m/z 136.9 was identified as hypoxanthine. The data of the fourteen potential biomarkers identification were shown in Table S2.†
Potential biomarkers from aqueous extracts and organic extracts in positivea.
| m/z | Adduct | Biomarker | Relative intensity (mean ± SD) | Changed trend | |||
|---|---|---|---|---|---|---|---|
| Control | Model | Treatment | Mode vs. control | Treatment vs. model | |||
| Aqueous extracts | |||||||
| 103.9 | [M + H]+ | Choline | 884.4 ± 111.7 | 1009.2 ± 62.1 | 904.6 ± 129.4 | ↑* | ↓* |
| 132.0 | [M + H]+ | Creatine | 467.8 ± 58.2 | 388.7 ± 53.1 | 439.8 ± 25.7 | ↓* | ↑* |
| 162.1 | [M + H]+ | Carnitine | 228.0 ± 26.9 | 161.0 ± 52.6 | 251.5 ± 60.9 | ↓** | ↑** |
| 118.0 | [M + H]+ | Betaine | 168.5 ± 38.6 | 240.6 ± 51.3 | 183.4 ± 45.7 | ↑** | ↓* |
| 122.9 | [M + H]+ | Niacinamide | 674.9 ± 158.6 | 281.2 ± 107.8 | 543.4 ± 149.3 | ↓*** | ↑** |
| 136.9 | [M + H]+ | Hypoxanthine | 794.9 ± 96.9 | 683.2 ± 107.1 | 796.1 ± 96.9 | ↓* | ↑* |
| 153.0 | [M + H]+ | Xanthine | 225.5 ± 21.8 | 173.8 ± 31.9 | 223.0 ± 17.5 | ↓** | ↑** |
| 112.9 | [M + H]+ | Uracil | 56.1 ± 12.9 | 27.5 ± 5.4 | 36.4 ± 7.0 | ↓*** | ↑* |
| Organic extracts | |||||||
| 103.9 | [M + H]+ | Choline | 885.7 ± 190.0 | 1050.2 ± 79.7 | 925.9 ± 156.0 | ↑* | ↓* |
| 136.9 | [M + H]+ | Hypoxanthine | 198.2 ± 37.3 | 153.5 ± 43.7 | 202.8 ± 39.2 | ↓* | ↑* |
| 274.3 | [M + H]+ | C16 sphinganine | 249.1 ± 61.2 | 314.1 ± 58.2 | 259.5 ± 25.4 | ↑* | ↓* |
| 318.3 | [M + H]+ | Phytosphingosine | 388.9 ± 71.1 | 293.0 ± 32.4 | 339.8 ± 27.9 | ↓** | ↑** |
| 302.3 | [M + H]+ | Sphinganine | 13.1 ± 4.8 | 32.9 ± 11.2 | 23.2 ± 8.1 | ↑*** | ↓* |
| 544.3 | [M + H]+ | LPC (20 : 4) | 19.7 ± 4.9 | 28.3 ± 4.8 | 12.8 ± 2.9 | ↑** | ↓*** |
| 496.2 | [M + H]+ | LPC (16 : 0) | 41.2 ± 8.5 | 61.6 ± 13.0 | 48.5 ± 11.4 | ↑** | ↓* |
| 524.3 | [M + H]+ | LPC (18 : 0) | 150.3 ± 15.0 | 171.4 ± 9.9 | 154.7 ± 8.7 | ↑** | ↓** |
| 362.3 | Unknown | 185.7 ± 17.6 | 116.8 ± 17.0 | 143.1 ± 15.1 | ↓*** | ↑** | |
| 119.0 | Unknown | 214.1 ± 40.1 | 74.4 ± 20.7 | 138.8 ± 35.8 | ↓*** | ↑*** | |
“↑” and “↓”: the compound is up-regulated and down-regulated (*P < 0.05, **P < 0.01, ***P < 0.001).
Fig. 3. Heat map of identified potential biomarkers based on the aqueous extracts (A) and organic extracts (B).
Fig. 4. Product ion spectrum of biomarker at m/z 136.9 in positive ion mode and the proposed fragmentation pathway. The collision energy was 25 eV.
Metabolic pathways
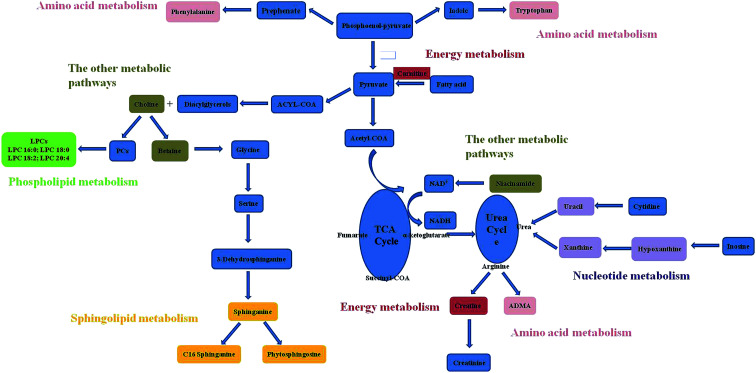
Based on the identified potential biomarkers, metabolite pathways disturbed in model group were investigated. Phosphatidylcholines (PCs) are major components of pulmonary surfactant, which are needed for effective gas exchange. Lysophosphatidylcholines (LPCs) are produced by the action of the proinflammatory phospholipase A2 on PCs. LPCs, as the regulator of immune functions, can promote inflammatory effects, including increased endothelial expression of adhesion molecules and growth factors,18,19 monocyte chemotaxis,20 and macrophage activation.21 The enhancement of LPCs in model group reflected disorder of inflammatory effect. In the treatment group, RDN decreased levels of LPCs by intervening inflammatory pathways, and this result was in accordance with the anti-inflammatory and immunomodulatory activities of RDN.7
The decreased hypoxanthine and xanthine in ALI model were observed. Xanthine, hypoxanthine and uric acid are products of purine metabolism. Purine metabolites pathway involves transformation of hypoxanthine → xanthine, xanthine → uric acid by xanthine oxidase. Uric acid is catalyzed by the xanthine oxidase (XO) along with the production of reactive oxygen species (ROS). Increased ROS production over prolonged periods of time may exert a wide range of detrimental effects, such as inflammatory activation, decreased metabolic efficacy.22 Uric acid had been shown to be a major “danger signal” in the lung, contributing to cell-death-induced acute inflammation.23,24 Although we did not detect uric acid, the presence of the precursor metabolites suggested that the pathway was activated. The down-regulation of uracil was observed in model group, which was the main composition of uridine. Uridine, as the biomarker of ARDS disease, had been detected in the BALF from patients.25 The changed level of hypoxanthine, xanthine and uracil in the RDN group indicated that RDN could prevent lung injury via intervening nucleotide metabolism.
The concentrations of choline and betaine were increased in ALI model. Choline is essential for structural integrity and signaling in cell membranes,26 and the metabolic disturbance on ALI disease involves loss of membrane permeability. To reverse lung injury, recent evidence suggested that stimulation of the endogenous cholinergic anti-inflammatory pathway may be an attractive way to reduce inflammatory injury,27,28 and it could be a promising alternative for the treatment of ARDS/ALI. Betaine is formed by choline oxidation catalyzed by the choline dehydrogenase. Betaine serves as a compatible osmolyte and a methyl donor converting homocysteine to methionine.29 Although the action mechanism of betaine in ALI was unclear, some studies reported that betaine was also engaged in pulmonary development in the same metabolic pathway as choline.30 The decreased level of choline and betaine found in the RDN group confirmed that the intervention mechanism was active in this pathology.
In our experiment, a down-regulation trend of carnitine and creatine were observed. Carnitine's primary function is to transport long-chain fatty acids into the mitochondria for their subsequent β-oxidation and energy production.31 Creatine is a main amino acid composed of glycine and arginine by arginase. 95% of creatine is stored in the skeletal muscles as an ATP supply, and it can be converted to creatinine.32 The changes of carnitine and creatine showed the impairment of normal cell energy production. And the result was consistent with the previous study, which reported that decreased glucose and increased lactate levels were observed in lung tissue from rats with ventilator-induced lung injury.33 Carnitine is also a widely known antioxidant and protector against apoptosis.34–36 It has been demonstrated that carnitine treatment could improve oxygen saturation and bronchus-associated inflammation.37 The up-regulation of carnitine and creatine in treatment group implied that RDN had significant therapeutic effects on LPS-induced lung injury by regulating antioxidant activities and energy metabolism.
Recent discoveries have revealed that sphingolipids metabolites such as ceramides, sphingosines, sphingosine 1-phosphates, and phytosphingosine were involved in diverse cell processes.38,39 In the current study, we observed that level of phytosphingosine decreased, sphinganine and C16 sphinganine were increased in the lung tissue of ALI group. As we all know, they are relevant to the synthesis and metabolism of ceramide. Ceramide is regarded as important cell signals for inducing apoptosis.40 Previous research also has reported that phytosphingosine could induce apoptosis in human T cell leukemia and non-small cell lung carcinoma cells.41,42 The changed level of sphingolipids in treatment group implied that RDN had significant therapeutic effects on ALI by regulating sphingolipids metabolism.
Niacinamide, the amide form of vitamin B3 (niacin), exerts anti-inflammatory actions in vivo. It has been suggested that nicotinamide treatment could prevent collagen accumulation and fibrogenesis in a bleomycin model of lung fibrosis.43 In this study, nicotinamide of the model group was significantly decreased compared with control and treatment group. This result might show the hypothesis that RDN had an intervention to the niacinamide metabolism in the lung injury.
The related pathways of the identified potential biomarkers were investigated by searching the KEGG databases to establish a network (Fig. 5). RDN treatment partially recovered the metabolism disorders induced by LPS and exerted good anti-ALI effect. The metabolic pathways included were proposed as follows: phospholipid metabolism, sphingolipid metabolism, nucleotide metabolism, energy metabolism, and other metabolic pathways.
Fig. 5. Metabolic pathways based on the identified potential biomarkers.
Conclusion
In the present study, a metabolomics method based on consecutive extractions has been developed to investigate therapeutic effect of RDN on ALI by UPLC-MS. Metabolites from aqueous extracts such as choline and carnitine were eluted by the T3 column, and metabolites from organic extracts such as LPCs and sphingolipids were analyzed by the C18 column. 14 potential biomarkers were identified, and two compounds (choline and hypoxanthine) were found by both of the two methods. The result demonstrated our analysis method could broaden metabolites coverage and achieve abundant metabolomics information. We speculated that RDN could prevent ALI via regulating phospholipid metabolism (LPC (20 : 4), LPC (16 : 0) and LPC (18 : 0)), sphingolipid metabolism (phytosphingosine, sphinganine and C16 sphinganine), nucleotide metabolism (hypoxanthine, xanthine and uracil), energy metabolism (carnitine and creatine), and other metabolic pathways (choline, betaine and niacinamide). This work also highlights that metabolomics is a potentially helpful tool for studying the holistic effects and action mechanism of TCM.
Conflicts of interest
The authors declare that there are no conflicts of interest.
Abbreviations
- MeOH
Methanol
- DCM
Dichloromethane
- ALI
Acute lung injury
- RDN
Reduning injection
- TCM
Traditional Chinese medicine
- LPS
Lipopolysaccharide
- BALF
Bronchoalveolar lavage fluid
- BCA
Bicinchoninic acid
- ELISA
Enzyme-linked immunosorbent assay
- ESI
Electrospray ionization source
- QC
Quality control
- PLS-DA
Partial least squares discriminant analysis
- BPI
Base peak intensity
Supplementary Material
Acknowledgments
The present study is supported financially by the National Natural Science Foundation of China (No. 81403062).
Electronic supplementary information (ESI) available. See DOI: 10.1039/c7ra13123b
References
- Martinez O. Nin N. Esteban A. Arch. Bronconeumol. 2009;45:291–296. doi: 10.1016/j.arbres.2008.05.010. [DOI] [PubMed] [Google Scholar]
- Wozniak K. Sleszycka J. Safianowska A. Wiechno W. Domagala-Kulawik J. Arch. Med. Sci. 2012;8:477–483. doi: 10.5114/aoms.2012.29525. [DOI] [PMC free article] [PubMed] [Google Scholar]
- Wang Y. J. Wang Y. M. Wu X. Xiong Z. L. Xiao W. Ma C. J. Chromatogr. B: Anal. Technol. Biomed. Life Sci. 2017;1061:275–281. doi: 10.1016/j.jchromb.2017.07.045. [DOI] [PubMed] [Google Scholar]
- Shang X. F. Pan H. Li M. X. Miao X. L. Ding H. J. Ethnopharmacol. 2011;138:1–21. doi: 10.1016/j.jep.2011.08.016. [DOI] [PMC free article] [PubMed] [Google Scholar]
- Deng Y. H. Guan M. F. Xie X. X. Yang X. F. Xiang H. Li H. Y. Zou L. C. Wei J. Y. Wang D. C. Deng X. M. Int. Immunopharmacol. 2013;17:561–567. doi: 10.1016/j.intimp.2013.06.028. [DOI] [PubMed] [Google Scholar]
- Li T. Chen H. Wei N. Mei X. Zhang S. Liu D. L. Gao Y. Bai S. F. Liu X. G. Zhou Y. X. Int. Immunopharmacol. 2012;12:144–150. doi: 10.1016/j.intimp.2011.11.004. [DOI] [PubMed] [Google Scholar]
- Tang L. P. Xiao W. Li Y. F. Li H. B. Wang Z. Z. Yao X. S. Kurihara H. He R. R. Chin. J. Integr. Med. 2014;20:591–599. doi: 10.1007/s11655-014-1758-x. [DOI] [PMC free article] [PubMed] [Google Scholar]
- Zhang A. H. Sun H. Qiu S. Wang X. J. J. Evidence-Based Complementary Altern. Med. 2013:e402159. [Google Scholar]
- Price K. E. Lunte C. E. Larive C. K. J. Pharm. Biomed. Anal. 2008;46:737–747. doi: 10.1016/j.jpba.2007.11.035. [DOI] [PMC free article] [PubMed] [Google Scholar]
- Masson P. Alves A. C. Ebbels T. M. D. Nicholson J. K. Want E. J. Anal. Biochem. 2010;82:7779–7786. doi: 10.1021/ac101722e. [DOI] [PubMed] [Google Scholar]
- Want E. J. Masson P. Michopoulos F. Wilson I. D. Theodoridis G. Plumb R. S. Shockcor J. Loftus N. Holmes E. Nicholson J. K. Nat. Protoc. 2013;8:17–32. doi: 10.1038/nprot.2012.135. [DOI] [PubMed] [Google Scholar]
- Want E. J. Wilson I. D. Gika H. Theodoridis G. Plumb R. S. Shockcor J. Holmes E. Nicholson J. K. Nat. Protoc. 2010;5:1005–1018. doi: 10.1038/nprot.2010.50. [DOI] [PubMed] [Google Scholar]
- Chen S. Xiong C. Liu H. Wan Q. Hou J. He Q. Badu-Tawiah A. Nie Z. Nat. Nanotechnol. 2015;10:176–182. doi: 10.1038/nnano.2014.282. [DOI] [PubMed] [Google Scholar]
- Chen S. Wan Q. Badu-Tawiah A. K. J. Am. Chem. Soc. 2016;138:6356–6359. doi: 10.1021/jacs.6b02232. [DOI] [PubMed] [Google Scholar]
- Gika H. G. Macpherson E. Theodoridis G. A. Wilson I. D. J. Chromatogr. B: Anal. Technol. Biomed. Life Sci. 2008;871:299–305. doi: 10.1016/j.jchromb.2008.05.048. [DOI] [PubMed] [Google Scholar]
- Zhou W. Tam K. Y. Meng M. X. Shan J. J. Wang S. C. Ju W. Z. Cai B. C. Di L. Q. J. Chromatogr. A. 2015;1376:84–97. doi: 10.1016/j.chroma.2014.12.018. [DOI] [PubMed] [Google Scholar]
- Wang Z. H. Zheng Y. J. Zhao B. X. Zhang Y. P. Liu Z. Xu J. Chen Y. H. Yang Z. Wang F. F. Wang H. Q. He J. M. Zhang R. P. J. Proteome Res. 2015;14:2583–2593. doi: 10.1021/acs.jproteome.5b00134. [DOI] [PubMed] [Google Scholar]
- Kume N. Cybulsky M. I. Gimbrone Jr M. A. J. Clin. Invest. 1992;90:1138–1144. doi: 10.1172/JCI115932. [DOI] [PMC free article] [PubMed] [Google Scholar]
- Kume N. Gimbrone Jr M. A. J. Clin. Invest. 1994;93:907–911. doi: 10.1172/JCI117047. [DOI] [PMC free article] [PubMed] [Google Scholar]
- Jing Q. Xin S. M. Zhang W. B. Wang P. Qin Y. W. Pei G. Circ. Res. 2000;87:52–59. doi: 10.1161/01.RES.87.1.52. [DOI] [PubMed] [Google Scholar]
- Yamamoto N. Homma S. Millman I. J. Immunol. 1991;147:273–280. [PubMed] [Google Scholar]
- Doehner W. Jankowska E. A. Springer J. Lainscak M. Anker S. D. Int. J. Cardiol. 2015;213:15–19. doi: 10.1016/j.ijcard.2015.08.089. [DOI] [PubMed] [Google Scholar]
- Gasse P. Riteau N. Charron S. Girre S. Fick L. Petrilli V. Tschopp J. Lagente V. Quensniaux V. F. Ryffel B. Couillin I. Am. J. Respir. Crit. Care Med. 2009;179:903–913. doi: 10.1164/rccm.200808-1274OC. [DOI] [PubMed] [Google Scholar]
- Kono H. Chen C. J. Ontiveros F. Rock K. L. J. Clin. Invest. 2010;120:1939–1949. doi: 10.1172/JCI40124. [DOI] [PMC free article] [PubMed] [Google Scholar]
- Evans C. R. Karnovsky A. Kovach M. A. Standiford T. J. Burant C. F. Stringer K. A. J. Proteome Res. 2014;13:640–649. doi: 10.1021/pr4007624. [DOI] [PMC free article] [PubMed] [Google Scholar]
- Naz S. Garcia A. Rusak M. Barbas C. Anal. Bioanal. Chem. 2013;405:4849–4858. doi: 10.1007/s00216-013-6882-5. [DOI] [PubMed] [Google Scholar]
- Tracey K. J. Nature. 2002;420:853–859. doi: 10.1038/nature01321. [DOI] [PubMed] [Google Scholar]
- Tracey K. J. Czura C. J. Ivanova S. FASEB J. 2001;15:1575–1576. doi: 10.1096/fj.01-0148hyp. [DOI] [PubMed] [Google Scholar]
- Craig S. A. S. Am. J. Clin. Nutr. 2004;80:539–549. doi: 10.1093/ajcn/80.3.539. [DOI] [PubMed] [Google Scholar]
- Pelizzo G. Ballico M. Mimmi M. C. Peirò J. L. Marotta M. Federico C. Andreatta E. Sampaolesi G. M. Zambaiti E. Calcaterra V. Multidiscip. Respir. Med. 2014;9:54–61. doi: 10.1186/2049-6958-9-54. [DOI] [PMC free article] [PubMed] [Google Scholar]
- Kerner J. Hoppel C. Biochim. Biophys. Acta. 2000;1486:1–17. doi: 10.1016/S1388-1981(00)00044-5. [DOI] [PubMed] [Google Scholar]
- Lu C. X. Zhao X. J. Li Y. Li Y. J. Yuan C. K. Xu F. Meng X. Y. Hou L. H. Xu G. W. J. Pharm. Biomed. Anal. 2016;120:127–133. doi: 10.1016/j.jpba.2015.12.020. [DOI] [PubMed] [Google Scholar]
- Izquierdo-Garcia J. L. Naz S. Nin N. Rojas Y. Erazo M. Martinez-Caro L. Garcia A. de Paula M. Fernandez-Segoviano P. Casals C. Esteban A. Ruiz-Cabello J. Barbas C. Lorente J. A. Anesthesiology. 2014;120:694–702. doi: 10.1097/ALN.0000000000000074. [DOI] [PubMed] [Google Scholar]
- Ye J. S. Li J. Yu Y. M. Wei Q. Deng W. F. Yu L. X. Regul. Pept. 2010;161:58–66. doi: 10.1016/j.regpep.2009.12.024. [DOI] [PubMed] [Google Scholar]
- Andrieu-Abadie N. Jaffrezou J. P. Hatem S. Laurent G. Levade T. Mercadier J. J. FASEB J. 1999;13:1501–1510. doi: 10.1096/fasebj.13.12.1501. [DOI] [PubMed] [Google Scholar]
- Calo L. A. Pagnin E. Davis P. A. Semplicini A. Nicolai R. Calvani M. Pessina A. C. Int. J. Cardiol. 2006;107:54–60. doi: 10.1016/j.ijcard.2005.02.053. [DOI] [PubMed] [Google Scholar]
- Uzuner N. Kavukcu S. Yilmaz O. Ozkal S. Islekel H. Karaman O. Soylu A. Kargi A. Acta Med. Okayama. 2002;56:295–301. doi: 10.18926/AMO/31692. [DOI] [PubMed] [Google Scholar]
- Hakomori S. Igarashi Y. Adv. Lipid Res. 1993;25:147–162. [PubMed] [Google Scholar]
- Hakomori S. Igarashi Y. J. Biochem. 1995;118:1091–1103. doi: 10.1093/oxfordjournals.jbchem.a124992. [DOI] [PubMed] [Google Scholar]
- Wang Q. H. Gao P. Wang X. Y. Duan Y. X. Sci. Rep. 2014;4:e6802. doi: 10.1038/srep06802. [DOI] [PMC free article] [PubMed] [Google Scholar]
- Park M. T. Kang J. A. Choi J. A. Kang C. M. Kim T. H. Bae S. Kang S. Kim S. Choi W. I. Cho C. K. Chung H. Y. Lee Y. S. Lee S. J. Clin. Cancer Res. 2003;9:878–885. [PubMed] [Google Scholar]
- Park M. T. Choi J. A. Kim M. J. Um H. D. Bae S. Kang C. M. Cho C. K. Kang S. M. Chung H. Y. Lee Y. S. Lee S. J. J. Biol. Chem. 2003;278:50624–50634. doi: 10.1074/jbc.M309011200. [DOI] [PubMed] [Google Scholar]
- Arauz J. Rivera-Espinoza Y. Shibayama M. Favari L. Flores-Beltran R. E. Muriel P. Int. Immunopharmacol. 2015;28:244–251. doi: 10.1016/j.intimp.2015.05.045. [DOI] [PubMed] [Google Scholar]
Associated Data
This section collects any data citations, data availability statements, or supplementary materials included in this article.


