Abstract
The formation of food-derived glycated phosphatidylethanolamine (PE) in thermal process was investigated by designing a 1,2-dipalmitoyl-sn-glycero-3-phosphoethanolamine (DPPE)-glucose model system heated from 40 to 100 °C for 8 h. The main products of glycated PE were determined by high performance liquid chromatography-tandem mass spectrometry (HPLC-MS/MS). Results showed that the glycation of DPPE formed three major glycated compounds: amadori-glycated-1,2-dipalmitoyl-sn-glycero-3-phosphoethanolamine (Amadori-DPPE), carboxymethyl-1,2-dipalmitoyl-sn-glycero-3-phosphoethanolamine (CM-DPPE), and carboxyethyl-1,2-dipalmitoyl-sn-glycero-3-phosphoethanolamine (CE-DPPE). Amadori-DPPE was identified to generate CM-DPPE through oxidative cleavage of glycated polar head group under high temperature and extended incubation time. Additionally, during thermal processing, retro-aldol reactions of glucose led to the formation of two reactive dicarbonyl intermediates: glyoxal (GO) and methylglyoxal (MGO), both of them reacted with amino group of DPPE to form CM-DPPE and CE-DPPE, respectively. Thus, the formation pathways of CM-PE might involve the irreversible rearrangements of Amadori-PE following oxidative cleavage, as well as the glycation of amino group of PE with GO. CE-PE could only be formed by reaction of PE with MGO. Moreover, the content of CM-DPPE was higher than that of CE-DPPE in the same incubation conditions, which indicated that CM-PE might be a more useful predictive marker for food-derived glycated amino-phospholipid, rather than Amadori-PE, particularly in thermal processed foodstuffs.
The formation of food-derived glycated phosphatidylethanolamine (PE) in thermal process was investigated by designing a 1,2-dipalmitoyl-sn-glycero-3-phosphoethanolamine (DPPE)-glucose model system heated from 40 to 100 °C for 8 h.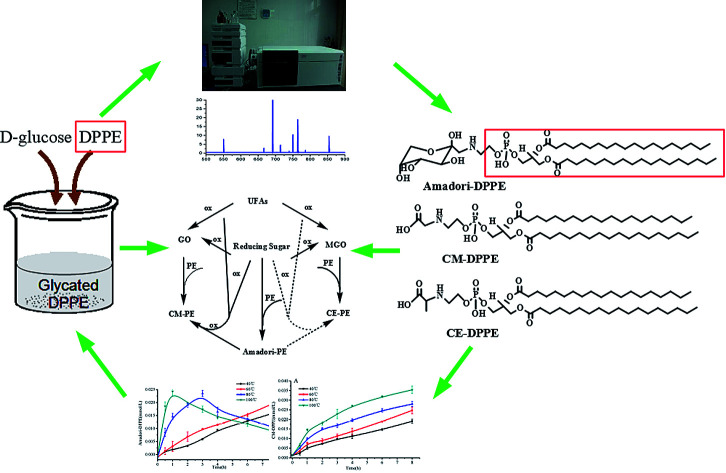
1. Introduction
The Maillard reaction of protein glycation and its involvement in the pathogenesis of diabetic complications has been thoroughly investigated.1,2 In addition to protein glycation, amino lipids, such as phosphatidylethanolamine (PE) and phosphatidylserine (PS), could be involved in the Maillard reaction with reducing sugars, due to their free amino group.3,4In vivo studies demonstrated that membrane phospholipids such as PE were abnormally glycated under hyperglycemic conditions, which led to destruction of cellular integrity and functionality.5–7 The formation and accumulation of glycated amino-phospholipid has been recognized to be related to the pathogenesis and lesions of hyperglycemia in diabetes and age-related dysfunctions of tissue and of the central nervous system.4–11 To date, Amadori-glycated phosphatidylethanolamine (Amadori-PE) has been detected in a number of foodstuffs.8,12 Oak et al. examined Amadori-PE presence in several food samples, among which infant formula, chocolate, mayonnaise and soybean milk, found to contain a high amount of Amadori-PE.8 Utzmann et al. found PE-linked glycated products in model systems as well as in spray-dried egg yolk.12 Intake of food-derived glycated amino-phospholipid was considered to contribute to the total body glycated amino-phospholipid load. Moreover, it was proposed that glycated PE concentration could be used as a quality criterion since food nutritional value could be deteriorated by glycation reaction during processing.
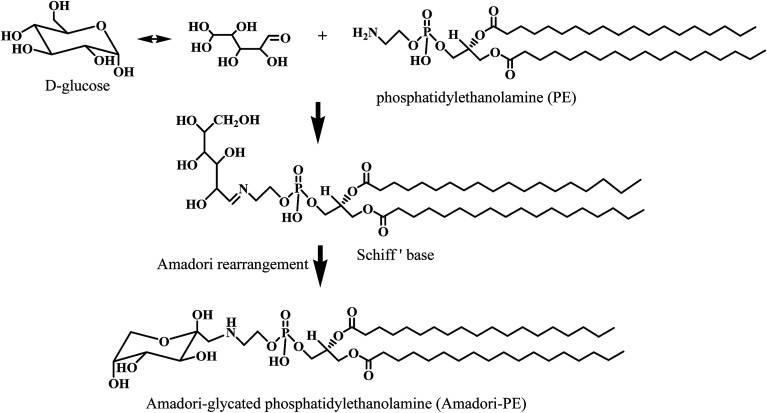
In general, PE reacts with reducing sugar such as glucose or fructose, leading to the formation of an unstable Schiff base, which further goes through rearrangement to form the more stable Amadori-PE (see Fig. 1).4,13 Amadori-PE is utilized as detectable marker for lipid glycation in both foodstuffs and biological samples. However, recent biological studies have indicated that Amadori-glycated amino-phospholipid could further convert into carboxymethyl (CM) derivatives and carboxyethyl (CE) derivatives under oxidative stress in vivo.14,15 Glycation of amino-phospholipid induces major alterations on the polar head group (phosphate head group), increasing the size of the polar group and the polarity, and creating more oxidation sites derived from glycation of the polar head group.16 Thus, Amadori glycated polar head group might go through further complex reaction during food processing and storage. However, the reaction pathways during thermal process are not yet known. Amadori-PE has been detected in a number of foodstuffs. Oak et al. examined Amadori-PE presence in several food samples and indicated that foods contained high amount of sugar and PE is probably formed glycated PE during heat process.8 Egg yolk PE derivatives were also found to undergo extensive glycation reactions during industrial processing.12 It was proposed that food composition, processing temperature and time all affected Amadori-PE formation.17 However, to the best of our knowledge, few studies have focused on the structures changes of Amadori-PE during food processing. Although PE was found to rapidly remove highly toxic oxygenated aldehydes and generated aldehyde modified PE in foods.18 Carboxymethyl phosphatidylethanolamine (CM-PE) and carboxyethyl phosphatidylethanolamine (CE-PE) were also identified in model system under high temperature incubation.12 The relationship between Amadori-PE and aldehyde modified PE were still unknown. Hence, in present study, we sought to confirm the occurrence of PE glycation products during food thermal process and to investigate the formation pathways of glycated PE. The composition of food is complicated and the generation of food-derived glycated PE could be influenced by many factors. Therefore, we built a model system containing 1,2-dipalmitoyl-sn-glycero-3-phosphoethanolamine (DPPE) and glucose. The DPPE-glucose model system was incubated from 40 to 100 °C and DPPE glycation products were analyzed over time using HPLC-MS/MS.
Fig. 1. Glycation pathway of Amadori-glycated PE. Glucose reacts with the amino group of PE to form Amadori-PE.
2. Materials and methods
2.1. Materials
1,2-Dipalmitoyl-sn-glycero-3-phosphoethanolamine (16 : 0–16 : 0, DPPE, >99%), d-(+)-glucose (glucose, ≥99.5%), d-glucose-1-13C (99%), glyoxylate (98%), pyruvate (98%), cyanoborohydride (95%), glyoxal (GO; 40% in H2O), and methylglyoxal (MGO; 40% in H2O) were purchased from Aladdin (Shanghai, China). Solid-phase extraction cartridges (SPE, C18, 1000 mg, 6 mL) were from Angel (Angel, China). All other reagents were of analytical grade.
2.2. DPPE glycation model system
DPPE (13.84 mg, 20 μmol) and d-glucose (180.16 mg, 1 mmol) were dissolved in methanol/phosphate buffer 0.1 M, pH 7.4 (5 mL, 3 : 2, v/v) and shaken mechanically on a vortex mixer for 1 min, and then kept at 60 °C for 6 h. The incubation mixture was purified by SPE: the C18 SPE cartridge was attached to a vacuum manifold, fitted with an adapter and a 20 mL reservoir, and conditioned with methanol/water (5 mL, 1 : 1, v/v). The incubation mixture was transferred to the SPE column, vacuum applied, and the eluent discarded. The cartridge was rinsed with methanol/water (5 mL, 1 : 1, v/v) and the eluent again discarded. The phosphatidylethanolamine fraction was eluted with methanol/chloroform (5 mL, 3 : 7, v/v), and the solvent removed in vacuo. The phospholipid residue was dissolved in methanol (2 mL), passed through a membrane filter (0.45 μm), and injected for high performance liquid chromatography-electrospray mass spectrometry (HPLC-(ESI)-MS/MS) analysis (selected ion monitoring and precursor ion scanning) to monitor the generation of glycated DPPE.
2.3. Synthesis of standard glycated DPPE
Amadori-DPPE, CM-DPPE and CE-DPPE standards were synthesized using the DPPE as starting materials, as described by Jeong-Ho19 and Shoji,15 with modification. In brief, for the synthesis of Amadori-DPPE, DPPE (50 μmol) was dissolved in 6 mL of methanol and d-glucose (2 mmol) was dissolved in 4 mL of water, mixed, and the mixture was shaken mechanically on a vortex mixer for 5 min and then kept at 60 °C oscillating water bath for 8 h (150 rpm). After that, the reaction mixture was purified by SPE to extract lipid-solution product as described above. The amino-phospholipid fraction was eluted with methanol/chloroform (5 mL, 3 : 7, v/v), the eluate was collected and isolated using HPLC-MS and preparative LC to prepare pure Amadori-DPPE. For the synthesis of CM-PE, DPPE (50 μmol), glyoxylate (0.5 mmol), and cyanoborohydride (50 μmol) were dissolved in 10 mL of methanol and kept at 60 °C oscillating water bath for 6 h (150 rpm). For the synthesis of CE-PE, pyruvate (0.5 mmol) was used instead of glyoxylate. After reaction, the solvent removed in vacuo, the residue was dissolved in 10 mL of chloroform/methanol (3 : 7, v/v) and then isolated using HPLC-MS and preparative LC to prepare pure CM-DPPE and CE-DPPE.
2.4. Heating experiment in model system
DPPE (13.84 mg, 20 μmol), d-glucose (180.16 mg, 1 mmol), and salicylic acid (SA, 10 μmol) were dissolved in 5 mL methanol/phosphate buffer 0.1 M, pH 7.4 (5 mL, 3 : 2, v/v) and shaken mechanically on a vortex mixer for 1 min, and then incubated at 40–100 °C in sealed serum bottles and collected over time. After incubation, the incubation mixture was divided into two portions, a portion (2 mL) was purified by SPE as described above to extract glycated DPPE, another portion (2 mL) was added 3 mL ethanol/water (1 : 1, v/v) to extract reactive dicarbonyl compounds and 2,3-dihydroxy benzoic acid (2,3-DHBA). After centrifugation at 3500g for 10 min, the ethanol layer was collected to determine glycation intermediate products. A model system containing d-glucose-1-13C (90.08 mg, 500 μmol), DPPE (13.84 mg, 20 μmol) and salicylic acid (SA, 10 μmol) was also prepared and incubated at 80 °C for 4 h. After incubation, the incubation mixture was extracted as described above and injected into the HPLC-MS/MS system.
2.5. Glucose concentration experiment in model system
13.84 mg of DPPE and 0.69 mg of SA was dissolved in 3 mL methanol. 2 mL of the glucose solution, which consisted of different concentrations of d-glucose (0–1.5 M, in 0.1 M phosphate buffer, pH 7.4) was added to this solution. The mixture was shaken mechanically on a vortex mixer for 1 min and then incubated at 60 °C for 6 h in sealed serum bottle. After incubation, the incubation mixture was extracted as described above and injected into the HPLC-MS/MS system.
2.6. Glycated DPPE analyzed by HPLC-MS/MS
The glycated DPPE samples were analyzed on an Agilent 1260–6460 electrospray ionization triple quadrupole mass spectrometer operating in positive ion mode. The volume of injection was 5 μL. Glycated DPPE was chromatographed on a Venusil ASB C18 column (5 μm, 4.6 × 250 mm; Angel, China) with a constant flow rate of 0.5 mL min−1. The column temperature was maintained at 35 °C. Sheath gas temperature was kept at 400 °C, sheath gas flow was set at 11 L min−1, nebulizer was 15 psi, capillary and nozzle voltage were 3500 V and 1000 V, respectively.
To evaluate the MS/MS fragmentation, product ion scan was performed by directly injecting DPPE (0.5 mM methanol) solution into the MS/MS using methanol as carrier solvent. Electrospray ionization was used as an ion source with optimized collision energy of 20 eV and fragmentor voltage of 170 V. Positive ion spectra were collected in the m/z range of 0–800.
Precursor ion scanning was used for the qualitative analysis of the glycated DPPE products in model system. The MS/MS instrument was programmed to scan parent ions that yielded a product ion of 551.5 m/z after fragmentation in the collision cell. Positive ion spectra were collected in the m/z range of 500–1200.
The synthesized Amadori-DPPE, CM-DPPE and CE-DPPE were analyzed as the reference compounds of glycated DPPEs and MS conditions, including collision energy and fragmentor voltage, were optimized by MassHunter Optimizer.
The synthesized Amadori-DPPE, CM-DPPE and CE-DPPE were analyzed using a Venusil ASB C18 column (5 μm, 4.6 × 250 mm; Angel, China) with a mobile phase of 0.05% formic acid in water–methanol (1 : 99, v/v). The flow rate was set at 0.5 mL min−1, and the column temperature was maintained at 35 °C. Amadori-DPPE, CM-DPPE and CE-DPPE were detected using multiple reaction monitoring (MRM) for the transition of parent ions to product ions. For the quantitation of Amadori-DPPE, CM-DPPE and CE-DPPE in reaction system, 1 mL extracted glycated DPPE sample was subjected to the HPLC-MS/MS, and the glycated DPPE compounds were individually detected using MRM. The concentrations of Amadori-DPPE, CM-DPPE and CE-DPPE in reaction model were calculated using the calibration curves of the synthesized Amadori-DPPE, CM-DPPE and CE-DPPE.
2.7. Determination of GO and MGO by HPLC-MS/MS
The HPLC-MS/MS analysis for the determination of GO and MGO content was as described by Christian Henning20 and Yuliya Hrynets,21 with slight modifications. As described in 2.4, 1 mL of the collected ethanol layer was spiked with 6 mg of o-phenylenediamine (OPD), the pH was adjusted to 3.00 ± 0.02 with 4 M HCl, and the mixture was derivatized at 40 °C for 2 h. The derivatized solution was passed through a membrane filter (0.45 μm), and subjected to HPLC-MS/MS. Chromatographic conditions were as follows: Venusil ASB C18 column (5 μm, 4.6 × 250 mm; Angel, China); column temperature, 35 °C; flow rate, 0.5 mL min−1; injection volume, 5 μL; eluent mixtures, 0.05% formic acid in water–methanol (85 : 15, v/v). Sample peaks corresponding to GO-OPD and MGO-OPD were calculated by using the equation of the relevant standard curves, the correlation coefficient (R2) value was ≥0.995 for all calibration curves.
2.8. Determination of OH˙ by HPLC-MS/MS
The HPLC-MS/MS analysis for the determination of OH˙ content was as described by Rozhon22 and Tabatabaei23 with slight modifications. Attack of OH˙ upon trapping agent SA would generate 2,3-DHBA, 2,4-DHBA and 2,5-DHBA, and only the 2,3-DHBA isomer could be used as a relatively specific substance to measure OH˙. Therefore, OH˙ content was reflected by 2,3-DHBA content. A certain amount of SA was dissolved in methanol containing DPPE at the beginning of the reaction to obtain accumulated 2,3-DHBA with time. The concentration of SA added in DPPE-glucose model system was 2 mmol L−1. As described in 2.4, 1 mL of the collected ethanol layer was passed through a membrane filter (0.45 μm), and subjected to HPLC-MS/MS. Chromatographic conditions were as follows: Venusil ASB C18 column (5 μm, 4.6 × 250 mm; Angel, China); column temperature, 35 °C; flow rate, 0.5 mL min−1; injection volume, 5 μL; eluent mixtures, 0.05% formic acid in water–methanol (0.5 : 99.5, v/v). Sample peaks corresponding to 2,3-DHBA was calculated by using the equation of the relevant standard curves, the correlation coefficient (R2) value was ≥0.995 for all calibration curves.
2.9. Statistical analysis
All tests were carried out in triplicate independently. Data were expressed as the mean value ± standard deviation (SD), and were statistically analyzed by Origin or Excel. P < 0.05 was accepted as significant.
3. Results and discussion
3.1. Identification and quantitation of glycated DPPE in model system by HPLC-MS/MS with MRM
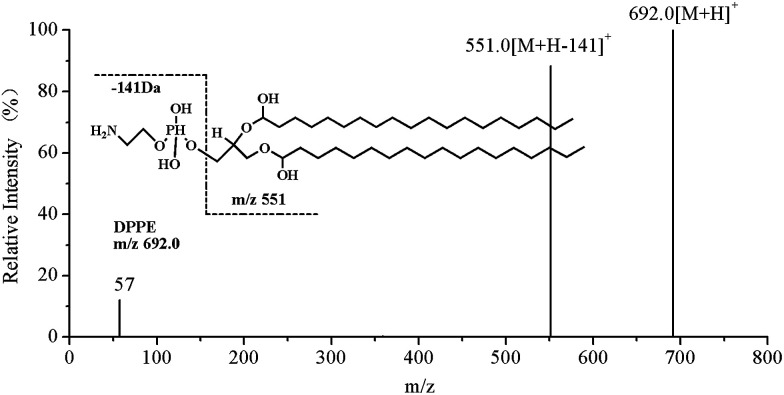
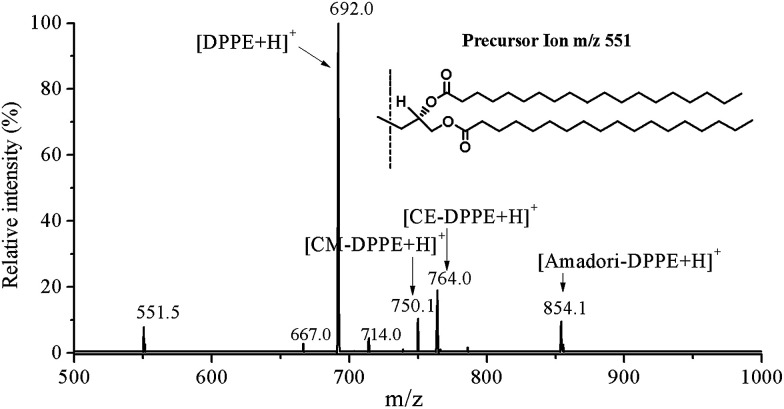
In order to characterize the structure of glycated DPPE by HPLC-MS/MS, we designed a DPPE glycation model system and scanned the native DPPE using product ion scanning model. Results showed that parent ion of DPPE (m/z 692.0 [M + H]+) lost polar head groups (H2PO4CH2CH2NH2) upon collisional activation and yielded a characteristic fragment ion of diacylglycerol moiety (m/z 551) (Fig. 2). Glycated DPPE species could be detected by searching for the yielding characteristic fragment ion m/z 551. Precursor ion scanning was then used to profile the molecular species of glycated DPPE in model system. DPPE (m/z 692.0), Amadori-DPPE (m/z 854.1), CM-DPPE (m/z 750.1), and CE-DPPE (m/z 764.0) were shown in the precursor ion scanning of m/z 551 (Fig. 3). The precursor ion scanning spectra of Amadori-DPPE, CM-DPPE and CE-DPPE indicated that PE glycation proceeded toward the formation of Amadori-glycated products and aldehyde-products in model system.
Fig. 2. Product ion spectrum of the [M + H]+ ion at m/z 692.0 of DPPE.
Fig. 3. Precursor ion scanning of the sample from DPPE glycation model system. Precursor ion scan of 551.5 m/z show the specific detection of glycated DPPEs in heating model system.
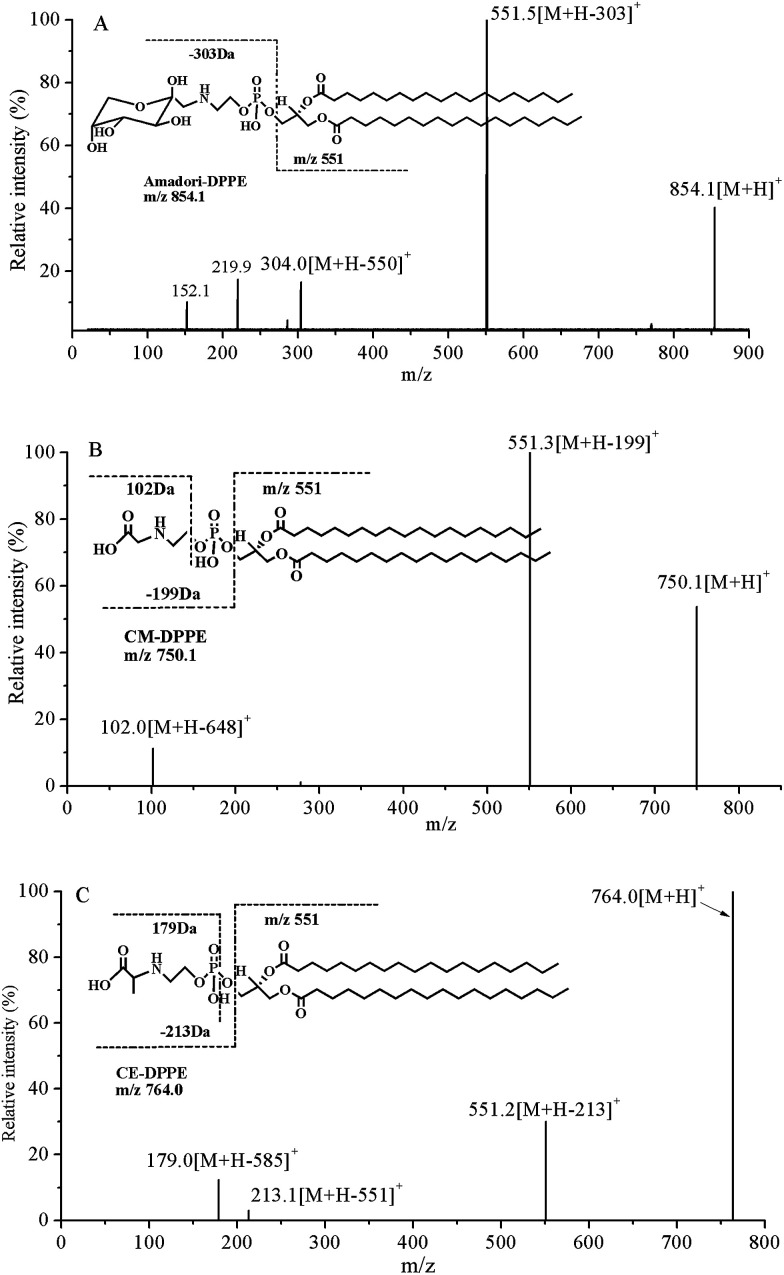
Product ion scanning using synthesized Amadori-DPPE, CM-DPPE and CE-DPPE as reference compounds showed that all of them lost corresponding glycated polar head groups (H2PO4CH2CH2NHC6H11O5, 303 Da; H2PO4CH2CH2NHCH2COOH, 199 Da and H2PO4CH2CH2NHCHCH3COOH, 213 Da, respectively) and yielded a characteristic fragment ion of diacylglycerol moiety (m/z 551) (Fig. 4) upon collisional activation. Naoki Shoji et al. found very similar fragmentation pattern with the loss of glycated polar head group of CM-PE and CE-PE in human erythrocytes and blood plasma.15 These fragmentations were useful for MRM detection of glycated DPPE in HPLC-MS/MS determination of glycated DPPE.
Fig. 4. Specific detection of Amadori-DPPE, CM-DPPE and CE-DPPE standards using MS/MS. (A) Product ion spectrum of the [M + H]+ ion at m/z 854.1 of Amadori-DPPE. (B) Product ion spectrum of the [M + H]+ ion at m/z 750.1 of CM-DPPE. (C) Product ion spectrum of the [M + H]+ ion at m/z 764.0 of CE-DPPE.
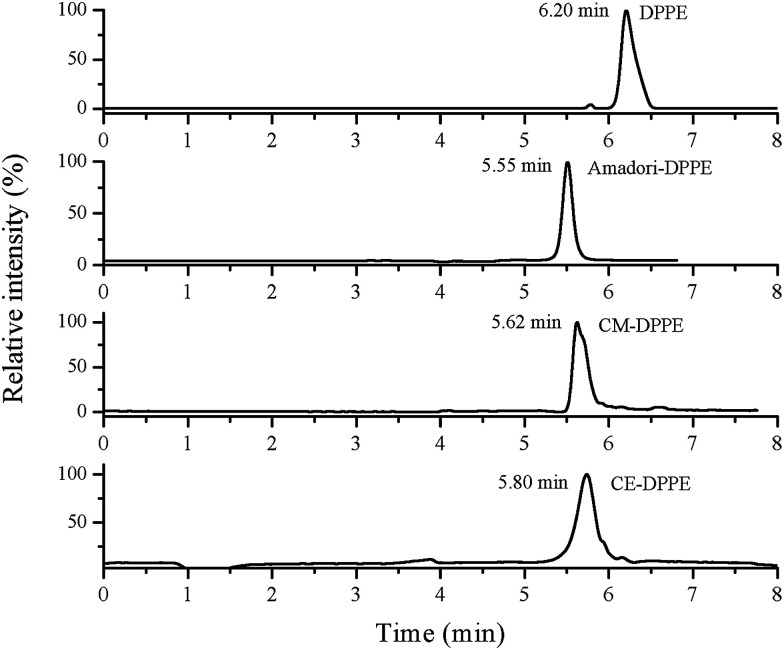
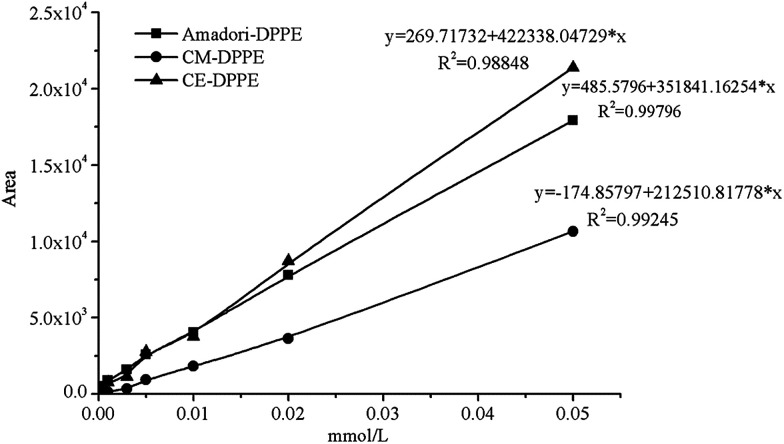
Based on the results of precursor ion scanning, Amadori-DPPE, CM-DPPE and CE-DPPE in DPPE glycation model system were individually quantified by HPLC-MS/MS with MRM. Parameters were optimized to permit MRM detection and HPLC separation by using synthetic reference compounds. Glycation of PE induced major alterations on the polar head group and increased the size of the polar group and the polarity, which gave rise to the separation of glycated DPPEs (see Fig. 5). Under the optimized conditions, all calibration curves presented good linear correlation (0.988–0.998) with detection limits of 50 nmoL L−1 at a signal-to-noise ratio of 3 (see Fig. 6). The three representative glycated DPPEs in DPPE glycation model system were detected by HPLC-MS/MS with MRM in the following experiment.
Fig. 5. Selected ion monitoring chromatograms of a standard mixture of DPPE and synthesized Amadori-DPPE, CM-DPPE and CE-DPPE.
Fig. 6. Calibration curves of Amadori-DPPE, CM-DPPE and CE-DPPE from quantitative analysis by HPLC-MS/MS with MRM. The calibration curves were constructed with Amadori-DPPE, CM-DPPE and CE-DPPE standards of different concentrations (0.00–0.05 mmol L−1).
3.2. Formation of Amadori-DPPE in model system
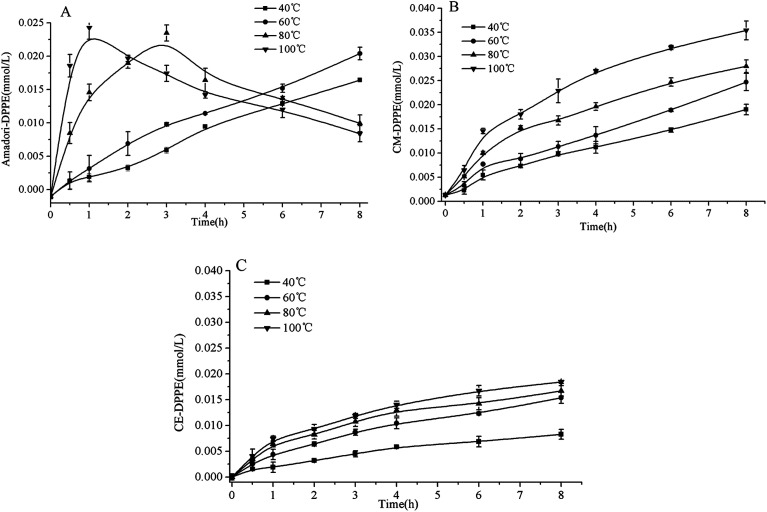
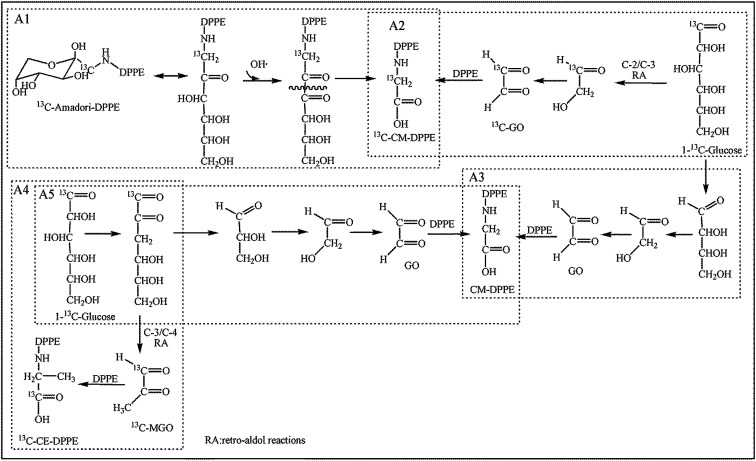
It was identified that PE glycation in model system proceeded toward the formation of Amadori-DPPE, CM-DPPE, and CE-DPPE. The formation pathway of Amadori-DPPE regarding the reaction between glucose and amino group of DPPE was well established. Results in present study showed that Amadori-PE formation depended closely on the incubation conditions (as shown in Fig. 7A). The content of Amadori-DPPE increased with the increase of temperature and extension of time when temperature was lower than 60 °C. However, when the processing temperature was higher than 60 °C, the content of Amadori-DPPE first rapidly increased to reach the maximum and then decreased with the extension of heating time. Similar result was observed by study of Sittiwat et al.24 It has been reported that glycation of amino-phospholipid induced major alterations on the polar head group (H2PO4CH2CH2NH2), increasing the size of the polar group and the polarity, and creating more oxidation sites derived from glycation of polar head group,16 which gave rise to Amadori glycated polar head group to go through further complex reaction during food processing and storage. Therefore, it was hypothesized that Amadori-DPPE went through oxidative cleavage of the glucose moiety during thermal process and came to the formation of CM-DPPE or CE-DPPE. The 1-13C-d-glucose-DPPE glycation system was then designed to identify this hypothesis. DPPE and 1-13C-d-glucose were incubated at 80 °C for 4 h, after incubation, the glycated products were identified and quantitated (as depicted in Table 1). Only 13C-Amadori-DPPE could be detected in the glycated mixtures suggesting glucose is the only precursor of Amadori-DPPE formation. On the contrary, both 13C-CM-DPPE and 12C-CM-DPPE were observed. Similar to retro-aldol reactions and oxidation of glucose, the glucose moiety glucose of Amadori-DPPE could undergo oxidative cleavage to form carboxymethyl. As shown in Fig. 8A1, the glucose moiety of Amadori-DPPE was oxidized into an imino ketone, and retro-aldol cleavage of this intermediate led to the formation of CM-DPPE. This explained the decrease of Amadori-DPPE level in thermal system. Nagai et al. reported that the oxidative cleavage of Amadori glycated glucose moiety was mediated through hydroxyl radical.25 In the present research, it was found that with the increase of temperature, the generation of hydroxyl radical was also enhanced, result in the increase of oxidative stress in model system, which might explained why high temperature and extended incubation time promoted oxidation cleavage of Amadori-DPPE. Based on the present data, a possible mechanism of Amadori-DPPE formation in model system was proposed. Glucose reacts with the free amino group of PE, leading to the formation of Amadori-PE, which further goes through oxidative cleavage of polar head group to form CM-PE under high temperature and oxidative stress.
Fig. 7. Evolution of Amadori-DPPE content (A), CM-DPPE content (B) and CE-DPPE content (C) as a function of time (0–8 h) in DPPE glycation model system heated from 40 °C to 100 °C. Data are mean ± standard deviation (SD) (n = 3).
Content of Glycated compounds in d-glucose-1-13C-DPPE model system incubated at 80 °C for 4 h. Data are mean ± standard deviation (SD) (n = 3).
| Glycated compounds | Before incubation μmol | After incubation μmol | |
|---|---|---|---|
| Amadori-DPPE | 13C-Amadori-DPPE | — | 0.082 ± 0.00 |
| 12C-Amadori-DPPE | — | — | |
| CM-DPPE | 13C-CM-DPPE | — | 0.062 ± 0.00 |
| 12C-CM-DPPE | — | 0.036 ± 0.00 | |
| CE-DPPE | 13C-CE-DPPE | — | 0.056 ± 0.00 |
| 12C-CE-DPPE | — | 0.002 ± 0.00 | |
| GO | 13C-GO | 0.0007 ± 0.00 | 2.35 ± 0.012 |
| 12C-GO | 0.00 ± 0.00 | 3.69 ± 0.020 | |
| MGO | 13C-MGO | 0.0001 ± 0.00 | 0.34 ± 0.00 |
| 12C-MGO | 0.00 ± 0.00 | 0.02 ± 0.00 | |
Fig. 8. Proposed pathways of CM-DPPE formation and CE-DPPE formation in 1-13C-glucose-DPPE model system.
3.3. Formation of CM-DPPE in model system
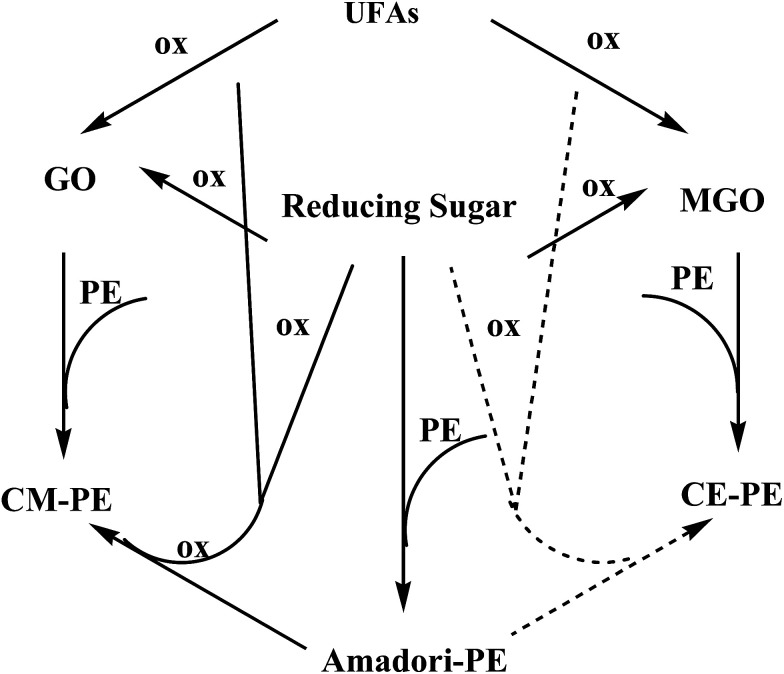
Based on the above data, the CM-DPPE could form through the oxidative cleavage of Amadori-DPPE. It was hypothesized that oxidative cleavage of Amadori-DPPE was the only way to form CM-DPPE, only 13C-CM-DPPE was supposed to be detected in 13C-glucose-DPPE model system. However, both 13C-CM-DPPE and 12C-CM-DPPE were observed, therefore, the hypothesis was invalid. Moreover, 23.35 μmol 13C-GO and 18.69 μmol 12C-GO were detected in 13C-glucose-DPPE model system, respectively. It was reported that GO is formed via retro-aldol reactions of glucose and erythrose leading to hydroxyethanal, which will be oxidized into GO.26,27 GO are highly reactive products, being 20 000-fold more reactive than glucose in glycation process,28,29 which indicated that 13C-CM-DPPE was formed not only through the oxidative cleavage of 13C-Amadori-DPPE but also via the glycation of DPPE with 13C-GO generated by the retro-aldol reactions of 13C-glucose in 13C-glucose-DPPE model system. The 12C-CM-DPPE was formed though the glycation of DPPE with 12C-GO-generated by the retro-aldol reactions of erythrose (as shown in Fig. 8A2 and A3). In addition, content of 13C-CM-DPPE (0.062 μmol) was almost 2 times more than that of 12C-DPPE (0.036 μmol), suggesting that retro-aldol reactions of glucose were faster than that of erythrose, which contributed to more CM-DPPE formation. Moreover, as shown in Fig. 7B, CM-DPPE formation occurred consistently during 8 h of incubation in model system. Higher temperature and extended incubation time promoted the formation of CM-DPPE. When temperature increased from 40 °C to 100 °C, the yield of CM-DPPE would increase almost 2 to 2.5 times. The result indicated that high temperature not only enhanced oxidative cleavage of Amadori-DPPE, but also promoted retro-aldol reactions and oxidation of glucose, leading to formation of CM-DPPE. As shown in Fig. 9, CM-DPPE formation was also significantly increased with the increasing of glucose concentration. This may be due to the fact that increasing level of glucose caused additional oxidation of glucose and enhanced oxidative stress of model system, promoting the formation of CM-DPPE from Amadori-DPPE oxidation. Moreover, oxidation of glucose gave rise to the formation of GO, the GO further reacted with DPPE to yield CM-DPPE. All these findings demonstrated that both oxidation of Amadori-DPPE and glycation reaction of GO with DPPE led to the formation of CM-DPPE.
Fig. 9. Evolution of CM-DPPE content (A) and GO content (B) as a function of molar ratio of DPPE and glucose (1 : 0–1 : 150) in DPPE glycation model system heated at 60 °C for 6 h. Data are mean ± standard deviation (SD) (n = 3).
3.4. Formation of CE-DPPE in model system
As depicted in Table 1, both 13C-CE-DPPE (0.046 μmol) and 13C-MGO (0.34 μmol) was detected, the level of 12C-CE-DPPE and 12C-MGO were negligible. CE derivatives were reaction products of the C-3 unit MGO, which was formed by reverse retro-aldols of 3-deoxyosones.30 Therefore, it was suspected that 13C-CE-DPPE formed through the condensation between 13C-MGO and DPPE. The proposed formation pathway for CE-DPPE was depicted in Fig. 8A4. 13C-glucose could undergo retro-aldol reactions leading to 13C-MGO.21,2713C-MGO was highly reactive with DPPE to form 13C-CE-DPPE. At the same time, the produced glyceraldehyde could also go through retro-aldol reactions to generate GO leading to the formation of CM-DPPE (as shown in Fig. 8A5). As depicted in Table 1, the total level of 13C-CM-DPPE (0.062 μmol) was higher than that of 13C-CE-DPPE (0.056 μmol), which could be explained by the different formation mechanisms between CM-DPPE and CE-DPPE: CM-DPPE form through the oxidative cleavage of Amadori-DPPE and glycation of DPPE with GO, while CE-DPPE could just form via glycation of DPPE with MGO. Moreover, as depicted in Fig. 7C, higher temperature promoted the formation of CE-DPPE. This may be attributed to the fact that high temperature promoted glucose oxidation to generate MGO, and lead to the formation of CE-DPPE. As shown in Fig. 10, the increases in CE-DPPE and MGO were observed with the increasing concentration of glucose in model system. The increasing level of glucose might lead to additional oxidation to generate MGO, which underwent glycation with DPPE to yield CE-DPPE. All these findings confirmed that CE-DPPE was formed through the glycation of DPPE with MGO.
Fig. 10. Evolution of CE-DPPE content (A) and MGO content (B) as a function of molar ratio of DPPE and glucose (1 : 0–1 : 150) in DPPE glycation model system heated at 60 °C for 6 h. Data are mean ± standard deviation (SD) (n = 3).
In previous literature, Amadori-PE is usually utilized as detectable markers in both foodstuffs and biological samples.4,7–9,17,31 However, the above research results showed that higher temperature, longer incubation time, and oxidative stress all enhanced Amadori-PE further converted into CM-PE during food thermal process and food storage. Additionally, the results also showed that the level of CM-DPPE was obviously higher than that of CE-DPPE in the same incubation condition, which was due to their different formation mechanisms (Fig. 7, 9 and 10). This finding was in agreement with the results in soy-PE and glucose model incubations reported by Utzmann et al.12 As a consequence, we suggest that CM-PE might be more appropriate as the predictive marker for food-derived glycated amino-phospholipid, rather than Amadori-PE and CE-DPPE, particularly in thermal process foodstuffs.
3.5. Possible formation pathways of glycated PE in model system
Fig. 11 depicted the possible formation pathways of glycated DPPEs. It is well established that glucose reacts with the amino group of PE to form Amadori-PE in vivo or in vitro. The formation of food-derived aldehyde-phospholipid involves complex sequential and parallel reactions, whose precise mechanism has not been confirmed and need to be further discussed. In this paper, only two main pathways of CM-PE formation were established by our team. The first route involved irreversible rearrangements of the Amadori-PE following oxidative pathway. The second route involved condensation between amino group of PE and GO generated by oxidative degradation of reducing sugar in food processing. In addition, CE-DPPE could be thermally formed by reaction of DPPE with MGO generated by oxidative degradation of reducing sugar in food processing. Although sugars are often recognized as the main source, GO and MGO could also arise from lipid peroxidation. Indeed, the peroxidation of polyunsaturated fatty acids, such as linoleic and linolenic acids, generates peroxide intermediates, which then degrade into a variety of oxidative products including GO and MGO.27,32 Further study is needed to clarify the relationship between glycated PE formation and polyunsaturated fatty acids oxidation.
Fig. 11. Proposed formation pathways for glycated PE in food system.
4. Conclusions
In summary, the present research was designed to study the formation pathways of glycated PE. Amadori-DPPE, CM-DPPE, and CE-DPPE were identified as major glycated DPPEs in the incubation model system. High temperature and oxidative stress promoted oxidative degradation of Amadori-DPPE which led to CM-DPPE formation. Additionally, GO formed via retro-aldol reactions of glucose and erythrose could condense with DPPE to form CM-DPPE. At the same time, retro-aldol reactions of glucose also form MGO, which react with DPPE to yield CE-DPPE. Moreover, the level of CM-DPPE was higher than that of CE-DPPE in the same incubation conditions. These findings indicated that CM-PE is more appropriate used as a sensitive predictive marker for the glycation research of PE during food thermal processing. The investigations of the occurrence of CM-PE in foodstuffs are under way in our team.
Conflicts of interest
The authors have declared no conflict of interest.
Supplementary Material
Acknowledgments
The research was financed by the National Key Research and Development Program of China (Project 2017YFC1600405), the National Natural Science Fund of China (project no. 31771895, no. 31471677, no. 31271885, no. 31401603), Key Projects in the National Science and Technology Pillar Program during the Twelfth Five-year Plan Period (project no. 2012BAD37B01), and the Public Welfare (Agriculture) Research Project (project no. 201303072), and the Fundamental Research Funds for the Central Universities of China, Foundation of Guangdong Province Key Laboratory for Green Processing of Natural Products and Product Safety.
References
- Brings S. Fleming T. Freichel M. Muckenthaler M. U. Herzig S. Nawroth P. P. Int. J. Mol. Sci. 2017;18:984. doi: 10.3390/ijms18050984. [DOI] [PMC free article] [PubMed] [Google Scholar]
- Raghavan C. T. Nagaraj R. H. Glycoconj. J. 2016;33:631–643. doi: 10.1007/s10719-016-9686-y. [DOI] [PMC free article] [PubMed] [Google Scholar]
- Buttner U. Ochs S. Severin T. Carbohydr. Res. 1996;291:175–181. doi: 10.1016/S0008-6215(96)00122-X. [DOI] [Google Scholar]
- Miyazawa T. Nakagawa K. Shimasaki S. Nagai R. Amino Acids. 2012;42:1163–1170. doi: 10.1007/s00726-010-0772-3. [DOI] [PubMed] [Google Scholar]
- Lertsiri S. Shiraishi M. Miyazawa T. Biosci., Biotechnol., Biochem. 1998;62:893–901. doi: 10.1271/bbb.62.893. [DOI] [PubMed] [Google Scholar]
- Ravandi A. Kuksis A. Marai L. Myher J. J. Steiner G. Lewisa G. Kamido H. FEBS Lett. 1996;381:77–81. doi: 10.1016/0014-5793(96)00064-6. [DOI] [PubMed] [Google Scholar]
- Nakagawa K. Oak J. H. Higuchi O. Tsuzuki T. Oikawa S. Otani H. Mune M. Cai H. Miyazawa T. J. Lipid Res. 2005;46:2514–2524. doi: 10.1194/jlr.D500025-JLR200. [DOI] [PubMed] [Google Scholar]
- Oak J. H. Nakagawa K. Miyazawa T. J. Lipid Res. 2002;43:523–529. [PubMed] [Google Scholar]
- Sookwong P. Nakagawa K. Fujita I. Shoji N. Miyazawa T. Lipids. 2011;46:943–952. doi: 10.1007/s11745-011-3588-3. [DOI] [PubMed] [Google Scholar]
- Gugiu B. G. Mesaros C. A. Sun M. J. Gu X. R. Crabb J. W. Salomon R. G. Chem. Res. Toxicol. 2006;19:262–271. doi: 10.1021/tx050247f. [DOI] [PubMed] [Google Scholar]
- Vistoli G. De Maddis D. Cipak A. Zarkovic N. Carini M. Aldini G. Free Radical Res. 2013;47(suppl. 1):3–27. doi: 10.3109/10715762.2013.815348. [DOI] [PubMed] [Google Scholar]
- Utzmann C. M. Lederer M. O. J. Agric. Food Chem. 2000;48:1000–1008. doi: 10.1021/jf9911489. [DOI] [PubMed] [Google Scholar]
- Solis-Calero C. Ortega-Castro J. Munoz F. J. Phys. Chem. B. 2010;114:15879–15885. doi: 10.1021/jp1088367. [DOI] [PubMed] [Google Scholar]
- Guo L. Davies S. S. Biochimie. 2013;95:74–78. doi: 10.1016/j.biochi.2012.07.010. [DOI] [PubMed] [Google Scholar]
- Shoji N. Nakagawa K. Asai A. Fujita I. Hashiura A. Nakajima Y. Oikawa S. Miyazawa T. J. Lipid Res. 2010;51:2445–2453. doi: 10.1194/jlr.D004564. [DOI] [PMC free article] [PubMed] [Google Scholar]
- Simoes C. Simoes V. Reis A. Domingues P. Domingues M. R. Anal. Bioanal. Chem. 2010;397:2417–2427. doi: 10.1007/s00216-010-3825-2. [DOI] [PubMed] [Google Scholar]
- Breitling-Utzmann C. M. Unger A. Friedl D. A. Lederer M. O. Arch. Biochem. Biophys. 2001;391:245–254. doi: 10.1006/abbi.2001.2406. [DOI] [PubMed] [Google Scholar]
- Hidalgo F. J. Nogales F. Zamora R. Food Chem. Toxicol. 2008;46:43–48. doi: 10.1016/j.fct.2007.05.035. [DOI] [PubMed] [Google Scholar]
- Oak J.-H. Nakagawa K. Miyazawa T. FEBS Lett. 2000:26–30. doi: 10.1016/S0014-5793(00)01966-9. [DOI] [PubMed] [Google Scholar]
- Henning C. Liehr K. Girndt M. Ulrich C. Glomb M. A. J. Biol. Chem. 2014;289:28676–28688. doi: 10.1074/jbc.M114.563593. [DOI] [PMC free article] [PubMed] [Google Scholar]
- Hrynets Y. Ndagijimana M. Betti M. J. Agric. Food Chem. 2015;63:6249–6261. doi: 10.1021/acs.jafc.5b02664. [DOI] [PubMed] [Google Scholar]
- Rozhon W. Petutschnig E. Wrzaczek M. Jonak C. Anal. Bioanal. Chem. 2005;382:1620–1627. doi: 10.1007/s00216-005-3326-x. [DOI] [PubMed] [Google Scholar]
- Tabatabaei A. R. Abbott F. S. Free Radical Biol. Med. 1999;26:1054–1058. doi: 10.1016/S0891-5849(98)00269-X. [DOI] [PubMed] [Google Scholar]
- Lertsiri S. Shiraishi M. Miyazawa T. Biosci. Biotechnol. Biochem. 1998;62:893–901. doi: 10.1271/bbb.62.893. [DOI] [PubMed] [Google Scholar]
- Nagai R. Ikeda K. Higashi T. Sano H. Jinnouchi Y. Araki T. Horiuchi S. Biochem. Biophys. Res. Commun. 1997:167–172. doi: 10.1006/bbrc.1997.6608. [DOI] [PubMed] [Google Scholar]
- Amrein T. M. Andres L. Manzardo G. G. G. Amado R. J. Agric. Food Chem. 2006;54:10253–10261. doi: 10.1021/jf0625860. [DOI] [PubMed] [Google Scholar]
- Degen J. Hellwig M. Henle T. J. Agric. Food Chem. 2012;60:7071–7079. doi: 10.1021/jf301306g. [DOI] [PubMed] [Google Scholar]
- Thornalley P. J. Ann. N. Y. Acad. Sci. 2005;1043:111–117. doi: 10.1196/annals.1333.014. [DOI] [PubMed] [Google Scholar]
- Vicente Miranda H. El-Agnaf O. M. Outeiro T. F. Mov. Disord. 2016;31:782–790. doi: 10.1002/mds.26566. [DOI] [PubMed] [Google Scholar]
- Buttner U. Ochs S. Severin T. Carbohydr. Res. 1996;291:175–181. doi: 10.1016/S0008-6215(96)00122-X. [DOI] [Google Scholar]
- Higuchi O. Nakagawa K. Tsuzuki T. Suzuki T. Oikawa S. Miyazawa T. J. Lipid Res. 2006;47:964–974. doi: 10.1194/jlr.M500348-JLR200. [DOI] [PubMed] [Google Scholar]
- Yin HY P. N. Antioxid. Redox Signaling. 2005;7:170–184. doi: 10.1089/ars.2005.7.170. [DOI] [PubMed] [Google Scholar]


