Abstract
In this work, we prepared hydrogen treated indium oxide (H2-In2O3) and investigated the effect of hydrogen treatment on the optical and photoluminescence properties of In2O3. Hydrogen treatment has no influence on the crystal structure, but alters the intrinsic electronic structure and optical properties via introducing hydrogen induced defects such as shallow donor states (near the conduction band) and singly ionized oxygen vacancies in H2-In2O3. Both air-In2O3 (air calcinated) and H2-In2O3 show intense blue emission under UV excitation (280 nm). However, hydrogen treated In2O3 exhibited an additional green emission, which is absent in air-In2O3. This green emission arises from the passivation of singly ionized oxygen vacancies by hydrogen treatment. Hydrogen treatment could be a promising strategy to tune the electronic and optical properties of In2O3.
H2-treated In2O3 gives rise to photoemission ranging from blue to green-yellow, while air-calcined In2O3 shows only blue emission. EPR and optical spectroscopies reveal singly ionized oxygen vacancies induced by H2 treatment responsible for the green-yellow emission.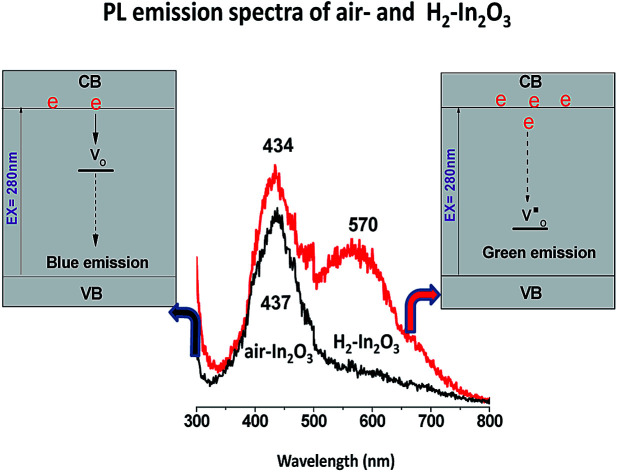
1. Introduction
Indium oxide has attracted tremendous attention as a promising wide band gap semiconductor, showing various technologically important applications in optical and optoelectronic devices such as solar cells, low emissive windows, light emitting devices, fluorescent lamps, lasers, display devices, orientation lamps and infrared reflectors etc.1–3 Inorganic materials often display unique shape and size dependent property, which has a crucial impact on their electrical, optical and catalytic properties.4,5 Various morphologies of In2O3 have been synthesized, such as nanorods, nanocubes, nanowires, nanosheets, nanobelts, nanoparticles, nanofibers, corundum-type nanotubes and flower like In2O3etc.6–15 It has been reported that tunability of micro/nanosized In2O3 structure can induce emission in different wavelength ranging from ultraviolet (UV) to visible region.16 For example, Cao and co-workers synthesized In2O3 nanowires and observed intense ultraviolet emission.17 Wang et al. prepared lotus-root-like In2O3 nanostructure, which exhibited peculiar photo-luminescence (PL) emissions at 445, 468, 552 and 632 nm.18 Similarly, Yang et al. fabricated In2O3 nanorod bundles and spheres and observed blue photoemission peaking around 416 and 439 nm.5 Moreover, Sen et al. also reported the growth mechanism of In2O3 nanotowers, which gave a strong emission centered at 580 nm.19 It has been interpreted that defects are the most common radiative centres in photo-luminescence processes.20 The defects in In2O3 include indium vacancy, oxygen vacancy, indium interstitials, oxygen interstitials, staking faults, etc. However, the exact photo-luminescence emission mechanism is still controversial.20–22 As mentioned above, studies on optical and especially luminescence properties of In2O3 mainly focused on shape and size dependent micro/nanostructures.12,18 In general, there is no universally accepted PL mechanism. Hence, investigation on the luminescence mechanism of the visible PL in In2O3 is still necessary. Herein, we explored hydrogen induced defects and their effects on luminescence properties of In2O3 nanoparticles.
Hydrogen induced alteration in metal oxide structures has been a topic of substantial interest, because hydrogen treatment plays a vital role in tailoring the optical, photocatalytical and electronic properties of metal oxides.23–25 The intentional or unintentional doping of metal oxides with hydrogen exhibits different behaviors depending on the host matrix. Chen et al. reported the synthesis of disorder-engineered black TiO2.26 By the help of hydrogen treatment they introduced disorders in TiO2 nano-crystals. Hydrogen treatment created lattice disorders and generated mid gap states. For instance, instead of forming donor states near conduction band (CB), these mid gaps produced extending energy levels and formed band tail states. The extended energy states became dominant centres for optical excitation and relaxation processes. An additional advantage of engineered disorder was that they provided trapping sites for photo-induced carriers and prevented the rapid recombination process. Hydrogen treatment affected possible electron transfer, photocatalytic process, optical, and luminescent properties of host matrix.27,28 Ting et al. demonstrated the defect-based photo-luminescence (PL) efficiency of colloidal ϒ-Ga2O3 nanocrystals.29 Reducing environment (H2/Ar) increased the concentration of oxygen vacancies and enhanced the photoluminescence intensity. On the other hand, blue emission was suppressed in oxidative condition (O2/Ar). The enhancement of UV emission with the help of hydrogen treatment in zinc oxide (ZnO) was earlier reported.30,31
Previous reports have suggested that hydrogen donated electrons to the host material and created polaron-like defect.32,33 H2-In2O3 has been regarded as an excellent transparent conductor than most commonly used Sn doped In2O3.28 Surprisingly, despite its potential impact as a donor dopant, research studies about the effect of hydrogen on optoelectronic performance of indium oxide are rarely reported.34
In present study, hydrogen treatment is used to generate defects in In2O3. We observed distinct fluorescent emission (green-yellow) for H2-In2O3 (grey-coloured sample) under UV excitation. Aiming to clarify the fluorescent emission of H2-In2O3, its structural, optical and electronic properties are investigated by using a combination of spectroscopic characterization. This study provide a proper insight into hydrogen induced defect structures and probe the nature of donor states and singly ionized oxygen vacancies and their specific role (shallow donor and passivation behavior) in visible emission over In2O3 sample.
2. Results and discussion
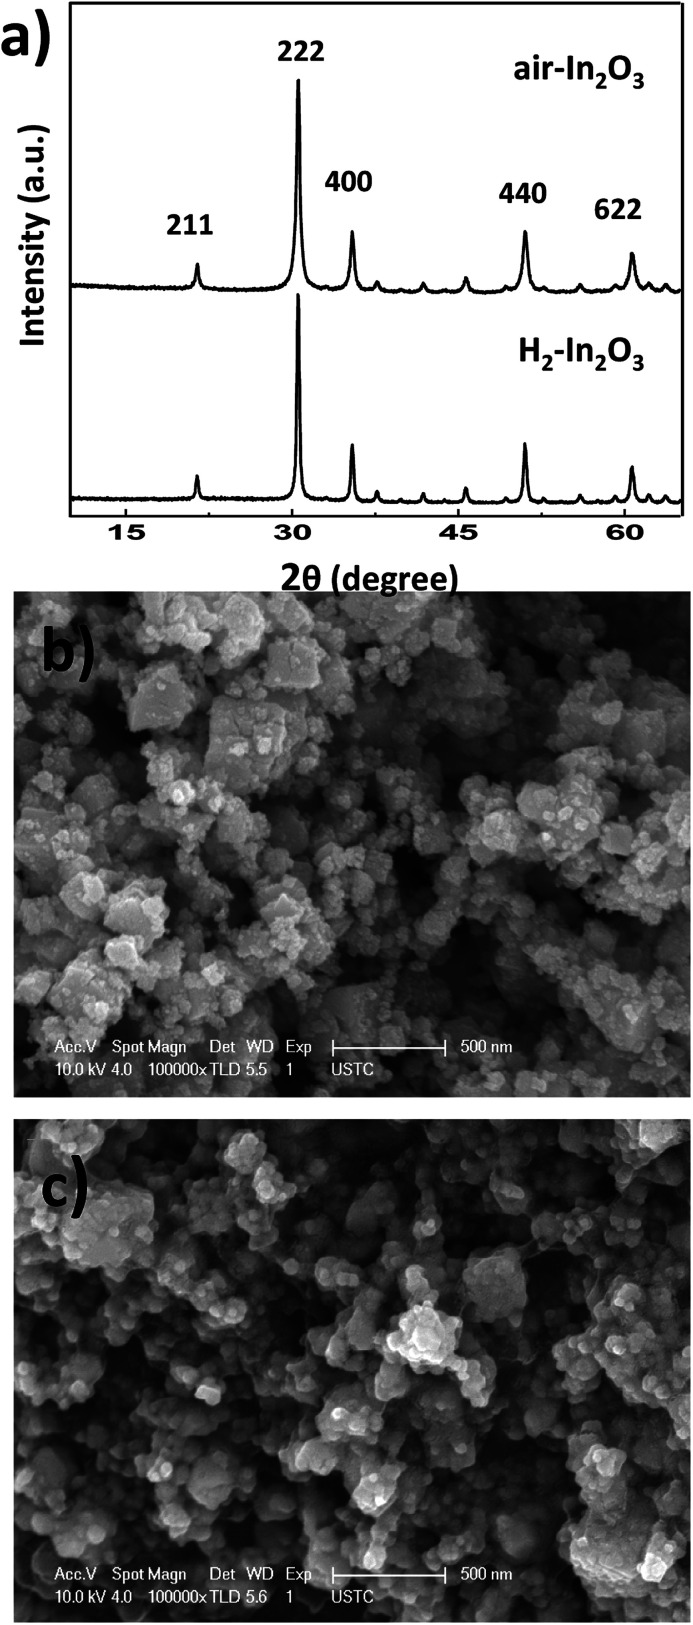
Powder X-ray diffraction (PXRD) patterns of air-In2O3 and H2-In2O3 are presented in Fig. 1(a). All diffraction peaks of both samples can be assigned to cubic phase of In2O3 with space group Ia3.10 The intense XRD diffraction peaks at 2θ values of 21.4, 30.5, 35.4, 50.9 and 60.6° could be indexed to (211), (222), (400), (440) and (622) crystal planes of In2O3, revealing their phase-pure cubic In2O3 nature.35 The diffraction peak of (222) planes is used to estimate crystalline size of both samples by using Debye–Scherrer relation (D = 0.9 λ/β cos θ). The crystalline sizes are calculated to be 43 and 33 nm for air-In2O3 and H2-In2O3, respectively. After hydrogen treatment smaller crystalline size suggested that some disordered phase is likely formed in H2-In2O3.36 In addition, intense PXRD peaks further indicated high crystalline nature of both samples. No characteristic peaks of any other impurities or phases are observed, indicating high purity of both samples. SEM measurements were employed to investigate the morphologies of air- and H2-In2O3 nanoparticles. The SEM images of synthesized samples at different (low- and high) magnifications are displayed in Fig. 1b and c. SEM images of both samples disclose the presence of agglomerated structure from tiny uniform-sized sphere-shaped particles. The aggregation is likely due to the heating effect in air and hydrogen atmosphere.
Fig. 1. PXRD patterns of air- and H2-In2O3 samples (a). SEM images of air-In2O3 (b) and H2-In2O3 (c).
It is obvious that hydrogen treatment does not alter the crystallinity and morphology in comparison with air-annealed In2O3 judged from PXRD and SEM data. However, surface elemental compositions of air- and H2-In2O3 are also studied via XPS analysis. Only O, In and C (used as reference) signals appear in XPS survey acquired from air- and H2-In2O3 (Fig. S2†). Furthermore, In 3d and O 1s regions evidenced no significant differences in the particle surface of air- and H2-In2O3 (see Fig. S2(b–d) of ESI†).
The optical response of hydrogen treated In2O3 compared to that of air annealed In2O3 is shown in Fig. 2a. It can be clearly seen that H2-In2O3 displays grey colour and a wide absorption in visible light region. The large absorption tail (occurring in visible to IR regions) reveals indisputable evidence that hydrogen treatment induced a large number of oxygen vacancy defects in H2-In2O3.37 Electronic transitions from valence band (VB) to the localized states, and from these isolated states to conduction band (CB), are responsible for the VIS-NIR absorption (λ ≥ 460 nm) of the grey H2-In2O3.38 In contrast In2O3 sample obtained from calcination in air shows yellow colour. Moreover, it can be seen from the spectra that both samples exhibit same absorption in UV range and absorption edges in visible region. In addition, it is worth mentioning that hydrogen treated sample is very stable in air because there was no colour change after keeping H2-In2O3 (grey colour) sample in air for two months.
Fig. 2. (a) The UV-Vis-NIR absorption spectra of air-In2O3 (black line) and H2-In2O3 (red line). The inset in (a) show the corresponding photographs. (b) Room temperature photoluminescence spectra of air- and H2-In2O3 (excited at 280 nm).
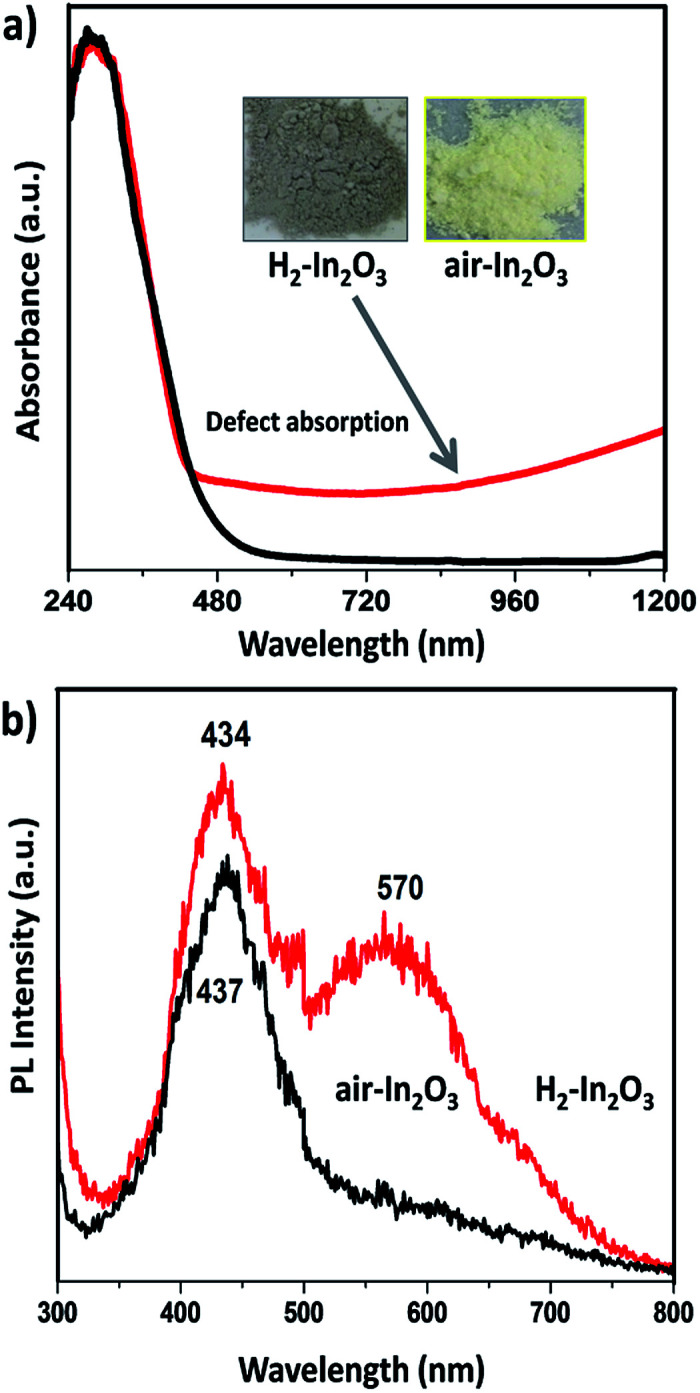
We observed distinct fluorescent emission for H2-In2O3 under UV excitation from air-In2O3 (280 nm, according to UV absorbance). As shown in Fig. 2b, both samples display similar strong emission band in blue region (400–500 nm), centered at 434 and 437 nm for H2-In2O3 and air-In2O3, respectively. However, H2-In2O3 exhibits an additional wide band emission covering green-yellow region centered at 570 nm. The blue emission peaks in both samples can be attributed to the expected oxygen vacancies generated during calcination process. It is well studied that with the transformation of crystalline phase from In(OH)3 to In2O3, the lattice oxygen can be removed in the form of water or O2, which in turn leads to the formation of shallow energy levels (oxygen vacancies) in the band structure.39 As discussed above, fluorescent emissions of In2O3 samples are dominated by their band energy levels, electronic and defect states etc. Therefore, we applied various spectroscopic technologies to study the origin of green-yellow emission and how hydrogen treatment changed the intrinsic states of In2O3.
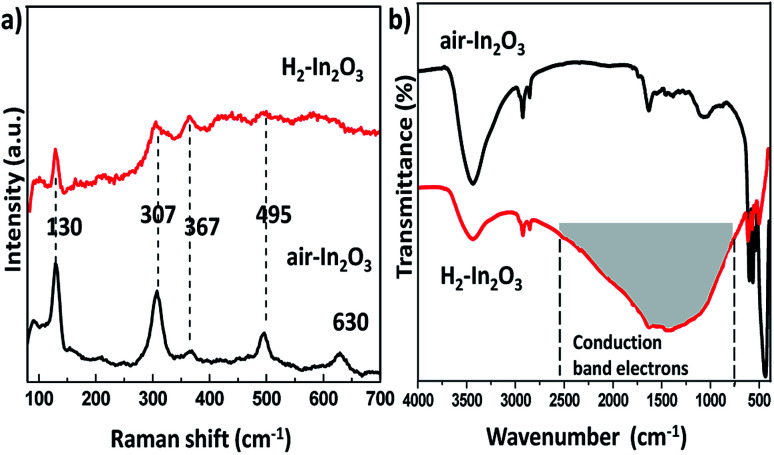
The intrinsic structural changes of as prepared samples treated in air and hydrogen environment were analysed via Raman scattering spectra, as shown in Fig. 3a. The room temperature Raman spectra of both samples exhibited a low frequency set at 130 cm−1 (In–O vibration), two frequencies traced at 307 and 367 cm−1 (stretching vibrations of In–O–In). Two high frequencies located at 495 and 630 cm−1 belong to the typical vibration modes of bcc-In2O3, which are in good agreement with reported values in the literature.40–43 Nevertheless, H2-In2O3 shows much lower intensity, which reveals that hydrogen treatment increases the disorderliness of In2O3 as comparing with air-In2O3. Meanwhile, hydrogen treated sample induces a very characteristic broad absorption in a range of 700–2800 cm−1 in IR spectrum, as represented in grey area in Fig. 3b. This featureless absorption is attributed to hydrogen induced changes of the CB and shallow donor state (DS) electron concentration in nonstoichiometric n-type semiconducting oxides.32,44–46
Fig. 3. (a) Room temperature Raman spectra of air-In2O3 and H2-In2O3. (b) FT-IR spectra of air- and H2-In2O3.
Hydrogen treatment on In2O3 may yield different defects, such as substitutional hydrogen at oxygen site and interstitial hydrogen at anti-bonding position. And these defects are shallow, which slightly overlap the bottom of the conduction band (CB).34 Regardless its specific position within the lattice, hydrogen donate electrons to the host material and creates defects, thereby populating both CB and shallow levels.34 According to the FT-IR analysis hydrogen treatment governed the defects, which in turn serves as electron donor states within the band gap of H2-In2O3 (see more detail in ESI†). The other hydrogen generated defects are oxygen vacancies. From the UV measurements it can be speculated that oxygen vacancies induced large number of defects in H2-In2O3. These oxygen vacancies are assumed to be the recombination centres for the PL processes.
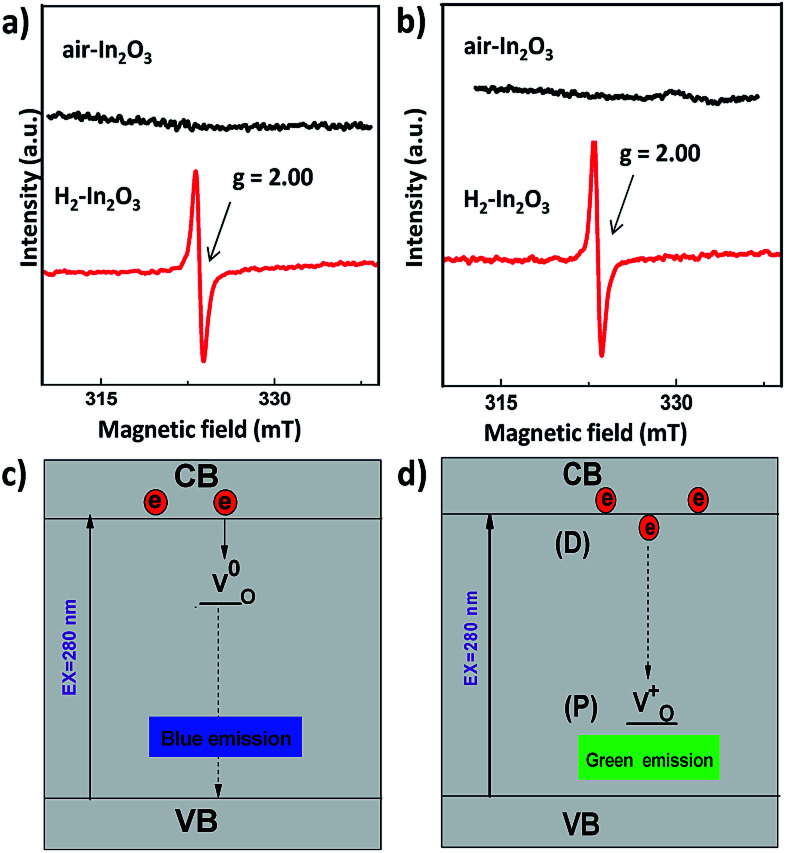
In order to further investigate the nature of oxygen vacancies, we have measured room temperature electron paramagnetic resonance (EPR) spectroscopy. The EPR spectra of H2-In2O3 (Fig. 4a) exhibit a sharp and intense signal at g = 2.00, which shows that hydrogen treated sample possess paramagnetic centres (singly ionized oxygen vacancies). In contrast, the air-In2O3 is antiferromagnetic and indicates complete absence of EPR signal. EPR analysis was also performed under N2 atmosphere for comparison (Fig. 4b). Because the EPR signals and intensities are sensitive to atmospheric oxygen.47 It can be clearly seen that the EPR signals are almost identical as measured in air and N2 atmosphere. This further confirms that EPR signal comes from H2-In2O3 sample itself due to hydrogen treatment. The existence of EPR signals at g = 2.00 are generally considered as a signature of singly ionized oxygen vacancies (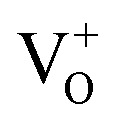 , passivation centres) and anticipated as recombination centres for the PL processes.48
Fig. 4. (a) EPR spectra of air- and H2-In2O3 at room temperature. (b) EPR spectra of air-In2O3 and H2-In2O3 in N2 atmosphere. Simple schematic model for (c) blue emission in air- and H2-In2O3 (d) donor (D) and passivation (P) originated PL emissions in H2-In2O3. Solid black arrows show non-radioactive transitions and dashed black arrows indicate radiative transitions.
PL emissions are often used to determine the efficiency of charge carrier transfer and trapping, as well as to examine the lifetime of photo-induced e− and h+ pairs in semiconductor. Therefore, we performed photocatalytic methyl orange degradation test over both air- and H2-In2O3 in order to examine the effect of PL on the photocatalytic activity (Fig. S4†). The results clearly shows that H2-In2O3 gives rise to lower photo-catalytic activity in comparison with air-In2O3. This agrees with that 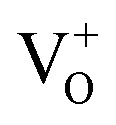 (passivation centres) in H2-In2O3 acts as mid gap radiative recombination centres and traps photo-induced electrons. This recombination process leads to decrease the photocatalytic activity of H2-In2O3.
Our attribution of green-yellow PL emission to the shallow donors to the deep holes at oxygen vacancies does not work against the view of green photoemission originating from the defects. In this work we show a reasonable correlation between green-yellow PL emission, paramagnetic oxygen vacancy (passivation center) and CB electrons (donor behavior), as shown in Fig. 4c and d. Grey coloration and EPR data both clarify the presence of oxygen vacancies 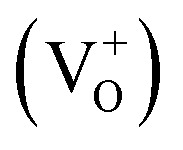 . Whereas, FT-IR spectra reveals that due to hydrogen-induced defects, both delocalized (within CB) and localized (below CB) electrons exist in H2-In2O3. In this scenario, upon UV excitation a photo-induced carrier (shallow state electron) readily combines with the hole in
 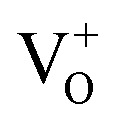 via radiative recombination process and emits green-yellow PL emission in H2-In2O3.
3. Conclusion
We synthesized In2O3 nanoparticles by hydrothermal process followed with subsequent heat treatment in air and under hydrogen atmosphere. Structural, optical and luminescence properties of H2-In2O3 has been demonstrated herein. We observe that hydrogen treatment has no influence on the crystal structure, but alter intrinsic electronic structure and optical properties. H2-In2O3 generates photoemission ranging from blue to green-yellow, while air-In2O3 shows only blue emission. In H2-In2O3 the defect related green-yellow (500–650 nm) emission reveals the transition of photo-induced electrons to the holes in 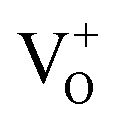 . EPR, FT-IR and UV spectroscopies provide indisputable evidences that H2-In2O3 contains large number of defects. This work has demonstrated that hydrogen treatment can be used as a promising strategy to fundamentally alter the PL emission performance of In2O3.
4. Experimental
The In2O3 samples were synthesized in the following procedure.
Firstly indium acetate tetrahydrate (0.2 M) was added into ethanol/deionized water (14/2 ml) and stirred for 2 h. After stirring, the mixture was transferred into a 25 ml Teflon-line stainless steel autoclave and heated at 150 °C for 24 h. Reaction autoclave was cooled to room temperature naturally and then white powder of indium hydroxide was obtained after several cycles of washing and centrifuging. The prepared powder was oven-dried at 90 °C for 12 h. The conversion of indium hydroxide to indium oxide was carried out in a tubular furnace in air at 400 °C for 12 h. For hydrogen treatment, reducing gas (H2/Ar, v/v = 5/95) was introduced into the vertical quartz tube to purge air prior to heating. Afterward, hydrogen treatment was performed at 400 °C for 12 h.
4.1. Characterization
The as-synthesized samples were analysed and characterized by X-ray powder diffraction (XRD), using a Rigaku MiniFlex 600 X-ray diffractometer with Cu Kα (λ = 1.54178 Å). Scanning electron microscopy (Zeiss Supra 40 scanning electron microscope at an acceleration voltage of 5 kV) was used to detect the morphologies of the materials. Fourier transform infrared (FT-IR) spectra of samples were examined on a SHIMADZU IR Affinity-1 spectrometer using KBr pellet. Raman spectra were recorded with LABRAM-HR spectrometer. XPS was recorded on ESCALab MKII Photoelectron spectrometer. Electron paramagnetic resonance (EPR) measurement was performed by JES-FA2OO spectrometer (JEOL) at room temperature. Solid state UV-Vis-NIR spectra were collected using DUV-3700 UV-Vis spectrometer. For the investigation of photoluminescence properties the PL spectra was recorded at room temperature on Horiba JY Fluorolog-3-tau fluorescence spectrometer with a Xe lamp using excitation at 280 nm.
4.2. Photocatalytic MO degradation
Under exterior irradiation (cut 400 nm, optical power density 150 mW cm−2) for certain period of time, the photocatalytic activities (at room temperature) of both samples (air- and H2-In2O3) are evaluated from photocatalytic degradation of methyl orange (MO). The contents of MO at certain time intervals could be monitored by (absorption peak at λ = 464) using UV-Vis spectrophotometer (TU-1810).
Conflicts of interest
There are no conflicts of interest to declare.
Supplementary Material
Acknowledgments
S. A. thanks for China scholarship council (CSC) for financial support. We sincerely acknowledge financial support from National Natural Science Foundation of China (NSFC, 21571167, 51502282), Chinese Academy of Sciences, the fundamental Research Funds for the Central universities (WK2060190053) and Anhui Province Natural Science Foundation (1608085MB28).
Electronic supplementary information (ESI) available. See DOI: 10.1039/c8ra00654g
References
- Yang H. Liu L. Liang H. Wei J. Yang Y. CrystEngComm. 2011;13:5011–5501. doi: 10.1039/C1CE05274H. [DOI] [Google Scholar]
- Ko T. S. Chu C. P. Chen J. R. Chang Y. A. Lu T. C. Kuo H. C. Wang S. C. J. Vac. Sci. Technol., A. 2007;25:1038–1041. [Google Scholar]
- Chan C.-H. Lin M.-H. Chao L.-C. Lee K.-Y. Tien L.-C. Ho C.-H. J. Phys. Chem. C. 2016;120:21983–21989. [Google Scholar]
- Yin W. Su J. Cao M. Ni C. Hu C. Wei B. J. Phys. Chem. C. 2010;114:65–73. [Google Scholar]
- Yang J. Lin C. Wang Z. Lin J. Inorg. Chem. 2006;45:8973–8979. doi: 10.1021/ic060934+. [DOI] [PubMed] [Google Scholar]
- Liang C. Meng G. Lei Y. Phillipp F. Zhang L. Adv. Mater. 2001;13:1330–1333. doi: 10.1002/1521-4095(200109)13:17<1330::AID-ADMA1330>3.0.CO;2-6. [DOI] [Google Scholar]
- Tang Q. Zhou W. Zhang W. Ou S. Jiang K. Yu W. Qian Y. Cryst. Growth Des. 2005;5:147–150. [Google Scholar]
- Peng X. S. Meng G. W. Zhang J. Wang X. F. Wang Y. W. Wang C. Z. Zhang L. D. J. Mater. Chem. 2002;12:1602–1605. doi: 10.1039/B111315A. [DOI] [Google Scholar]
- Lin Z. Zhu Q. Dong Y. Liu S. Li J.-G. Li X. Huo D. Zhang M. Xie M. Sun X. CrystEngComm. 2016;18:3768–3776. doi: 10.1039/C6CE00115G. [DOI] [Google Scholar]
- Singhal A. Jain D. Pai M. R. Agouram S. Errandonea D. Tyagi A. k. RSC Adv. 2016;6:108393–108403. doi: 10.1039/C6RA23693F. [DOI] [Google Scholar]
- Guo Z. liu J. Jia Y. Chen X. Meng F. Li M. Liu J. Nanotechnology. 2008;19:345704. doi: 10.1088/0957-4484/19/34/345704. [DOI] [PubMed] [Google Scholar]
- Guha P. Kar S. Chaudhuri S. Appl. Phys. Lett. 2004;85:3851–3853. doi: 10.1063/1.1808886. [DOI] [Google Scholar]
- Zheng M. J. Zhang L. D. Li G. H. Zhang X. Y. Wang X. F. Appl. Phys. Lett. 2001;79:839–841. doi: 10.1063/1.1389071. [DOI] [Google Scholar]
- Jothibas M. Manoharan C. Jeyakumar S. J. Praveen P. J. Mater. Sci.: Mater. Electron. 2015;26:9600–9606. doi: 10.1007/s10854-015-3623-x. [DOI] [Google Scholar]
- Yu D. Yu S.-H. Zhang S. Zuo J. Wang D. Qian Y. Adv. Funct. Mater. 2003;13:497–501. doi: 10.1002/adfm.200304303. [DOI] [Google Scholar]
- Yin W. Esposito D. V. Yang S. Ni C. Chen J. G. Zhao G. Zhang Z. Hu C. Cao M. Wei B. J. Phys. Chem. C. 2010;114:13234–13240. [Google Scholar]
- Cao H. Qiu X. Liang Y. Zhu Q. Appl. Phys. Lett. 2003;83:761–763. doi: 10.1063/1.1596372. [DOI] [Google Scholar]
- Wang C. Chen D. Jiao X. Chen C. J. Phys. Chem. C. 2007;111:13398–13403. [Google Scholar]
- Jean S.-T. Her Y.-C. Cryst. Growth Des. 2010;10:2104–2110. [Google Scholar]
- Zhang C. Lin J. Chem. Soc. Rev. 2012;41:7938–7961. doi: 10.1039/C2CS35215J. [DOI] [PubMed] [Google Scholar]
- Kumar M. Sing V. N. Singh F. Lakshmi K. V. Mehta B. R. Singh J. P. Appl. Phys. Lett. 2008;92:171907. doi: 10.1063/1.2910501. [DOI] [Google Scholar]
- Liu D. Lv Y. Zhang M. Liu Y. Zhu Y. Zong R. Zhu Y. J. Mater. Chem. A. 2014;2:15377–15388. [Google Scholar]
- Shao D. Yu M. Lian J. Sawyer S. Appl. Phys. Lett. 2012;101:211103. doi: 10.1063/1.4767679. [DOI] [PMC free article] [PubMed] [Google Scholar]
- Wang G. Wang H. Ling Y. Tang Y. Yang X. Fitzmorris R. C. Wang C. Zhang J. Z. Li Y. Nano Lett. 2011;11:3026–3033. doi: 10.1021/nl201766h. [DOI] [PubMed] [Google Scholar]
- Zhou W. Li W. Wang J.-Q. Qu Y. Yang Y. Xie Y. Zhang K. Wang L. Fu H. Zhao D. J. Am. Chem. Soc. 2014;136:9280–9283. doi: 10.1021/ja504802q. [DOI] [PubMed] [Google Scholar]
- Chen X. Liu L. Yu P. Y. Mao S. S. Science. 2011;331:746–750. doi: 10.1126/science.1200448. [DOI] [PubMed] [Google Scholar]
- Van de Walle C. G. Neugebauer J. Nature. 2003;423:626–628. doi: 10.1038/nature01665. [DOI] [PubMed] [Google Scholar]
- Kumar M. Chatterjee R. Milikisiyants S. Kanjilal A. Voelskow M. Grambole D. Lakshmi K. V. Sigh J. P. Appl. Phys. Lett. 2009;95:013102. doi: 10.1063/1.3159786. [DOI] [Google Scholar]
- Wang T. Radovanovic P. V. Chem. Commun. 2011;47:7161–7163. doi: 10.1039/C1CC11957E. [DOI] [PubMed] [Google Scholar]
- Ohashi N. Ishigaki T. Okada N. Sekiguchi T. Sakaguchi I. Haneda H. Appl. Phys. Lett. 2002;80:2869–2871. doi: 10.1063/1.1470703. [DOI] [Google Scholar]
- Sekiguchi T. Ohashi N. Terada Y. Jpn. J. Appl. Phys. 1997;36:L289. doi: 10.1143/JJAP.36.2638. [DOI] [Google Scholar]
- Panayotov D. A. Burrows S. P. Morris J. R. J. Phys. Chem. C. 2012;116:4535–4544. [Google Scholar]
- Sezen H. Buchholz M. Nefedov A. Natzeck C. Heissler S. Di Valentin C. Wöll C. Sci. Rep. 2014;4:3808. doi: 10.1038/srep03808. [DOI] [PMC free article] [PubMed] [Google Scholar]
- Meléndez J. J. Wierzbowska M. J. Phys. Chem. C. 2016;120:4007–4015. [Google Scholar]
- Shifu C. Xiaoling Y. Huaye Z. Wei L. J. Hazard. Mater. 2010;180:735–740. doi: 10.1016/j.jhazmat.2010.04.108. [DOI] [PubMed] [Google Scholar]
- Xia T. Wallenmeyer P. Anderson A. Murowchick J. Liu L. Chen X. RSC Adv. 2014;4:4154–41658. [Google Scholar]
- Naldoni A. Allieta M. Santangelo S. Marelli M. Fabbri F. Cappelli S. Bianchi C. L. Psaro R. Santo V. D. J. Am. Chem. Soc. 2012;134:7600–7603. doi: 10.1021/ja3012676. [DOI] [PubMed] [Google Scholar]
- Zhu Q. Peng Y. Lin L. Fan C.-M. Gao G.-Q. Wang R.-X. Xu A.-W. J. Mater. Chem. A. 2014;2:4429–4437. [Google Scholar]
- Du J. Yang M. Cha S. N. Rhen D. Kang M. Kang D. J. Cryst. Growth Des. 2008;8:2312–2317. [Google Scholar]
- Berengue O. M. Rodrigues A. D. Dalmaschio C. J. Lanfredi A. J. Leite E. R. Chiquito A. J. J. Phys. D: Appl. Phys. 2010;43:045401. doi: 10.1088/0022-3727/43/4/045401. [DOI] [Google Scholar]
- Zhu H. Wang X. Yang F. Yang X. Cryst. Growth Des. 2008;8:950–956. [Google Scholar]
- Gan J. Lu X. Wu J. Xie S. Zhai T. Yu M. Zhang Z. Mao Y. Wang S. C. Shen Y. Tong Y. Sci. Rep. 2013;3:1021. doi: 10.1038/srep01021. [DOI] [PMC free article] [PubMed] [Google Scholar]
- Yin W. Su J. Cao M. Ni C. Cloutier S. G. Huang Z. Ma X. Ren L. Hu C. Wei B. J. Phys. Chem. C. 2009;113:19493–19499. [Google Scholar]
- Siedl N. Gügel P. Diwald O. J. Phys. Chem. C. 2013;117:20722–20729. [Google Scholar]
- Panayotov D. A. Yates Jr J. T. Chem. Phys. Lett. 2007;436:204–208. doi: 10.1016/j.cplett.2007.01.039. [DOI] [Google Scholar]
- Cao Y. Huang X. Wu Y. Zou Y.-C. Zhao J. Li G.-D. Zou X. RSC Adv. 2015;5:60541–60548. doi: 10.1039/C5RA09063F. [DOI] [Google Scholar]
- Zou X. Liu J. Su J. Zuo F. Chen J. Feng P. Chem.–Eur. J. 2013;19:2866–2873. doi: 10.1002/chem.201202833. [DOI] [PubMed] [Google Scholar]
- Ji W. Lee M.-H. Hao L. Xu X. Agathopoulos S. Zheng D. Fang C. Inorg. Chem. 2015;54:1556–1562. doi: 10.1021/ic502568s. [DOI] [PubMed] [Google Scholar]
Associated Data
This section collects any data citations, data availability statements, or supplementary materials included in this article.


