Abstract
Laser induced graphitization of polyacrylonitrile-based carbon fibers (CFs) was carried out in a self-designed furnace with a CO2 laser source. The microstructures combined with mechanical properties of the irradiated CFs were measured by Raman spectroscopy, X-ray photoelectron spectroscopy (XPS), wide-angle X-ray diffraction (WAXD), scanning electron microscopy (SEM), high resolution transmission electron microscopy (HRTEM) and single filament tensile test, respectively. The results exhibited that the hierarchical structures of CFs showed different responses to the CO2 laser. After laser graphitization, the surface and cross-section structure were characterized by Raman spectroscopy. As the power density increased, a profound increase of graphitization degree happened and obvious skin-core structures were observed. Furthermore, the results of XPS measurements indicated that the irradiated CFs showed more conjugated structures. For crystallite structure, the interlayer spacing of the (002) lattice decreased and the thickness of crystallite increased after graphitization. The size of the (002) lattice parallel to the fiber axis changed slightly. The surface morphology was also investigated by SEM, sheet structures and particles could be observed on the surface of CFs. This was attributed to fast energy addition of laser and the characteristics of the material. Further HRTEM investigation revealed that the sheet structure is multilayered graphene. The Young's modulus of irradiated fibers showed obvious improvements compared to that of as-received ones.
A new method based on laser technique is proposed to graphitize PAN-based CFs.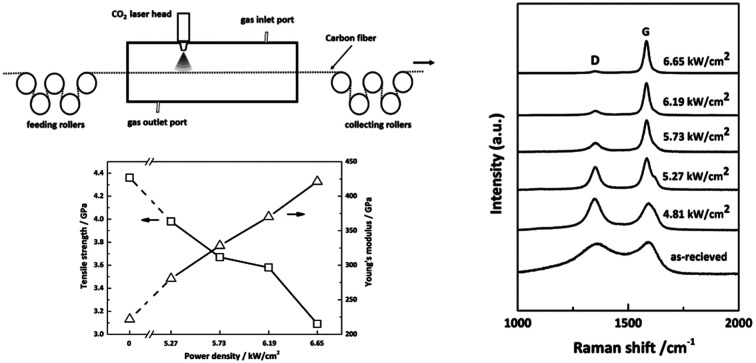
Introduction
Polyacrylonitrile (PAN) based carbon fibers (CFs) have been widely used as reinforcements in composites over the past several decades because of their superior properties such as high tensile strength, high modulus and light weight.1,2 To obtain high modulus graphite fibers, graphitization is normally carried out at 2000–3000 °C in a furnace which was made by graphite tube as a heating unit.3–5 In this type of furnace, CFs were heated indirectly via convective and irradiative heat transformation under inert gas protection, resulting in a slow heating rate, short life time of heating units as well as huge waste of energy.6,7
During the past years, irradiation methods have attracted increasing interest and considerable efforts were paid to the irradiation of CFs. For example, electron,8 plasma,9 ion10 and microwave11etc. were applied as alternative irradiation sources for the stabilization12 and even carbonization processes.13 Kim S. Y. et al. reported the carbonization of PAN-based CFs using microwave plasma and the resultant CFs exhibited rough surface combined with good mechanical properties.14 However, during the microwave heating process of carbons, plasma sputtering phenomenon such as ball lightning and arc discharge plasmas could be observed. The temperature of the plasma might be over high to cause damages to devices and limit the promotion of CFs' properties.15 Moreover, Xu et al. reported that γ-ray irradiation with short wavelength and high energy was effective for the improvement of CFs' graphitization degree.16 Nevertheless, it should be noted that some damages would be generated by carbon atom displacement or sputtering and structural order would be disturbed also, when the fluences of γ-ray exceeded a specific value.17,18
Photothermal and photochemical effects are frequently considered in laser irradiation process. In the present study, intermediate infrared CO2 laser with a long wavelength of 1.6 μm was applied to the graphitization of CFs. Since photochemical processes tend to occur in lasers with short wavelengths, infrared laser is more likely to generate photothermal effects due to the long wavelength. The reason should be that the C–C bond energy is estimated to be 3.7 eV.19 While the photo energy of a wavelength of 1.6 μm is equivalent to 0.77 eV which was not sufficient for direct photochemical bond breaking. However, the photons generated by CO2 laser can intensify the lattice vibrations and the overall effect is the conversion of photonic energy derived from the beam of the incident CO2 laser into heat. Therefore, the photothermal effect plays a major role in the CO2 laser graphitization. The results showed that CO2 laser irradiation was an incoherent technique which could effectively induce the graphitization of PAN-based CFs and lead to local structural changes. The process exhibited more stable and tunable characteristics than the traditional irradiation techniques. During laser induced graphitization process, no arc discharge and ball lightning phenomena occurred. The target PAN-based CFs were burning like lamp filaments, emitting a dazzling light as a function of incident CO2 laser irradiation.
Unlike the conventional heating process that involves heat conduction and/or convection, laser interacts with matter by supplying energy directly to the reactant material and heating its bulk volume rapidly. The laser-assisted heating process is superior to the conventional one not only because it is economic, clean and ecofriendly but also because it is quick and efficient. Due to the fast energy addition, CFs could be graphitized in a very short period by CO2 laser irradiation. This technique can be of industrial importance for large-scale production.
Experimental details
CO2 laser graphitization system
The laser system for the continuous graphitization process mainly comprises a visual and sealed chamber, feeding rollers, collecting rollers and a built-in laser device. A schematic of this system is presented in Fig. 1. The laser generator (XN-N8, Xing Na laser, CHN) emits an intermediate infrared wave (λ = 10.6 μm). The laser power density is tunable and stable. Before the graphitization process, the chamber was filled with purified argon gas to prevent oxidation of CFs. After that, laser can be converged onto the surface of CFs through a series of lens. In order to focus the input power on CFs, the fibers were fixed in the center axis of the chamber to overlap with the laser pot. The diameter of laser pot (1 mm) is able to cover the fiber tow (approximately 0.7 mm width) prepared by ourselves. Rollers were connected to each end of the chamber to release and receive fibers. The exposure time can be adjusted by the transferring speed which was controlled by stepping motor.
Fig. 1. A schematic of the CO2 laser system for the graphitization process.
Carbon fibers and laser graphitization
The as-received PAN-based CFs (1k) were obtained after carbonization at 1300 °C without sizing treatment and prepared by National Engineering Laboratory of Carbon Fiber at Beijing University of Chemical Technology. The graphitization experiments were conducted at a constant transferring speed (0.4 mm s−1), equivalent to a residence of time of 2.5 s. A constant load of 0.5 N was imposed on fiber tow, equivalent to a stretching stress of approximately 13 MPa, which was supplied by adjusting the speed difference between feeding roller and collecting roller. The power density sets of five experiments tows were 4.81, 5.27, 5.73, 6.19 and 6.65 kW cm−2, respectively.
Characterization
Raman measurements were carried out by a Raman spectrometer (RM2000, Renishaw, UK) combined with an Olympus optical microscope to obtain information about the chemical structure transitions from fiber surface and cross-section after irradiation and reveal the effects of laser power density on their chemical structures. Raman spectra from fiber cross-section were obtained by first embedding the uniaxial filaments in thermoplastic matrix, then mechanically grinding and polishing the surface perpendicular to the fiber axis by polishing machine (Struers Inc.). The 100× objective lens of the microscope was used to focus the laser beam on single filament. To avoid heating effects or a potential modification of local structural organization, very low incident power density was adopted. Raman spectra were measured in the range of 1000–2000 cm−1 with static scanning mode under an Ar+ laser excitation wavelength of 532 nm. The exposure time and number of circulations were 10 s and 3 times, respectively. The quantitative Raman parameters were obtained by the deconvolution of Raman spectra through curve fitting procedure using a linear baseline correction combined with Lorentzian and Gaussian function by OPUS software.
XPS (ESCA 250, ThermoFisher, USA) measurements were performed with a 250 ESCA system through Al Kα (200 eV) radiation to characterize the chemical states of the as-received and irradiated PAN-based CFs. The C1s spectrum was deconvoluted by XPSPEAK software to determine the surface functional groups content of CFs. The positions used for peaking fitting are according to the components suggested by Biniak.20
Wide-angle X-ray diffraction (WAXD) measurements were performed on an X-ray diffraction analyzer (X'Pert PRO, Panalytical, NLD) and operated at 40 kV and 40 mA with Ni-filtered Cu Kα radiation. Fiber bundles were fixed on a special sample holder and parallel to each other. Measurements were made by performing an equatorial scan over a 2θ range from 15° to 35°, as well as a meridian scan from 0° to 90°. Bragg equation (d002 = λ/2 sin θ, where 2θ is the diffraction angle of (002) miller plane, λ = 0.15406 nm is the wavelength of the X-ray) was used to calculate the evolution of interlayer spacing. The crystallite sizes were calculated by Scherrer equation (Lc = K1λ/β1 cos θ1, where 2θ1 is the diffraction peak position of (002) plane, β1 is the FWHM of (002) peak and the shape factor K1 is 0.9 for Lc. La = K2λ/β2 cos θ2, where 2θ2 is the diffraction peak position of (100) plane, β2 is the FWHM of (100) peak and the shape factor K2 is 1.84 for La).21
The surface morphology of as-received CFs as well as CO2 laser irradiated ones was observed by SEM (JSM-7800F, JEOL, Japan) with an acceleration voltage of 10 kV.
To investigate the sheet-like structures from CFs' surface, cross-sectional HRTEM (JEM-2100, JEOL, Japan) observations were made at 200 kV. A platinum (Pt) thin layer was deposited to protect the top surface before sample preparation using focused ion beam milling (Auriga, Zeiss, German). To make much thinner and undamaged HRTEM samples, we additionally milled the samples using the milling system mentioned above at a lower energy.
The mechanical properties of samples were tested by tensile instrument (YG001A, Tianxiang, CHN) via single filament mode. The filaments to be tested were selected randomly from fiber tows. Measurements were made by attaching a filament straightly to a gauge paper case with 25 mm distance as reported elsewhere.22 The specimen was tested at a crosshead speed of 2 mm min−1. For each sample, 50 filaments were tested. The diameter of single carbon fiber was measured using an optical microscope with a closed circuit television camera (BX51, OLYMPUS, JPN). The tensile test gives load P and strain ε, then tensile stress σ and modulus were calculated as follows: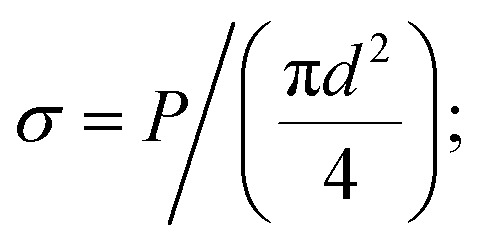 E = σ/ε.
Results and discussion
The evolution of chemical structure
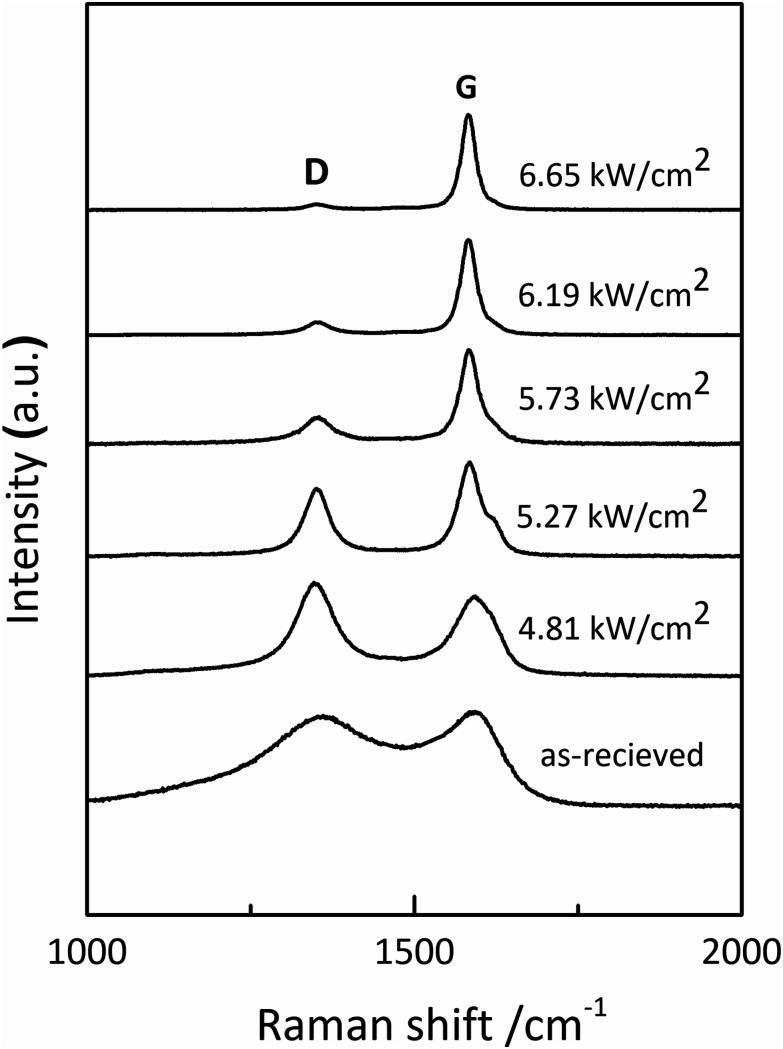
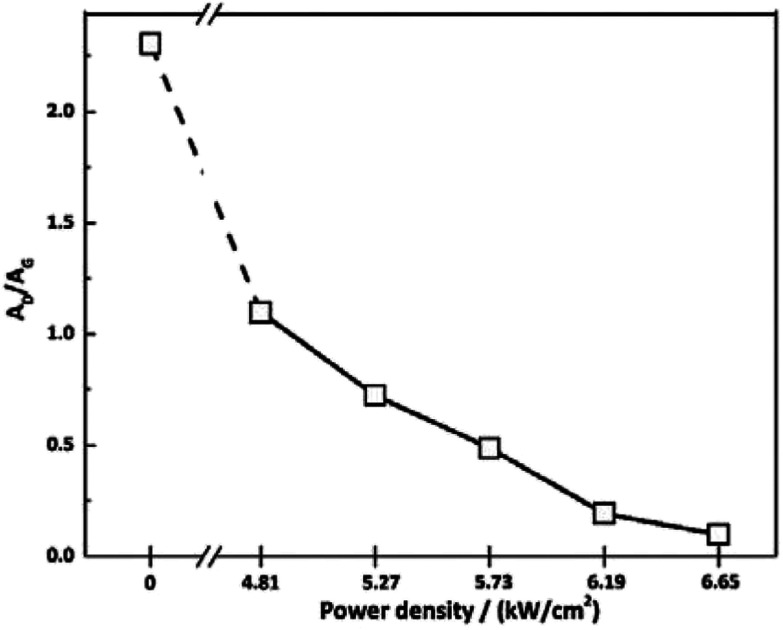
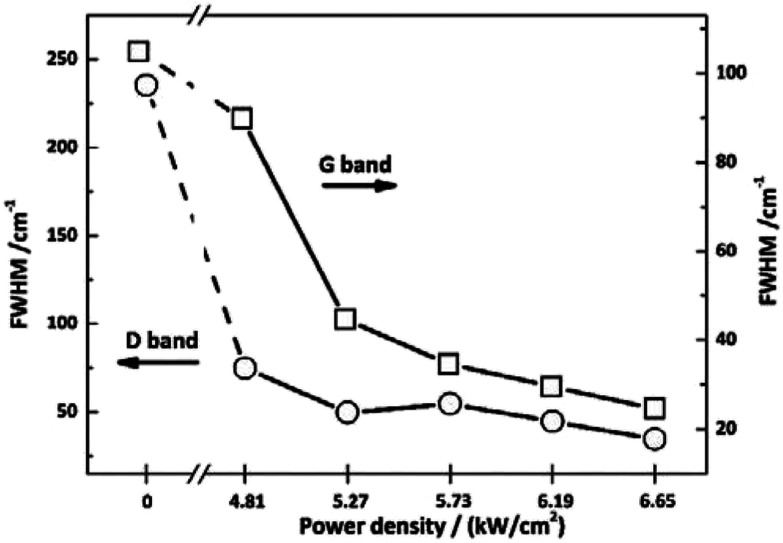
To investigate the effect of irradiation on the surface chemical structure of CFs, Raman spectra of samples under different laser power densities as well as received CFs were shown in Fig. 2 for comparison. The D and G band can be clearly observed in Raman spectra at approximately 1360 and 1580 cm−1 respectively. The appearance of G band is due to in-plane stretching vibration modes of the sp2 hybridized carbon in the hexagonal lattice, while the D band has been explained as a manifestation of in-plane vibrational modes at the surface of sp2 domains, which is caused by the presence of disruptions in sp2 bonding like vacancies, dangling bonds, heptagon and amorphous carbon.23,24 According to Fig. 2, the gradual separation of D and G bands occurred after irradiation, which indicated the existence of the graphite nano-crystallite or glass-like carbon.25,26 At the same time, the D band progressively declined while the so-called graphite G band remained and became relatively shaper and stronger as power density increased. It is also worth noting that the pristine PAN-based CF irradiated at 6.65 kW cm−2 shows very weak D band and relatively sharper and stronger G band, which is close to the ideal graphite. What is commonly assumed in this study is that the defects are annealed out under the photothermal effect of CO2 laser when the laser power density increases, thus obtaining high-quality graphitic materials. Therefore, the decreases in magnitude can be seen in D band with laser power density increasing. The integral area ratio of D to G band AD/AG value is considered as the measure for graphitization degree.27–29Fig. 3 showed the relationship between AD/AG value and laser power density. As the power density increased, AD/AG value became lower. Which indicated that the sp3 bonds have converted into sp2 bonds, revealing that turbostratic graphite structures have been converted into three dimensional ordered structures. As can be seen in Fig. 4, considerable decrease about FWHM of D and G bands were also observed, which was in agreement with the ratios of AD/AG. According to Antunes,30 the increase in the width of the D peak was attributed to dispersion in the defect domain size. This can be analogized that the FWHM of G band could be related to the domain size of graphite. Therefore, the size of defects and graphite tended to be constant after irradiation.
Fig. 2. Raman spectra of the as-received CFs and the irradiated ones obtained at different CO2 laser power densities.
Fig. 3. Values of AD/AG for the as-received CFs and the irradiated ones obtained at different CO2 laser power densities.
Fig. 4. Values of FWHM for the as-received CFs and the irradiated ones obtained at different CO2 laser power densities.
Furthermore, Raman data can also be used as paleothermometer to estimate the highest treatment temperature (HTT) of irradiated CF during CO2 laser graphitization process.31 The height ratio of D and G bands HD/HG is the most relevant Raman parameter to determine the HTT of the irradiated CFs. This ratio of CFs irradiated at 6.65 kW cm−2 is almost equal to that of graphite fibres obtained under conventional thermal treatment at 3000 °C.5
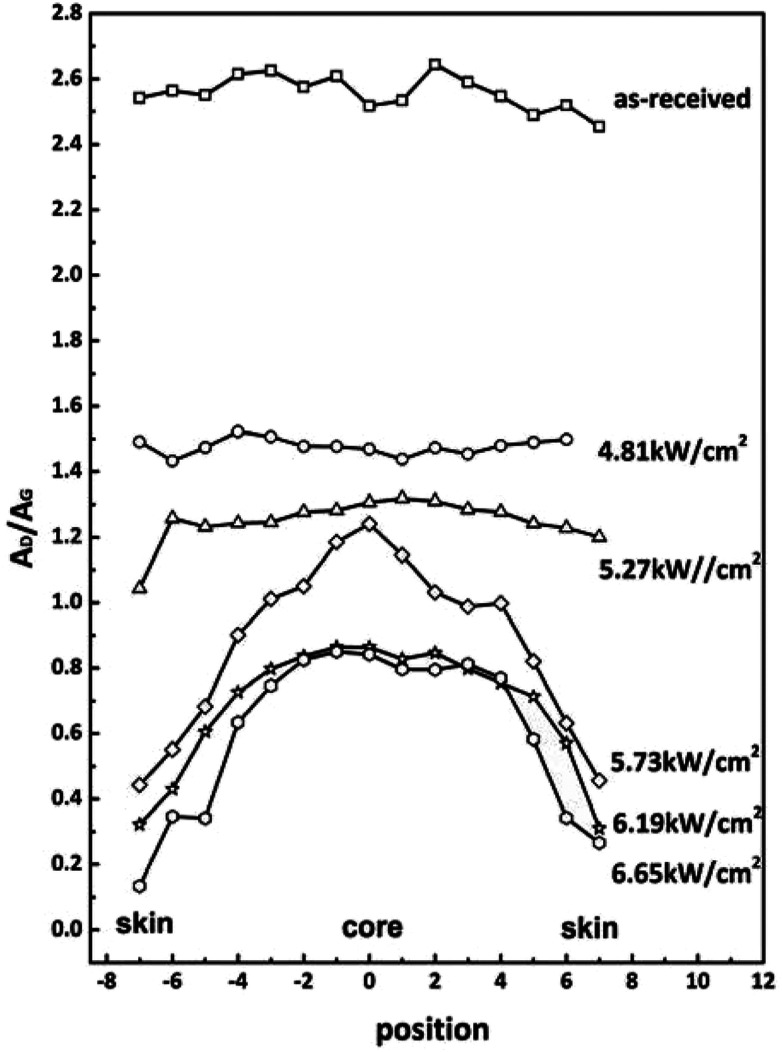
Raman measurements for the cross-section of fibers were performed to further reveal the microstructural evolution. The AD/AG distributions of CFs obtained under different laser power densities are given in Fig. 5. Distance 0 corresponds to the center of cross section. The AD/AG is taken as a function of the distance across the fiber surface. The distributions of AD/AG of CFs obtained under low power densities and as-received ones are both approximately horizontal lines except for some fluctuations. It indicated that the radial chemical structures are almost homogeneous. As the laser power densities increased, the shapes of AD/AG distributions declined which exhibited higher graphitization degrees. The skin-core differences, however, became more and more obvious. This is because the skin part can be graphitized more easily than core part.
Fig. 5. A D/AG values measured by Raman from cross section of CFs obtained at different power densities.
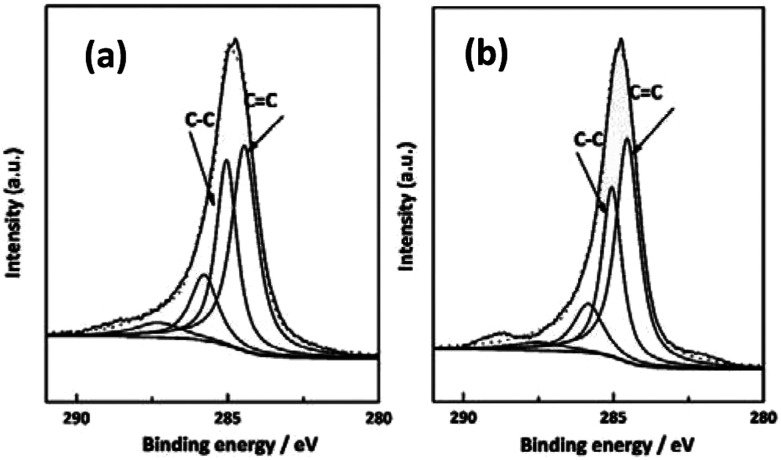
XPS was also utilized to characterize the chemical compositions of the near surface (6 nm) of the as-received and irradiated CF. As shown in Fig. 6, by analyzing the C1s spectra of PAN-based CF before and after irradiation, the information of the functional groups present on the samples could be obtained. The spectra show two high peaks located at 284.4 eV and 285.2 eV, indicating the presence of C C and C–C bonds, respectively. Table 1 summarizes the different chemical states of C1s for the as-received and irradiated samples at 5.271 kW cm−2 after curve fitting of C1s peak. It was known from Table 1 that the C C bond content increases from 45.5% to 49.8% for the as-received and irradiated samples, and the calculated ratios of sp2 hybridized C C bond to sp3 hybridized C–C bond for the as-received and irradiated are 1.37 and 1.52, respectively. The above results showed that the irradiation of CO2 laser can improve the conjugated extent of CFs. The most important mechanism is photo-thermal effect of CO2 laser. When the temperature exceeds the threshold for graphitization, removal reaction of non-carbon atoms and rearrangement of carbon atoms happened. The conclusion is in good accordance with Raman characterization.
Fig. 6. C1s XPS spectra of (a) as-received PAN-based CFs and (b) CFs irradiated at 5.27 kW cm−2.
Relative content of the different chemical states of C1s for the as-received and irradiated PAN-based CF at 5.27 kW cm2 power density.
| Sample | C C (%) | C–C (%) | C C/C–C |
|---|---|---|---|
| As-received | 45.46 | 33.11 | 1.37 |
| Irradiated | 49.76 | 32.65 | 1.52 |
The evolution of crystallite structure
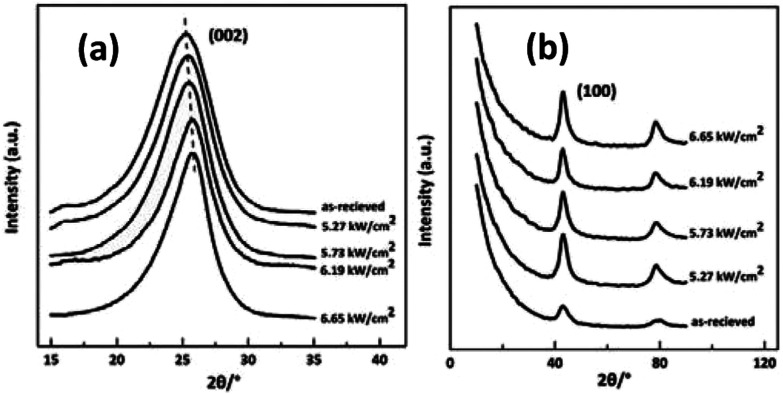
In the present work, the effect of laser power densities on the rearrangement of aggregation structures of CFs was investigated by WAXD. Fig. 7 (a) and (b) show the equatorial and meridian WAXD profiles of the irradiated samples respectively. Obvious differences among samples caused by the variation of irradiation power density can be seen in the XRD patterns in Fig. 7. The peak position of (002) reflection shifted from 25° to 27° with the power density increase.
Fig. 7. XRD spectra of the as-received CFs and the irradiated CFs obtained at different CO2 laser power densities (a) equatorial scanning, (b) meridian scanning.
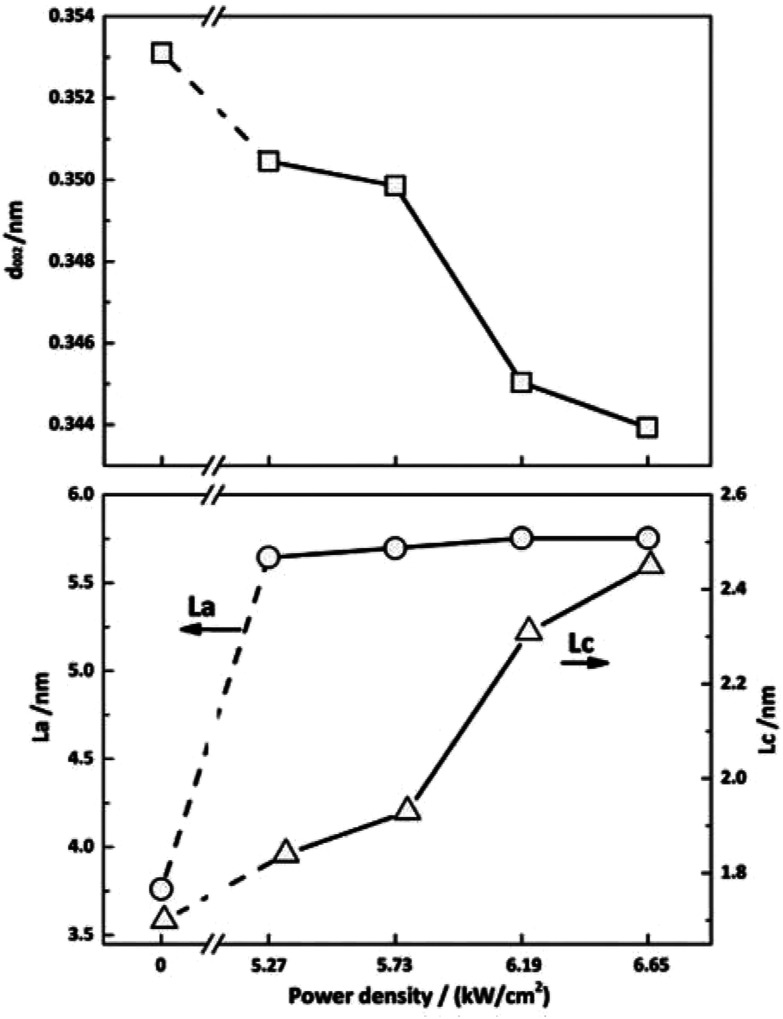
Fig. 8 exhibits the crystalline structural parameters before and after irradiation. CO2 laser irradiation of PAN-based CFs at high power density resulted in profound decreases in d002 value and increases in Lc. These changes can be attributed to the rearrangement of carbon layers as a function of photothermal effect of CO2 laser. As show in Fig. 8, CF irradiated at 6.65 kW cm−2 has the smallest interlayer spacing and the biggest crystallite size, exhibiting the highest graphitization degree, which is corresponding to the Raman results in Fig. 2.
Fig. 8. Crystalline structure parameters of PAN-based CFs irradiated at different laser power densities.
As shown in Fig. 8, the size of crystallite width La increases from 3.76 to 5.64 nm, while slight changes can be observed with the further increase of laser power density, which is different from the trend reported before.32 This can be attributed to the characteristic of CO2 laser. Under the photo-thermal effect of CO2 laser, the defects can be transferred into a new state. In other words, annealing effect of CO2 laser could contribute to the rearrangement and self-organization of defect sites of graphite. Hence, there is a large increase in La of irradiated CF. On the other hand, graphitic sheets peeled off from the surface of fiber and self-assembled into granular structures as shown in Fig. 9, which impeded the further increase of La. Therefore, the La value changed slightly.
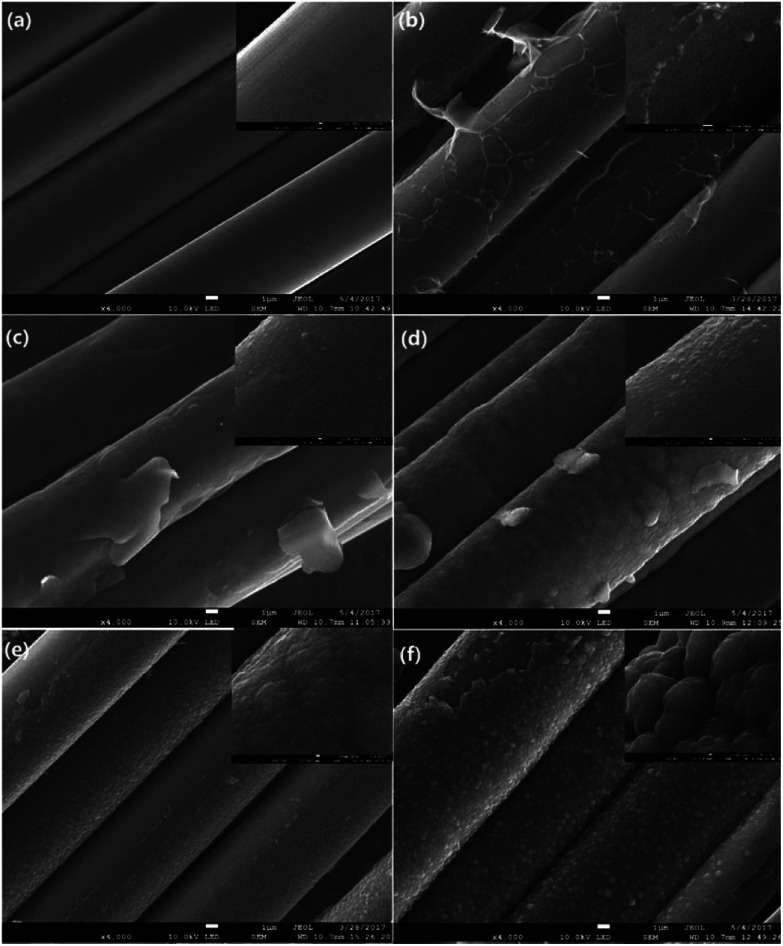
Fig. 9. SEM images of PAN-based CFs irradiated at different laser power densities. (a) As-received (b) 4.81 (c) 5.27 (d) 5.73 (e) 6.19 (f) 6.65 kW cm−2. The insets of Fig. 8 show the partial enlargement of single filament.
The evolution of surface morphology
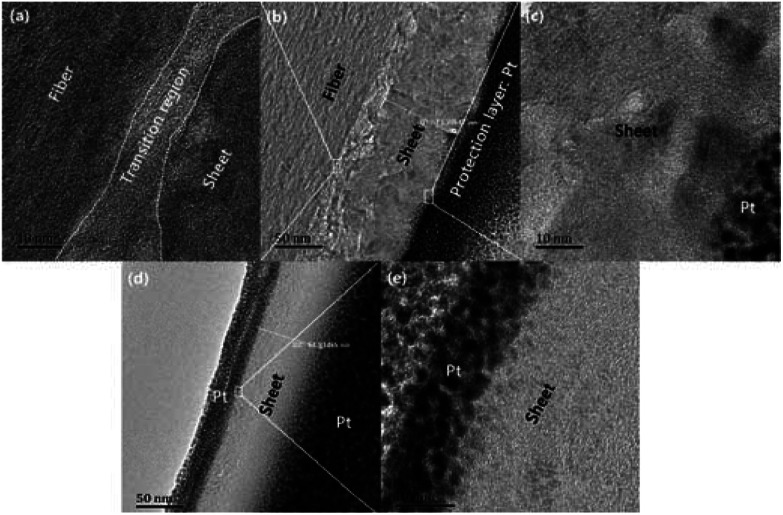
Fig. 9 presents SEM images with magnifications of CFs before and after irradiation which exhibit surface details of fibre tows and partial enlargement of single filaments, respectively. Remarkable differences in morphology could be observed as the applied laser power density increased. It was obvious that the surface of pristine PAN-based CF was relative smooth, while some particles and sheet structures could be observed after irradiation. Even though each sample was extracted in acetone with a Soxhlet extractor for 12 h to remove impurities after irradiation treatment, the particles and sheets were still attached to carbon fibre surface. This clearly indicated that the particles and sheet structures were not only adhering but also strongly chemically bonding onto carbon fibre surface. As can be seen from Fig. 9, the main characteristic structure on the surface was sheet-like shape at low laser power densities (from 4.81 to 5.27 kW cm−2). The SEM image of CF irradiated at 4.81 kW cm−2 is demonstrated in Fig. 9(b). It is evident that sheet structures combined with few particles could be clearly observed on the CFs surface. The higher the laser power density, the thicker the sheets. When the laser power density was more than 5.27 kW cm−2, particles were observed to be the domination. As the further increase of power density, the size of particles showed an upward trend. At 6.19 kW cm−2, the particles seemed to form a network-like structure by joining together as can be seen in the partial enlargement drawing in Fig. 9(f). Fig. 10(b) is the bright-field HRTEM image of cross-section of CFs obtained at 4.81 kW cm−2, showing distinguishable boundaries among sheet, fiber and protection layer. As shown in Fig. 10(a) which is a partially magnified HRTEM image of Fig. 10(b), obvious lattice fringes can be seen in sheet structure and fiber's surface. While the transition region between the two characteristic areas is amorphous. Furthermore, these regions could be distinguished through diffraction contract, amorphous transition region is brighter than other areas because less electronic scattering happened in this region. The results indicate that sheet is connected with fiber through intertwined and disordered carbon layers. This is consistent with the conclusion of SEM mentioned above. As can be seen in Fig. 10 (c), the lattice fringes are more obvious than that of fiber from Fig. 10 (a). Therefore, sheet structure was highly graphitized. The thickness of sheet is about 73.4 nm in the nanometer scale. So it is a typical multilayered graphene. As the power density increased to 5.21 kW cm−2, sheet was exfoliated from the surface of fiber because Pt was deposited on both sides of sheet surface which can be seen from Fig. 10(d). Fig. 10(e) showed the partial enlargement of exfoliated surface of sheet, highly ordered and parallel graphitic basal layers can be observed, indicating the improvement of multilayered graphene's quality.
Fig. 10. (b) and (d) Bright-field HRTEM images of sheet-like structure from CFs' surface irradiated at 4.81 kW cm−2 and 5.27 kW cm−2 respectively. (a), (c) and (e) Magnified HRTEM images of selected areas in (b) and (d) respectively.
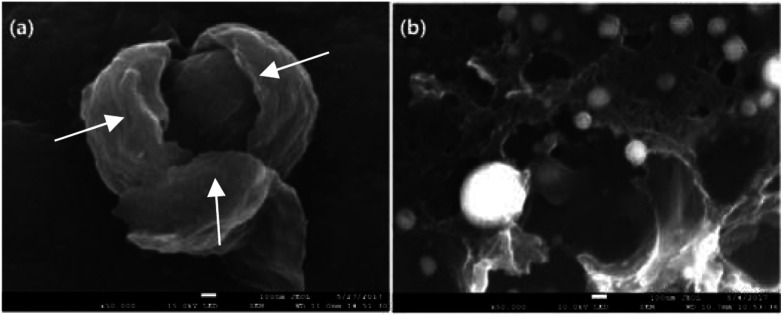
This exceptional and novel structural evolution in Fig. 9 can be explained as following. The well-known structural transformation based on traditional high temperature treatment states that the growth and rearrangement of carbon layers are physical changes occurring during the graphitization process.33 However, some ablated structures are observable on the fiber surface after laser treatment. With the increase of laser power density, laser graphitization gives way to ablation. The initial observation of ablated structures at 4.83 kW cm−2 is due to limited mobility of carbon layers. The motion and rearrangement of the layers are constrained and unable to accommodate the energy addition via self-rearrangement, when the power density is high enough. The carbon layers attempt to straighten out with the neighboring layers exerting a force on the outer layers. Then the outer layers partially detach, leading to the exfoliated sheet structures namely multilayered graphenes. When the temperature caused by photo-thermal effect is high enough, the multilayered graphenes tend to phase transition, reducing their surface area and assembling themselves into final particles as the function of surface tension. As presented in Fig. 11(a), the morphology of the broken particle revealed that the particle is not hollow and comprised of several bending multilayered graphenes which are concentrically arranged around their core as arrows pointed. In addition, it was also found that some particles were embraced by the multilayered graphenes in Fig. 11(b). Overall, the transformation trajectory above is altered versus traditional furnace heating which has a much slower energy addition rate, because the laser provides energy in excess of all graphitization activation energies. Thus, all activation energies including the conservation from sp3 to sp2 hybridization combined with carbon layers' motion, growth, de-wrinkling and reorientation are activated simultaneously. The rapid heating causes the initial deviation from traditional furnace annealing pathway by simultaneously exceeding all energies barriers.
Fig. 11. (a) SEM image of broken particle showing concentric graphitic sheets arranged around a core (b) SEM image of particles embraced by sheets.
Mechanical properties
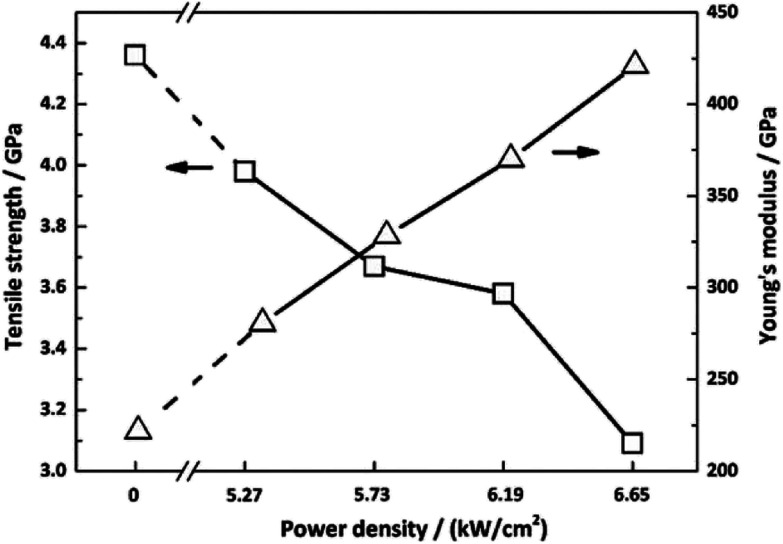
The effect of laser graphitization on the tensile strength and Young's modulus of CFs was presented in Fig. 12. The Young's modulus clearly increased from 221.9 GPa for the pristine CFs to 280.6 GPa (5.27 kW cm−2), 328.4 GPa (5.73 kW cm−2), 370.1 GPa (6.19 kW cm−2) and 421.2 GPa (6.65 kW cm−2) for the irradiated CFs, a 26.5%, 48.0%, 66.8% and 89.8% improvement, respectively. As shown in Fig. 12, while the tensile strength of CFs decreased from 4.36 GPa for the pristine CFs to 3.98 GPa (5.27 kW cm−2), 3.67 GPa (5.73 kW cm−2), 3.58 GPa (6.19 kW cm−2), 3.09 GPa (6.65 kW cm−2) for the irradiated CFs, a 8.7%, 15.8%, 17.9% and 29.1% decline, respectively. The evolution of mechanical properties was in accordance with that under conventional heating process.31 Therefore, photothermal effect is mostly responsible for the interaction of CO2 laser with CFs. In general, this method was effective in promoting the Young's modulus of CFs. The biggest increase of Young's modulus of CFs graphitized by CO2 laser was three times higher than that of γ-ray irradiated ones'.34,35 It should be caused by different laser–material interactions. High temperature generated by CO2 laser's photothermal effect enables the disordered graphitic layers to be moved and rearranged, thereby improving the Young's modulus. However, tensile strength declined due to the reduce of layer's entanglements. On the other hand, high-energy γ-ray can break chemical bonds directly. Activated carbon atoms between graphitic layers will recombine and generate new covalent bonds.36 The resultant cross-linking structures will improve the mechanical properties of treated CFs. While profound changes did not happen in the γ-ray induced graphitization degree. Therefore, the improvement of Young's modulus changed slightly.
Fig. 12. Mechanical properties of CFs irradiated under different power densities.
Conclusions
Due to photothermal effect of CO2 laser, CFs were graphitized after laser treatment and the graphitization degree was improved dramatically. Ablated structures such as exfoliated multilayered graphenes and particles could be observed on the fiber surface. As a result of fast power input of laser, rearrangement of carbon layers was forced to occur, while the interior layers' movements were restricted by the external ones. Then a force was exerted on the outer surface by interior layers, which caused final formation of exfoliated multilayered graphenes from CFs' surface. When the temperature is high enough, multilayered graphenes intend to have phase transition such as melt or gasify and then form particles as a function of surface tension.
In present, an instant, easy and cost effective thermal treatment process proposed here using ordinary CO2 laser oven is likely to be amenable to scale-up for industrial production of graphite fibers. Therefore, CO2 laser graphitization is a promising candidate for the next-generation graphitization process in the carbon fiber industry.
Conflicts of interest
There are no conflicts to declare.
Supplementary Material
Acknowledgments
Financial support from the National Natural Science Foundation of China – Youth Foundation (51602015) and the National High-tech Research and Development Program of China ("863 program" Grant No: 2015AA03A202) is gratefully acknowledged. We sincerely thank Professor Bo Zhu, Professor Luyuan Zhang and Doctor Junwei Yu from Shandong University for the assistance of HRTEM experiments.
References
- Bennett S. C. Johnson D. J. Carbon. 1979;17:25–39. doi: 10.1016/0008-6223(79)90067-8. [DOI] [Google Scholar]
- Liu Y. D. Kumar S. Polym. Rev. 2012;52:234–258. doi: 10.1080/15583724.2012.705410. [DOI] [Google Scholar]
- Edie D. D. Carbon. 1998;36:345–362. doi: 10.1016/S0008-6223(97)00185-1. [DOI] [Google Scholar]
- Newcomb B. A. Composites, Part A. 2016;91:262–282. doi: 10.1016/j.compositesa.2016.10.018. [DOI] [Google Scholar]
- Toyoda M. Kaburagi Y. Yoshida A. Inagaki M. Carbon. 2004;42:2567–2572. doi: 10.1016/j.carbon.2004.05.051. [DOI] [Google Scholar]
- Cherbanski R. Chem. Eng. Technol. 2011;34:2083–2090. doi: 10.1002/ceat.201100405. [DOI] [Google Scholar]
- Cherbanski R. Heat Mass Transfer. 2015;51:723–733. doi: 10.1007/s00231-014-1447-5. [DOI] [Google Scholar]
- Ivanov M. B. Gavrilov N. V. Belyh T. A. Ligacheva E. A. Galijeva L. V. Ligachev A. E. Sohoreva V. V. Surf. Coat. Technol. 2007;201:8326–8328. doi: 10.1016/j.surfcoat.2006.12.034. [DOI] [Google Scholar]
- Dilsiz N. Erinc N. K. Bayramli E. Akovali G. Carbon. 1995;33:853–858. doi: 10.1016/0008-6223(94)00181-X. [DOI] [Google Scholar]
- Oku T. Kurumada A. Kawamata K. Inagaki M. J. Nucl. Mater. 2002;303:242–245. doi: 10.1016/S0022-3115(02)00809-7. [DOI] [Google Scholar]
- Nabais J. M. V. Carrott P. J. M. Carrott M. M. L. R. Menendez J. A. Carbon. 2004;42:1315–1320. doi: 10.1016/j.carbon.2004.01.033. [DOI] [Google Scholar]
- Lee S. W. Lee H. Y. Jang S. Y. Jo S. Lee H. S. Choe W. H. Carbon. 2013;55:361–371. doi: 10.1016/j.carbon.2012.10.062. [DOI] [Google Scholar]
- White T. L., Paulauskas F. L. and Bigelow T. S., US pat. 7824495, 2010
- Kim S. Y. Kim S. Y. Lee S. Jo S. Im Y. H. Lee H. S. Polymer. 2015;56:590–595. doi: 10.1016/j.polymer.2014.11.034. [DOI] [Google Scholar]
- Menendez J. A. Juarez-Perez E. J. Ruisanchez E. Bermudez J. M. Arenillas A. Carbon. 2011;49:346–349. doi: 10.1016/j.carbon.2010.09.010. [DOI] [Google Scholar]
- Xu Z. W. Liu L. S. Huang Y. D. Sun Y. Wu X. Q. Li J. L. Mater. Lett. 2009;63:1814–1816. doi: 10.1016/j.matlet.2009.05.055. [DOI] [Google Scholar]
- Li B. Feng Y. Qian G. Zhang J. C. Zhuang Z. Wang X. P. J. Nucl. Mater. 2013;443:26–31. doi: 10.1016/j.jnucmat.2013.06.049. [DOI] [Google Scholar]
- Li B. Feng Y. Ding K. W. Qian G. Zhang X. B. Zhang J. C. Carbon. 2013;60:186–192. doi: 10.1016/j.carbon.2013.04.012. [DOI] [Google Scholar]
- Houzumi S. Takeshima K. Mochiji K. Toyoda N. Yamada I. Electronics and Communications in Japan. 2008;91:40–45. doi: 10.1002/ecj.10031. [DOI] [Google Scholar]
- Biniak S. Szymanski G. Siedlewski J. Swiatkowski A. Carbon. 1997;35:1799–1810. doi: 10.1016/S0008-6223(97)00096-1. [DOI] [Google Scholar]
- Jeffrey J. W., Methods in X-ray Crystallography, Academic Press, NY, 1971 [Google Scholar]
- Lyons K. M. Newcomb B. A. McDonald K. J. Chae H. G. Kumar S. J. Compos. Mater. 2015;49:2231–2240. doi: 10.1177/0021998314545184. [DOI] [Google Scholar]
- Vollebregt S. Ishihara R. Tichelaar F. D. Hou Y. Beenakker C. I. M. Carbon. 2012;50:3542–3554. doi: 10.1016/j.carbon.2012.03.026. [DOI] [Google Scholar]
- Tuinstra F. Koenig J. L. J. Chem. Phys. 1970;53:1126–1130. doi: 10.1063/1.1674108. [DOI] [Google Scholar]
- Li D. H. Lu C. X. Wu G. P. Yang Y. An F. Feng Z. H. RSC Adv. 2014;4:60648–60651. doi: 10.1039/C4RA08530B. [DOI] [Google Scholar]
- Ammar M. R. Galy N. Rouzaud J. N. Toulhoat N. Vaudey C. E. Simon P. Carbon. 2015;95:364–373. doi: 10.1016/j.carbon.2015.07.095. [DOI] [Google Scholar]
- Weisenberger M. Martin G. I. Vera A. J. Varela R. H. Merino C. Andrews R. Carbon. 2009;47:2211–2218. doi: 10.1016/j.carbon.2009.03.070. [DOI] [Google Scholar]
- Picher M. Navas H. Arenal R. Quesnel E. Anglaret E. Jourdain V. Carbon. 2012;50:2407–2416. doi: 10.1016/j.carbon.2012.01.055. [DOI] [Google Scholar]
- Ni Z. H. Yu T. Lu Y. H. Wang Y. Y. Feng Y. P. Shen Z. X. ACS Nano. 2008;2:2301–2305. doi: 10.1021/nn800459e. [DOI] [PubMed] [Google Scholar]
- Antunes E. F. Lobo A. O. Corat E. J. Trava A. V. J. Carbon. 2007;45:913–921. doi: 10.1016/j.carbon.2007.01.003. [DOI] [Google Scholar]
- Deldicque D. Rouzaud J. N. Velde B. Carbon. 2016;102:319–329. doi: 10.1016/j.carbon.2016.02.042. [DOI] [Google Scholar]
- Xiao H. Lu Y. G. Zhao W. Z. Qin X. Y. J. Mater. Sci. 2014;49:794–804. doi: 10.1007/s10853-013-7762-2. [DOI] [Google Scholar]
- Oberlin A. Carbon. 1984;22:521–541. doi: 10.1016/0008-6223(84)90086-1. [DOI] [Google Scholar]
- Feng T. T. Zhao Y. F. Shi J. Liu L. S. Li N. Xu Z. W. Zhao L. H. Tian X. Mai W. Li Y. L. RSC Adv. 2018;8:2373–2376. doi: 10.1039/C7RA11968B. [DOI] [PMC free article] [PubMed] [Google Scholar]
- Shan M. J. Wang H. B. Xu Z. W. Li N. Chen C. Shi J. Liu L. S. Kuang L. Y. Ma M. J. Zhang C. Anal. Methods. 2018;10:496–503. doi: 10.1039/C7AY02852K. [DOI] [Google Scholar]
- Sui X. H. Xu Z. W. Hu C. S. Chen L. Liu L. S. Kuang L. Y. Ma M. J. Zhao L. H. Li J. Deng H. Compos. Sci. Technol. 2016;130:46–52. doi: 10.1016/j.compscitech.2016.05.001. [DOI] [Google Scholar]


