

Abstract
Lymphatic filariasis and onchocerciasis are two common filarial diseases caused by a group of parasitic nematodes called filarial worms, which play host to the bacteria organism Wolbachia. One good treatment approach seeks Wolbachia as drug target. Here, a QSAR study was conducted to investigate the anti-wolbachia activities (pEC50) of 52 pyrazolopyrimidine analogues, while using the built model to predict the pEC50 values of the newly designed analogues. Density Functional Theory was used for the structural optimization, while the model building was based on Genetic Function Algorithm approach. The built QSAR model was validated thus: R2 = 0.8104, R2adj = 0.7629, Q2cv = 0.6981, R2test = 0.7501 and cRp2 = 0.7476. The predicted pEC50 of all newly designed compounds were higher than that of the template (43). The new compounds were; observed to pass the drug-likeness criteria, uniformly distributed to the brain, and found to be non-mutagenic. Also, the new compounds and the reference drug (doxycycline), were docked onto Ovarian Tumor (OTU) deubiquitinase receptor (PDB ID: 6W9O) using iGEMDOCK tool. This protein is known to help Wolbachia subvert host ubiquitin signaling. The resulting binding scores of the newly designed compounds except A5 were higher than that of doxycycline, while the protein–ligand interactions were majorly characterized by Hydrogen-bonding and hydrophobic interaction types. Therefore, the newly designed molecules could be developed as potential drug candidates for the treatment of lymphatic filariasis and onchocerciasis.
Keywords: Density functional theory, Filarial diseases, Molecular docking, Pharmacokinetics, QSAR, Wolbachia
Introduction
Neglected tropical diseases (NTDs) are a group of infectious diseases which are endemic in developing countries majorly tropics and sub-tropics. Unlike Human Immuno-deficiency Virus (HIV)/Acquired immuno-deficiency syndrome (AIDS), tuberculosis (TB) and malaria which are receiving greater treatment and research funding, NTDs are truly neglected (Wilsher 2011). According to the World Health Organization (WHO), ailments like human African trypanosomiasis, schistosomiasis, onchocerciasis (river blindness), lymphatic filariasis (elephantiasis), rabies, and buruli cancer are amongst many others classified as NTDs (Hotez et al. 2020). This study is focused on two common filarial diseases; Lymphatic filariasis and onchocerciasis. Lymphatic filariasis is caused by wuchereria bancrofti, Brugia malayi and Brugia timori, while onchocerca volvulus is the causative organism for onchocerciasis (Bakowski et al. 2019). Elephantiasis has been reported to cause over 2.8 million disabilities worldwide, whereas river blindness is the global second leading cause of blindness (Jacobs et al. 2019; Cooper and Nutman 2013). Both diseases were equally reported to further aggravate the health of those who are already down with life-threatening infections like HIV, TB or malaria (McGillan 2017). Elephantiasis is transmitted by a wide range of mosquitoes, while onchocerca volvulus is transmitted to its hosts by the blackflies (McGillan 2017).
One specific approach adopted generally over the years to reduce the impact of these filarial infections on the population, is the method of Mass Drug Administration (MDA) (Carter et al. 2020). Notable drugs administered through MDA programs over time include ivermectin, albendazole, and diethyl carbamazine, either as a dual (annual to bi-annual) or as triple-drug (once every 3 years) treatment (Jacobs et al. 2019; Carter et al. 2020). Unfortunately, the various drugs administered through MDA programs lack enough efficiency to eliminate the adult worms. It is therefore, important to identify new approaches to eliminate adult worms so as to effectively cut down the time frames for both diseases’ elimination (Jacobs et al. 2019; Lakshmi et al. 2010). Fortunately, these nematodes causing filarial diseases are said to endosymbiotically co-habit with a gram-negative bacterium called Wolbachia (Ugbe et al. 2021). Wolbachia is known to be widely distributed and infects a wide range of insects and nematodes species of the phylum arthropod (Kurz et al. 2008). Wolbachia pipientis is the strain which is common to nematodes causing filarial diseases (McGillan 2017). The nature of endosymbiotic relationship between Wolbachia and infected worm is unclear, it has however been reported that wolbachia is important during the embryonic development process in infected nematodes (Townson et al. 2000). It has also been suggested that wolbachia can synthesize detoxification enzymes such as catalase, while other reports suggested that the bacteria may play a significant role in nutrition for the host (Henkle-Duhrsen et al. 1998). In the search for new anti-filarial drugs, some researchers have chosen to target wolbachia, which past researches have shown that its elimination from the host filarial nematodes leads to antifilarial effects with the reduction of adult worm’s lifespan (McGillan 2017; Bouchery et al. 2013). A clinically relevant anti-bacteria drug, doxycycline (Reference drug in this study) has over the years been used for the treatment of lymphatic filariasis and onchocerciasis. However, the treatment method lacks the necessary efficiency to be administered through the MDA owing to its requirement for long treatment periods of about 4–6 weeks, contraindications in pregnancy and in children (McGillan 2017). Therefore, efforts in the development of novel wolbachia inhibitors with short treatment periods and reduced complications are important.
Computational tools play a major role in lead optimization phase of drug discovery (Sliwoski et al. 2014). It saves cost, time and tends to be more effective than the traditional methods (Lawal et al. 2021). The knowledge of Quantitative Structure Activity Relationship (QSAR) helps in establishing a relationship between various molecular structures of molecules and their experimental activities (Adeniji et al. 2019). Molecular docking simulation is a computer aided virtual screening method which probes the binding of ligands in the active sites of the protein target using a valid docking tool (Ibrahim et al. 2020). Pharmacokinetics analysis is important in the pre-clinical study of new drug compounds in order to ascertain how such drug compounds affect the living organism when administered. Some of the most important pharmacokinetics properties to be determined during pre-clinical testing include Absorption, Distribution, Metabolism, Excretion, and Toxicity (ADMET) (Lawal et al. 2021; Ibrahim et al. 2021). Physico-chemical properties such as molecular weight, Topological Polar Surface Area (TPSA), lipophilicity, water solubility, hydrogen bond donors, and hydrogen bond acceptors are necessary to predict drug’s likelihood of being orally bioavailable (Lipinski et al. 2001). The choices of molecules for oral bioavailability have been guided by several rules such as the Lipinski’s ‘rule of 5’ (RO5), Veber rule, Ghose rule, Egan, and Muegge etc. (Sun et al. 2020).
Ubiquitination play a critical role in the regulation of many cellular processes in living cells especially eukaryotes (Bailey-Elkin et al. 2014). Manipulating host ubiquitin signaling is becoming an increasing occurrence amongst bacterial and viral pathogens including Wolbachia. This is possible because most pathogens encode deubiquitinases, which helps them to subvert host signalling (Schubert et al. 2020). Therefore, the bacteria viability within the host environment may be heavily affected by inactivation of deubiquitinases. Some deubiquitinases have been reported to belong to the Ovarian Tumor (OTU) family (Bailey-Elkin et al. 2014). In this study therefore, Crystal structure of an OTU deubiquitinase from Wolbachia pipientis wMel (PDB: 6W9O) was used as the therapeutic protein receptor for docking with the newly designed compounds of pyrazolopyrimidine class. The structure of OTU deubiquitinase used in this study was predicted by the method of X-ray diffraction and expressed in Escherichia coli (Schubert et al. 2020).
Many Pyrazolopyrimidine compounds have been reported as having a variety of different biological activities such as anti-tuberculosis, anti-malarial, and antiviral agents, anti-depressants and inhibitors of kinase (Asati et al. 2021; McGillan et al. 2021). However, most of the drugs belonging to this class marketed to date are said to produce hypnotic and/or anxiolytic effects. In order to exploit the anti-filarial effect of the pyrazolopyrimidine class therefore, McGillan et al. (2017) synthesized a series of 52 pyrazolopyrimidine analogues and reported their biological activities against Wolbachia (wAlbB) infected insect cells (Aedes albopictus, C6/36). The purpose of this study is to: develop a QSAR model capable of predicting the activities of some pyrazolopyrimidine derivatives as potent anti-wolbachia agents; carry out a theoretical design of new pyrazolopyrimidine derivatives as anti-wolbachia agents based on the established QSAR theoretical model, while subjecting same to pharmacokinetics and molecular docking studies in order to evaluate their drug-likeness properties and binding interaction pattern respectively.
Materials and methods
Data collection
McGillan in his Ph.D. thesis (2017) reported the synthesis of several small molecules anti-wolbachia agents of the pyrazolopyrimidine class, as part of the Anti-Wolbachia drug discovery and development programme towards identifying alternate drugs for the treatment of filarial diseases. Their biological activities were tested against Wolbachia (wAlbB) infected insect cells (Aedes albopictus, C6/36) and reported in nanomolar. Consequently, a dataset of 52 pyrazolopyrimidine analogues with relatively better half-maximal effective concentration (EC50) values were extracted and used for this theoretical study. The bioactivities (EC50) were converted from nanomolar (nM) to logarithmic scale (pEC50) using Eq. (1) (Wang et al. 2020). Figure 1 shows the structural template of pyrazolopyrimidine, while the molecular structures of the various pyrazolopyrimidine derivatives and their observed EC50 and pEC50 values are shown in Table 1.
| 1 |
Fig. 1.

Pyrazolopyrimidine structural template
Table 1.
Molecular structures and anti-wolbachia activities of pyrazolopyrimidine derivatives
| Comp ID | R1 | R2 | R3 | R4 | R5 | EC50 (nM) | pEC50 |
|---|---|---|---|---|---|---|---|
| 1 | H |
|
Phenyl | Isopropyl | H | 647 | 6.1891 |
| 2 | H | Pyridin-2-ylmethyl | Phenyl | Tert-butyl | H | 1854 | 5.7319 |
| 3 | H | Benzyl | Phenyl | Methyl | H | 3012 | 5.5211 |
| 4 | H | 2-chlorobenzyl | Phenyl | Methyl | H | 5176 | 5.2860 |
| 5 | H |
|
Phenyl | Methyl | H | 1384 | 5.8589 |
| 6 | H | Pyridin-2-ylmethyl | Phenyl | Methyl | H | 145 | 6.8386 |
| 7 | H |

|
Phenyl | Methyl | Methyl | 90 | 7.0458 |
| 8 | H |
|
4-fluorophenyl | Methyl | Methyl | 93 | 7.0315 |
| 9 | H | Pyrimidin-2-ylmethyl | 4-fluorophenyl | Methyl | Methyl | 33 | 7.4815 |
| 10 | H | Pyrazin-2-ylmethyl | 4-fluorophenyl | Methyl | Methyl | 183 | 6.7375 |
| 11 | H | Pyrimidin-4-ylmethyl | 4-fluorophenyl | Methyl | Methyl | 518 | 6.2857 |
| 12 | H |
|
4-fluorophenyl | Methyl | Methyl | 456 | 6.3410 |
| 13 | methyl | Pyridin-2-ylmethyl | 4-fluorophenyl | Methyl | Methyl | 2500 | 5.6021 |
| 14 | H | Pyridin-2-ylmethyl | 4-fluorophenyl | Fused cyclopentane at positions 5 and 6 | 93 | 7.0315 | |
| 15 | H | Pyridin-2-ylmethyl | 4-fluorophenyl | Methyl | Chloro | 51 | 7.2924 |
| 16 | H | Pyridin-2-ylmethyl | 4-fluorophenyl | Methyl | 2,2,2-trifluoroethyl | 15 | 7.8239 |
| 17 | H | Pyridin-2-ylmethyl | 4-chlorophenyl | Methyl | H | 674 | 6.1713 |
| 18 | H | Pyridin-2-ylmethyl |
|
Methyl | Methyl | 664 | 6.1778 |
| 19 | H | Pyridin-2-ylmethyl |
|
Methyl | Methyl | 143 | 6.8446 |
| 20 | H | Pyridin-2-ylmethyl | Benzonitrile | Methyl | Methyl | 664 | 6.1778 |
| 21 | H | Pyridin-2-ylmethyl | 4-chlorophenyl | Methyl | Methyl | 84 | 7.0757 |
| 22 | H | Pyridin-2-ylmethyl | o-tolyl | Methyl | Methyl | 102 | 6.9914 |
| 23 | H | Pyridin-2-ylmethyl | methylbenzoate | methyl | methyl | 179 | 6.7471 |
| 24 | H | Pyridin-2-ylmethyl |
|
Methyl | Methyl | 175 | 6.7570 |
| 25 | H | Pyridin-2-ylmethyl |
|
Methyl | Methyl | 131 | 6.8827 |
| 26 | H | Pyridin-2-ylmethyl |

|
Methyl | Methyl | 1479 | 5.8300 |
| 27 | H | Pyridin-2-ylmethyl |
|
Methyl | Methyl | 119 | 6.9245 |
| 28 | H | Pyridin-2-ylmethyl |
|
Methyl | Methyl | 43 | 7.3665 |
| 29 | H | Pyridin-2-ylmethyl |
|
Methyl | Methyl | 680 | 6.1674 |
| 30 | H | Pyridin-2-ylmethyl |
|
Methyl | Methyl | 844 | 6.0737 |
| 31 | H | Pyridin-2-ylmethyl |
|
Methyl | Methyl | 1228 | 5.9108 |
| 32 | H | Pyridin-2-ylmethyl | H | Methyl | Methyl | 105 | 6.9788 |
| 33 | H | Pyridin-2-ylmethyl | Bromo | Methyl | Methyl | 176 | 6.7544 |
| 34 | H | Pyridin-2-ylmethyl | Chloro | Methyl | Methyl | 122 | 6.9136 |
| 35 | H | Pyridin-2-ylmethyl | Fluoro | Methyl | Methyl | 164 | 6.7851 |
| 36 | H | Pyridin-2-ylmethyl | Difluoromethoxy | Methyl | Methyl | 251 | 6.6003 |
| 37 | H | Pyridin-2-ylmethyl | Fluoromethoxy | Methyl | Methyl | 629 | 6.2013 |
| 38 | H | Pyridin-2-ylmethyl | Chloro | Methyl | Chloro | 311 | 6.5072 |
| 39 | H | Pyridin-2-ylmethyl |
|
Methyl | Methyl | 52 | 7.2840 |
| 40 | H | Pyridin-2-ylmethyl | Tetrahydro-2H-pyran-4-yl | Methyl | Chloro | 73 | 7.1367 |
| 41 | H | Pyridin-2-ylmethyl |
|
Methyl | Chloro | 561 | 6.2510 |
| 42 | H | Pyridin-2-ylmethyl |
|
Methyl | Chloro | 38 | 7.4202 |
| 43 | H | Pyridin-2-ylmethyl |
|
Methyl | Chloro | 16 | 7.7959 |
| 44 | H | Pyridin-2-ylmethyl |
|
Methyl | Chloro | 1183 | 5.9270 |
| 45 | H | Pyridin-2-ylmethyl | Chloro | H | Methyl | 201 | 6.6968 |
| 46 | H | Pyridin-2-ylmethyl | 4-fluorophenyl | H | Methyl | 38 | 7.4202 |
| 47 | H | Pyridin-2-ylmethyl |

|
H | Methyl | 293 | 6.5331 |
| 48 | H | Pyridin-2-ylmethyl |

|
H | Methyl | 32 | 7.4948 |
| 49 | H |

|
|
H | Methyl | 14 | 7.8539 |
| 50 | H |
|
|
H | Methyl | 23 | 7.6383 |
| 51 | H |
|

|
H | Methyl | 34 | 7.4685 |
| 52 | H | Pyridin-2-ylmethyl |

|
H | Methyl | 49 | 7.3098 |
Molecular geometry optimization
The two-dimensional (2-D) structures of the various compounds were drawn using the ChemDraw Ultra (version 12.0.2), saved as MDL mol file format and then fed separately into the Spartan 14 software (version 1.1.4) in three-dimensional (3-D) structural form. The 3-D structures were first optimized geometrically by energy minimization. Thereafter, Molecular Mechanics Force Field (MMFF) was used to minimize their chemical structures in order to remove tension energy of the molecules’ conformation. Further optimization was then conducted using Density Functional Theory (DFT) with Becke’s three-parameter read-Yang-Parr hybrid (B3LYP) option and utilizing the 6-31G basis set. The thoroughly optimized structures were then saved in SD file format for use in descriptor calculation (Wang et al. 2020; Li et al. 2004).
Molecular descriptor calculation
The resulting data in SD file format obtained earlier from the optimization process were imported into the Pharmaceutical Data Exploration Laboratory (PaDEL)-descriptor software (version 2.20) to calculate the molecular descriptors for all fifty two (52) pyrazolopyrimidine derivatives (Lawal et al. 2021).
Data-set pretreatment and splitting into training and test sets
The pretreatment of the generated descriptor pool was carried out using the Drug Theoretical and Cheminformatics Laboratory (DTC Lab) based software GUI 1.2 so as to remove descriptors which were not informative (Adeniji et al. 2020). The pretreated data were then divided into the modeling train set data and external evaluation test set data in the ratio of 70:30 respectively, with the help of DTC Lab derived software which utilizes the Kennard Stone method for data set division (Kennard and Stone 1969). The splitting of data set into training and test sets was based on the closeness of the representative points of the test set to the representative points of the training set in the multidimensional descriptor space (Ugbe et al. 2021).
MLR-GFA model building
The Genetic Function Approximation (GFA) as a statistical technique in the Material Studio software (version 8.0) was used to generate the models based on Multi-Linear Regression (MLR) approach. GFA was used to obtain the optimum descriptor combinations constituting the QSAR models, while MLR helps to establish the relationship between the biological activities, pEC50 (dependent variable) and the molecular descriptors (independent variables) (Arthur et al. 2020). The Multi-linear regression equation assumes the following form (Eq. 2) (Adawara et al. 2020):
| 2 |
where Y represents the dependent variable; ‘k’s and ‘x’s represent respectively regression coefficients and independent variables; ‘C’ equals intercept or regression constant.
Assessment of model quality (internal validation)
Internal validation assessment of the built models was carried out on Material studio by GFA approach using the Friedman formula, correlation coefficient (R2) and cross validation coefficient (Q2cv). Determination of the Friedman Lack-Of-Fit (LOF) allows for the best fitness score to be obtained. LOF is defined as follows (Eq. 3):
| 3 |
where: SEE is the Standard Error of Estimation (SEE), with low values indicating high quality model. SEE is defined thus (Eq. 4):
| 4 |
c represents number of terms in the model, d is a user-defined smoothing parameter, p is total number of descriptors in the model while M equals the number of data in the training set (Adeniji et al., 2018).
Another important parameter, the correlation coefficient (R2) measures the degree of fitness of the regression equation. R2 value closer to 1 is an indicative of high quality model.
R2 is a commonly used internal validation parameter and is expressed thus (Eq. 5):
| 5 |
where: Ῡtraining, Yexp, and Ypred equal respectively, the mean pEC50, experimental activity and the predicted activity in the training set.
R2 is usually adjusted in order to afford the model stability and reliability because it directly varies with increase in number of descriptors. The adjusted R2 is defined thus:
| 6 |
where: p is the number of descriptors in the model, and n equals the number of compounds in the training set.
Another important parameter is the leave-one-out (LOO) cross-validation regression coefficient (Q2cv), which determines the ability of a built QSAR model to predict the activity of new compounds. A high value of Q2cv indicates a high internal predictive power and a good robustness of the QSAR model. Q2cv is defined as follows (Eq. 7):
| 7 |
Yexp and Ypred represent the experimental activity and predicted activity in the training set respectively. Ῡ training equals the average pEC50 in the training set.
Assessment of model quality (external validation)
The model’s predictive power was assessed externally to show if the model could predict the activity values of the test set compounds. The predictive strength of the model depends on the value of the predicted R2 (R2 test) defined thus (Eq. 8) (Isyaku et al. 2020):
| 8 |
Ypredtest = predicted activity of test set, Yexptest = experimental activity of test set, Ῡtraining = mean value of experimental activity of the training set.
Furthermore, the data was subjected to the Golbraikh and Tropsha acceptable model criteria using the MLRplusValidation tool (version 1.3) as follows (Roy et al. 2013; Edache et al. 2020).
(Threshold value < 0.3).
(Threshold value < 0.1).
k′ (threshold value 0.85 ≤ k ≤ 1.15).
where: r2 = square correlation coefficients of the plot of experimental activity versus predicted activity values. ro2 = square correlation coefficients of the plot of experimental activity versus predicted activity values at zero intercept. r′o2 = square correlation coefficients of the plot of predicted activity versus experimental activity at zero intercept. k′ = slope of the plot of predicted activity against experimental activity at zero intercept.
Y-randomization test
The Robustness of the built QSAR model was assessed by Y-randomization technique in which MLR models are generated by randomly shuffling the dependent variable while keeping the independent variables constant (Adawara et al. 2020). This is for a confirmation that the QSAR model built is strong and not created by chance. A low R2 and Q2 values for several iteration indicates a good applicability of the built model. The coefficient of determination () is defined as follows (Eq. 9):
| 9 |
where: = Y-randomization coefficient, R = correlation coefficient for Y-Randomization, Rr = average ‘R’ of random models. value greater than 0.50 is a requirement for the model to pass Y-randomization test.
Statistical analysis of the descriptors
Mean effect (ME)
The mean effect (ME) value shows the relative contribution of each descriptor in a model, defined as (Eq. 10):
| 10 |
where: βj is the coefficient of the descriptor j in the model, Dj is the value of each descriptor in the data matrix for each molecule in the training set, m is the number of the descriptor that appears in the model, n is the number of molecules in the training set (Abdullahi et al. 2019).
Variance inflation factor (VIF)
The degree of multi-co-linearity or correspondence between the descriptors is measured by the Variance Inflation Factor (VIF), usually defined as (Eq. 11):
| 11 |
where: R2 is the correlation coefficient of the multiple regression between the variables within the model. VIF value of 1 indicates no inter-correlation exists for each variable, for VIF in the range of 1–5, the related model is acceptable; and if VIF is greater than 10, the related model is unstable and unacceptable (Abdullahi et al. 2019).
Evaluation of the model applicability domain
Evaluating the applicability domain (AD) of a QSAR model is important to ascertain the reliability and robustness of the built QSAR model. AD provides one the chance to estimate the uncertainty in the prediction of compounds based on their similarity with the training set compounds, used in the model building (Tropsha et al. 2003). The leverage approach was used to describe the AD of the developed model. The leverage (h) of a particular chemical compound is defined thus (Eq. 12):
| 12 |
where: X = m × k descriptor matrix of the training set compound, XT = transpose matrix of X.
The warning leverage (h*) which is the range of values used to check for influential molecule or outlier is defined below (Eq. 13):
| 13 |
where: m = number of training set compounds, j = number of descriptors in the model.
A plot of the standardized residuals against leverages otherwise called the William’s plot was used to evaluate the significant area in the model’s chemical space. As a rule, compounds which fall within this area on the plot are the approved predicted compounds (Adeniji et al. 2020; Veerasamy et al. 2011).
Ligand based drug design
The ligand based drug design approach was adopted in designing Six (6) new pyrazolopyrimidine analogues basically by deletion, substitution and insertion of substituent(s) into the template structure (43) based on the information provided by the molecular descriptors (Majorly GATS2v, GATS6s, ATSC4e and GATS8s) (Adeniji et al. 2020). The newly designed compounds and reference drug used in this study (doxycycline) were prepared in four steps as earlier reported under ‘molecular geometry optimization’ section; drawing of chemical structures, energy minimization, minimization by MMFF, and optimization by DFT approach.
Prediction of pharmacokinetic properties
Pharmacokinetics properties prediction constitute an absolutely necessary stage in drug discovery’s early phase because only molecules with good drug-likeness properties and excellent ADMET profiles advance into the pre-clinical research phase (Lawal et al. 2021). Hence, Two (2) pyrazolopyrimidine derivatives (16 and 43) with better inhibitory activities and lower residual values alongside the newly designed compounds (A1–A6) were investigated for their drug-likeness and ADMET properties using the online web servers; http://www.swissadme.ch/index.php and http://biosig.unimelb.edu.au/pkcsm respectively. The Lipinski’s rule of five (RO5) is a widely used criterion for oral bioavailability. Hence, the tested compounds would be assessed for oral bioavailability using the RO5 criteria (Lipinski et al. 2001).
Molecular docking study
The newly designed compounds and the reference drug (doxycycline) were docked onto the receptor (OTU deubiquitinase)’s binding pocket using the iGEMDOCK software, while using Biovia Discovery Studio Visualizer to analyze the resulting protein–ligand interaction profiles (Ibrahim et al. 2021; Kumar et al. 2016).
Results and discussion
QSAR study
A theoretical study (QSAR) was conducted on fifty two (52) pyrazolopyrimidine derivatives, in order to establish a quantitative relationship between their structures and their anti-wolbachia activities. The built models were subjected to both internal and external validation tests, in which model 3 (Eq. 14) best satisfied the requirement for a good QSAR model. Table 2 described the various descriptors used in the model, while the experimental and predicted activity values together with their residual values for pyrazolopyrimidine derivatives were presented in Table 3. Also, the predicted activity values were plotted against those of experimental activity for both training and test sets and presented in Fig. 2. A further plot of standardized residual against experimental activities was obtained and presented in Fig. 3. In order to ascertain the stability, robustness, reliability and predictive power of the built QSAR model, internal and external validation tests were conducted, and the results presented in Table 4.
Table 2.
Selected descriptors used in the QSAR model
| S/no | Descriptor symbol | Description | Class |
|---|---|---|---|
| 1 | ATSC4e | Centred Broto-Moreau autocorrelation of lag 4 weighted by Sanderson electronegativity | 2D |
| 2 | AATSC4s | Average centered Broto-Moreau autocorrelation—lag 4/weighted by I-state | 2D |
| 3 | GATS2v | Geary autocorrelation—lag2/weighted by van der waals volume | 2D |
| 4 | GATS8e | Geary autocorrelation of lag 8 weighted by Sanderson electronegativity | 2D |
| 5 | GATS6s | Geary autocorrelation of lag 6 weighted by I-state | 2D |
| 6 | nsSeH | Count of atom-type E-State | 2D |
| 7 | SssSnH2 | Sum of atom-type E-State | 2D |
Table 3.
Experimental, predicted and residual values of pyrazolopyrimidine derivatives
| Compound ID | Exp. pEC50 | Pred. pEC50 | Residuals |
|---|---|---|---|
| 1 | 6.189096 | 6.475834 | − 0.28674 |
| 2 | 5.73189 | 5.751861 | − 0.01997 |
| 3 | 5.521145 | 5.551556 | − 0.03041 |
| *4 | 5.286006 | 5.419773 | − 0.13377 |
| 5 | 5.858864 | 5.603058 | 0.255806 |
| *6 | 6.838632 | 6.452273 | 0.386359 |
| *7 | 7.045757 | 6.526182 | 0.519576 |
| *8 | 7.031517 | 6.618447 | 0.41307 |
| *9 | 7.481486 | 6.98818 | 0.493306 |
| 10 | 6.737549 | 6.939861 | − 0.20231 |
| 11 | 6.28567 | 6.527686 | − 0.24202 |
| 12 | 6.341035 | 6.075156 | 0.265879 |
| 13 | 5.60206 | 5.855867 | − 0.25381 |
| 14 | 7.031517 | 7.368888 | − 0.33737 |
| 15 | 7.29243 | 6.795143 | 0.497287 |
| 16 | 7.823909 | 7.953198 | − 0.12929 |
| 17 | 6.17134 | 6.463977 | − 0.29264 |
| 18 | 6.177832 | 6.233958 | − 0.05613 |
| 19 | 6.844664 | 6.388609 | 0.45606 |
| 20 | 6.177832 | 6.342709 | − 0.16488 |
| 21 | 7.075721 | 6.765542 | 0.310179 |
| 22 | 6.9914 | 6.664351 | 0.327049 |
| *23 | 6.747147 | 6.191564 | 0.555583 |
| 24 | 6.756962 | 6.979128 | − 0.22217 |
| *25 | 6.882729 | 7.061255 | − 0.17853 |
| 26 | 5.830032 | 5.933092 | − 0.10306 |
| *27 | 6.924453 | 6.055529 | 0.868924 |
| 28 | 7.366532 | 6.817488 | 0.549044 |
| 29 | 6.167491 | 6.400326 | − 0.23283 |
| 30 | 6.073658 | 6.288886 | − 0.21523 |
| *31 | 5.910802 | 5.980347 | − 0.06955 |
| 32 | 6.978811 | 7.056629 | − 0.07782 |
| 33 | 6.754487 | 6.4994 | 0.255087 |
| *34 | 6.91364 | 6.585139 | 0.328501 |
| 35 | 6.785156 | 7.247238 | − 0.46208 |
| 36 | 6.600326 | 6.799095 | − 0.19877 |
| *37 | 6.201349 | 6.589389 | − 0.38804 |
| 38 | 6.50724 | 6.487985 | 0.019255 |
| 39 | 7.283997 | 7.00048 | 0.283517 |
| 40 | 7.136677 | 6.998007 | 0.13867 |
| 41 | 6.251037 | 6.644402 | − 0.39336 |
| *42 | 7.420216 | 7.105898 | 0.314319 |
| 43 | 7.79588 | 7.55812 | 0.23776 |
| 44 | 5.927015 | 5.932727 | − 0.00571 |
| 45 | 6.696804 | 6.588648 | 0.108156 |
| 46 | 7.420216 | 7.251703 | 0.168513 |
| 47 | 6.533132 | 6.667723 | − 0.13459 |
| 48 | 7.49485 | 7.305925 | 0.188925 |
| *49 | 7.853872 | 7.278034 | 0.575837 |
| *50 | 7.638272 | 7.278034 | 0.360238 |
| *51 | 7.468521 | 7.278034 | 0.190487 |
| *52 | 7.309804 | 6.722164 | 0.58764 |
Key: *-test set compound, EC50- half-maximal effective concentration
Fig. 2.

Plot of predicted pEC50 against Experimental pEC50 for training and test sets
Fig. 3.
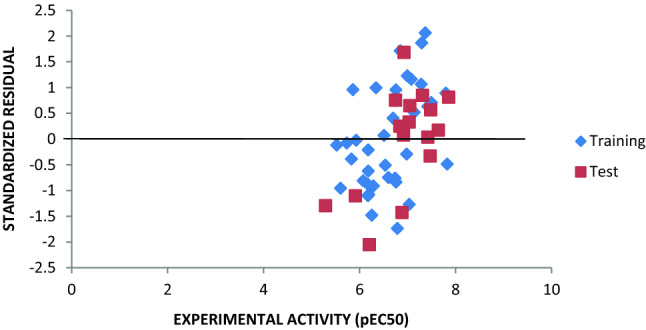
Plot of standardized residual against experimental pEC50 for training and test sets
Table 4.
Validated parameters of the QSAR model
| Validation parameters | Model | QSAR validation standard |
|---|---|---|
| Training set | ||
| Friedman LOF | 0.4123 | – |
| R-squared (R2) | 0.8104 | ≥ 0.6 |
| Adjusted R-squared () | 0.7629 | – |
| Cross validated R-squared () | 0.6981 | ≥ 0.5 |
| R2—Q2cv | 0.1123 | ≤ 0.3 |
| Significant Regression | YES | – |
| Significance-of-regression F-value | 17.0924 | – |
| Critical SOR F-value (95%) | 2.3672 | – |
| Replicate points | 0 | – |
| Computed experimental error | 0.0000 | – |
| Lack-of-fit points | 28 | – |
| Min expt. error for non-significant LOF (95%) | 0.2447 | – |
| Test set | ||
|---|---|---|
| R-squared () i.e. | 0.7501 | ≥ 0.6 |
| Number of test set compounds (Ntest set) | 16 | ≥ 5 |
| 0.10742 | < 0.3 | |
| 0.00123 | < 0.1 | |
| k | 1.04568 | 0.85 < k < 1.15 |
A combined GFA and MLR approaches led to the selection of seven (7) descriptors, and generation of four (4) QSAR models respectively. Model 3 (Eq. 14) was found to best satisfied the requirement for a reliable QSAR model. The low residual values between the experimental and predicted activities as shown in Table 3 imply that the model has a high predictive strength. The R2 values of 0.8104 and 0.750 for training set and test set respectively as obtained from Fig. 2 compare perfectly well with those obtained from GFA (0.8104 and 0.7501) and MLRplusValidation analysis (0.8104 and 0.7501) as reported in Table 4. The grouping together of points along the line of best fit in Fig. 2 shows that the experimental and predicted activity values are well correlated, indicating that the built model is reliable and robust. The random spread of standardized residuals on both sides of zero in Fig. 3 is an indication that the built model is free of any systematic error.
| 14 |
Additionally, Pearson’s correlation statistical analyses were performed on the values of all seven descriptors in the built QSAR Model and the results were reported in Table 5. Another significant validation test is the Y- Randomization test, which was also performed and the result presented in Table 6. The low correlation coefficients (less than 0.50) which exist between each descriptor in the built model (Table 5) indicate no inter-correlation between each descriptor. The Variance Inflation Factor (VIF) for all 7 descriptors has values ranging from 1 – 5, an indication of the stability and acceptability of the built model (Table 5). The absolute t-statistics of each descriptor is greater than 2, showing that the selected descriptors were good (Adeniji et al. 2018). Also, Table 5 shows that the evaluated p values at 95% confidence level for all descriptor were less than 0.05. This means that the alternative hypothesis which posits that there is a relationship between inhibitory activities and the descriptors holds. Additionally, the values of the Mean Effect (ME) reported in Table 5 provide vital information on the effect and degree of each descriptor’s contributions in the model. The magnitudes and signs of ME values signify their respective strength and direction on the molecules’ inhibitory activities. All the descriptors except nsSeH have positive ME, indicating that increasing or decreasing their values will lead to a corresponding increase or decrease in the anti-proliferative activities respectively. Increasing the values of nsSeH on the other hand will lead to a decrease in the anti-wolbachia activities. GATS2V with the highest ME value has the greatest influence on the molecules’ inhibitory activities. GATS2v which is the Geary autocorrelation—lag 2/weighted by van der Waals volumes, which has a positive ME is suggested to contribute positively to anti-wolbachia activity. It measures the strength of the relationship between van der Waals volumes of two atoms in a molecule that are two bond apart (Adawara et al. 2020).
Table 5.
Pearson’s correlation and statistical analyses of descriptors used in the QSAR model
| Inter-correlation | |||||||
|---|---|---|---|---|---|---|---|
| ATSC4e | AATSC4s | GATS2v | GATS8e | GATS6s | nsSeH | SssSnH2 | |
| ATSC4e | 1 | ||||||
| AATSC4s | 0.525345 | 1 | |||||
| GATS2v | 0.307996 | 0.028935 | 1 | ||||
| GATS8e | 0.478104 | 0.241975 | − 0.12161 | 1 | |||
| GATS6s | 0.62834 | 0.558828 | 0.260268 | 0.258477 | 1 | ||
| nsSeH | − 0.13871 | 0.184628 | − 0.43041 | − 0.03379 | 0.147126 | 1 | |
| SssSnH2 | 0.039192 | 0.270547 | − 0.04425 | 0.106862 | 0.24912 | 0.310204 | 1 |
| Statistical parameters | |||||||
|---|---|---|---|---|---|---|---|
| VIF | 2.630942 | 1.737761 | 1.631929 | 1.496797 | 2.174509 | 1.558148 | 1.229976 |
| ME | 0.138695 | 0.035656 | 0.518466 | 0.115025 | 0.15305 | − 0.05164 | 0.090747 |
| Coefficients | − 1.0679 | − 4.3793 | 4.035879 | 0.922556 | 1.10925 | − 0.09788 | 0.69691 |
| Std. Error | 0.181153 | 1.285964 | 1.23684 | 0.274962 | 0.268721 | 0.028934 | 0.127429 |
| t Stat | − 5.8953 | − 3.40544 | 3.263056 | 3.355218 | 4.127868 | − 3.38294 | 5.468995 |
| p-value | 2.40E−06 | 0.002014 | 0.002901 | 0.002292 | 0.000298 | 0.002134 | 7.71E−06 |
Table 6.
Y-Randomization test parameters
| Model | R | R2 | Q2 |
|---|---|---|---|
| Original | 0.900199 | 0.810358 | 0.698051 |
| Random 1 | 0.218226 | 0.047622 | − 0.58138 |
| Random 2 | 0.410592 | 0.168586 | − 0.39194 |
| Random 3 | 0.292327 | 0.085455 | − 0.66299 |
| Random 4 | 0.307793 | 0.094737 | − 0.54198 |
| Random 5 | 0.322781 | 0.104187 | − 0.41129 |
| Random 6 | 0.471172 | 0.222003 | − 0.41909 |
| Random 7 | 0.358435 | 0.128476 | − 0.36971 |
| Random 8 | 0.38892 | 0.151258 | − 0.41459 |
| Random 9 | 0.278492 | 0.077558 | − 0.72302 |
| Random 10 | 0.423864 | 0.179661 | − 0.58126 |
| Random models parameters | |||
| Average r | 0.34726 | ||
| Average r2 | 0.125954 | ||
| Average Q2 | − 0.50973 | ||
| cRp2 | 0.747636 | ||
The low values of R2 and Q2 obtained from the random reshuffling (Table 6) inferred that the built model is stable, robust and reliable. The value of coefficient for Y-randomization, cR2p (0.747636) greater than 0.50, supports the claim that the built model is powerful and not inferred by chance.
The scatter plot of the standardized residuals versus the leverages (William’s Plot) obtained to ascertain the model’s applicability domain is as shown in Fig. 4. The William’s plot clearly shows that all the compounds falls within the square area ± 3 of standardized cross-validated residual. It can therefore be inferred that no outlier is present in the data set. However, eight compounds (2, 3, 4, 5, 7, 9, 23 and 42) were found with leverage values greater than the calculated warning leverage (h* = 0.67), and are said to be influential molecules.
Fig. 4.

The plot of standardized residuals against the leverage values (William’s plot)
Consequently, compounds 16 and 43 with relatively higher predicted inhibitory activities of 7.953 and 7.558 respectively (Table 3), having also contained within the model’s applicability domain space (Fig. 4), were subjected to drug-likeness test for possible selection as lead molecule for designing new prominent analogues.
Ligand-based drug design
The molecular structure of the lead compound (43) and the structural template are presented in Fig. 5A, B, while predicted activities of the newly designed compounds are presented in Table 7.
Fig. 5.

A Molecular structures of the lead compound B Structural template for the ligand-based design
Table 7.
Predicted pEC50 of the newly designed pyrazolopyrimidine compounds
| Compound ID | Molecular structure | Predicted pEC50 |
|---|---|---|
| Template (43) |
|
7.5581 |
| A1 |

|
8.1887 |
| A2 |
|
7.7178 |
| A3 |
|
7.7894 |
| A4 |
|
8.9601 |
| A5 |

|
7.9997 |
| A6 |
|
8.0403 |
One of the objectives of the ligand-based design is to be able to design new molecules with better inhibitory activities than their template molecule. Here, the predicted pEC50 values of the designed compounds were higher than that of the template molecule (43) in the order: A4 (8.9601) > A1 > A6 > A5 > A3 > A2 > 43 (7.5581) as shown in Table 7. It therefore affirmed that the various structural modifications of the template structure were based on the information provided by the molecular descriptors in the built QSAR model.
Pharmacokinetics properties prediction
Results of the pharmacokinetics investigation conducted on 16, 43 and the six (6) newly designed compounds were presented in Table 8, 9, while Fig. 6a, b shows the oral bioavailability radar of 16 and 43.
Table 8.
Predicted drug-likeness properties of selected and newly designed compounds
| Comp ID | MW (g/mol) | TPSA (Å2) | MLOGP | Log S (ESOL) | HBD | HBA | RO5 | PAINS | Brenk | SA |
|---|---|---|---|---|---|---|---|---|---|---|
| 16 | 415.39 | 55.11 | 3.88 | − 5.44 | 1 | 7 | 0 | 0 | 0 | 3.27 |
| 43 | 378.81 | 58.35 | 2.67 | − 4.28 | 1 | 5 | 0 | 0 | 0 | 3.07 |
| A1 | 360.36 | 78.58 | 1.64 | − 3.54 | 2 | 6 | 0 | 0 | 0 | 3.11 |
| A2 | 359.38 | 84.37 | 1.64 | − 3.33 | 2 | 5 | 0 | 0 | 0 | 3.10 |
| A3 | 426.39 | 58.35 | 2.97 | − 4.85 | 1 | 8 | 0 | 0 | 0 | 3.32 |
| A4 | 430.35 | 58.35 | 3.12 | − 4.90 | 1 | 9 | 0 | 0 | 0 | 3.38 |
| A5 | 272.28 | 81.13 | 1.32 | − 2.46 | 2 | 4 | 0 | 0 | 0 | 2.73 |
| A6 | 334.30 | 58.12 | 2.08 | − 3.54 | 1 | 6 | 0 | 0 | 2 | 2.97 |
MW-molecular weight, TPSA-topological polar surface area, ESOL-estimated solubility, HBD-hydrogen bond donors, HBA-hydrogen bond acceptors, RO5-Lipinski rule of five violation, SA-synthetic accessibility score
Table 9.
Predicted ADMET properties of the newly designed compounds
| Comp ID | Absorption | Distribution | Metabolism | Excretion | Toxicity | ||||||
|---|---|---|---|---|---|---|---|---|---|---|---|
| HIA (%) | Skin LogKp | BBB LogBB | CNS LogPS | CYP34A | CYP2D6 | Total clearance | AMES | MRTD | |||
| S | I | S | I | ||||||||
| A1 | 95.466 | − 2.741 | − 0.902 | − 3.104 | NO | NO | NO | NO | 0.032 | NO | 0.105 |
| A2 | 95.798 | − 2.737 | − 0.854 | − 3.105 | NO | NO | NO | NO | − 0.006 | NO | 0.090 |
| A3 | 93.318 | − 2.908 | 0.142 | − 3.00 | YES | NO | NO | NO | − 0.015 | NO | − 0.344 |
| A4 | 92.762 | − 2.894 | 0.003 | − 3.049 | YES | NO | NO | NO | − 0.523 | NO | − 0.276 |
| A5 | 96.258 | − 2.782 | − 0.595 | − 3.069 | NO | NO | NO | NO | − 0.042 | NO | 0.145 |
| A6 | 95.801 | − 2.864 | 0.170 | − 3.063 | YES | NO | NO | NO | − 0.225 | NO | − 0.159 |
BBB blood brain barrier, CNS central nervous system, HIA human intestinal absorption, Skin skin permeability, LogBB logarithmic ratio of brain to plasma drug concentration, LogPS blood–brain permeability-surface area product, CYP34A cytochrome p450 isoform, CYP2D6 cytochrome p450 isoform, S substrate, I inhibitor, MRTD maximum recommended tolerated dose
Fig. 6.

A Oral bioavailability radar of 16; B Oral bioavailability radar of 43
The Lipinski’s rule for oral-bioavailability states that a drug molecule is more likely to have poor absorption or permeation when it has Hydrogen Bond Donors (HBD) of greater than 5, Hydrogen Bond Acceptors (HBA) > 10, Molecular Weight (MW) > 500, and lipophilicity (MLOGP > 4.15 or WLOGP > 5) (Lipinski et al. 2001). Molecules that satisfy at least three out of the four requirements are said to obey the Lipinski’s rule for oral-bioavailability (Lawal et al. 2021). As shown in Table 8, all tested molecules perfectly obeyed the Lipinski’s rule by showing no violation. Also, the reported values of Topological Polar Surface Area (TPSA) for all molecules are less than 140 Å2. Additionally, the synthetic accessibility scores of all tested molecules are in the easy portion (˂ 5.00), indicating easy laboratory synthesis. Notwithstanding the relatively higher inhibitory activity of compound 16, ligand 43 was the preferred lead molecule, because it possessed a more suitable physico-chemical properties for oral bioavailability as shown from the oral bioavailability radar in Fig. 5. The estimated water solubility (Log S) ranges from moderately soluble (16, 43, A3 and A4) to soluble (A1, A2, A5 and A6). All compounds showed no pains and brenk alerts except A6 which showed 2 structural alerts due to the presence of N – C – Halogen and 3-membered heterocycle moieties.
The predicted ADMET properties in Table 9 showed that, the Human Intestinal Absorption (HIA) was high (> 90%) for all newly designed compounds. Skin permeability is a significant consideration for the development of transdermal drug delivery. A skin permeability constant LogKp of greater than − 2.50 is an indication of low skin permeability. Consequently, all the newly designed compounds have LogKp of less than − 2.50, showing good skin penetration ability. Also, all the tested compounds are non-substrates of P-glycoprotein, an enzyme which acts as a biological barrier by extruding toxins and xenobiotics, including drugs out of cells, while A3 and A4 are inhibitors of both P-glycoprotein I and II, indicating that these molecules may easily mediate to reach their target sites with little or no resistance from P-glycoprotein. For a drug molecule to penetrate the Blood–Brain Barrier (BBB) and Central Nervous System (CNS), it is recommended that the logarithmic ratio of brain to plasma drug concentration (logBB) be greater than -1 and the blood–brain permeability-surface area product (logPS) be greater than -3 respectively. Consequently, all the newly designed compounds showed logBB of greater than − 1, an indication that these molecules cross the BBB. However, all the molecules showed very poor CNS permeability i.e. logPS ˂ − 3. Furthermore, Cytochrome P450 enzymes are important detoxification enzymes in the body which oxidize xenobiotics to facilitate their excretion. The two major isoforms responsible for drug metabolism, CYP-34A and CYP-2D6 were reported. Only A3, A4 and A6 are substrates of CYP-3A4. No substrates of CYP-2D6 and no inhibitors of CYP-34A and CYP-2D6. The degree of drug elimination from the body is measured by the drug’s total clearance, which is within the accepted range for these newly designed compounds. All molecules showed a negative AMES toxicity, indicating that they are non-mutagenic and cannot act as carcinogen. Additionally, the predicted values of Maximum Recommended Tolerated Dose (MRTD) for all molecules were included in Table 9. MRTD value of less than or equal to 0.477 log (mg/kg/day) is considered low, and high if greater than 0.477 log (mg/kg/day). The overall drug-likeness and ADMET properties showed good pharmacokinetic profiles for these molecules. Therefore, the newly designed molecules except A6 (with 2 structural alerts) could be considered as potential drug candidates for the treatment of lymphatic filariasis and onchocerciasis.
Molecular docking study
The 3D structures of the receptor and ligand A1 were presented in Fig. 7A, B; while results of the docking study conducted between the target receptor (OTU deubiquitinase) (Fig. 8), the newly designed compounds, and the reference drug doxycycline (Fig. 7) were presented in Table 10 and Figs. 9, 10, 11, 12, 13, 14, 15.
Fig. 7.

A 3D structure of prepared receptor (OTU deubiquitinase) B 3D structure of prepared ligand (A1)
Fig. 8.
Molecular structures of doxycycline
Table 10.
Predicted binding interaction profile of designed compounds with OTU deubiquitinase
| Comp. ID | Binding energy (kcal/mol) | Amino acid | Bond type | Interaction | Distance (Å) |
|---|---|---|---|---|---|
| A1 | − 87.32 | ASP-177 | Hydrogen bond | Conventional hydrogen bond | 2.55 |
| ASP-177 | Hydrogen bond | Conventional hydrogen bond | 2.77 | ||
| ASP-175 | Hydrogen bond | Conventional hydrogen bond | 3.30 | ||
| VAL-174 | Hydrogen bond | Conventional hydrogen bond | 2.68 | ||
| VAL-174 | Hydrogen bond | Conventional hydrogen bond | 3.10 | ||
| LYS-173 | Hydrogen bond | Carbon hydrogen bond | 3.30 | ||
| TYR-176 | Hydrogen bond | π-donor hydrogen bond | 2.86 | ||
| PRO-39 | Hydrophobic | alkyl | 4.69 | ||
| PRO-39 | Hydrophobic | Pi-alkyl | 4.33 | ||
| PRO-39 | Hydrophobic | Pi-alkyl | 5.11 | ||
| PRO-39 | Hydrophobic | Pi-alkyl | 5.45 | ||
| LYS-173 | Hydrophobic | Pi-alkyl | 4.76 | ||
| TYR-176 | Hydrophobic | Pi-pi T-shaped | 4.40 | ||
| TYR-176 | Hydrophobic | Pi-pi T-shaped | 4.49 | ||
| ASP-175 | Hydrophobic | Pi-anion | 4.27 | ||
| ASN-36 | Halogen | Fluorine | 3.69 | ||
| A2 | − 85.04 | ASP-125 | Hydrogen bond | Conventional hydrogen bond | 2.60 |
| ASP-127 | Hydrogen bond | Conventional hydrogen bond | 2.90 | ||
| GLU-145 | Hydrogen bond | Conventional hydrogen bond | 2.75 | ||
| LEU-190 | Hydrophobic | Alkyl | 4.17 | ||
| LEU-190 | Hydrophobic | Pi-alkyl | 5.26 | ||
| LEU-160 | Hydrophobic | Pi-alkyl | 5.44 | ||
| ASP-127 | Hydrophobic | Pi-anion | 3.27 | ||
| A3 | − 86.01 | VAL-174 | Hydrogen bond | Conventional hydrogen bond | 2.82 |
| VAL-174 | Hydrogen bond | Conventional hydrogen bond | 3.02 | ||
| ASP-177 | Hydrogen bond | Carbon hydrogen bond | 2.83 | ||
| TYR-176 | Hydrogen bond | Pi-donor hydrogen bond | 3.03 | ||
| PRO-37 | Halogen | Fluorine | 3.30 | ||
| HIS-157 | Halogen | Fluorine | 3.31 | ||
| PRO-39 | Hydrophobic | Pi-alkyl | 4.43 | ||
| PRO-39 | Hydrophobic | Pi-alkyl | 5.24 | ||
| ALA-168 | Hydrophobic | Pi-alkyl | 4.63 | ||
| LYS-173 | Hydrophobic | Pi-alkyl | 4.67 | ||
| VAL-174 | Hydrophobic | Pi-alkyl | 5.12 | ||
| TYR-176 | Hydrophobic | Alkyl | 5.44 | ||
| HIS-157 | Hydrophobic | Alkyl | 4.36 | ||
| TYR-176 | Hydrophobic | Pi-pi T-shaped | 4.46 | ||
| TYR-176 | Hydrophobic | Pi-pi T-shaped | 4.50 | ||
| A4 | − 84.87 | LEU-190 | Hydrogen bond | Conventional hydrogen bond | 2.82 |
| SER-121 | Hydrogen bond | Conventional hydrogen bond | 2.93 | ||
| TRP-123 | Hydrogen bond | Pi-donor | 2.86 | ||
| TRP-123 | Hydrophobic | Pi-pi stacked | 4.10 | ||
| TRP-123 | Hydrophobic | Pi-pi stacked | 5.13 | ||
| TRP-123 | Hydrophobic | Pi-pi stacked | 5.40 | ||
| TRP-123 | Hydrophobic | Pi-alkyl | 4.25 | ||
| TRP-123 | Hydrophobic | Pi-alkyl | 4.93 | ||
| ASP-116 | Halogen | Fluorine | 3.46 | ||
| LEU-190 | Hydrophobic | Alkyl | 4.63 | ||
| ARG-122 | Hydrophobic | Pi-alkyl | 4.78 | ||
| A5 | − 78.70 | GLN-60 | Hydrogen bond | Conventional hydrogen bond | 2.60 |
| GLN-60 | Hydrogen bond | Conventional hydrogen bond | 3.10 | ||
| GLU-208 | Hydrophobic | Pi-anion | 4.44 | ||
| ARG-59 | Hydrophobic | Pi-cation | 4.31 | ||
| LEU-196 | Hydrophobic | Pi-alkyl | 4.87 | ||
| A6 | − 85.73 | PHE-192 | Hydrogen bond | Conventional hydrogen bond | 2.74 |
| GLY-49 | Hydrogen bond | Conventional hydrogen bond | 2.95 | ||
| HIS-191 | Hydrogen bond | Carbon hydrogen bond | 2.28 | ||
| ILE-48 | Halogen | Fluorine | 3.61 | ||
| PHE-192 | Halogen | Fluorine | 2.67 | ||
| HIS-191 | Hydrophobic | Pi-alkyl | 5.00 | ||
| CYS-53 | Hydrophobic | Pi-alkyl | 4.42 | ||
| GLY-49 | Hydrophobic | Amide-pi stacked | 4.22 | ||
| ASN-50 | Hydrophobic | Van der Waals | – | ||
| Doxycycline | − 83.70 | THR-109 | Hydrogen bond | Conventional hydrogen bond | 3.23 |
| SER-121 | Hydrogen bond | Conventional hydrogen bond | 3.27 | ||
| ASP-116 | Hydrogen bond | Conventional hydrogen bond | 3.38 | ||
| ARG-122 | Hydrogen bond | Conventional hydrogen bond | 2.78 | ||
| ARG-122 | Hydrogen bond | Conventional hydrogen bond | 1.96 | ||
| TYR-113 | Hydrogen bond | Carbon hydrogen bond | 2.83 | ||
| ARG-122 | Hydrogen bond | Carbon hydrogen bond | 2.75 | ||
| ARG-122 | Hydrogen bond | Carbon hydrogen bond | 2.13 | ||
| ARG-122 | Hydrogen bond | Carbon hydrogen bond | 2.98 | ||
| ASP-116 | Hydrophobic | Pi-anion | 3.77 |
ALA alanine, ARG arginine, ASN asparagine, ASP aspartic acid, GLN glutamine, GLU glutamic acid, GLY glycine, HIS histidine, ILE isoleucine, LEU leucine, LYS lysine, PHE phenylalanine, PRO proline, SER serine, THR threonine, TRP tryptophan, TYR tyrosine, VAL valine
Fig. 9.

2-D and 3-D view of the interaction between OTU deubiquitinase and A1
Fig. 10.

2-D and 3-D view of the interaction between OTU deubiquitinase and A2
Fig. 11.

2-D and 3-D view of the interaction between OTU deubiquitinase and A3
Fig. 12.

2-Dand 3-D view of the interaction between OTU deubiquitinase and A4
Fig. 13.

2-D and 3-D view of the interaction between OTU deubiquitinase and A5
Fig. 14.

2-D and 3-D view of the interaction between OTU deubiquitinase and A6
Fig. 15.

2-D and 3-D view of the interaction between OTU deubiquitinase and Doxycycline
All tested molecules bind well into the target site cavity in the order; A1 (87.32 kcal/mol) > A3 > A6 > A2 > A4 > doxycycline > A5 (− 78.70 kcal/mol) as reported in Table 10 and Figs. 9, 10, 11, 12, 13, 14, 15, indicating that the newly designed compounds with the exception of A5 bind more strongly to the protein target (OTU deubiquitinase) than the reference drug doxycycline. As seen from Table 10 and Fig. 9–15, A1 was observed to have interacted well with the binding site of the OTU deubiquitinase receptor through five (5) conventional hydrogen bonds, one (1) carbon-hydrogen bond and one (1) π-donor hydrogen bond. The hydrophobic interactions include one (1) π -anion, four (4) π-alkyl, one (1) alkyl, two (2) π–π T-shaped, and one (1) halogen interactions. The hydroxyl group on the pyrimidine ring system formed 3 conventional hydrogen bonds; two with ASP-177 at distances of 2.55 Å and 2.77 Å, and one with ASP-175 at a distance of 3.30 Å. The Nitrogen atom of the pyrazole ring system and the linker Nitrogen between the pyrimidine and pyridine ring systems formed one conventional Hydrogen bond each with VAL-174 at distances of 3.10 Å and 2.68 Å respectively. Other hydrogen bond interactions are carbon hydrogen bond with LYS-173 at a distance of 3.30 Å and π-donor hydrogen bond with TYR-176 at a distance of 2.86 Å. Also observed was a halogen interaction between one of the fluoro groups on the pyrrolidine ring system and ASN-36 at a distance of 3.69 Å. Others are hydrophobic interactions with PRO-39 (alkyl and π-alkyl), LYS-173 (π-alky), TYR-176 (π–π T-shaped) and ASP-175 (π-anion).
In general, the various ligands were observed to make very close contacts with great number of amino acid residues including Hydrogen bonding and hydrophobic interactions, which are two very significant interaction types in drug-receptor binding as shown in Figs. 9, 10, 11, 12, 13, 14, 15. Unlike the newly designed compounds with a fair combination of both hydrogen bonding and hydrophobic interactions with the receptor, the interactions of doxycycline with the target protein were predominantly hydrogen bonding, and having only one hydrophobic interaction (pi-anion) with the aspartic acid group (ASP) at position 116 of the target receptor. Imberty et al. (1991) reported that hydrogen bond can be classified as strong or weak based on the distance between hydrogen donor and hydrogen acceptor (dis(D-A)) as follows; 2.5 Å ˂ dis(D-A) ˂ 3.1 Å (strong hydrogen bond) and 3.1 Å ˂ dis(D-A) ˂ 3.55 Å (weak hydrogen bond). Consequently, most of the Hydrogen bond distances of the new compounds with the receptor, indicate strong Hydrogen bond interactions with the respective amino acid residues, while doxycycline showed weak hydrogen bond interactions with threonine (THR) at position 109, serine (SER) at position 121 and ASP at position 116. This clearly indicates how well the newly designed compounds bind with OTU deubiquitinase, an essential protein for the survivability of bacteria Wolbachia.
Conclusions
In this study, four (4) QSAR models were developed with a series of fifty two (52) pyrazolopyrimidine derivatives as anti-wolbachia agents, amongst which Model 3 best satisfied the requirement for both internal and external validation tests. The model was used to excellently predict the anti-wolbachia activities of the various compounds, including the newly designed analogues. Compound 43 was selected as lead molecule ahead of compound 16 as a result of its relatively better drug-likeness properties. All the newly designed compounds showed good pharmacokinetic properties with no violation of the Lipinski’s RO5, are orally bio-available, and as well as skin permeable. The molecular docking results showed stronger binding affinities between OTU deubiquitinase receptor and all newly designed molecules than the chosen reference drug (doxycycline) with the exception of A5, an indicative of good protein–ligand binding interactions. Hence, these new molecules have demonstrated the potential to arrest Wolbachia OTU deubiquitinase, thereby cutting down chances of the bacteria survival, and which in turn affects the growth and viability of the filarial worms (causative agents for lymphatic filariasis and onchocerciasis). These new compounds could therefore be developed as potential drug candidates for the treatment of lymphatic filariasis and onchocerciasis. More so, laboratory tests (in vitro and in vivo) could be conducted to validate the computational results.
Acknowledgements
The authors sincerely acknowledge G.F.S. Harrison Quantum Chemistry Research Group, Ahmadu Bello University Zaria, for providing all software used in this study.
Abbreviations
- AD
Applicability domain
- ADMET
Absorption, distribution, metabolism, excretion, and toxicity
- AIDS
Acquired immuno-deficiency syndrome
- ALA
Alanine
- ARG
Arginine
- ASN
Asparagine
- ASP
Aspartic acid
- BBB
Blood brain barrier
- LogBB
Logarithmic ratio of brain to plasma drug concentration
- B3LYP
Becke’s three-parameter read-Yang-Parr hybrid
- DFT
Density functional theory
- DTC
Drug theoretical and cheminformatics
- EC50
Half-maximal effective concentration
- pEC50
Negative log of EC50
- ESOL
Estimated solubility
- LOF
Friedman lack-of-fit
- GFA
Genetic function approximation
- GLN
Glutamine
- GLU
Glutamic acid
- GLY
Glycine
- h*
Warning leverage
- HIA
Human intestinal absorption
- HIS
Histidine
- HIV
Human immuno-deficiency virus
- HBA
Hydrogen bond acceptor
- HBD
Hydrogen bond donor
- H-Bond
Hydrogen bond
- ILE
Isoleucine
- LEU
Leucine
- LYS
Lysine
- MDA
Mass Drug Administration
- MRTD
Maximum recommended tolerated dose
- ME
Mean Effect
- MLogP
Lipophilicity
- MMFF
Molecular mechanics force field
- MW
Molecular weight
- MLR
Multi-linear regression
- NTD
Neglected tropical diseases
- OUT
Ovarian tumor
- PaDEL
Pharmaceutical Data Exploration Laboratory
- PDB
Protein Data Bank
- PHE
Phenylalanine
- PRO
Proline
- LogPS
Blood–brain permeability-surface area product
- QSAR
Quantitative structure activity relationship
- RO5
Rule of five
- SER
Serine
- SEE
Standard error of estimation
- THR
Threonine
- TPSA
Topological polar surface area
- TB
Tuberculosis
- TRP
Tryptophan
- TYR
Tyrosine
- VAL
Valine
- VDW
Van der Waal interaction
- VIF
Variance inflation factor
- WHO
World Health Organization
Author contributions
GAS and AU conceived and designed the study. FAU carried out the study and drafted the manuscript. IA conducted the technical editing. All authors read and approved the final manuscript.
Funding
No funding was received for this study.
Availability of data and material
All data related to this study are included herein otherwise available on request.
Declarations
Conflict of interest
The authors declare that they have no competing interests.
Ethical approval and consent to participate.
Not applicable.
Consent for publication
Not applicable.
Footnotes
Publisher's Note
Springer Nature remains neutral with regard to jurisdictional claims in published maps and institutional affiliations.
References
- Abdullahi A, Shallangwa GA, Ibrahim MT, Bello AU, Arthur DE, Uzairu A, Mamza P. QSAR studies on some C14-urea tetrandrine compounds as potent anti-cancer agents against Leukemia cell line (K562) JOTCSA. 2019;5(3):1391–1402. [Google Scholar]
- Adawara SN, Shallangwa GA, Mamza PA, Ibrahim A. Molecular docking and QSAR theoretical model for prediction of phthalazinone derivatives as new class of potent dengue virus inhibitors. Beni-Suef Univ J Basic Appl Sci. 2020 doi: 10.1186/s43088-020-00073-9. [DOI] [Google Scholar]
- Adeniji SE, Uba S, Uzairu A. QSAR modeling and molecular docking analysis of some active compounds against mycobacterium tuberculosis receptor (Mtb CYP121) J Pathog Hindawi. 2018;2018:24–64. doi: 10.1155/2018/1018694. [DOI] [PMC free article] [PubMed] [Google Scholar]
- Adeniji SE, Uba S, Uzairu A. Activity modeling of some potent inhibitors against mycobacterium tuberculosis using genetic function approximation approach. Adıyaman Univ J Sci. 2019;9(1):77–98. [Google Scholar]
- Adeniji SE, Arthur DE, Abdullahi M, Abdullahi A, Ugbe FA. Computer-aided modeling of triazole analogues, docking studies of the compounds on DNA gyrase enzyme and design of new hypothetical compounds with efficient activities. J Biomol Struct Dyn. 2020 doi: 10.1080/07391102.2020.1852963. [DOI] [PubMed] [Google Scholar]
- Arthur DE, Uzairu A, Mamza P, Abechi SE, Shallangwa GA. Activity and toxicity modeling of some NCI selected compounds against leukemia P388ADR cell line using genetic algorithm-multiple linear regressions. J King Saud Univ Sci. 2020;32(1):324–331. doi: 10.1016/j.jksus.2018.05.023. [DOI] [Google Scholar]
- Asati V, Anant A, Patel P, Kaur K, Gupta GD. Pyrazolopyrimidines as anticancer agents: a review on structural and target-based approaches. Eur J Med Chem. 2021 doi: 10.1016/j.ejmech.2021.113781. [DOI] [PubMed] [Google Scholar]
- Bailey-Elkin BA, van Kasteren PB, Snijder EJ, Kikkert M, Mark BL. Viral OTU deubiquitinases: a structural and functional comparison. PLoS Pathog. 2014;10(3):e1003894. doi: 10.1371/journal.ppat.1003894. [DOI] [PMC free article] [PubMed] [Google Scholar]
- Bakowski MA, Shiroodi RK, Liu R, Olejniczak J, Yang B, Gagaring K, Guo H, White PM, Chappell L, Debec A, Landmann F, Dubben B, Lenz F, Struever D, Ehrens A, Frohberger SJ, Sjoberg H, Pionnier N, Murphy E, Archer J, Steven A, Chunda VC, Fombad FF, Chounna PW, Njouendou AJ, Metuge HM, Ndzeshang BL, Gandjui NV, Akumtoh DN, Kwenti TDB, Woods AK, Joseph SB, Hull MV, Xiong W, Kuhen KL, Taylor MJ, Wanji S, Turner JD, Hübner MP, Hoerauf A, Chatterjee AK, Roland J, Tremblay MS, Schultz PG, Sullivan W, Chu XJ, Petrassi HM, McNamara CW. Discovery of short-course antiwolbachial quinazolines for elimination of filarial worm infections. Sci Transl Med. 2019;11(491):87. doi: 10.1126/scitranslmed.aav3523. [DOI] [PubMed] [Google Scholar]
- Bouchery T, Lefoulon E, Karadjian G, Nieguitsila A, Martin C. The symbiotic role of wolbachia in onchocercidae and its impact on filariasis. Clin Microbiol Infect. 2013;19(2):131–140. doi: 10.1111/1469-0691.12069. [DOI] [PubMed] [Google Scholar]
- Carter DS, Jacobs RT, Freund Y, Berry P, Akama T, Easom EE, Lunde CS, Rock FL, Stefanakis R, McKerrow JH, Fischer C, Bulman C, Lim KC, Suzuki BM, Tricoche N, Sakanari J, Lustigman S, Plattner JJ. Macrofilaricidal benzimidazole-benzoxaborole hybrids as an approach to the treatment of river blindness, part 2: ketone linked analogs. ACS Infect Dis. 2020;6(2):180–185. doi: 10.1021/acsinfecdis.9b00397. [DOI] [PMC free article] [PubMed] [Google Scholar]
- Cooper PJ, Nutman TB. Onchocerciasis. In: Magill AJ, Hill DR, Solomon T, Ryan ET, editors. Hunter’s tropical medicine and emerging infectious disease. 9. London: WB Saunders; 2013. pp. 827–834. [Google Scholar]
- Edache EI, Samuel H, Sulyman YI, Arinze O, Ayine OI. QSAR and molecular docking analysis of substituted tetraketone and benzyl-benzoate analogs as anti-tyrosine: A novel approach to anti-tyrosine kinase drug design and discovery. Chem Res J. 2020;5(6):79–100. [Google Scholar]
- Henkle-Duhrsen K, Eckelt VH, Wildenburg G, Blaxter M, Walter RD. Gene structure, activity and localization of a catalase from intracellular bacteria in onchocerca volvulus. Mol Biochem Parasitol. 1998;96(1–2):69–81. doi: 10.1016/S0166-6851(98)00109-1. [DOI] [PubMed] [Google Scholar]
- Hotez PJ, Aksoy S, Brindley PJ, Kamhawi S. What constitutes a neglected tropical disease? PLoS Negl Trop Dis. 2020;14(1):e0008001. doi: 10.1371/journal.pntd.0008001. [DOI] [PMC free article] [PubMed] [Google Scholar]
- Ibrahim MT, Uzairu A, Shallangwa GA, Uba S. Lead identification of some anti-cancer agents with prominent activity against Non-small Cell Lung Cancer (NSCLC) and structure-based design. Chem Afr. 2020;3:1023–1044. doi: 10.1007/s42250-020-00191-y. [DOI] [Google Scholar]
- Ibrahim MT, Uzairu A, Uba S, Shallangwa GA. Design of more potent quinazoline derivatives as EGFRWT inhibitors for the treatment of NSCLC: a computational approach. J Pharm Sci. 2021;7:140. [Google Scholar]
- Imberty A, Hardman KD, Carver JP, Perez S. Molecular modeling of protein-carbohydrate interactions: docking of monosaccharides in the binding site of concanavalin A. Glycobiology. 1991;1(6):631–642. doi: 10.1093/glycob/1.6.631. [DOI] [PubMed] [Google Scholar]
- Isyaku Y, Uzairu A, Uba S, Ibrahim MT, Umar AB. QSAR, molecular docking, and design of novel 4-(N, N-diarylmethyl amines) Furan-2(5H)-one derivatives as insecticides against Aphis craccivora. Bull Natl Res Centre. 2020;44:44. doi: 10.1186/s42269-020-00297-w. [DOI] [Google Scholar]
- Jacobs RT, Lunde CS, Freund YR, Hernandez V, Li X, Xia Y, Carter DS, Berry PW, Halladay J, Rock F, Stefanakis R, Easom E, Plattner JJ, Ford L, Johnston KL, Cook DAN, Clare R, Cassidy A, Myhill L, Tyrer H, Gamble J, Guimaraes AF, Steven A, Lenz F, Ehrens A, Frohberger SJ, Koschel M, Hoerauf A, Hubner MP, McNamara CW, Bakowski MA, Turner JD, Taylor MJ, Ward SA. Boron-Pleuromutilins as anti-wolbachia agents with potential for treatment of onchocerciasis and lymphatic filariasis. J Med Chem. 2019;62:2521–2540. doi: 10.1021/acs.jmedchem.8b01854. [DOI] [PMC free article] [PubMed] [Google Scholar]
- Kennard RW, Stone LA. Computer aided design of experiments. Technometrics. 1969;11:137–148. doi: 10.1080/00401706.1969.10490666. [DOI] [Google Scholar]
- Kumar NA, Sharmila R, Akila K, Jaikumar B. In-silico approach for the assessment of oral cancer property on Limonia acidissima. IJPSR. 2016;7(3):1271–1275. [Google Scholar]
- Kurz M, Iturbe-Ormaetxe I, Jarrott R, Cowieson N, Robin G, Jones A, King GJ, Frei P, Glockshuber R, O’Neill SL, Heras B, Martin JL. Cloning, expression, purification and characterization of a DsbA-like protein from wolbachia pipientis. Protein Expr Purif. 2008;59(2):266–273. doi: 10.1016/j.pep.2008.02.008. [DOI] [PubMed] [Google Scholar]
- Lakshmi V, Joseph SK, Srivastava S, Verma SK, Sahoo MK, Dube V, Mishra SK, Murthy PK. Antifilarial activity in vitro and in vivo of some flavonoids tested against Brugia malayi. Acta Trop. 2010;116:127–133. doi: 10.1016/j.actatropica.2010.06.006. [DOI] [PubMed] [Google Scholar]
- Lawal HA, Uzairu A, Uba S, (2021) QSAR, molecular docking studies, ligand-based design and pharmacokinetic analysis on Maternal Embryonic Leucine Zipper Kinase (MELK) inhibitors as potential anti-triple-negative breast cancer (MDA-MB-231cell line) drug compounds. Bull Natl Res Centre 45(90)
- Li Z, Wan H, Shi Y, Ouyang P. Personal experience with four kinds of chemical structure drawing software: review on ChemDraw, ChemWindow, ISIS/Draw, and ChemSketch. J Chem Inf Comput Sci. 2004;44:1886–1890. doi: 10.1021/ci049794h. [DOI] [PubMed] [Google Scholar]
- Lipinski CA, Lombardo F, Dominy BW, Feeney PJ. Experimental and computational approaches to estimate solubility and permeability in drug discovery and development settings. Adv Drug Deliv Rev. 2001;46:3–26. doi: 10.1016/S0169-409X(00)00129-0. [DOI] [PubMed] [Google Scholar]
- McGillan P (2017) Development of small-molecule anti-wolbachia agents for the treatment of filariasis. PhD Thesis University of Liverpool. Retrieved from https://livrepository.liverpool.ac.uk/3016953
- McGillan P, Berry NG, Nixon L, Leung SC, Webborn PJH, Wenlock MC, Kavanagh S, Cassidy A, Clare RH, Cook DA, Johnston KL, Ford L, Ward SA, Taylor MJ, Hong WD, O’Neill PM. Development of pyrazolopyrimidine anti-wolbachia agents for the treatment of filariasis. ACS Med Chem Lett. 2021;12(9):1421–1426. doi: 10.1021/acsmedchemlett.1c00216. [DOI] [PMC free article] [PubMed] [Google Scholar]
- Roy K, Chakraborty P, Mitra I, Ojha PK, Kar S, Das RN. Some case studies on application of “rm2” metrics for judging quality of quantitative structure–activity relationship predictions: emphasis on scaling of response data. J Comput Chem. 2013;34(12):1071–1082. doi: 10.1002/jcc.23231. [DOI] [PubMed] [Google Scholar]
- Schubert AF, Nguyen JV, Franklin TG, Geurink PP, Roberts CG, Sanderson DJ, Miller LN, Ovaa H, Hofmann K, Pruneda JN, Komander D. Identification and characterization of diverse OUT deubiquitinases in bacteria. EMBO J. 2020;39:e105127. doi: 10.15252/embj.2020105127. [DOI] [PMC free article] [PubMed] [Google Scholar]
- Sliwoski G, Kothiwale S, Meiler J, Lowe EW. Computational methods in drug discovery. Pharmacol Rev. 2014;66:334–395. doi: 10.1124/pr.112.007336. [DOI] [PMC free article] [PubMed] [Google Scholar]
- Sun Y, Yang AW, Hung A, Lenon GB (2020) Screening for a potential therapeutic agent from the herbal formula in the 4th edition of the Chinese national guidelines for the initial-stage management of COVID-19 via molecular docking. Evid Based Complement Alternat Med 2020:3219840 [DOI] [PMC free article] [PubMed]
- Townson S, Hutton D, Siemienska J, Hollick L, Scanlon T, Tagboto SK, Taylor MJ. Antibiotics and wolbachia in filarial nematodes: antifilarial activity of rifampicin, oxytetracyline and chloramphenicol against onchocerca gutturosa, onchocerca lienalis and brugia pahangi. Ann Trop Med Parasitol. 2000;94(8):801–816. doi: 10.1080/00034983.2000.11813605. [DOI] [PubMed] [Google Scholar]
- Tropsha A, Gramatica P, Gombar VK. The importance of being earnest: validation is the absolute essential for successful application and interpretation of QSPR models. Mol Inform. 2003;22:69–77. [Google Scholar]
- Ugbe FA, Shallangwa GA, Uzairu A, Abdulkadir I. Activity modeling, molecular docking and pharmacokinetic studies of some boron-pleuromutilins as anti-wolbachia agents with potential for treatment of filarial diseases. Chem Data Collect. 2021;36:100783. doi: 10.1016/j.cdc.2021.100783. [DOI] [Google Scholar]
- Veerasamy R, Rajak H, Jain A, Sivadasan S, Varghese CP, Agrawal RK. Validation of QSAR models-strategies and importance. Int J Drug Des Discov. 2011;3:511–519. [Google Scholar]
- Wang X, Dong H, Qin Q. QSAR models on aminopyrazole-substituted resorcylate compounds as Hsp90 inhibitors. J Comput Sci Eng. 2020;48:1146–1156. [Google Scholar]
- Wilsher EJ (2011) The impact of neglected tropical diseases, and their associated stigma, on people's basic capabilities. Durham E-Theses Online. http://etheses.dur.ac.uk/3301/
Associated Data
This section collects any data citations, data availability statements, or supplementary materials included in this article.
Data Availability Statement
All data related to this study are included herein otherwise available on request.