Abstract
The most effective method to reduce chronic hepatitis B virus infection is the universal implementation of vaccination. The commercial aluminum-based vaccines need multiple-injection protocols for complete protection resulting in poor compliance in developing countries. It is necessary to develop single-shot vaccine formulations. In this study, novel antigen-loaded DDAB/PLA (didodecyldimethylammonium bromide/poly(lactic acid)) nanoparticles (NPs)-alginate composite microcapsules were developed as a single-shot vaccine. The hepatitis B surface antigen (HBsAg)-loaded DDAB/PLA NPs were successfully encapsulated into alginate microcapsules by a modified spray-solidification technique. The response surface method was applied to optimize the preparation parameters employing encapsulation efficiency of HBsAg and particle size of microcapsules as response variables. The antigen-loaded DDAB/PLA NPs-alginate composite microcapsules were prepared under these optimal conditions: the size of composite microcapsules was 24.25 μm, the Span value was 1.627, and the encapsulation efficiency of HBsAg was 68.4%. The obtained microcapsules were spherical gel microparticles with excellent dispersity and narrow size distributions. In vitro release profile indicated a slow release rate of encapsulated HBsAg especially in phosphate buffered saline solution. The microcapsules showed little toxicity in vivo. This vaccine delivery system could induce stronger immune responses by a single shot, which exhibited much higher cytokine secretion levels closely related to cellular immunity and comparable IgG titers to the traditional aluminum-adjuvanted vaccine with three shots.
The most effective method to reduce chronic hepatitis B virus infection is the universal implementation of vaccination.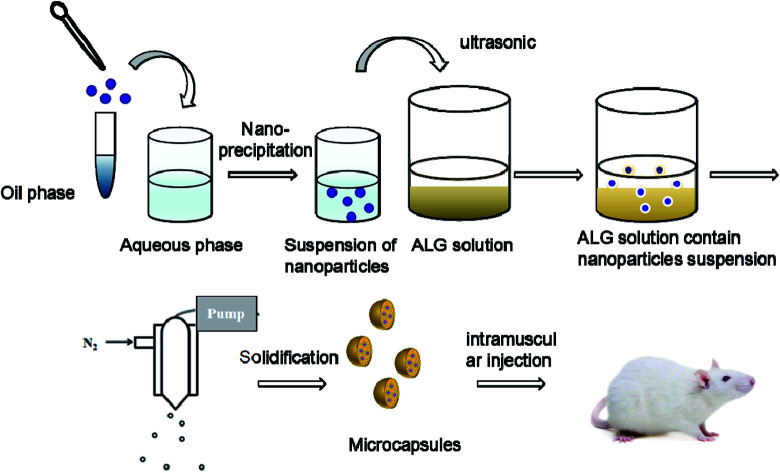
1. Introduction
It is estimated that there are 240 million chronic hepatitis B virus (HBV) carriers worldwide and more than half a million people die from HBV-related disease every year. So far, the most effective method to reduce this phenomenon is the universal implementation of vaccination.1 Currently, aluminum salts are used as adjuvants of HBV vaccine. Although aluminum-based vaccines show function as “antigen depot” at the injection site, they require three injections, which are conducted in the 0th, 1st and 6th month respectively, to elicit effective immune protection.2–4 In addition, aluminum-based vaccines also have disadvantages including side effects and safety concerns.5–8 However, due to the lack of permanent clinics and healthcare professionals, many adolescents in developing countries are in poor compliance with the multi-injections protocol, which further leads to the risk of HBV infection. Therefore, it is necessary to develop single-shot vaccine formulations to address this problem.
The concept of single-shot vaccines dates back nearly 40 years.9 The development of single-shot vaccines has experienced three stages. In the first stage, lots of work focused on the integrity of antigens which were dispersed throughout a polymer matrix and released with polymer biodegradation.10,11 After that, the development of single-shot vaccines entered into the era of microparticle-based delivery systems, which simulated multiple vaccinations by regulating antigen release behavior. For example, antigen-loaded PLGA (poly(lactic-co-glycolic acid)) microspheres exhibited an initial burst followed by slow release through 30 days, then continuous release until 100 days.12 Similar to PLGA microspheres, PLA microspheres also exhibited an initial burst followed by continuous release for 120 days.13 In addition, some researches in this field have focused on developing injectable devices that release antigen over one year. As such, a microneedle materials technique was developed as controlled-release antigen depots, providing efficacy of protection after 14 months.14,15 And injectable silicone implants were tested to deliver vaccines in a single shot.16 Overall, the single-shot vaccine study mainly focused on regulating antigen release by carrier materials.
However, these vaccine formulations have some shortcomings. First, organic solvents were employed during vaccine fabrication, which would lead to antigen denaturation and raise safety concerns in vivo. Second, the free antigen released from vaccine formulations was difficult to be efficiently taken up by antigen presenting cells, which would not result in strong or ideal immune response in vivo. Until now, single-shot vaccines with ideal immune response have not been achieved.
In a previous study of our research group, we compared the magnitude of immune responses elicited by vaccination with different particulate systems such as PLA and PLGA microparticles. We found that the microparticle material with the most hydrophobic chemistry, PLA, promoted the most efficient antigen internalization into dendritic cells (DCs), the highest surface MHC II and CD86 expression on DCs in vitro, and the highest cytokine secretion levels by splenocytes in vivo.17 Therefore, we choose PLA to fabricate antigen-loading nanoparticles in order to induce a strong immune response.
In this study, a novel composite microcapsule system was proposed. In this system, the free antigen and antigen-loaded DDAB/PLA nanoparticles were co-encapsulated into alginate microcapsules. The antigen loading and encapsulating process was carried out in the aqueous phase, which was greatly favorable for antigen activity retention. In addition, the antigen-loaded nanoparticles could well regulate antigen release profiles. Furthermore, the nanoparticles could improve antigen uptake by antigen presenting cells, which would promote immune response in vivo. For the initial immunization, there is burst release acting as primary immunization – the free antigen. This is followed by a slow release of the platform, in which the free antigen and antigen-loaded nanoparticles continuously release simulating the secondary immunization. In the last rapid-release period, the antigen-loaded nanoparticles were released until the microcapsules collapsed and simulation of the third immunization. The DDAB/PLA nanoparticles not only carried the antigen, but also regulated the antigen release profile.18 Furthermore, the antigen-loaded nanoparticles could convert soluble antigens into particulate antigens, and improve antigen uptake by antigen-presenting cells such as DCs,19,20 which further enhances the immune response especially the cellular immunity that plays an important role in virus infection. The successful fabrication of a single-shot vaccine formulation is essential for evaluation of immune response. The DDAB/PLA nanoparticles with positive surface charge were employed to load an antigen, HBsAg, by electrostatic interaction.19 Then, the antigen solution and antigen-loaded nanoparticle suspension were dispersed into alginate solution, which was further sprayed into calcium chloride solution for microcapsule solidification.21 The response surface method22,23 was applied to optimize the preparation parameters employing encapsulation efficiency of HBsAg and particle size of microcapsules as response variables. After successful fabrication of the single-shot vaccine formulation, the immune response in vivo was evaluated using conventional aluminum-based vaccine with three administrations as control.
2. Materials and methods
2.1. Mice, reagents, and materials
Female Balb/c mice were purchased from Vital River Laboratories (Beijing, China). All animal procedures were performed in accordance with the Guidelines for Care and Use of Laboratory Animals of Chinese Academy of Sciences and approved by the Animal Ethics Committee of Beijing. Poly(lactic acid) (PLA, M = 10 kDa, pH = 6.0) was bought from Institute of Medical Devices (Shandong, China) and didodecyldimethylammonium bromide (DDAB, AR) was supplied by Sigma-Aldrich (USA), which were used for the nanoparticle preparation. Ethanol (M = 46.07 g mol−1, purity ≥ 99.7%) and acetone (M = 58.08 g mol−1, purity ≥ 99.5%) were obtained from Chemical Plant of Beijing (China). Calcium chloride (AR) and glacial acetic acid (AR) were bought from Chemical Reagent Company of Beijing (China). Hepatitis B surface antigen (HBsAg) and aluminum adjuvant were supplied as gifts by Hualan Biological Engineering, Inc. (Henan, China). Sodium alginate (M = 198.11) was a product of Acros Organics (USA). NaH2PO4 and Na2HPO4 were purchased from Chemical Plant of Beijing (China). FITC was bought from Sigma-Aldrich (USA). Nile Red was purchased from FANBO Biochemicals (China). Roswell Park Memorial Institute (RPMI) 1640 medium and fetal bovine serum were purchased from Gibco (Grand Island, NY, USA). All mouse cytokines ELISA were from eBioscience (San Diego, CA, USA). CCK-8 assay kit was purchased from Dojindo (Japan). Micro-BCA assay kit was supplied by Thermo Fisher Scientific Inc. (USA). Deionized water was produced by Hangzhou Huibang water purification equipment (HB-RO/40, China) in our laboratory.
2.2. Apparatus
RT10 magnetic stirrer (IKA Company, Germany) and SB25-12DTD ultrasonic cleaner (Ningbo Xinzhi Biotechnology Co. Ltd, China) were employed for the fabrication of nanoparticles and microcapsules. Zetasizer Nano ZS dynamic light scattering particle size analyzer (Malvern Instruments Company, England) was used for analyzing the nanoparticle size and for the size distribution measurements. MasterSizer 2000 laser diffraction particle size analyzer (Malvern Instruments Company, England) was applied for the evaluation of microcapsule size and size distributions. ABJ 220-4M analytical balance (KERN Balance Company, Germany) was used to weigh materials of PLA, DDAB, alginate and so on. JSM-6700F scanning electron microscope (SEM, JEOL Co., Japan) was employed for morphology observation of nanoparticles and microcapsules. Leica TCS SP 5 laser scanning confocal microscope (LSCM, Leica Co., Germany) was used for measuring the location of fluorescence labeled antigen and nanoparticles in microcapsules. Ht-7700 transmission electron microscope (TEM, Hitachi Co., Japan) was used to observe the antigen-loaded nanoparticle distribution in microcapsules. Cryogenic freeze dryer (Dura-Dry™ MP, USA) was applied for lyophilization of nanoparticles and microcapsules. The security in vivo was evaluated by automatic biochemical analyzer (Toshiba (TBA-40), Japan). Infinite M200 microplate spectrophotometer was used to evaluate the level of HBsAg-specific IgG, cytokine, and splenocyte proliferation (Tecan, Männedorf, Switzerland).
2.3. Encapsulating HBsAg-Loaded DDAB/PLA nanoparticles into alginate microcapsules
The DDAB/PLA nanoparticles were prepared by a modified nanoprecipitation method (ESI†). Lyophilized DDAB/PLA NPs (4 mg) were redispersed into 1 mL PBS (pH 6.5) under ultrasonication. Then 1 mL HBsAg solution (120 μg mL−1) was added into the NP suspension and vertically mixed at 25 °C for 2–5 h.
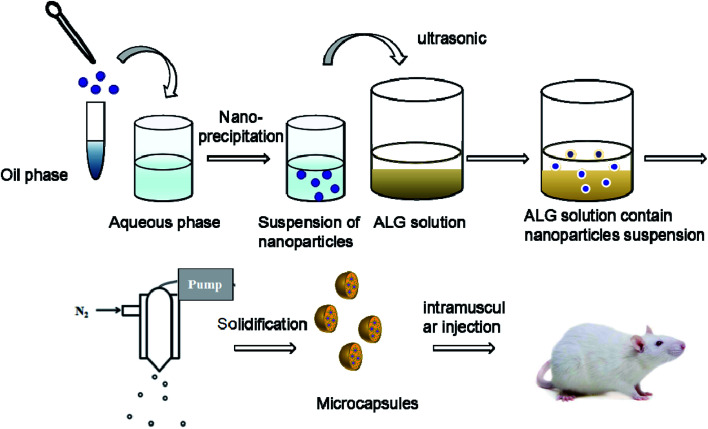
The HBsAg-loaded DDAB/PLA NPs were further encapsulated into alginate microcapsules using the process of spray-solidification as shown in Fig. 1.19 The HBsAg-loaded DDAB/PLA NP suspensions (4 mL) were dispersed into 1.5 wt% alginate solution (16 mL), and they were mixed under ultrasound for 15 min. Then, the suspension was transferred into a tank and sprayed into solidifying solutions of CaCl2 by an injection device equipped with a peristaltic pump with a rate of 3% and 0.7 mm diameter nozzle under gas pressure of 0.75 bar (Fig. 1). The obtained alginate microcapsules encapsulating HBsAg-loaded DDAB/PLA NPs were washed with deionized water three times.
Fig. 1. Preparation process of DDAB/PLA-ALG composite microcapsule system.
2.4. Response surface methodology (RSM) experiment
According to the results of single-factor experiment (Fig. S1 in ESI†), we found that there were three factors having a significant influence on the preparation of alginate microcapsules encapsulating HBsAg-loaded DDAB/PLA NPs. Therefore, RSM was used to design experiments for optimizing the preparation parameters of alginate microcapsules containing HBsAg-loaded DDAB/PLA NPs. A 3n factorial Box–Behnken model was used as an experimental design model to investigate the process parameters. The Box–Behnken model was conducted in software of Design-Expert® (version 8.0.6).
2.5. Characterization of NPs and microcapsules
The morphologies of DDAB/PLA NPs and alginate microcapsules were observed by field emission SEM. The size and size distributions of the DDAB/PLA NPs were measured using a laser particle analyzer, and alginate microcapsules were measured using a MasterSizer 2000 laser diffraction particle size analyzer. In order to determine whether the HBsAg-loaded DDAB/PLA NPs were successfully encapsulated into alginate microcapsules, we observed the internal structure of microcapsules by TEM and LSCM.
2.6. In vitro release study
The release study was carried out in PBS (pH 7.4, 0.01 mol L−1) with exactly 5 mg alginate microcapsules placed in Eppendorf tubes containing 1.5 mL release medium. The specimens were incubated at 37 °C (70 rpm). At pre-determined (days 0.5, 1, 2, 5, 7, 10, 15, 21, 28, 35) time intervals, the specimens were centrifuged at 10000g for 10 min. Supernatant (1 mL) was taken out and fresh solution (1 mL) was added. The HBsAg concentrations were determined with a BCA assay kit.
2.7. Immunization studies
24 mice were divided into 4 groups (labelled A, B, C and D) (Table 2 in ESI†). Groups A–C were intramuscularly immunized with 400 μL (200 μL/hind leg) of PBS, PBS plus HBsAg and aluminum plus HBsAg containing 2 μg antigen (HBsAg) on days 0, 14, and 28. Group D were intramuscularly immunized with 400 μL (200 μL/hind leg) of microcapsules containing 6 μg antigen (HBsAg) on the 0th day. On days 21, 28, and 35 post-injection, serum was collected from the ophthalmic venous plexus of mice. The antibody levels were determined by an indirect ELISA method. Mice were sacrificed and the spleens were collected for in vitro proliferation and cytokine response on day 35.
ANOVA for response surface reduced quadratic model.
| Source | Sum of squares | df | Mean square | F-value | P-value Prob > F | Significance |
|---|---|---|---|---|---|---|
| Model | 2518.86 | 9 | 279.87 | 18.29 | 0.0005 | Significant |
| A | 1871.04 | 1 | 1871.04 | 122.28 | 0.0001 | |
| B | 422.46 | 1 | 422.46 | 27.61 | 0.0012 | |
| C | 0.061 | 1 | 0.061 | 3.980 × 10⁻³ | 0.9515 | |
| AB | 110.90 | 1 | 110.90 | 7.25 | 0.0310 | |
| AC | 1.96 | 1 | 1.96 | 0.13 | 0.7309 | |
| BC | 9.86 | 1 | 9.86 | 0.64 | 0.4485 | |
| A 2 | 98.77 | 1 | 98.77 | 6.46 | 0.0386 | |
| B 2 | 0.097 | 1 | 0.097 | 6.349 × 10⁻³ | 0.9387 | |
| C 2 | 1.41 | 1 | 1.41 | 0.092 | 0.7701 | |
| Residual | 107.11 | 7 | 15.30 | |||
| Lack of fit | 47.15 | 3 | 15.72 | 1.05 | 0.4627 | Not significant |
| Pure error | 59.96 | 4 | 14.99 | |||
| Cor total | 2625.97 | 16 |
2.8. Security evaluation
The security in vivo was evaluated with an automatic biochemical analyzer. The index system of security evaluation including alanine aminotransferase (ALT), blood urea nitrogen (BUN), lactate dehydrogenase (LDH), aspartate aminotransferase (AST) and alkaline phosphatase (ALP) were measured according to the protocol.
The cytotoxicity and biosafety of DDAB/PLA nanoparticles was also evaluated in vitro. BMDC (bone marrow derived dendritic cells) were co-cultured with various concentrations DDAB/PLA nanoparticles and their viability was tested using CCK-8. The BMDC (1.0 × 10⁵ cells per well) were seeded into 96-well plates in 100 μL of growth medium. After 24 h incubation with serial dilutions of PLGA particles, the plates were added with CCK-8 reagent (10 μL per well) and further incubated for another 4 h. Absorbance was measured at 450 nm (with 620 nm as reference), and the results were calculated as the ratio of the OD450 values of wells containing particle-stimulated cells with those containing only cells with medium, which were performed in triplicate.
2.9. Antigen uptake by BMDC and activation of BMDC in vitro
BMDCs were cultured from bone marrow cells using an established protocol.24 FITC-labeled HBsAg was employed for confocal imaging of antigen uptake by DCs. DCs were plated onto a poly(d-lysine)-coated Petri dish for 1 h, and the non-adherent cells were removed. Ag, Al–Ag or DDAB/PLA-Ag was co-cultured with DCs in the Petri dish for 24 hours. Then, the cells were washed three times in PBS (10 mM, pH 7.4). Cells were fixed with 3.7% paraformaldehyde, and cell membranes were stained with Alexa Fluor 635 Phalloidin (Invitrogen, USA) at 37 °C for 30 min. Images of the corresponding fluorescent cells were obtained using a Leica TCS SP5 confocal laser scanning microscope (CLSM).
Immature BMDCs were stimulated with Ag, Al–Ag or DDAB/PLA-Ag for a specified time and labeled with fluorochrome-labeled antibodies diluted with flow cytometry staining buffer against CD40 and CD86. CD40 and CD86 expression on BMDCs was measured by cytometry.
2.10. Determination of HBsAg-Specific IgG by indirect ELISA
The determination was conducted according to enzyme-linked immunosorbent assay (ELISA) in accordance with a protocol described previously.25 Serum was collected from blood after clotting at room temperature and centrifugation. 96-well ELISA plates (Costar, Corning, New York, USA) were coated overnight at 4 °C with 5 μg HBsAg per well in coating buffer (50 mM CBS, pH 9.6). After washing three times with PBS 0.05% Tween 20 (v/v), the plates were blocked with 1% (w/v) BSA in PBS for 90 min at 37 °C. Thereafter, the plates were washed three times with PBST, and the concentration of antigen-specific IgG, IgG1 and IgG2a in sera was monitored using a 2-fold dilution series beginning at an initial 100-fold dilution (PBST containing 0.1% (w/v) BSA). Plates were then washed 6 times and HRP-conjugated anti-mouse antibody (Sigma-Aldrich, St Louis, MO, USA) was then added into each well at a 1 : 7500 dilution and incubated at 37 °C for 40 min. Plates were washed six times and 200 μL of 3,3′,5,5′-tetramethylbenzidine (TMB) substrate was added to each well and incubated in the dark for 20 min. The enzymatic reaction was stopped by adding 50 μL of 2 M H2SO4 to each well. The OD450 values were read using an Infinite M200 microplate spectrophotometer. Titers were calculated by the reciprocal sample dilution corresponding to OD two rimes higher than the negative sera.
2.11. Splenocyte proliferation assay
Antigen-specific splenocyte proliferation was evaluated by CCK-8 kits (Dojindo, Japan) according to the manufacturer's instructions. Splenocytes (5.0 × 10⁶ cells per mL), stimulated with HBsAg (5 μg mL−1) or not, were seeded in triplicate (40 μL per well) in a 96-well plate and incubated at 37 °C in a humid atmosphere with 5% CO2. After 48 h, 20 μL of CCK-8 solution (Dojindo, Japan) was added into each well, and the plates were incubated for an additional 4 h. The cell proliferation was determined by CCK-8 kit, and the reagent of WST-8 (2-(2,4-nitrophenylmethoxy)-3-(4-nitrophenyl)-5-(2,4-disulfonic acid benzene)-2H-tetrazolium monosodium salt) could be reduced into water-soluble yellow formazan product (formazan dye) by dehydrogenase in cells under electronic carrier of 1-methoxy-5-methylphenazine dimethyl sulfate (1-methoxy PMS), which was in direct proportion to the number of living cells. Formazan product absorbed at 450 nm, and the absorbance at 450 nm (with 620 nm as reference) was measured by an Infinite M200 microplate spectrophotometer. The results were expressed as the proliferation index (PI) calculated based on the formula: PI = OD (450 nm) for stimulated cultures/OD (450 nm) for non-stimulated cultures.
2.12. Determination of cytokine by ELISA
Splenocytes were harvested from vaccinated mice on day 35 after primary immunization and re-stimulated with HBsAg (5 μg mL−1) for 60 h at 37 °C in a humid atmosphere with 5% CO2, and the supernatant was collected. TNF-α, IFN-γ, IL-2 and granzyme B levels were measured by ready-to-use Sandwich ELISA kits according to the protocol.
2.13. Statistical analysis
GraphPad Prism 5.0 software (San Diego, CA, USA) was used for statistical analysis. Significant differences were calculated by Tukey's multiple comparison.
3. Results
3.1. Optimizing the preparation conditions of microcapsules encapsulating HBsAg-Loaded DDAB/PLA NPs
In this part, the encapsulation efficiency of HBsAg and particle size of microcapsules were employed as response variables, and three factors, liquid flow rate, gas flow rate, and the mass ratio of ALG to NPs, were selected for optimizing the preparation parameters.
3.1.1. HBsAg encapsulation efficiency as a function of gas flow rate, liquid flow rate, and the mass ratio of ALG to NPs
One of the important parameters for microcapsule vaccine formulations is the antigen encapsulation efficiency. The RSM was applied for optimizing preparation parameters, and antigen encapsulation efficiency was employed as response variable. The results are shown in Table 1. The model F-value of 10.24 indicated the model was significant and there was only a 0.29% chance that the F-value became large and occurred due to noise. The ratio of “Adeq Precision” is 10.905 indicating that it was an adequate signal (Table S3 in ESI†). Therefore, the model could be used for predicting optimal preparation parameters, which was expressed as eqn (1):
| Y = 68.12–17.11A + 2.74B + 3.98C − 1.05AB + 5.17AC − 4.38BC − 14.09A2 + 0.21B2 + 5.96C2 | 1 |
ANOVA for response surface reduced quadratic model.
| Source | Sum of squares | df | Mean square | F-value | P-value Prob > F | Significance |
|---|---|---|---|---|---|---|
| Model | 3744.41 | 9 | 416.05 | 10.24 | 0.0029 | Significant |
| A | 2342.70 | 1 | 2342.70 | 57.66 | 0.0001 | |
| B | 58.86 | 1 | 58.86 | 1.45 | 0.2679 | |
| C | 126.40 | 1 | 126.40 | 3.11 | 0.1211 | |
| AB | 4.41 | 1 | 4.41 | 0.11 | 0.7515 | |
| AC | 107.12 | 1 | 107.12 | 2.64 | 0.1485 | |
| BC | 76.56 | 1 | 76.56 | 1.88 | 0.2122 | |
| A 2 | 835.31 | 1 | 835.31 | 20.56 | 0.0027 | |
| B 2 | 0.19 | 1 | 0.19 | 4.790 × 10⁻³ | 0.9468 | |
| C 2 | 149.56 | 1 | 149.56 | 3.68 | 0.0965 | |
| Residual | 284.43 | 7 | 40.63 | |||
| Lack of fit | 212.28 | 3 | 70.76 | 3.92 | 0.1099 | Not significant |
| Pure error | 72.15 | 4 | 18.04 | |||
| Cor total | 4028.84 | 16 |
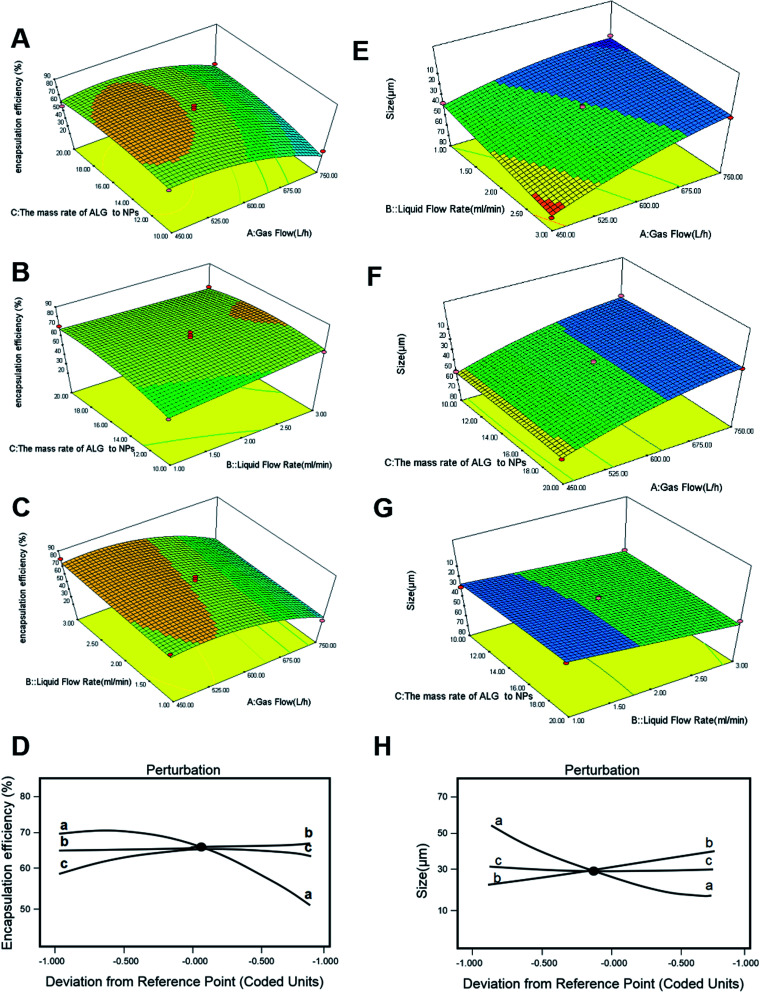
The influences of liquid flow rate (mL min−1), gas flow rate (L h−1), and the mass ratio of ALG to NPs (w/w) on the encapsulation efficiency of HBsAg were all evaluated. And the three-dimensional response surfaces are shown in Fig. 2. The encapsulation efficiency of HBsAg exhibited a remarkable increase with decrease of the gas flow, while the effect of the mass ratio of ALG to NPs was inconspicuous (Fig. 2A). Under a low value (15 : 1) of the mass ratio of ALG to NPs, as gas flow rate decreased from 750 L h−1 to 450 L h−1, HBsAg encapsulation efficiency increased from 30.2% to 71.6%. Similarly, the encapsulation efficiency of HBsAg increased with an increase of the liquid flow rate, and was almost unaffected by the mass ratio of ALG to NPs (Fig. 2B). So, when the lowest value of liquid flow rate (1.00 mL min−1) and the higher value of gas flow rate (600 L h−1) were employed, we obtained the highest HBsAg encapsulation efficiency. It was found from Fig. 2C that both liquid flow rate and gas flow rate exhibited obvious influences on the encapsulation efficiency of HBsAg, which increased with a decrease of gas flow rate and an increase of liquid flow rate. The impact of gas flow rate on HBsAg encapsulation efficiency was more important than that of liquid flow rate, and the optimum response value was observed at liquid flow rate of 1.00 mL min−1 and gas flow rate of 591.5 L h−1. Yet, Fig. 2A–C illustrates the interactions among these three factors, which did not exhibit a significant difference.
Fig. 2. DOE-RSM analysis of final HBsAg encapsulation efficiency as a function of gas flow rate, liquid flow rate, and the mass ratio of ALG to NPs (A–C), and perturbation analyses (D). DOE-RSM analysis of size as a function of gas flow rate, liquid flow rate and the mass ratio of ALG to NPs (E–G), and perturbation analyses (H).
In addition, these questions was be analyzed (Fig. 2D). It could be concluded that the decrease of gas flow rate and the increase of liquid flow rate were responsive to the increase of HBsAg encapsulation efficiency. The influence of the former was significantly higher than the latter. The effect of the mass ratios of ALG to NPs on HBsAg encapsulation efficiency was not obvious, which presented a positive correlation.
3.1.2. Microcapsule size as a function of gas flow, liquid flow rate, and the mass ratio of ALG to NPs
In order to meet the need of vaccine formulation for mice injection, the size of microcapsules should be smaller than 50 μm. ANOVA showed that the quadratic model was significant with gas flow, liquid flow rate, and the mass ratio of ALG to NPs. The RSM was applied for optimizing preparation parameters employing microcapsule size as response variable. The results are shown in Table 2. The model F-value of 18.29 indicates the model was significant. There was only a 0.05% chance that an F-value became large and occurred due to noise. The ratio of “Adeq Precision” was 15.039, indicating that it was an adequate signal (Table S4 in ESI†). Therefore, the model could be used for predicting optimal parameters, which was expressed as eqn (2):
| Y = 31.66 − 15.29A + 7.27B − 0.087C − 5.27AB − 0.7AC + 1.57BC + 4.84A2 + 0.15B2 + 0.58C2 | 2 |
The size increased with increase of liquid flow rate, while it decreased with increase of gas rate (Fig. 2E). The impacts of gas flow and the mass ratio of ALG to NPs on microcapsule size were also evaluated, and the result in Fig. 2F suggested that the size was decreased with an increase of gas flow rate, while the mass ratio of ALG to NPs showed little influence on size. Finally, the impact of liquid flow rate and the mass ratio of ALG to NPs on microcapsule size is shown in Fig. 2G, and a similar influence tendency was observed. As mentioned above, these influence factors were further analyzed (Fig. 2H). We readily found that the mass ratio of ALG to NPs (trace c) had little impact on final size. However, microcapsule size was responsive to gas flow rate, and the size was decreased with an increase of gas flow rate (trace a). In addition, this analysis demonstrated that microcapsule size was directly responsive to liquid flow rate, and the size increased with an increase of liquid flow rate (trace b).
According to the above response surface optimization experiments, the optimal parameters were determined as follows: the liquid flow rate was 1.00 mL min−1, the gas flow rate was 591.5 L h−1, and the mass ratio of ALG to NPs was 18.68 : 1. The microcapsules were prepared under the optimal parameters, and the predicted value for HBsAg encapsulation efficiency was 69.1898%, and the microcapsule size was 24.249 μm. There was a small error between actual value and predicted value, which indicated this model was reliable (Table S5-encapsulation efficiency, and Table S6-Size in ESI†).
3.2. Preparation of alginate microcapsules loaded with free antigen and antigen-loaded DDAB/PLA nanoparticles with optimal parameters
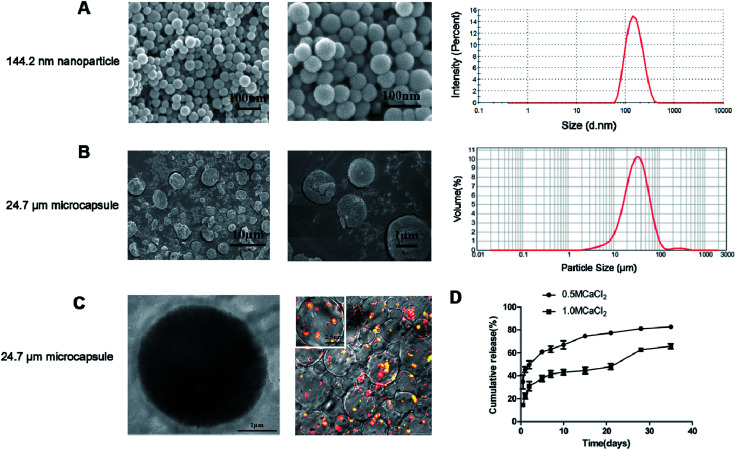
Based on the optimal preparation parameters, the free HBsAg and HBsAg-loaded DDAB/PLA nanoparticles were co-encapsulated into alginate microcapsules according to Section 2.3. We have measured the surface charge of DDAB/PLA nanoparticles and HBsAg-loaded DDAB/PLA nanoparticles. After loading of HBsAg, the surface charge of DDAB/PLA nanoparticles was decreased from +51.6 ± 2.0 mV to 15.6 ± 2.0 mV. The alginate microcapsules containing HBsAg and HBsAg-loaded DDAB/PLA nanoparticles were successfully fabricated, which exhibited good dispersity, narrow size distribution and spherical morphology. The HBsAg encapsulation efficiency was 68.4%, which was close to the predicted value. The average size of microcapsules in distilled water was 24.7 μm (Fig. 3B), which was much larger than that measured from SEM micrographs (Fig. 3A). This was because the microcapsules could swell in water. The microcapsules exhibited a shell–core structure, and the fluorescent labeled HBsAg-loaded DDAB/PLA nanoparticles were successfully encapsulated into alginate microcapsules as shown in the TEM and CLSM images (Fig. 3C).
Fig. 3. Characterization of HBsAg-loaded DDAB/PLA-alginate microcapsules. SEM images and size distribution of nanoparticles (A). SEM images and size distribution of microcapsules (B). TEM micrograph and CLSM images of microcapsules (C). In vitro cumulative release of HBsAg from different types of alginate microcapsules. Values represent mean ± SEM (n = 10) (D).
3.3. HBsAg release from microcapsule system in vitro
The in vitro release of antigen from alginate microcapsules was calculated by measuring the amount of HBsAg collected in the releasing media at predetermined times during incubation of the microcapsules in 10 mM PBS. The release profiles of alginate microcapsules solidified with 0.5 M CaCl2 and 1.0 M CaCl2 were evaluated and the results are shown in Fig. 3D. It was found that the microcapsules solidified with 0.5 M CaCl2 showed a two-phase release profile, which demonstrated an initial burst release within the first 12 h, followed by a slowly sustained release. The microcapsules solidified with 1.0 M CaCl2 exhibited three-phase release behavior, which showed 19% initial burst release followed by a slow continuous release and then a rapid release on day 28. The results suggested that the microcapsules solidified with 0.5 M CaCl2 showed faster HBsAg release than those solidified with 1.0 M CaCl2, which further verified that the solidifier of CaCl2 with higher concentration was more effective in slowing down antigen release. The surface morphology of the two types of microcapsules solidified with different amounts of CaCl2 was also observed by SEM, and the results are shown as Fig. S4 in ESI,† which suggested that there were no significant differences between them.
The alginate microcapsules solidified with 1.0 M CaCl2 showed three-phase release behavior, which could well simulate the traditional three-shot immunization of aluminum-based HBsAg vaccines. The burst release of antigen simulated the primary immunization, the continuous antigen release simulated the second immunization, and the fast antigen release on day 28 simulated the third immunization. Therefore, these microcapsules were further employed as single-shot HBsAg vaccines for immunization evaluation.
3.4. Security evaluation in vaccinated mice
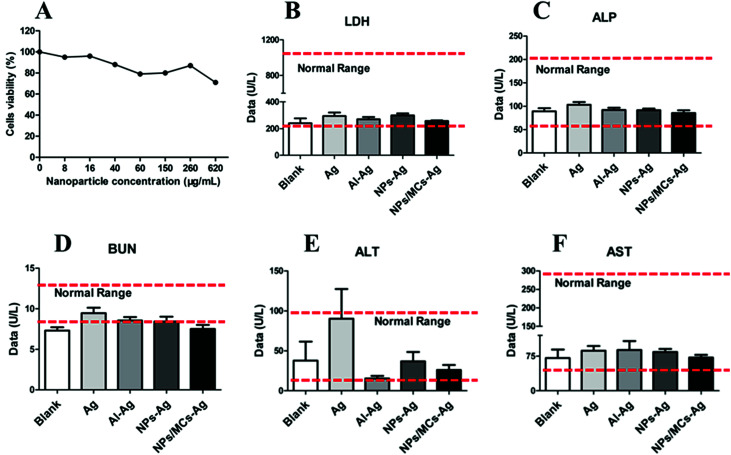
Bio-security in vivo and in vitro is a prerequisite for vaccine formulation. The levels of LDH, ALP, BUN, ALT and AST in serum of immunized mice were measured for evaluation of bio-security of microcapsule vaccine formulation. As shown in Fig. 4B–F, the levels of LDH, ALP, BUN, ALT and AST in serum for mice immunized with microcapsules were less than those for mice immunized with Ag, and both were almost the same as the blank group. The levels of LDH, ALP, BUN, ALT and AST in serum for all groups remained within the normal values. We also evaluated cytotoxicity of nanoparticles with different concentrations in vitro using BMDC, and the results (Fig. 4A) showed that the BMDC viability was slightly decreased with an increase of nanoparticle concentrations, and cells could maintain more than 80% viability when the nanoparticle concentration reached 620 μg mL−1, which suggested that the nanoparticles demonstrated excellent cellular safety. Therefore, the microcapsule vaccine formulation exhibited little toxicity and excellent bio-security in vivo and in vitro, which could be further employed as single-shot HBsAg vaccine.
Fig. 4. Bio-security evaluations via cytotoxicity assay in vitro (A) and sera biochemical parameters (B–F).
3.5. Antigen-specific antibody responses in vaccinated mice
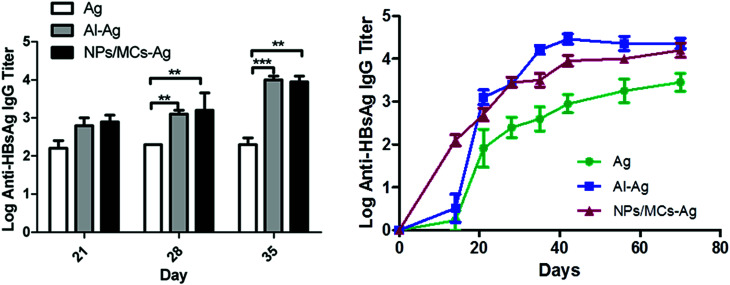
To evaluate the immune adjuvant capability of the developed formulations immunization studies were performed. The alginate microcapsules containing HBsAg-loaded DDAB/PLA nanoparticles were employed as single-shot vaccine to immunize the mice. And the antigen of HBsAg and aluminum-based vaccine with three shots were employed as controls. Before immunization, we measured the surface charge of alginate microcapsules, which was a negative surface charge of −5.42 ± 2 mV. According to the antigen encapsulation efficiency (68%), total antigen dose (6 μg) and immunized volume (400 μL) of single-shot vaccines, the microcapsule concentration was 23.25 mg mL−1. The antibody levels were evaluated by indirect ELISA and the result is shown in Fig. 5. The alginate microcapsules immunized with a single shot induced a strong humoral response, which was comparable with traditional aluminum-based vaccine with three shots. Both the single-shot microcapsule vaccine formulation and the three-shot aluminum-based vaccine induced significantly higher IgG level than that of antigen alone (p < 0.05). Long-term antibody levels showed that single-shot vaccine of NPs/MCs-Ag induced steadily increasing antibody titers within 70 days, which showed no significant difference from that of three-shot aluminum-binding vaccine. This result suggested that the microcapsule formulation could induce effective humoral immune response by a single shot, which was necessary for vaccine immunization.
Fig. 5. Antigen-specific IgG antibody responses in Balb/c mice immunized with different vaccine formulations. Mice (n = 6) were immunized three times as described in the Methods section. Data are expressed as the mean ± SEM (n = 6). *p < 0.05; **p < 0.001; ***p < 0.0001.
3.6. Splenocyte proliferation responses
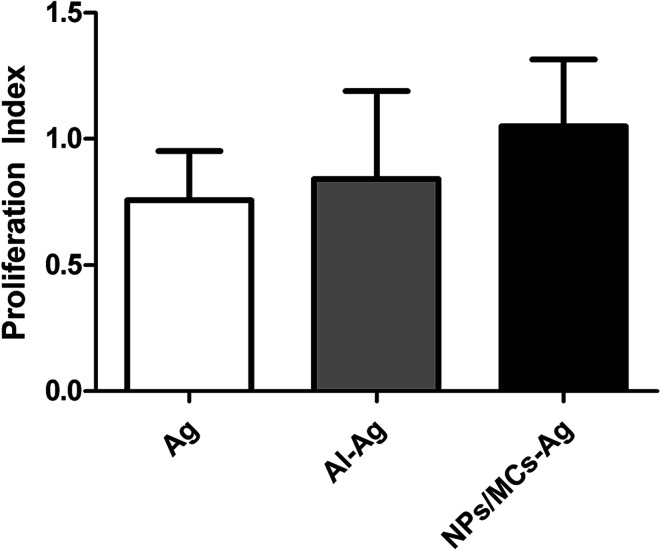
Splenocyte proliferation response is one of the important indicators, which was used to evaluate the immune effect of the mice immunized with various vaccine formulations. As shown in Fig. 6, the splenocytes collected from mice immunized with the single-shot alginate microcapsule vaccine formulations showed a slightly higher proliferation than three-shot HBsAg alone and aluminum-based vaccines, but there was no statistical difference among them (p > 0.05). This suggested that the single-shot alginate microcapsule vaccine formulations had the ability to stimulate immune cell proliferation.
Fig. 6. Splenocyte proliferative responses in vitro. Mice (n = 6) were immunized three times as described in the Methods section. Data are expressed as the mean ± SEM (n = 6).
3.7. Cytokine secretion by splenocytes
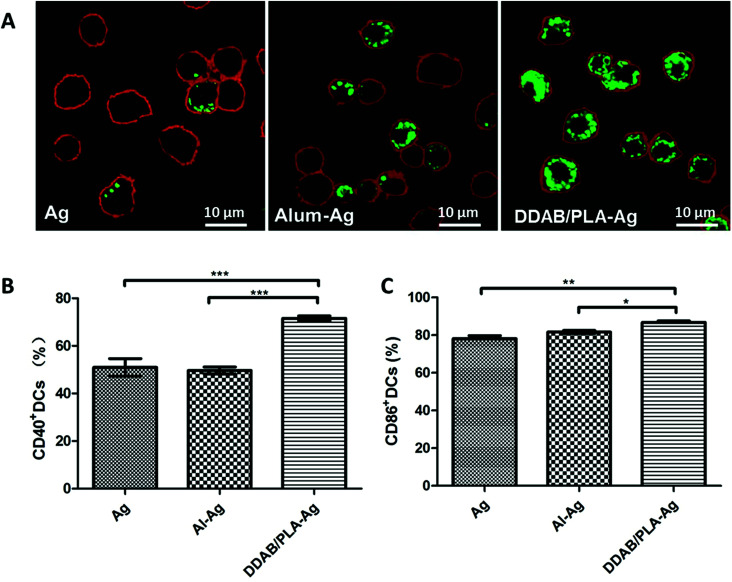
T cells are essential to the induction of high-affinity antibodies and immune memory. In order to confirm the involvement of the T lymphocyte system, we studied the upregulated expression of co-stimulation markers CD40 and CD86 on BMDCs in vitro. For the single-shot HBsAg-DDAB/PLA-alginate microcapsule vaccine, the released antigen and antigen-loaded DDAB/PLA could be taken up by DCs to become active DCs. Therefore, we co-cultured BMDCs with FITC-labelled HBsAg, Al–Ag and DDAB/PLA-Ag for 24 hours to compare antigen uptake and the activation levels of BMDCs with co-stimulation markers CD40 and CD86, and the results are shown in Fig. 7. The antigen uptake was observed by LSCM as shown in Fig. 7A. Comparing with antigen alone and aluminum-binding antigen, the positively charged nanoparticles of DDAB/PLA could greatly enhance the antigen uptake by BMDCs. They further upregulated expression of co-stimulation markers CD40 and CD86 on BMDCs as shown in Fig. 7B–C. These results suggested that the single-shot HBsAg-DDAB/PLA-alginate microcapsule vaccine could improve BMDC activation, which could further activate T lymphocytes to induce high-affinity antibodies and immune response.
Fig. 7. Antigen uptake by BMDCs (A) and co-stimulation marker expression on BMDCs (B and C) after co-culture with antigen alone, aluminum-binding antigen or DDAB/PLA-binding antigen. Cell membranes were stained red, and green fluorescence represents HBsAg. Data are expressed as the mean ± SEM (n = 3). *p < 0.05; **p < 0.001; ***p < 0.0001.
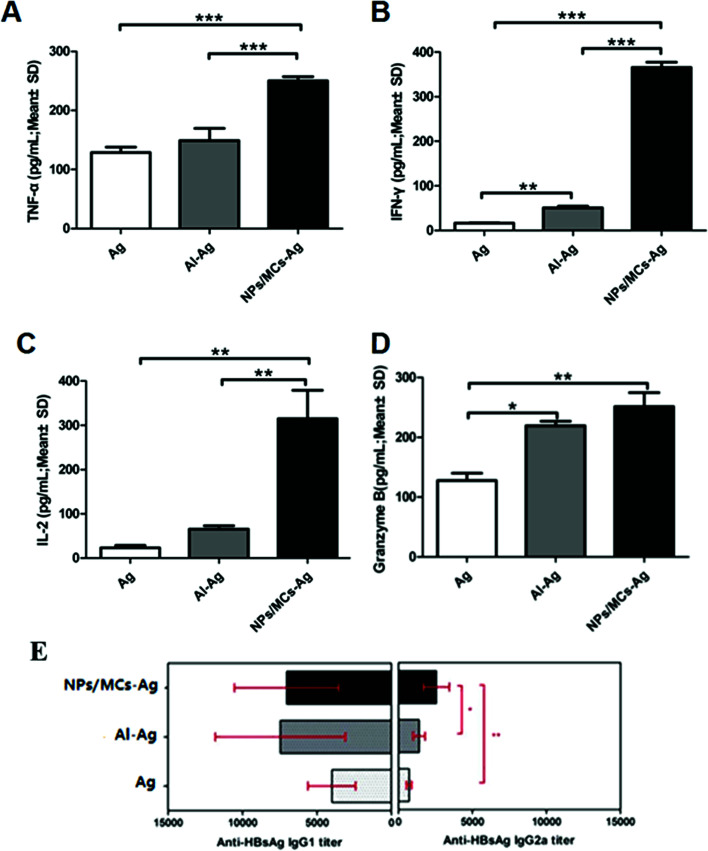
In this work, we further evaluated the level of cytokine secretion by spleen cells harvested from mice immunized with the different vaccine formulations. It was observed that the single-shot alginate microcapsules could induce a Th1-biased immunity compared to three-shot HBsAg alone and aluminum-based vaccine. The aim of Th1-type immune response is eliminating bacteria and infected cells effectively, including TNF-α, IFN-γ, and IL-2 (ref. 25). Evidence indicates that granzyme B can contribute to antiviral immunity by directly suppressing viral replication through direct proteolysis of viral proteins that are essential for pathogenicity.26 Within the target cells, granzyme B rapidly activates caspase-dependent or caspase-independent apoptosis and induces cytotoxicity by directly cleaving a variety of death substrates, and generates a cytotoxic level of mitochondrial reactive oxygen species to mediate cell death.
The cytokine secretion levels of TNF-α, IFN-γ, IL-2 and granzyme B were determined by ELISA as shown in Fig. 8A–D. Significantly high cytokine levels were produced by splenocytes from mice immunized with the single-shot alginate microcapsule vaccine formulations compared with three-shot HBsAg alone and aluminum-based vaccine. In order to further prove the Th1-biased immunity of the single-shot alginate microcapsules, we have measured the HBsAg-specific immunoglobulin G1 (IgG1) and G2a (IgG2a) as shown in Fig. 8E. The results showed that the IgG2a levels from serum of the mice immunized with single-shot HBsAg-DDAB/PLA microcapsule vaccine were significantly higher than those immunized with three-shot vaccines of alum-HBsAg and HBsAg. The increased production of IgG2a suggested that the single-shot alginate microcapsules could promote IgG class switching from IgG1 to IgG2a. These results demonstrated that the single-shot microcapsule vaccine formulations had great potential for inducing strong cellular immune response, which plays an important role in antiviral infection.
Fig. 8. Cytokine secretion levels by splenocytes (A-D) and HBsAg-specific IgG1 and IgG2a titer in serum (E). Mice (n = 6) were immunized three times as described in the Methods section. TNF-α (A), IFN-γ (B), IL-2 (C) and granzyme B (D) levels in the supernatant were measured by ELISA. Data are expressed as the mean ± SEM (n = 6). *p < 0.05; **p < 0.001; ***p < 0.0001.
4. Conclusions
In this study, a single-dose vaccine formulation of alginate microcapsules containing HBsAg-loaded DDAB/PLA nanoparticles was successfully fabricated by nano-precipitation27 combination with a spray-solidification method.20 The preparation parameters for encapsulating HBsAg-loaded DDAB/PLA nanoparticles into alginate microcapsules were optimized using RSM. The alginate microcapsules solidified with 1.0 M CaCl2 showed three-phase release behavior, which were further employed as single-shot vaccines to immunize mice. The results demonstrated that the single-shot vaccine formulation of alginate microcapsules exhibited comparable antigen-specific antibody levels to the traditional three-shot aluminum-based vaccine. Moreover, the single-shot microcapsule vaccine formulations exhibited much higher cytokine levels of IL-2, IFN-γ, TNF-α and granzyme B than those of three-shot aluminum-based vaccine, suggesting efficient cellular immunity. Therefore, the alginate microcapsules encapsulating HBsAg-loaded DDAB/PLA nanoparticles developed in this study were a promising delivery system for single-shot vaccine formulations.
5. Discussion
Prophylactic vaccination, a method to activate the immune system with live attenuated pathogens or recombinant proteins/peptides, is one of the most effective methods for the prevention and treatment of HBV infection. Currently, the most commonly used immunization schedule for HBV vaccine is three injections given at 0th, 1st and 6th month respectively, to elicit effective immune protection levels. The development of efficacious adjuvants is imperative for the successful induction of sufficient immune protection. It is based on the generation of a pool of long-lived memory T/B cells that can quickly respond upon re-encounter with the infectious microorganism to mount protective immunity. Because polymeric micro/nanoparticles can simultaneously augment both humoral and cellular immune response, they have become the most promising vaccine adjuvant in the field of modern vaccines. Therefore, they are used for exploration of a new single-shot vaccine strategy with stability and inducing long-term immunity properties.
Traditional preparation methods28–30 for microparticles encapsulating a vaccine always involved severe conditions including intense shear, high temperature and so on, easily resulting in denaturation of the antigen. And the residual solvent produces a severe inflammation, while the HBsAg-DDAB/PLA-alginate microcapsules were prepared in the aqueous phase. We have compared the local inflammation effect of HBsAg-DDAB/PLA-alginate microcapsules by traditional preparation (MC by TP) and spray-solidification method (MC by SS) employed in this study.
After immunization, the results are shown in Fig. S7,† which suggested that the local inflammation of MC by SS was greatly reduced compared with that of MC by TP. Nanoparticles (<1 μm) can promote antigen uptake by antigen presenting cells and cross-presentation via MHCI, inducing potent cellular immune responses but shorter immune response duration.31–33
Porous polymer matrices are used to prepare microspheres or microparticles, which are commonly used for delivering bioactive molecules and controlling the kinetics of protein release.34,35 Alginate microspheres have been widely used as delivery carriers, the antigen loaded into such alginate microspheres being released via diffusion and/or by degradation and erosion of the microsphere matrix.36 The in vitro release studies exhibited an initial burst release also, and enough primary exposure of the antigen is required to generate an effective immune response. B cells get activated under higher amount of antigen, and later on slow release of the antigen is sufficient to potentiate the immune response.37
In this study, the free HBsAg and HBsAg-loaded DDAB/PLA nanoparticles were co-encapsulated into alginate microcapsules. The composite microcapsules were used as single-shot vaccine to immunize the mice. The free HBsAg near the surface of microcapsule is released into body, which simulated as the first immunization. Following continuous release of antigen of HBsAg via diffusion, and these antigens acted as the second immunization. Finally, with erosion of the alginate microcapsules, HBsAg-loaded DDAB/PLA nanoparticles were released, and these antigens acted as the third immunization.
For optimal single-shot vaccines, the antigen firstly induces maturation and activation of DCs, and subsequent T cell activation, which helps B cells to activate and produce antibodies with high avidity.38 The singe-shot alginate microcapsule vaccine formulation developed in this study could induce high enough antigen-specific IgG antibody responses (Fig. 5) and cytokine secretion levels (Fig. 8), which potentially become the platform of single-shot vaccines.
Conflicts of interest
There are no conflicts to declare.
Supplementary Material
Acknowledgments
This work was financially supported by the National Science and Technology Major Project of China (grant no. 2016ZX10004001-005), the National Science and Technology Major Project of China (grant no. 2014ZX09102045-003), and the National Science Foundation of China (grant no. 21476243 and 81274101).
Electronic supplementary information (ESI) available: See DOI: 10.1039/c8ra00013a
References
- De Clercq E. Rev. Med. Virol. 2015;25:354–365. doi: 10.1002/rmv.1849. [DOI] [PubMed] [Google Scholar]
- Couette M. Boisse M.-F. Maison P. Brugieres P. Cesaro P. Chevalier X. Gherardi R. K. Bachoud-Levi A.-C. Authier F.-J. J. Inorg. Biochem. 2009;103:1571–1578. doi: 10.1016/j.jinorgbio.2009.08.005. [DOI] [PubMed] [Google Scholar]
- He P. Zou Y. Hu Z. Hum. Vaccines Immunother. 2015;11:477–488. doi: 10.1080/21645515.2014.1004026. [DOI] [PMC free article] [PubMed] [Google Scholar]
- HogenEsch H. Vaccine. 2002;20:S34–S39. doi: 10.1016/S0264-410X(02)00169-X. [DOI] [PubMed] [Google Scholar]
- Lindblad E. B. Vaccine. 2004;22:3658–3668. doi: 10.1016/j.vaccine.2004.03.032. [DOI] [PubMed] [Google Scholar]
- Gupta R. K. Vaccine. 1995;13:1263–1276. doi: 10.1016/0264-410X(95)00011-O. [DOI] [PubMed] [Google Scholar]
- Gupta R. K. Adv. Drug Delivery Rev. 1998;32:155–172. doi: 10.1016/S0169-409X(98)00008-8. [DOI] [PubMed] [Google Scholar]
- Petrovsky N. Aguilar J. C. Immunol. Cell Biol. 2004;82:488–496. doi: 10.1111/j.0818-9641.2004.01272.x. [DOI] [PubMed] [Google Scholar]
- Preis I. Langer R. S. J. Immunol. Methods. 1979;28:193–197. doi: 10.1016/0022-1759(79)90341-7. [DOI] [PubMed] [Google Scholar]
- Cleland J. L. Trends Biotechnol. 1999;17:25–29. doi: 10.1016/S0167-7799(98)01272-4. [DOI] [PubMed] [Google Scholar]
- Feng L. Xian Rong Q. J. Controlled Release. 2006;112:35–42. doi: 10.1016/j.jconrel.2006.01.012. [DOI] [PubMed] [Google Scholar]
- Shi L. Caulfield M. J. Chern R. T. Wilson R. A. Sanyal G. Volkin D. B. J. Pharm. Sci. 2002;91:1019–1035. doi: 10.1002/jps.10042. [DOI] [PubMed] [Google Scholar]
- Zheng X. Huang Y. Zheng C. Dong S. Liang W. AAPS J. 2010;12:519–524. doi: 10.1208/s12248-010-9213-1. [DOI] [PMC free article] [PubMed] [Google Scholar]
- DeMuth P. C. Garcia-Beltran W. F. Ai-Ling M. L. Hammond P. T. Irvine D. J. Adv. Funct. Mater. 2013;23:161–172. doi: 10.1002/adfm.201201512. [DOI] [PMC free article] [PubMed] [Google Scholar]
- Quan Fu-S. Kim Y.-C. Song J.-M. Hwang H.-S. Compans R. W. Prausnitz M. R. Kang S. M. Clin. Vaccine Immunol. 2013;20:1433–1439. doi: 10.1128/CVI.00251-13. [DOI] [PMC free article] [PubMed] [Google Scholar]
- Kemp J. M. Kajihara M. Nagahara S. Sano A. Brandon M. Lofthouse S. Vaccine. 2002;20:1089–1098. doi: 10.1016/S0264-410X(01)00444-3. [DOI] [PubMed] [Google Scholar]
- Liu Y. Yin Y. Wang L. Zhang W. Chen X. Yang X. Xu J. Ma G. J. Mater. Chem. B. 2013;1:3888–3896. doi: 10.1039/C3TB20383B. [DOI] [PubMed] [Google Scholar]
- Chen X. Liu Y. Wang L. Liu Y. Zhang W. Fan B. Ma X. Yuan Q. Ma G. Su Z. Mol. Pharm. 2014;11:1772–1784. doi: 10.1021/mp400597z. [DOI] [PubMed] [Google Scholar]
- Rice-Ficht A. C. Arenas-Gamboa A. M. Kahl-McDonagh M. M. Ficht T. A. Curr. Opin. Microbiol. 2010;13:106–112. doi: 10.1016/j.mib.2009.12.001. [DOI] [PubMed] [Google Scholar]
- Yang Ya W. Luo W. H. J. Controlled Release. 2016;227:82–93. doi: 10.1016/j.jconrel.2016.02.011. [DOI] [PubMed] [Google Scholar]
- Zhang J. Li X. Zhang D. Xiu Z. J. Appl. Polym. Sci. 2008;1112:488–2497. [Google Scholar]
- Madania S. Gheshlaghi R. Mahdavia M. A. Sobhania M. Elkamelb A. Fuel. 2015;150:434–440. doi: 10.1016/j.fuel.2015.02.039. [DOI] [Google Scholar]
- Hallenbeck P. C. Grogger M. Mraz M. Veverka D. Bioresour. Technol. 2015;184:161–168. doi: 10.1016/j.biortech.2014.09.022. [DOI] [PubMed] [Google Scholar]
- Torres M. P. Wilson-Welder J. H. Lopac S. K. Phanse Y. Carrillo-Conde B. Ramer-Tait A. E. Bellaire B. H. Wannemuehler M. J. Narasimhan B. Acta Biomater. 2011;7:2857–2864. doi: 10.1016/j.actbio.2011.03.023. [DOI] [PMC free article] [PubMed] [Google Scholar]
- Yuan L. Wu L. H. Chen J. A. Wu Q. A. Hu S. H. Vaccine. 2010;28:4402–4410. doi: 10.1016/j.vaccine.2010.04.046. [DOI] [PubMed] [Google Scholar]
- Zhu J. Paul W. E. Blood. 2008;112:1557–1569. doi: 10.1182/blood-2008-05-078154. [DOI] [PMC free article] [PubMed] [Google Scholar]
- Afonina I. S. Cullen S. P. Martin S. J. Immuno. Rev. 2010;235(1):105–116. doi: 10.1111/j.0105-2896.2010.00908.x. [DOI] [PubMed] [Google Scholar]
- Hideki M. Masao K. Hirofumi T. Powder Technol. 2000;107:137–143. doi: 10.1016/S0032-5910(99)00182-5. [DOI] [Google Scholar]
- Zambaux M. F. Bonneaux F. Gref R. J. Controlled Release. 1998;50:31–40. doi: 10.1016/S0168-3659(97)00106-5. [DOI] [PubMed] [Google Scholar]
- J. O. Josefsberg Buckland B. Biotechnol. Bioeng. 2012;109(6):1443–1460. doi: 10.1002/bit.24493. [DOI] [PubMed] [Google Scholar]
- He Y. Chen Z. H. Wei S. L. Acta Pharm. Sin. B. 2001;36(9):695–698. [Google Scholar]
- Horisawa E. Kubota K. Tuboi I. Sato K. Yamamoto H. Takeuchi H. Kawashima Y. Pharm. Res. 2002;19(2):132–139. doi: 10.1023/A:1014260513728. [DOI] [PubMed] [Google Scholar]
- Saltzman W. M. Mak M. W. Mahoney M. J. Duenas E. T. Cleland J. L. Pharm. Res. 1999;16:232–240. doi: 10.1023/A:1018824324275. [DOI] [PubMed] [Google Scholar]
- Zhai P. Chen X. B. Schreyer D. J. Biofabrication. 2013;5:015009. doi: 10.1088/1758-5082/5/1/015009. [DOI] [PubMed] [Google Scholar]
- Zhai P. Chen X. B. Schreyer D. J. Mater. Sci. Eng. Carbon. 2015;56:251–259. doi: 10.1016/j.msec.2015.06.015. [DOI] [PubMed] [Google Scholar]
- Jain A. K. Goyal A. K. Gupta P. N. Khatri K. Mishra N. Mehta A. Mangal S. Vyas S. P. J. Controlled Release. 2009;136:161–169. doi: 10.1016/j.jconrel.2009.02.010. [DOI] [PubMed] [Google Scholar]
- Xu J. Wang L.-yan. Yang T.-yuan. Liu Y.-hui. Ma G.-hui. Chin. J. Process Eng. 2015;15:495–500. [Google Scholar]
- Zhang W. Wang L. Liu Y. Chen X. Liu Q. Jia J. Yang T. Qiu S. Ma G. Biomaterials. 2014;35:6086–6097. doi: 10.1016/j.biomaterials.2014.04.022. [DOI] [PubMed] [Google Scholar]
Associated Data
This section collects any data citations, data availability statements, or supplementary materials included in this article.


