Abstract
This study presents a novel microfluidic chip that can achieve on-demand gold nanoparticle (AuNP) synthesis using atmospheric pressure helium plasma and on-site mercury ion detection. Instead of using conventional chemical reaction methods, this chip uses helium plasma as the reducing agent to reduce gold ions and to synthesize AuNP, such that there is no residual reducing agent in the solution after removing the external electric field for plasma generation. The plasma discharge, gas–liquid separation, liquid collection and mercury ion detection can be achieved by this proposed microfluidic chip. The synthesized gold nanoparticles are further functionalized by 3-mercaptopropionic acid (3-MPA) for mercury ion detection. The 3-MPA-capped gold nanoparticles aggregate and result in a colour change of the solution due to the existence of Hg2+. The absorption spectra of the solution shifts from red to blue due to the cluster aggregation. The concentration of Hg2+ can be quantitatively determined by UV-Vis spectrometry, and the limit of detection was found to be 10−6 M (0.2 ppm). This developed integrated microfluidic device provides a simple and on-demand method for synthesis of AuNPs and Hg2+ detection in a single chip.
This study presents a novel microfluidic chip that can achieve on-demand gold nanoparticle (AuNP) synthesis using atmospheric pressure helium plasma and on-site mercury ion detection.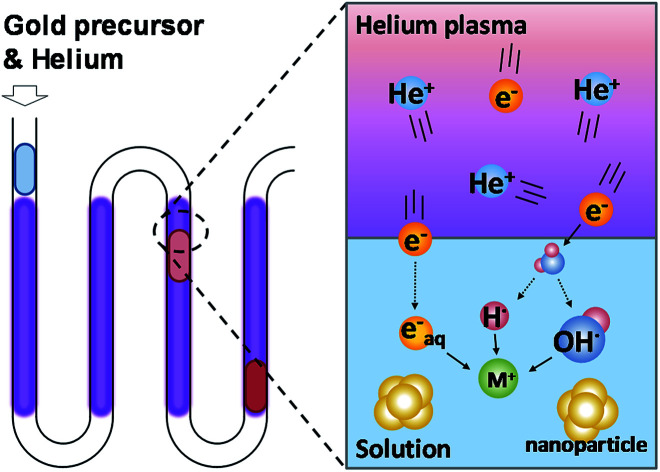
Introduction
Many studies indicate that mercury and its compounds are neurotoxic to organisms. Mercury ions can cause serious damage to the human brain and nervous system even at ppm levels.1 Mercury pollution in the environment has also increased rapidly with the development of industry and agriculture.2 Hence, the development of detection methods for mercury ion and related compounds is very urgent and important. Current mercury ion detection methods include HPLC-ICP-MS,3 fluorescence spectroscopy,4,5 capillary electrophoresis,6 ESI-MS/MS,7 fluorescence quenching8 and the UV-Vis colorimetric method.9,10 Of these methods, UV-Vis colorimetry is the most common and simple since no delicate equipment is required for mercury ion detection. This method requires the use of analyte-induced chemical colorimetric reaction. For the colorimetric reaction, gold nanoparticles are quite suitable as the colorimetric sensor because of their unique optical properties.
Gold nanoparticles are typically synthesized via the Turkevich method, which was developed by Russian scientist John Turkevich in 1951.11 This method uses sodium citrate as the reducing agent to reduce Au3+ in HAuCl4 solution to form gold nanoparticles. The size of synthesized AuNPs ranged from 10–20 nm. In addition to this solution-based reaction system, there is an organic solvent-based method for AuNP synthesis which was developed by Brust et al. in 1994.12 Aqueous gold ions of [AuCl4]− were chemically reduced at an aqueous–solvent interface and then transferred into the organic solvent. In this approach, sodium borohydride is used as the reducing agent, and the size of synthesized AuNP ranged from 1.0–5.0 nm, which is much smaller than the particles synthesized by the Turkevich method.13 These two methods further populated research on the application of nanoparticles.
In these methods, the HAuCl4 solution needs to be heated and stirred to trigger the reducing reaction. However, there are some unavoidable shortcomings in the preparation of gold nanoparticles. Firstly, the time needed to heat the solution is about 20 minutes. Secondly, the reduction reaction requires additional chemical reductant to provide the electrons. Excess reactants will remain in the prepared AuNP solution, such as the sodium ions derived from sodium citrate.14 Such chemical residues may induce unpredictable effects on subsequent applications. Therefore, additional treatment is necessary to separate and remove these impurities from the gold nanoparticles, which can be achieved by using centrifugal14 or diafiltration methods.15 Although these methods can remove most of the residue, the efficiency of the system and the time required are still critical problems in these approaches.
Therefore, this study uses atmospheric plasma to synthesize gold nanoparticles because plasma can provide pure electrons to the gold ions in the aqueous solution to replace the chemical reductant used in traditional methods. When the plasma comes into contact with the surface of the liquid, many highly reactive chemicals are generated at the interface.16 This phenomenon is called plasma–liquid interaction, PLI. The reduction reaction is activated by the plasma, which can be removed to terminate the process of synthesizing gold nanoparticles. In addition, the time required for the reaction can be decreased significantly. Consequently, the issues regarding reagent residues and reaction time can be resolved.
The AuNPs are required to be functionalized so that they aggregate in the presence of the Hg2+ in solution. The thymine-containing DNA is one of the agents used to functionalized AuNPs.17,18 Although the formation of T–Hg2+–T complex provides an aggregation mechanism for AuNPs and excellent performance in Hg2+ detection. The production cost of DNA with specific sequence is the main issue of this scheme. Stabilizer capped AuNP is also capable to detect the Hg2+ in solution. Because the formation of Hg–Au alloy on the surface of the AuNP occupies the space for the stabilizers, the decrease of the stability leads the aggregation of the AuNPs.19 This approach provides a single way to detect Hg2+. But the selectivity between Hg2+ and Ag+ is relatively poor since Ag+ also reduces on the surface of AuNPs unless additional chemical, e.g., EDTA was used.
In contrast, Hupp et al. proposed a spectrometry method to detect heavy metal ions using the aggregation of gold nanoparticles. AuNPs were modified by organic molecules containing sulfhydryl and carboxyl groups, such as 11-mercaptoundecanoic acid (MUA), for chelating the dissolved mercury ions.20 The sulphur atoms and carboxyl groups on MUA form covalent bonds and coordination covalent bonds with gold and mercury ions, respectively. Therefore, the gold nanoparticles coated by MUA will aggregate due to the mercury ions in the solution. The aggregation of gold nanoparticles changes the absorption peak of the local surface plasmon resonance, which causes the colour of the solution to change from red to blue. It is, therefore, possible to quantify the concentration of mercury ions in the solution by UV-Vis absorption spectroscopy.
Finally, due to the research progress of microfluidics in recent years, many studies have focused on synthesizing gold nanoparticles in a microfluidic chip.21,22 The method presented in this study considerably reduces the chemicals needed for the reaction and increases the overall efficiency of the synthesis system. In the meanwhile, the chip-based Hg2+ detection methods are also developing due to its minimum size of a volume.23 The purpose of this study is to develop a single microfluidic chip that can synthesize gold nanoparticles by atmospheric plasma and detect mercury ions using UV-Vis spectroscopy.
Principle explanation
Plasma-assisted nanomaterial synthesis
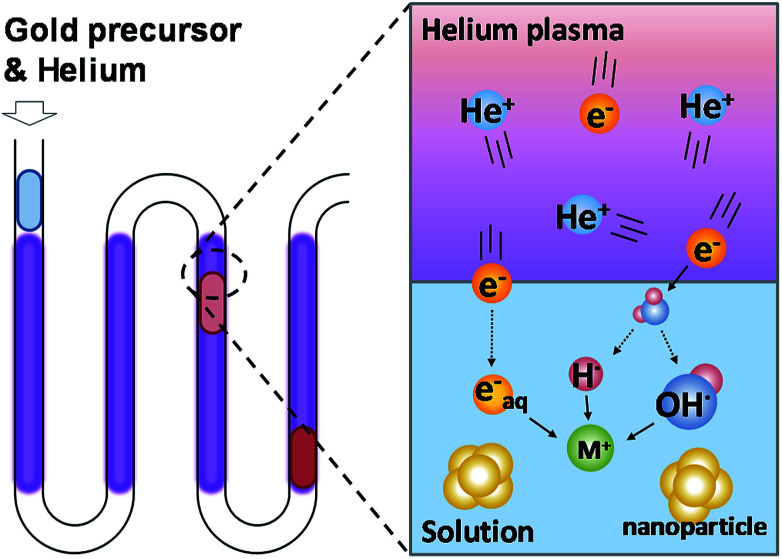
Plasma is composed of high-energy ionized gas containing molecular and free electrons. When the plasma comes into contact with water, it produces chemically reactive products at the interface. These reactive products are H and OH radicals, which have been confirmed by optical emission spectrums.24 In addition, some of the free electrons in the plasma dissolve into the solution and form hydrated electrons.25Fig. 1 shows the working principle of PLIs. The H and OH radicals form atomic H, H2 and H2O2 in aqueous solutions and have different reducing abilities depending on the pH value of the solution.16,26 Among these products, hydrated electrons have the strongest reducing ability to reduce most of the metal ions in the solution. Due to the extremely short lifetime of these PLI products (10−9 s to 10−6 s),27 the plasma-induced chemical reaction can be terminated immediately without leaving reductant residuals upon removal of the plasma. Because the heating and cooling process is not required in this system, the time required for the synthesis of gold nanoparticles is greatly reduced (from 30 min to 5 min28) compared to the conventional method. Therefore, the use of plasma to synthesize nanomaterials can solve two major issues in traditional synthesis methods: reductant residuals and long operation time required.
Fig. 1. The schematic view of gold ion reduction and gold nanoparticle synthesis using micro atmospheric helium plasma.
AuNP-based mercury detection
This study uses the colorimetric reaction of gold nanoparticles as the basic principle for detecting mercury ions in solution. Therefore, the gold nanoparticles require aggregation in the presence of mercury ions in solution. To achieve the chelation of the mercury ions and synthesized AuNPs, this study used 3-mercaptopropionic acid (3-MPA) to functionalize the plasma-synthesized AuNPs because of its great performance and excellent selectivity to mercury ions.10,29Fig. 2 shows the aggregation mechanism of 3-MPA-capped AuNPs and the colour change of the AuNP solution before and after adding Hg2+. The covalent bond between the gold and the sulphur atom and the coordination bond between the carboxyl and the mercury ion lead to the aggregation of the AuNPs and an increase in particle size. The wavelength of LSPR and the absorption light of gold nanoparticles also increase with an increase in particle size,30 and the degree of the gold nanoparticle aggregation is proportional to the concentration of mercury ions in solution. This causes the colour of the solution to turn from red to blue, and the degree of change varies with the mercury ion concentration. Therefore, the mercury ion concentration can be easily quantified by measuring the UV-Vis spectrum of the solution.
Fig. 2. The aggregation mechanism of functionalized gold nanoparticles and Hg2+ (a). The colour of the AuNP solution before and after adding Hg2+ (b).
Experimental section
Preparation of chemicals
The helium gas used in this presented study had a purity of 99.5%. The gold salt solution used was prepared by mixing AuCl3 (Acros Organics, Belgium) with hydrochloric acid (Aencore Chemical, Australia) to achieve an Au3+ concentration of 1.0 mM. The 3-MPA for functionalizing gold nanoparticles and the HgCl2 for preparing the standard mercury solution were both purchased form Alfa Aesor, USA.
Chip design
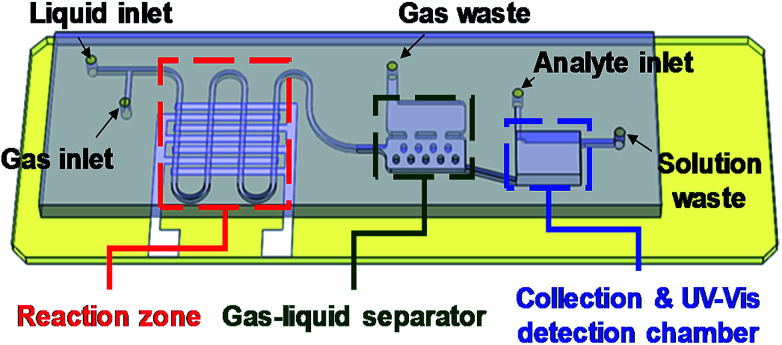
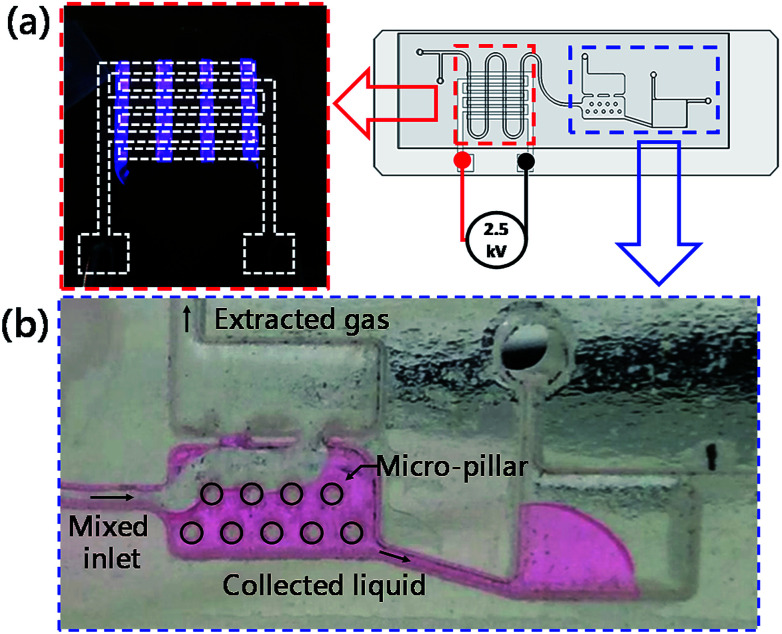
Fig. 3 presents the schematic drawing for the chip design of the developed integrated microfluidic chip. In the figure, the parts enclosed in dotted lines are the three major sections of the chip. These sections are a serpentine micro plasma channel for droplet-based AuNP synthesis, a gas/liquid separation chamber and a UV-Vis detection chamber, respectively. A T-junction channel at the entrance was designed to generate gas–liquid segment flow when helium and gold precursor solution were introduced into the chip. The interdigital electrode pairs were placed under the serpentine channel and used to generate helium dielectric discharges, the plasma source in this synthesis system. The gas and liquid phases of the segments flowing through the plasma zone can be separated by the micro-structured chamber located downstream. The liquid part of the segments was captured by the microstructure in the lower chamber due to surface tension, while the gas part was extracted by the upper chamber because of the density difference between the liquid and gas. The collected AuNP solution was then injected into the collection chamber with the volume of 40 μL at the end of the channel for UV-Vis detection of mercury ions.
Fig. 3. The profiles of the micro channel and the three major sections of the microfluidic chip.
Chip fabrication
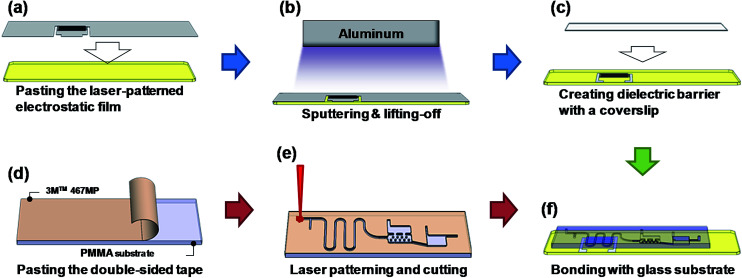
Fig. 4 presents the detailed fabrication process of producing the integrated chip for plasma AuNP synthesis and Hg2+ detection.31 Instead of using wet chemical etching processes to produce the microfluidic device, this study used low-cost laser ablation to pattern the microfluidic channel, which was then bonded onto a glass substrate with interdigital electrodes for plasma discharge. First, a commercial electrostatic film with the thickness of 100 μm was chosen and attached onto the glass slide to serve as a mask and sacrificial layer during the sputtering process. The interdigitated electrode profile of the film was created using a laser cutting process (Fig. 4a). Subsequently, an aluminium layer with a theoretical thickness of 800 nm was sputtered to remove and lift off the electrostatic film, which formed the interdigitated electrode (Fig. 4b). After the sputtering process, a 170 μm thick coverslip was then bonded to cover the electrode on the glass substrate and serve as a dielectric layer for generating plasma (Fig. 4c). The microfluidic structure was fabricated in a PMMA substrate with IR laser patterning (LaserPro Venus II, GCC Inc., Taiwan). A piece of high-performance 3M™ 467 MP double-sided tape (3M Company, USA) was adhered onto a 1.8 mm-thick PMMA substrate as a bonding layer (Fig. 4d). The choice of 3M™ 467 MP tape was due to its excellent water resistance and light transmission. The laser used to ablate the substrate was set at 2.4 W with a spot moving speed of 25.4 mm s−1 (Fig. 4e). It is noted that the collection chamber was sculpted with a second laser ablation to increase the chamber depth to 1.6 mm. The deeper chamber depth significantly enhanced the effective light path during optical measurement. Moreover, an off-focus laser polishing process was adopted to smoothen the ablated surface to enhance the optical transparency and detection performance of the PMMA device. Compared to the conventional etching process, the time required was greatly reduced (from a few hours to 20 min.), and the 2.5D structure could be created on the PMMA substrate more easily. Finally, the patterned PMMA substrate and the glass substrate were bonded together using the 3M™ 467 MP double-sided tape to form the microfluidic device (Fig. 4f).
Fig. 4. The fabrication process for producing the integrated chip in the PMMA/3M™ 467 MP paste/glass substrate sandwiched structure.
Experimental setup
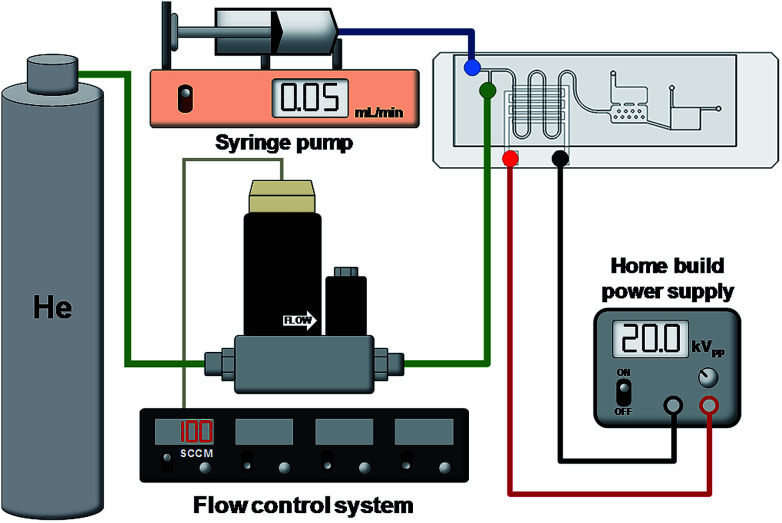
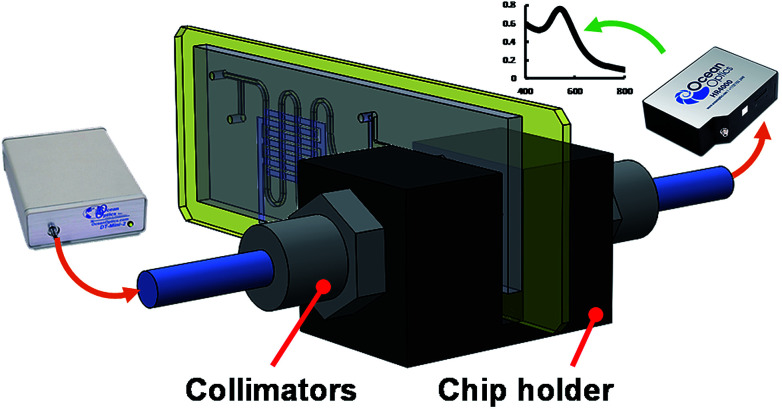
Fig. 5 is a simplified schematic showing the experimental setup for AuNP synthesis using the proposed microfluidic chip. A digital flow controller (5850E, Brooks Instrument, USA) was used to precisely adjust the flow rate of the helium. The gold precursor solution was controlled by a syringe pump (KD Scientific, USA). A home-built high voltage power supply was used to provide the electric power of up to 20 kVPP and a frequency ranging from 1 to 100 kHz. This power supply is composed of a timer IC-based square wave generator, a set of power MOSFET amplifiers and a high frequency transformer. Such a simple circuit design can generate AC signal with high voltage and ionize helium at atmospheric pressure at a low cost. The optical detection scheme for the developed microfluidic chip is shown in Fig. 6. The microfluidic chip was vertically assembled on a designed chip holder for UV-Vis detection of the solution. A fibre-based light source (DT-mini-2, Ocean Optics, USA), spectrometer (HR4000, Ocean Optics, USA) and 2 optical fibres with a collimator were used to quantitatively measure the colour shift of the solution containing AuNPs and Hg2+.
Fig. 5. The experimental setup of this study, including the home build high voltage AC power supply and the control system for the helium and gold salt solution.
Fig. 6. The experimental setup for UV-Vis detecting the Hg2+ reaction with AuNPs in the microchip.
Results and discussions
Fig. 7a shows the result of generating micro-DBD plasma in the serpentine channel. It is clear that the uniform plasma discharge was successfully produced by the home build high voltage power supply. Fig. 7b shows the liquid–gas separation chamber and the UV-Vis detection chamber for colorimetric detection of Hg2+. The present study used a simple principle of greater surface tension of liquid than gas. Several micro-pillar structures were produced in the lower chamber to capture liquid sample utilizing surface tension force and gravity force, while the gas was extracted due to lower gravity and escaped from the upper chamber. The liquid and gas phases were totally separated by the proposed separation chamber, and the separated liquid could be transported into the collection chamber spontaneously.
Fig. 7. Photo images showing the generated micro-DBD plasma on demand (a), operation for gas–liquid separation and the AuNP collection chamber for mercury ion detection (b).
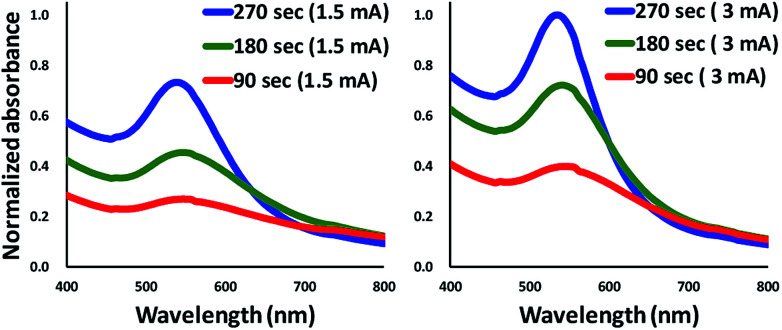
This study used 3-mercaptopropionic acid (1% v/v) to functionalize the gold nanoparticles. The colour of the synthesized gold salt solution changed from red to blue after adding 0.2 μL of the sample solution into the chamber. Fig. 8 shows the spectra of AuNPs synthesized with different working currents and different treating times. It is obvious that the particles synthesized with a higher working current have a narrower absorbance spectra width. The previous study confirmed that the peak width of the absorbance spectra represents the uniformity of the particle size.32 The result shows that the particles synthesized with a higher working current present a narrower absorbance peak width and better uniformity of particle size distribution. The narrower FWHM spectrum also indicated that the synthesized AuNPs had a narrower size distribution since the faster reaction rate of the plasma reduction process which limited the diffusion of gold ion in the salt solution.
Fig. 8. The absorbance spectrum of gold nanoparticles synthesized with different working currents. The FWHM is narrower, and the concentration of particles is higher at 3 mA.
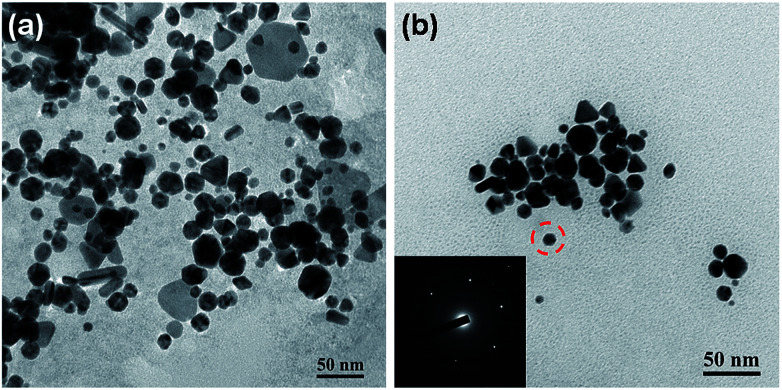
The synthesized AuNPs were also analysed by transmission electron microscope (JEM 3010, JEOL Ltd., Japan). The TEM images of synthesized AuNPs are shown in Fig. 9. The flow rates of helium and gold salt solution for synthesized the AuNPs were 1.0 SCCM (Standard Cubic Centimetre per Minute) and 0.05 mL min−1, respectively. The resulting segment volume for both and liquid were 2.31 μL for gas segment and 0.224 μL for liquid segment. The volume change for the helium gas segment was due to the compression of the helium gas in the microfluidic channel. The applied electric field for generating the plasma discharge was 5 × 10⁶ V m−1 and the working currents were set to be 1.5 mA and 3.0 mA. Since the developed approach does not require extra chemical reduction agents, the shape and size of synthesized particles can be easily modified by adding a capping agent. The TEM image s of AuNPs without and with capping agents are shown in Fig. 9a and b, respectively. Results showed that the uniformity of shape and particle size improved significantly after adding citrate as a capping agent. The inset of Fig. 9b presents the TEM diffraction pattern of the AuNP synthesized with the developed method with citrate capped. The TEM diffraction pattern confirms that the reduced AuNP was with single crystal structure which showed no difference compared to the AuNPs synthesized with the conventional batch reduction reaction process.
Fig. 9. The TEM images of synthesized AuNPs without (a) and with citrate for AuNP capping (b). Note that the concentration for the citrate was 2.5 mM.
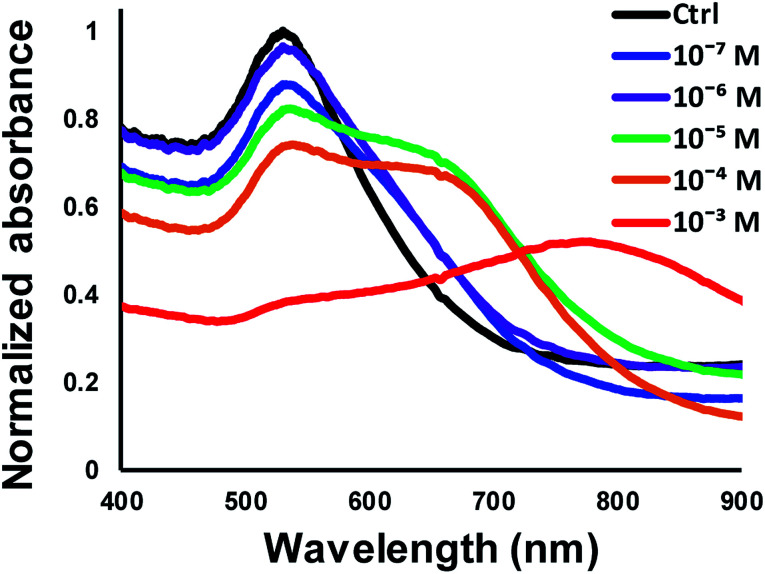
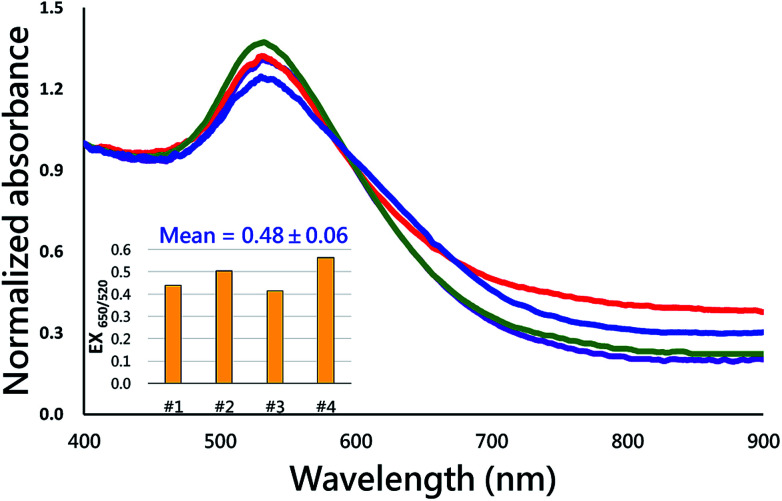
Fig. 10 shows the measured absorbance spectra for detecting Hg2+ solutions of different concentrations with 3-MPA-functionalized gold nanoparticle solution. It is noted that the sample solution was pre-loaded in the collection chamber while the synthesized AuNP solution was injected into the collection chamber. The sample solution and AuNP solution mixed and the AuNPs aggregated with the existence of mercury ions and resulted in the spectra shift. The control group used in this test was the same AuNP solution added to DI water using a 1 : 1 volumetric ratio. The results showed that the developed microfluidic chip provided a sensing performance of about 10−6 M (0.2 ppm) limit of detection, which was equivalent to the sensing performance of a typical large-scale batch process. Alternatively, according to the Beer's law in UV-Vis spectroscopy, the absorbance intensity of the sample solution is proportional to the effective light path of the solution. The effective length for the light path (around 1.6 mm) of the developed microfluidic chip was shorter than the light path (around 10 mm) of typical cuvette used in UV-Vis spectrometry. Hence, the limit of detection of the developed method was 10−6 M which was slightly lower than the LOD of conventional cuvette-based UV-Vis spectroscopy of 10−7 M. The microfluidic device developed in this present study provided an integrated and successive process for AuNP synthesis and mercury ion detection. Mercury ion detection with the aggregation of AuNPs was typically evaluated with the spectrum shift which is generally not reversible. In addition, the absorption intensity of the spectrum shift is not as accuracy as the conventional analytical methods such as electrochemiluminescence (ECL) or fluorescence approaches.33,34 This study also detected four individual Hg2+ samples of the concentration of 10−6 M to evaluate the reproducibility of the developed method. The absorbance spectra of the four individual tests were shown in Fig. 11. The intensity ratio for the absorption wavelengths at 650 nm and 520 nm was calculated and presented in the inset of Fig. 11. Results showed that the averaged intensity ratio for EX650/550 was 0.48 with the standard deviation of 0.06, indicating the nice reproducibility of the developed method for detecting mercury ions.
Fig. 10. Measured UV-Vis absorbance spectrum for detecting Hg2+ solutions at different concentrations.
Fig. 11. The reproducibility testing by detecting four individual Hg2+ samples of the concentration of 1.0 mM. The inset shows the intensity ratio for the absorption wavelengths at 650 nm and 520 nm.
Conclusions
In this study, a microfluidic chip that can achieve on-demand gold nanoparticle synthesis using atmospheric pressure helium plasma and on-site detection of mercury ions in aqueous solutions was developed. The gold ions in the precursor solution can be reduced without external chemical reductant by using helium. Since the plasma provides electrons directly to gold ions in solution, the issue of reductant residues in the conventional synthesis methods can be eliminated. Conversely, the reduction reaction can also be terminated by removing the applied electric field and, therefore, stopping the plasma discharge. To fabricate the proposed microfluidic chip, the IR laser ablation process was used to create the channel structure of the chip on the PMMA substrate, which greatly reduced the time and material needed compared to conventional etching methods. In the meantime, 2.5D structure can be created by adjusting the laser power and moving speed of the laser spot. The PMMA substrate with complex channel structures can be bonded to the glass slide without leakage by using a 3M™ 467 MP double-sided adhesive during the experiment. The liquid and gas phases of the segment flow can be totally separated by the internal micro-structure in the separation chamber due to the surface tension of the liquid and the density difference between the gas and liquid. For the synthesis of gold nanoparticles, the operating condition of plasma affects the result of gold nanoparticle synthesis directly, as the particles have better size uniformity and less chance for aggregation with a higher working current. The uniformity of size and shape can be greatly improved by adding a capping agent such as citrate. The citrate-capped gold nanoparticles exhibit mainly a spherical shape as observed under the TEM. The synthesized gold nanoparticles are functionalized with 3-mercaptopropionic acid. These modified gold nanoparticles aggregate together because of the presence of Hg2+, which causes the colour change of the solution. The Hg2+ concentration-dependent colour change can be quantified by UV-Vis spectroscopy. Finally, the results showed that the developed method could detect Hg2+ with an LOD concentration of 10−6 M (0.2 ppm). This study demonstrates the concept of nanomaterial synthesis using atmospheric pressure helium plasma and one of its applications. This microfluidic chip-based platform shows potential for other applications which require on-demand nanomaterial synthesis and on-site optical detection.
Conflicts of interest
No conflicts of interest.
Supplementary Material
Acknowledgments
The financial supports from the Ministry of Science and Technology (MOST) of Taiwan are greatly acknowledged.
Electronic supplementary information (ESI) available. See DOI: 10.1039/c8ra02468e
Notes and references
- Patrick L. Toxicol. Appl. Pharmacol. 2002;7:456–471. [Google Scholar]
- Chen C.-W. Chen C.-F. Dong C.-D. APCBEE Proc. 2012;1:153–158. doi: 10.1016/j.apcbee.2012.03.025. [DOI] [Google Scholar]
- Cheng H. Wu C. Shen L. Liu J. Xu Z. Anal. Chim. Acta. 2014;828:9–16. doi: 10.1016/j.aca.2014.04.042. [DOI] [PubMed] [Google Scholar]
- Fernández-Gómez C. Dimock B. Hintelmann H. Diez S. Chemosphere. 2011;85:1452–1457. doi: 10.1016/j.chemosphere.2011.07.080. [DOI] [PubMed] [Google Scholar]
- Kim H. N. Ren W. X. Kim J. S. Yoon J. Chem. Soc. Rev. 2012;41:3210–3244. doi: 10.1039/C1CS15245A. [DOI] [PubMed] [Google Scholar]
- Yang F. Li J. Lu W. Wen Y. Cai X. You J. Ma J. Ding Y. Chen L. Electrophoresis. 2014;35:474–481. doi: 10.1002/elps.201300409. [DOI] [PubMed] [Google Scholar]
- Zhang R. Zhuang X. Liu S. Song F. Liu Z. Anal. Methods. 2014;6:5746–5752. doi: 10.1039/C4AY00771A. [DOI] [Google Scholar]
- Lin Y.-H. Tseng W.-L. Anal. Chem. 2010;82:9194–9200. doi: 10.1021/ac101427y. [DOI] [PubMed] [Google Scholar]
- Huang C.-C. Chang H.-T. Chem. Commun. 2007:1215–1217. doi: 10.1039/B615383F. [DOI] [PubMed] [Google Scholar]
- Poornima V. Alexandar V. Iswariya S. Perumal P. T. Uma T. S. RSC Adv. 2016;6:46711–46722. doi: 10.1039/C6RA04433F. [DOI] [Google Scholar]
- Turkevich J. Stevenson P. C. Hillier J. Discuss. Faraday Soc. 1951;11:55–75. doi: 10.1039/DF9511100055. [DOI] [Google Scholar]
- Brust M. Walker M. Bethell D. Schiffrin D. J. Whyman R. J. Chem. Soc., Chem. Commun. 1994:801–802. doi: 10.1039/C39940000801. [DOI] [Google Scholar]
- Lee H. C. Chen T. H. Tseng W. L. Lin C. H. Analyst. 2012;137:5352–5357. doi: 10.1039/C2AN35586H. [DOI] [PubMed] [Google Scholar]
- Balasubramanian S. K. Yang L. Yung L.-Y. L. Ong C.-N. Ong W.-Y. Liya E. Y. Biomaterials. 2010;31:9023–9030. doi: 10.1016/j.biomaterials.2010.08.012. [DOI] [PubMed] [Google Scholar]
- Sweeney S. F. Woehrle G. H. Hutchison J. E. J. Am. Chem. Soc. 2006;128:3190–3197. doi: 10.1021/ja0558241. [DOI] [PubMed] [Google Scholar]
- Chen Q. Li J. Li Y. J. Phys. D: Appl. Phys. 2015;48:424005. doi: 10.1088/0022-3727/48/42/424005. [DOI] [Google Scholar]
- Xu X. Li Y.-F. Zhao J. Li Y. Lin J. Li B. Gao Y. Chen C. Analyst. 2015;140:7841–7853. doi: 10.1039/C5AN01519G. [DOI] [PubMed] [Google Scholar]
- Liu X. Wu Z. Zhang Q. Zhao W. Zong C. Gai H. Anal. Chem. 2016;88:2119–2124. doi: 10.1021/acs.analchem.5b03653. [DOI] [PubMed] [Google Scholar]
- Lin C.-Y. Yu C.-J. Lin Y.-H. Tseng W.-L. Anal. Chem. 2010;82:6830–6837. doi: 10.1021/ac1007909. [DOI] [PubMed] [Google Scholar]
- Kim Y. Johnson R. C. Hupp J. T. Nano Lett. 2001;1:165–167. doi: 10.1021/nl0100116. [DOI] [Google Scholar]
- Boken J. Soni S. K. Kumar D. Crit. Rev. Anal. Chem. 2016;46:538–561. doi: 10.1080/10408347.2016.1169912. [DOI] [PubMed] [Google Scholar]
- Ma J. Lee S. M. Yi C. Li C. W. Lab Chip. 2017;17:209–226. doi: 10.1039/C6LC01049K. [DOI] [PubMed] [Google Scholar]
- Lee J.-S. Mirkin C. A. Anal. Chem. 2008;80:6805–6808. doi: 10.1021/ac801046a. [DOI] [PubMed] [Google Scholar]
- Chen Q. Kaneko T. Hatakeyama R. Appl. Phys. Express. 2012;5:086201. doi: 10.1143/APEX.5.086201. [DOI] [Google Scholar]
- Hart E. J. and Anbar M., The Hydrated Electron, New York-London, 1970 [Google Scholar]
- Sudare T. Ueno T. Watthanaphanit A. Saito N. Phys. Chem. Chem. Phys. 2015;17:30255–30259. doi: 10.1039/C5CP05168A. [DOI] [PubMed] [Google Scholar]
- LaVerne J. A. Yoshida H. J. Phys. Chem. 1993;97:10720–10724. doi: 10.1021/j100143a033. [DOI] [Google Scholar]
- Shirai N. Uchida S. Tochikubo F. Jpn. J. Appl. Phys. 2014;53:046202. doi: 10.7567/JJAP.53.046202. [DOI] [Google Scholar]
- Lin Y. W. Huang C. C. Chang H. T. Analyst. 2011;136:863–871. doi: 10.1039/C0AN00652A. [DOI] [PubMed] [Google Scholar]
- Mie G. Ann. Phys. 1908;25(3):377–445. doi: 10.1002/andp.19083300302. [DOI] [Google Scholar]
- Lin C. H. Chao C. H. Lan C. W. Sens. Actuators, B. 2007;121:698–705. doi: 10.1016/j.snb.2006.04.086. [DOI] [Google Scholar]
- Doak J. Gupta R. Manivannan K. Ghosh K. Kahol P. Phys. E. 2010;42:1605–1609. doi: 10.1016/j.physe.2010.01.004. [DOI] [Google Scholar]
- Liu W. Y. Shen S. L. Li H. Y. Miao J. Y. Zhao B. X. Anal. Chim. Acta. 2013;791:65–71. doi: 10.1016/j.aca.2013.07.022. [DOI] [PubMed] [Google Scholar]
- Liu H. Y. Zhang L. N. Li M. Yan M. Xue M. Zhang Y. Su M. Yu J. H. Ge S. G. RSC Adv. 2016;6:26147–26154. doi: 10.1039/C6RA02531E. [DOI] [Google Scholar]
Associated Data
This section collects any data citations, data availability statements, or supplementary materials included in this article.


