Abstract
Nanofiber membranes display promising potential in biomedical fields, especially as scaffolds for drug delivery and tissue engineering. The structures and components of nanofibers play crucial roles in improving the mechanical properties and drug-releasing performance of nanofiber membranes. In this work, poly(lactic acid) (PLA)/graphene oxide (GO) nanofiber membranes with different structures (single-axial and co-axial structure) were prepared by electrospinning. The morphologies, structures, and mechanical properties of the as-prepared nanofiber membranes were characterized and compared. Furthermore, the drug-releasing performance of the as-prepared nanofiber membranes with different structures was evaluated by using an organic dye (Rhodamine B, RhB) as a drug model. Results show that the addition of GO not only significantly improved the thermal stability and mechanical properties of the PLA nanofiber membranes, but also promoted the cumulative release and release rate of RhB from nanofiber membranes. At the same GO concentration, the nanofiber membrane with the co-axial structure displayed a higher tensile strength and Young's modulus, but exhibited a lower cumulative release and release rate. The formation of the co-axial structure is beneficial in suppressing the initial burst release of RhB from nanofiber membranes.
PLA/GO nanofiber membrane with the co-axial structure exhibited the improved mechanical properties, which is also beneficial to separately loading different drugs in core-/sheath-structure and suppressing the initial burst release of drugs.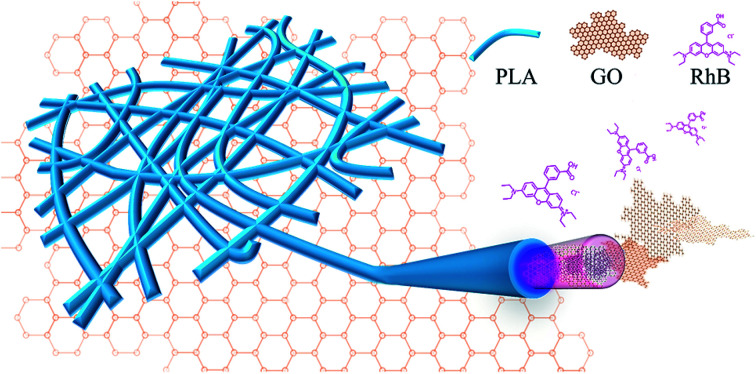
Introduction
Nanofiber membranes prepared by electrospinning have attracted considerable attention in biomedical fields, especially as scaffolds for tissue engineering1–5 and drug delivery,6–9 because of their high porosity, distinctive surface area, and ability to mimic the structures of extracellular matrixes. However, the low mechanical strength of nanofiber membranes leads to poor operability and thus greatly hinders their clinical application. Meanwhile, controlling the loading and releasing of drugs when nanofiber membranes are used as scaffolds for tissue engineering and drug delivery remains a challenge.
It has been known that the structures and components of electrospun nanofibers play a crucial role in improving the mechanical strength and drug loading/releasing performance of nanofiber membranes. Co-axial electrospinning can provide an effective method for fabricating continuous composite nanofibers with a core-sheath structure by using a spinneret with double co-axial or other capillaries.10 Nanofiber membranes with co-axial structures have been widely studied in the field of energy storage11–13 instead of biomedical fields. In fact, core-sheath structures formed by co-axial electrospinning are effective alternatives for the encapsulation of therapeutic drugs into polymer nanofiber membranes, and for the protection of drugs during loading and releasing. More important, two different drugs can even be loaded in the core and sheath structures and subsequently released from co-axial nanofiber membranes synchronously or asynchronously.4,14–17
Graphene oxide (GO) has demonstrated potential applications in biomedical fields, such as tissue engineering scaffolds, drug delivery carriers, cell imaging, and wearable medical devices.3,4,18–21 The large specific surface area and abundance of functional groups dispersed on the surfaces of GO nanosheets (such as epoxy, hydroxyl or carboxylic moieties) greatly facilitate the loading of various drugs.22,23 Additionally, GO improves effective transport capacity24 and is easy uptaken by cells25,26 and thus a suitable candidate as a drug delivery carrier.27–29 On the other hand, graphene and its derivatives exhibit exceptional mechanical property and consequently have been extensively utilized as an effective reinforcer for improving the mechanical performance of various polymers.30–34 For example, it was reported that the tensile strength of GO-loaded PVA nanofibers increases from 0.22 MPa to 9.37 and 14.39 MPa when 0.02 wt% and 0.04 wt% of GO was added into pure PVA, respectively.30 When 0.1 wt% of GO is added in PCL scaffolds, tensile strength increases to over 160%, and elastic modulus increases to over 103%.33 However, excessive GO in polymers has negative effects on mechanical properties.33–37 For example, tensile strength and elasticity modulus increase when GO concentration is lower than 1 wt%, but decreases when the concentration increases to 3 wt% and 5 wt%.35
In this work, poly(lactic acid) (PLA)/GO nanofiber membranes with different structures (single-axial and co-axial structures) were prepared by electrospinning. The morphologies and structures of the as-prepared nanofiber membranes were characterized through SEM, Raman, and DTG-TGA. The mechanical properties and drug-releasing performance of as-prepared nanofiber membranes with different GO concentrations and different structures (single-axial and co-axial structure) were compared. Rhodamine B (RhB) was used as a drug model because its fluorescence can be facilely observed and measured.
Experimental
Materials
PLA (inherent viscosity 2.67 dl g−1 is measured at 0.1% w/v in CHCl3 at 25 °C, Mn 470 000) were purchased from Jinan Daigang Biomaterial Co., Ltd (Shandong, China). Dichloromethane (DCM), N,N-dimethylformamide (DMF), were of analytical reagent (Sinopharm Chemical Reagent Co., Ltd., Shanghai, China). All reagents were used as received without further purification. Deionized water (16 MΩ cm) was obtained from a Nanopure Water Systems UV (Thomas Scientific, Swedesboro, NJ).
Preparation of electrospinning solutions
Graphene oxide (GO) was prepared according to the modified Hummers' method.36 The PLA solution with a concentration of 8 wt% was prepared by dissolving in DMF/DCM (volume ratio 1 : 1) and stirred at room temperature for one night, then leave it for 1 h to let the bubbles disappear. GO was dispersed in DMF under ultrasonication.
Electrospinning processing
Co-axial electrospinning was performed with an electrospinning machine (SS-2535H, Ucalery, China) and specialty spinneret, which consisted of an inner needle (inside diameter: 0.34 mm, outside diameter: 0.63 mm) and an outer needle (inside diameter: 1.12 mm, outside diameter: 1.48 mm). The former was coaxially placed inside the latter. Two syringe pumps worked independently for injecting core and sheath solutions through the inner and outer spinnerets (needles). To avoid air bubbles, spinning solutions were carefully loaded in a 2 mL syringe. The electrospinning machine was operated at 8.5 KV, and a metallic roller attached with a −2.5 KV collected the nanofibers. The distance between the spinneret and the collector was 20 cm. The process was performed at room temperature (25 °C) with a humidity of approximately 50%. The flow rates of the core and sheath solutions were 0.06 mL h−1 and 0.8 mL h−1, respectively. The as-prepared membranes were placed in a vacuum oven at 30 °C for 12 h for the removal of residual solvent. Table 1 lists the parameters of the electrospinning processes.
The experimental parameters used for the electrospinning preparation of various nanofiber membranesa.
| Sample | Core | Sheath | Voltage | Injecting Speed |
|---|---|---|---|---|
| P | 8% PLA | +8.5 kV to 2.5 kV | 0.86 mL h−1 | |
| S15 | 8% PLA + 15 mg mL−1 GO | +8.5 kV to 2.5 kV | 0.86 mL h−1 | |
| C5 | 5 mg mL−1 GO | 8% PLA | +8.5 kV to 2.5 kV | 0.06 mL h−1 @ 0.8 mL h−1 |
| C15 | 15 mg mL−1 GO | 8% PLA | +8.5 kV to 2.5 kV | 0.06 mL h−1 @ 0.8 mL h−1 |
| C25 | 25 mg mL−1 GO | 8% PLA | +8.5 kV to 2.5 kV | 0.06 mL h−1 @ 0.8 mL h−1 |
P = pure PLA; S15 = single-axial structure with 15 mg mL−1 of GO; C5 = co-axial structure with 5 mg mL−1 of GO; C15 = co-axial structure with 15 mg mL−1 of GO; C25 = co-axial structure with 25 mg mL−1 of GO.
Characterizations
Surface topography of the nanofiber membranes was observed using field emission scanning electron microscope (FESEM; S4800, Hitachi, Japan). Mechanical properties of the as-prepared nanofiber membranes were measured on a mechanical testing machine (Instron (TM) ElectroPuls E1000, America) with a load speed of 1 mm s−1. All the samples were prepared in a rectangular shape of 50 × 15 mm. At both ends of the sample two paper stripes were coated both sides in order to connect the sample to the jaws of the tensile tester. The thickness of the sample was measured through a digital micrometer with a precision of 0.001 mm, and five samples for each group were tested to calculate the mean value and standard deviation. The DSC data were obtained using a simultaneous thermal analysis instrument (STA STA449F3, NETZSCH, Germany), in a temperature range from 30 to 700 °C with a heating rate of 10°C min−1 in nitrogen atmosphere. The Raman spectra of the samples were recorded by a Raman spectrometer with a 633 nm laser excitation (VERTEX 70, Bruker, Germany).
RhB release behavior of electrospun nanofiber membranes
In this study, RhB was used as a prototype for evaluating the release profiles of drugs from the as-prepared nanofiber membranes. The membranes were cut into one piece to avoid disrupting the structure, and then immersed in PBS in a shaking table (HZQ-F160 Taichang Medical Apparatus Co., Jiangsu, China) at constant temperature (37 °C) and shaking speed (100 rpm). 100 μL of solution was taken from the dissolution medium at different time intervals after incubation, whereas an equal amount of fresh PBS was added back to the incubation solution. The amount of RhB was detected with a Multiscan Spectrum (Multiskan GO, 1510, Finland), and a maximal absorption peak of 552 nm was observed within the designed period. Meanwhile, standard samples (RhB in PBS) with a concentration from 0 mg mL−1 to 0.01 mg mL−1 were incubated and tested under the same conditions. The standard curve with a linear correlation was calculated subsequently (γ2 > 0.99).
Results and discussion
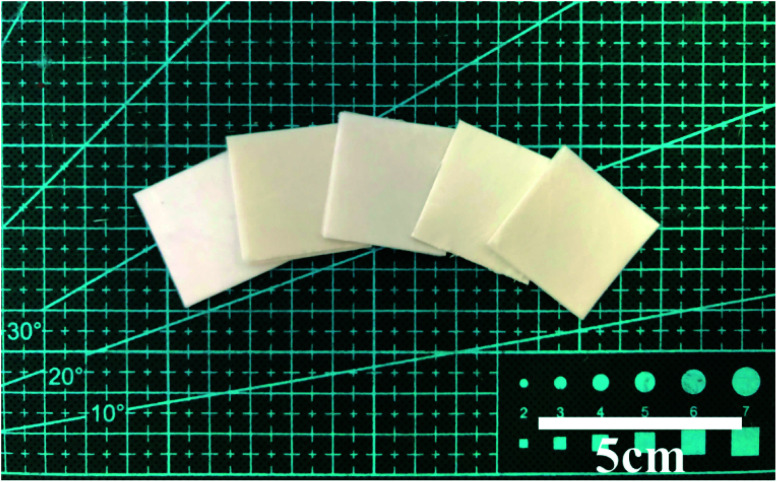
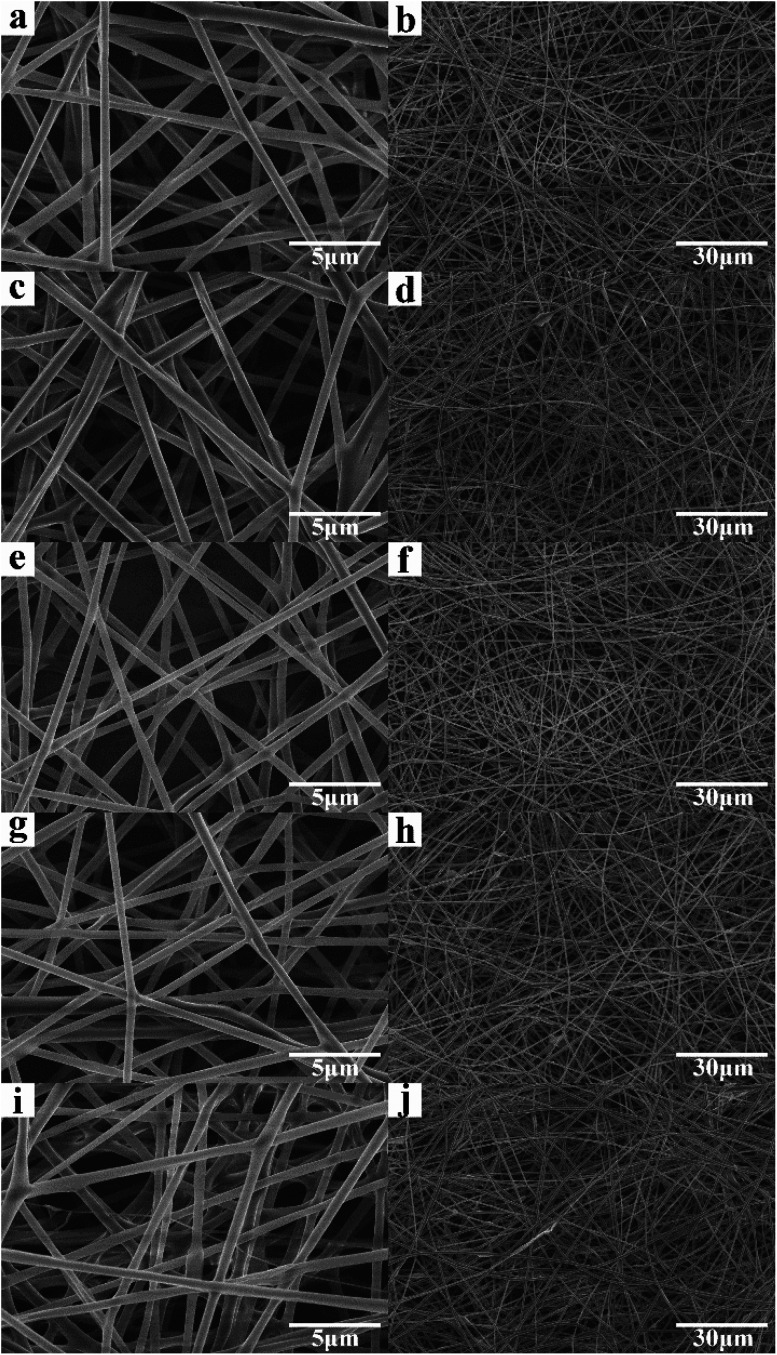
Fig. 1 shows the optical images of the as-prepared nanofiber membranes. It is obvious that the colours of nanofiber membranes became darker (from left to right) with the increase of GO concentration, implying that GO was successfully added into the PLA nanofiber membranes. Fig. 2 shows the SEM images of the as-prepared nanofiber membranes. The continuous and uniform nanofibers with smooth surface were observed in the P, S15, C5, and C15 samples. By contrast, the nanofibers of C25 displayed large size distributions.
Fig. 1. Optical images of P, S15, C5, C15, and C25.
Fig. 2. SEM images of the as-prepared nanofiber membranes. (a and b) P, (c and d) S15, (e and f) C5, (g and h) C15, and (i and j) C25.
The average diameters of the nanofibers were approximately 432.5 ± 22.6 nm, 458.7 ± 56.3 nm, 464.3 ± 57.6 nm, 472.6 ± 79.2 nm, and 549.7 ± 153.1 nm for P, S15, C5, and C25, respectively. These results suggest that the addition of GO increased the average diameter of the nanofibers. At the same GO concentration, the average diameter of nanofibers with co-axial structures was larger than that with single-axial structures. No GO nanosheet was observed on the surface of the as-prepared PLA/GO nanofiber membranes, indicating that GO was successfully mixed or encapsulated in the PLA nanofibers.
It is well known that the electrospinning nanofibers are affected by many factors, including (a) the solution parameters, such as viscosity, conductivity, and surface tension; (b) electrospinning parameters, such as working voltage, distance between the tip and the collector, and polymer flow rate; (c) ambient parameters, such as temperature, humidity, etc.37–39 Solvents greatly affects the viscosity, conductivity, and surface tension of the electrospinning solution. These factors subsequently affect the diameter, the surface structure, and the morphology of the electrospinning fibers. The average fiber diameter tends to decrease with the increase of the distance without changing other electrospinning parameters.37 In this work, the nanofiber membranes were electrospun by using DCM and DMF as the solvents at a constant distance. The influence of the distance and the solvents on the morphology and the diameter of the nanofibers need to be further investigated.
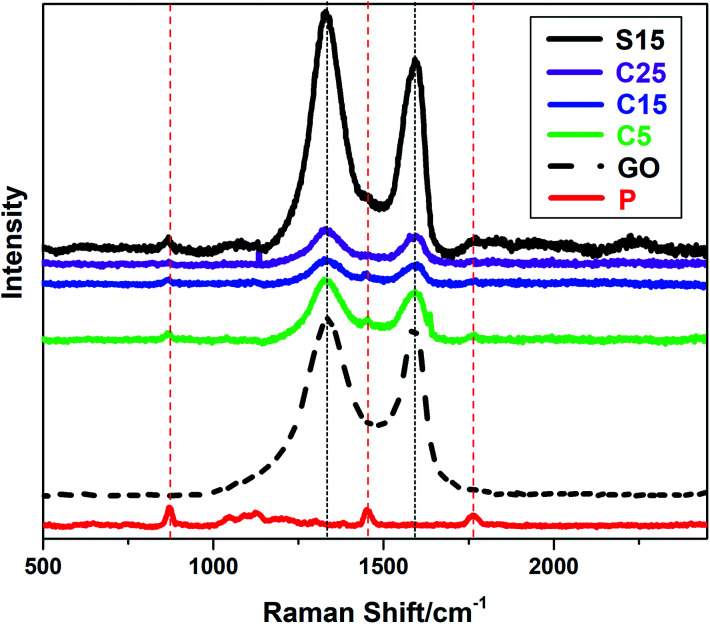
The incorporation of GO into PLA nanofibers was confirmed by Raman spectra as shown in Fig. 3. The Raman peaks at approximately 1340 and 1600 cm−1 can be indexed to the characteristic D and G bands of GO, respectively. The peak at approximately 1766 cm−1 can be attributed to the C O stretching of the carboxyl group in the PLA molecules. The other two peaks at approximately 1450 and 869 cm−1 represent the CH3 asymmetric deformation mode and C–COO stretching vibration of the repeated unit, respectively.40 It is worth noting that the characteristic D and G bands of GO are weaker in nanofiber membranes with co-axial structures than those with single-axial structures, even when the nanofibers have the same or higher GO contents. The PLA sheaths of the nanofibers may have decreased the Raman absorption of GO in the core of the nanofibers. These results also provide an indicative evidence for the formation of co-axial structures.
Fig. 3. Raman spectra of the as-prepared samples (P, S15, C5, C15, C25 and GO).
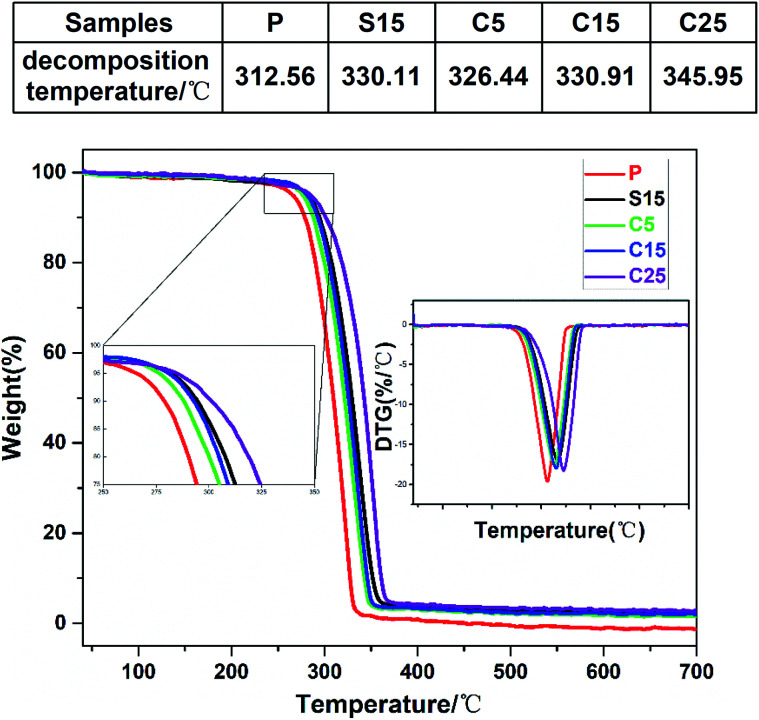
The thermal stabilities of the as-prepared nanofiber membranes were characterized through DTG-TGA analysis. Fig. 4 shows the TGA and DTG curves of the as-prepared nanofiber membranes. The exothermic peaks were derived from the thermal decomposition of PLA, which can be divided into three stages, namely, PLA dehydration, thermal fracture of molecular chain, and thermal scission of adjacent C–O bonds.41 The thermal degradation temperature of the as-prepared nanofiber membranes corresponding to 50% of weight loss ranged from 310 °C to 350 °C. The thermal decomposition temperatures of the samples containing GO were significantly higher than that of pure PLA nanofiber membrane.
Fig. 4. TGA and DTG curves of as-prepared samples (P, S15, C5, C15, and C25). The upper table shows the decomposition temperature.
Unsurprisingly, the thermal decomposition temperatures of the nanofiber membrane were enhanced with the increase of GO contents in the nanofibers. Meanwhile, the peak decomposition temperature corresponding to the maximum weight loss rate in the DTG curve was approximately 346.0 °C for the C25, which was 33.4 °C higher than that of pure PLA nanofiber membrane (312.6 °C). The peak decomposition temperatures of the nanofiber membranes with co-axial structures were also enhanced with the increase of GO content (i.e., 326.4 °C, 330.1 °C, 330.9 °C, and 346.0 °C for C5, S15, C15, and C25, respectively). The high chain compactness derived from the interaction between the PLA chains and GO was speculated to improve the thermal stabilities of the coaxial nanofiber membranes.42 The similar peak decomposition temperature for S15 and C15 implies the similar thermal performance between the single-axial and co-axial structures.
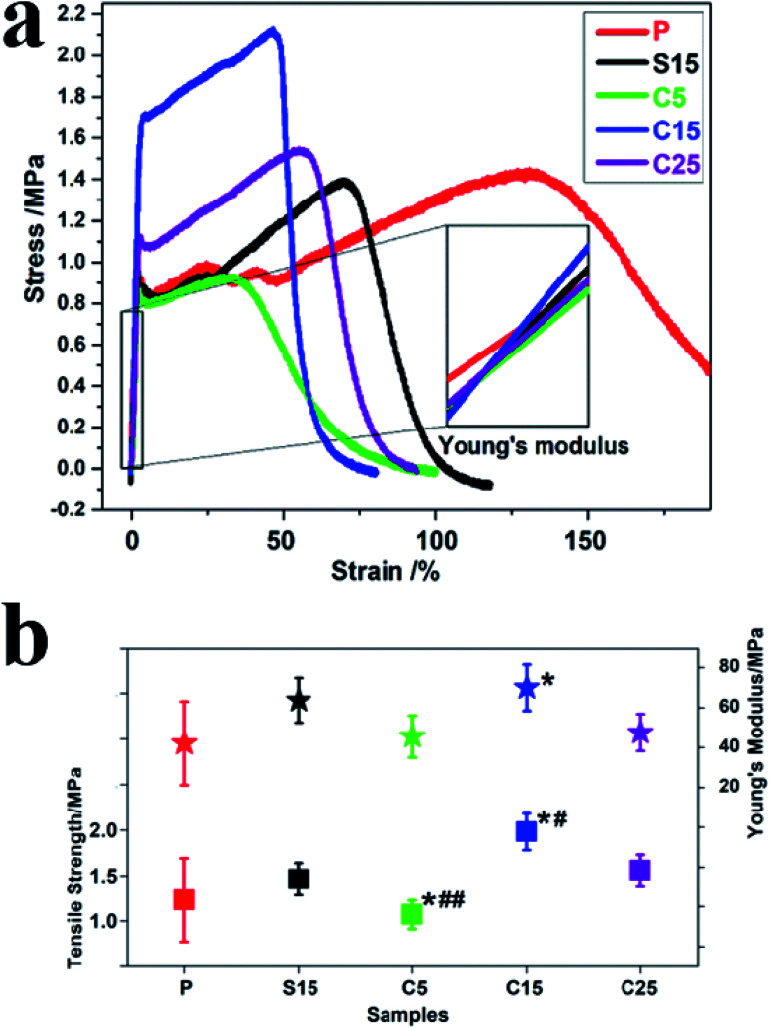
Fig. 5a and b show the typical tensile stress–strain curves, tensile strengths, and breaking elongation of the as-prepared nanofiber membranes. The strengths of polymer materials can be reinforced and their ductilities are compromised with the addition of rigid fillers.40 The addition of GO greatly improves tensile stress but decreases the ductility with a low breaking elongation.40 In this work, the tensile strength of the sample P was approximately 1.23 ± 0.46 MPa, which increased to approximately 1.98 ± 0.20 and 1.56 ± 0.17 MPa, corresponding to the samples C15 and C25, respectively. Furthermore, at the same GO concentration, the tensile strengths of the nanofiber membranes with co-axial structures were approximately 35.6% higher than that with single-axial structures.
Fig. 5. (a) Stress–strain curves of P, S15, C5, C15, and C25. The inset shows the slope line of each curve; (b) tensile strength and Young's modulus of the as-prepared nanofiber membranes. Data are presented as means ± SD (n = 5). The significant difference compared to the control and S15 is marked with the symbol (*) and (#), respectively. (*) and (#) mean p < 0.05, while (**) and (##) mean p < 0.01.
Young's modulus was calculated from the slope of the straight-line portion of the stress–strain diagram, which is usually used for evaluating the stiffness of solid materials. As shown in Fig. 5b, the variation trend was the same as the tensile strength. The Young's moduli were approximately 42.13 ± 20.92, 63.65 ± 11.15, 45.55 ± 10.47, 73.00 ± 11.52, and 47.55 ± 19.21 MPa, for samples P, S15, C5, C15, and C25, respectively. Among these samples, C15 displayed the highest Young's modulus, which was approximately 1.73 times higher than that of pure PLA nanofiber membrane. Meanwhile, the Young's modulus of C15 was approximately 14.69% higher than that of S15, although the same concentration of GO was used for electrospinning. The uniform dispersion, orientation, and interfacial adhesion of GO in the polymers is beneficial in improving their mechanical properties.43 Excessive GO in polymers hinders the formation of uniform structures and the synergistic enhancement of mechanical properties. These results indicate that GO concentration and nanofiber structure both significantly affect the mechanical properties of nanofiber membranes.
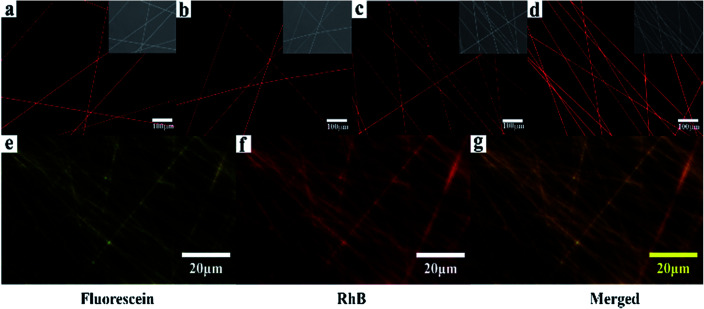
The loading and releasing of drugs by the as-prepared nanofiber membranes were evaluated by using RhB as a model. The co-axial PLA nanofiber membrane with RhB was prepared for comparison and marked as C0. Fig. 6a–d shows the fluorescent microscopy images of the nanofiber membranes loaded with RhB. All the samples show red and continuous fluorescence along the nanofibers, indicating that RhB was successfully encapsulated in the nanofibers. In order to illustrate the separated encapsulation of two different drugs in the core and sheath structures, fluorescein and RhB were separately added in the core and sheath solutions for electrospinning. Fig. 6g–i shows continuous green and red fluorescence along the nanofibers, demonstrating that RhB and fluorescein were successfully encapsulated in the different structures of the nanofibers.
Fig. 6. (a)–(d) Fluorescent images of the samples (P, S15, C0, and C15) loaded with RhB; (g)–(i) Fluorescent images of C15 separately loaded with fluorescein in the sheath and RhB in the core.
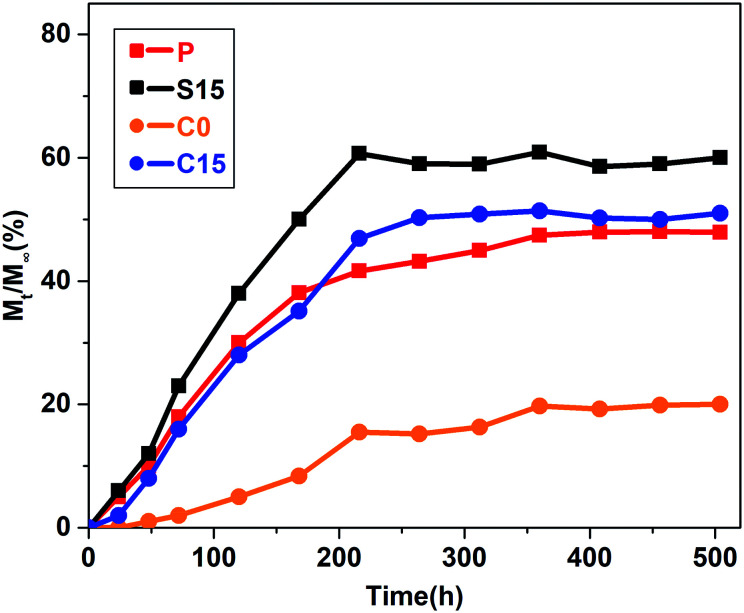
Fig. 7 illustrates the releasing curves of RhB from the nanofiber membranes at different time intervals (1, 2, 3, 5, 7, 9, 11, 13, 15, 17, 19, and 21 days). RhB was slowly released from the nanofiber membranes and reached a plateau state after 9 days. No significant burst release phenomenon was observed in the C15 and C0 groups in contrast to those in the P and S15 groups. The total cumulative releases of RhB at the end of 21 days were approximately 47.9%, 60.9%, 19.7%, and 51.4% for the P, S15, C0, and C15 groups, respectively. These results demonstrate that the addition of GO significantly improves the release of RhB from the nanofiber membranes, whereas the formation of coaxial structures is beneficial in suppressing the initial burst release of RhB from nanofiber membranes.
Fig. 7. The release curves of the samples.
In order to understand the release mechanism, the Korsmeyer–Peppas model (a semi-empirical model correlating drug release with time through a simple exponential equation for a drug release fraction <0.6) was used to evaluate RhB release from the nanofiber membranes.44 The Korsmeyer–Peppas model is expressed as follows: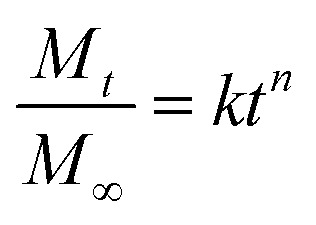 where, Mt/M∞ is the proportion of RhB released at time t, k is the kinetic constant, and the exponent n is proposed as indicative of the release mechanism (the Fickian and non-Fickian behaviors). In the case of cylindrical sample, n ≤ 0.45 represents a Fickian release (case I transport); n = 0.89 represents a case II transport (a purely relaxation-controlled delivery); 0.45 < n < 0.89 represents a non-Fickian release (an anomalous behavior corresponding to coupled diffusion/polymer relaxation); and n > 0.89 represents super case II transport.45–48
Table 2 shows that n values, the Pearson coefficient (r2) and the diffusion constant (k) for RhB released in buffer solutions. Results show that the release of RhB in buffer solution displayed the different behaviors depending on the structure of the nanofibers. Release behavior in P and S15 exhibited non-Fickian kinetics, corresponding to coupled diffusion/polymer relaxation. Then value of C0 and C15 were higher than 0.89, indicating that the diffusional release of C0 and C15 was agreed with the super case-II transport. This can be explained by controlling drug release from core–sheath structure through matrix-swelling and/or matrix-relaxation.49,50 The k values were related to the release kinetics of RhB, i.e. a lower k value indicates a slower release. The k values were approximately 6.777 × 10⁻³, 7.905 × 10⁻³, 0.169 × 10⁻³, and 1.717 × 10⁻³ h−n for P, S15, C0, and C15, respectively. The release rates were in order of S15>P > C15>C0. These results indicate that both the formation of the core-sheath structure and the incorporation of GO greatly influence the release rate of RhB from the nanofiber membranes.
The kinetic parameters of RhB released from the nanofiber membranes calculated according to the Korsmeyer-Peppas model.
| Samples | n | k (×10−3 h−n) | r 2 |
|---|---|---|---|
| P | 0.7462 | 6.777 | 0.8911 |
| S15 | 0.7283 | 7.905 | 0.9162 |
| C0 | 0.9807 | 0.169 | 0.8852 |
| C15 | 1.1837 | 1.717 | 0.9449 |
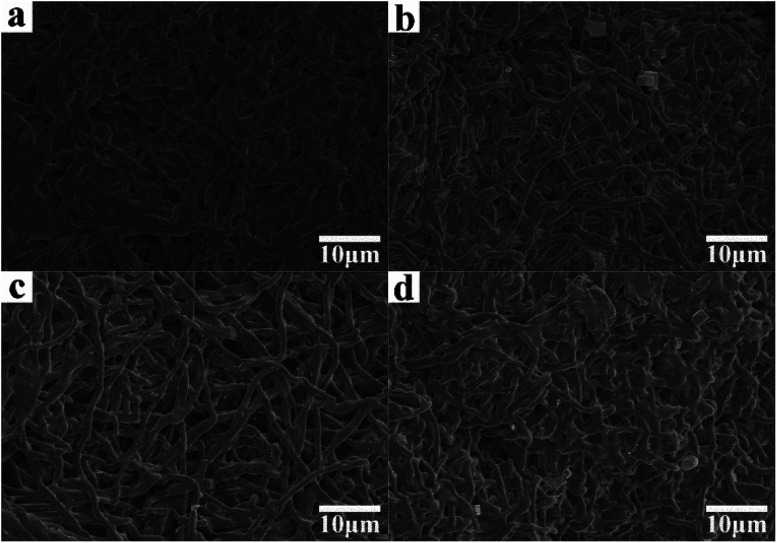
Fig. 8 shows the SEM images of the as-prepared nanofiber membranes after degradation for 21 days. The diameters of the nanofibers increased because of swelling, and significant structure collapse was observed due to PLA degradation.
Fig. 8. SEM images of as-prepared nanofiber membranes after degradation for 21 days. (a) P; (b) S15; (c) C0; (d) C15.
Conclusions
In summary, a series of PLA/GO nanofiber membranes with different structures were prepared by electrospinning. The addition of GO at different concentrations significantly improved the mechanical properties and thermal stabilities of the nanofiber membranes. At the same GO concentration, the nanofiber membrane with a co-axial structure displayed a higher tensile strength and Young's modulus than that with a single-axial structure. Furthermore, the drug loading and release by the nanofiber membranes were evaluated by using RhB and fluorescein as the drug models. Results show that two different drugs can be separately encapsulated in the core and sheath structures of the nanofibers with co-axial structures. The addition of GO significantly promoted the release of RhB from the nanofiber membranes. At the same GO concentration, the cumulative release and release rate of RhB by the nanofiber membrane with a single-axial structure was higher than that by the nanofiber membrane with a co-axial structure. However, the formation of the co-axial structure is beneficial in suppressing the initial burst release of RhB from the nanofiber membranes. These results demonstrate the promising potential for various polymer/GO nanofiber membranes with different structures as scaffolds in drug delivery and tissue engineering.
Conflicts of interest
There are no conflicts to declare.
Supplementary Material
Acknowledgments
The authors gratefully acknowledge financial support from National Key R&D Program of China (No. 2017YC1103800).
Notes and references
- Sill T. J. von Recum H. A. Biomaterials. 2008;29:1989–2006. doi: 10.1016/j.biomaterials.2008.01.011. [DOI] [PubMed] [Google Scholar]
- Zhang H. Jia X. Han F. Zhao J. Zhao Y. Fan Y. Yuan X. Biomaterials. 2013;34:2202–2212. doi: 10.1016/j.biomaterials.2012.12.005. [DOI] [PubMed] [Google Scholar]
- Sheikh F. A. Ju H. W. Lee J. M. Moon B. M. Park H. J. Lee O. J. Kim J. H. Kim D. K. Park C. H. Nanomedicine. 2015;11:681–691. doi: 10.1016/j.nano.2014.11.007. [DOI] [PubMed] [Google Scholar]
- Tang Y. Chen L. Zhao K. Wu Z. Wang Y. Tan Q. Compos. Sci. Technol. 2016;125:100–107. doi: 10.1016/j.compscitech.2016.02.005. [DOI] [Google Scholar]
- Scaffaro R. Maio A. Lopresti F. Botta L. Polymers. 2017;9:76. doi: 10.3390/polym9020076. [DOI] [PMC free article] [PubMed] [Google Scholar]
- Sridhar R. Lakshminarayanan R. Madhaiyan K. Amutha Barathi V. Lim K. H. Ramakrishna S. Chem. Soc. Rev. 2015;44:790–814. doi: 10.1039/C4CS00226A. [DOI] [PubMed] [Google Scholar]
- Huang Z.-M. Zhang Y. Z. Kotaki M. Ramakrishna S. Compos. Sci. Technol. 2003;63:2223–2253. doi: 10.1016/S0266-3538(03)00178-7. [DOI] [Google Scholar]
- Liao I. C. Chew S. Y. Leong K. W. Nanomedicine. 2006;1:465–471. doi: 10.2217/17435889.1.4.465. [DOI] [PubMed] [Google Scholar]
- He C. L. Huang Z. M. Han X. J. Liu L. Zhang H. S. Chen L. S. J. Macromol. Sci., Part B: Phys. 2006;45:515–524. doi: 10.1080/00222340600769832. [DOI] [Google Scholar]
- Sun Z. Zussman E. Yarin A. L. Wendorff J. H. Greiner A. Adv. Mater. 2003;15:1929–1932. doi: 10.1002/adma.200305136. [DOI] [Google Scholar]
- Le V. T. Kim H. Ghosh A. Kim J. Chang J. Vu Q. A. Pham D. T. Lee J. H. Kim S. W. Lee Y. H. ACS Nano. 2013;7:5940–5947. doi: 10.1021/nn4016345. [DOI] [PubMed] [Google Scholar]
- Zhang G. Wu H. B. Hoster H. E. Lou X. W. Energy Environ. Sci. 2014;7:302–305. [Google Scholar]
- Eftekhari A. Li L. Yang Y. J. Power Sources. 2017;347:86–107. doi: 10.1016/j.jpowsour.2017.02.054. [DOI] [Google Scholar]
- Chou S. F. Carson D. Woodrow K. A. J. Controlled Release. 2015;220:584–591. doi: 10.1016/j.jconrel.2015.09.008. [DOI] [PMC free article] [PubMed] [Google Scholar]
- Chakraborty S. Liao I. C. Adler A. Leong K. W. Adv. Drug Delivery Rev. 2009;61:1043–1054. doi: 10.1016/j.addr.2009.07.013. [DOI] [PMC free article] [PubMed] [Google Scholar]
- Yu D. G. Zhu L. M. Branford-White C. J. Yang J. H. Wang X. Li Y. Qian W. Int. J. Nanomed. 2011;6:3271–3280. doi: 10.2147/IJN.S27468. [DOI] [PMC free article] [PubMed] [Google Scholar]
- Han D. Steckl A. J. ACS Appl. Mater. Interfaces. 2013;5:8241–8245. doi: 10.1021/am402376c. [DOI] [PubMed] [Google Scholar]
- Cheng C. Li S. Thomas A. Kotov N. A. Haag R. Chem. Rev. 2017;117:1826–1914. doi: 10.1021/acs.chemrev.6b00520. [DOI] [PubMed] [Google Scholar]
- Shin S. R. Li Y. C. Jang H. L. Khoshakhlagh P. Akbari M. Nasajpour A. Zhang Y. S. Tamayol A. Khademhosseini A. Adv. Drug Delivery Rev. 2016;105:255–274. doi: 10.1016/j.addr.2016.03.007. [DOI] [PMC free article] [PubMed] [Google Scholar]
- Reina G. Gonzalez-Dominguez J. M. Criado A. Vazquez E. Bianco A. Prato M. Chem. Soc. Rev. 2017;46:4400–4416. doi: 10.1039/C7CS00363C. [DOI] [PubMed] [Google Scholar]
- Yang K. Feng L. Liu Z. Adv. Drug Delivery Rev. 2016;105:228–241. doi: 10.1016/j.addr.2016.05.015. [DOI] [PubMed] [Google Scholar]
- Dreyer D. R. Park S. Bielawski C. W. Ruoff R. S. Chem. Soc. Rev. 2010;39:228–240. doi: 10.1039/B917103G. [DOI] [PubMed] [Google Scholar]
- Rao C. N. R. Biswas K. Subrahmanyam K. S. Govindaraj A. J. Mater. Chem. 2009;19:2457. doi: 10.1039/B815239J. [DOI] [Google Scholar]
- Sun X. Liu Z. Welsher K. Robinson J. T. Goodwin A. Zaric S. Dai H. Nano Res. 2008;1:203–212. doi: 10.1007/s12274-008-8021-8. [DOI] [PMC free article] [PubMed] [Google Scholar]
- Wang Y. Li Z. H. Hu D. H. Lin C. T. Li J. H. Lin Y. H. J. Am. Chem. Soc. 2010;132:9274–9276. doi: 10.1021/ja103169v. [DOI] [PubMed] [Google Scholar]
- Kam N. W. Liu Z. Dai H. Angew. Chem. 2006;45:577–581. doi: 10.1002/anie.200503389. [DOI] [PubMed] [Google Scholar]
- Yang H. Bremner D. H. Tao L. Li H. Hu J. Zhu L. Carbohydr. Polym. 2016;135:72–78. doi: 10.1016/j.carbpol.2015.08.058. [DOI] [PubMed] [Google Scholar]
- Zhou T. Zhou X. Xing D. Biomaterials. 2014;35:4185–4194. doi: 10.1016/j.biomaterials.2014.01.044. [DOI] [PubMed] [Google Scholar]
- Yang K. Feng L. Shi X. Liu Z. Chem. Soc. Rev. 2013;42:530–547. doi: 10.1039/C2CS35342C. [DOI] [PubMed] [Google Scholar]
- Ma B. Li Y. Zhao J. Li X. Xin W. J. Appl. Polym. Sci. 2013;127:3026–3032. doi: 10.1002/app.37656. [DOI] [Google Scholar]
- Yoon O. J. Jung C. Y. Sohn I. Y. Kim H. J. Hong B. Jhon M. S. Lee N.-E. Composites, Part A. 2011;42:1978–1984. doi: 10.1016/j.compositesa.2011.08.023. [DOI] [Google Scholar]
- Xu Z. Gao C. Macromolecules. 2010;43:6716–6723. doi: 10.1021/ma1009337. [DOI] [Google Scholar]
- Ramazani S. Karimi M. Mater. Sci. Eng., C. 2015;56:325–334. doi: 10.1016/j.msec.2015.06.045. [DOI] [PubMed] [Google Scholar]
- Scaffaro R. Lopresti F. Maio A. Botta L. Rigogliuso S. Ghersi G. Composites, Part A. 2016;92:97–107. doi: 10.1016/j.compositesa.2016.11.005. [DOI] [Google Scholar]
- Qi Y. Y. Tai Z. X. Sun D. F. Chen J. T. Ma H. B. Yan X. B. Liu B. Xue Q. J. J. Appl. Polym. Sci. 2013;127:1885–1894. doi: 10.1002/app.37924. [DOI] [Google Scholar]
- Chen D. Zhao X. Chen S. Li H. Fu X. Wu Q. Li S. Li Y. Su B. L. Ruoff R. S. Carbon. 2014;68:755–762. doi: 10.1016/j.carbon.2013.11.064. [DOI] [Google Scholar]
- Sun B. Long Y. Z. Zhang H. D. Li M. M. Duvail J. L. Jiang X. Y. Yin H. L. Prog. Polym. Sci. 2014;39:862–890. doi: 10.1016/j.progpolymsci.2013.06.002. [DOI] [Google Scholar]
- Baji A. Mai Y. W. Wong S. C. Abtahi M. Chen P. Compos. Sci. Technol. 2010;70:703–718. doi: 10.1016/j.compscitech.2010.01.010. [DOI] [Google Scholar]
- Sill T. J. Recum H. A. V. Biomaterials. 2008;29:1989. doi: 10.1016/j.biomaterials.2008.01.011. [DOI] [PubMed] [Google Scholar]
- Zhang C. Wang L. Zhai T. Wang X. Dan Y. Turng L.-S. J. Mech. Behav. Biomed. Mater. 2016;53:403–413. doi: 10.1016/j.jmbbm.2015.08.043. [DOI] [PubMed] [Google Scholar]
- Yang C. Chen S. Wang J. Zhu T. Xu G. Chen Z. Ma X. Li W. Appl. Surf. Sci. 2016;362:163–168. doi: 10.1016/j.apsusc.2015.11.142. [DOI] [Google Scholar]
- Tan Y. Song Y. Zheng Q. Nanoscale. 2012;4:6997–7005. doi: 10.1039/C2NR32160B. [DOI] [PubMed] [Google Scholar]
- Zhou C. Shi Q. Guo W. Terrell L. Qureshi A. T. Hayes D. J. Wu Q. ACS Appl. Mater. Interfaces. 2013;5:3847. doi: 10.1021/am4005072. [DOI] [PubMed] [Google Scholar]
- Stulzer H. K. Tagliari M. P. Parize A. L. Silva M. A. S. Laranjeira M. C. M. Mater. Sci. Eng., C. 2009;29:387–392. doi: 10.1016/j.msec.2008.07.030. [DOI] [Google Scholar]
- Munday D. L. Cox P. J. Int. J. Pharm. 2000;203:179–192. doi: 10.1016/S0378-5173(00)00444-0. [DOI] [PubMed] [Google Scholar]
- Scaffaro R. Botta L. Maio A. Gallo G. Composites, Part B. 2017;109:138–146. doi: 10.1016/j.compositesb.2016.10.058. [DOI] [Google Scholar]
- Keawchaoon L. Yoksan R. Colloids Surf., B. 2011;84:163–171. doi: 10.1016/j.colsurfb.2010.12.031. [DOI] [PubMed] [Google Scholar]
- Ritger P. L. Peppas N. A. J. Controlled Release. 1987;5:37–42. doi: 10.1016/0168-3659(87)90035-6. [DOI] [Google Scholar]
- Jana S. Samanta A. Nayak A. K. Sen K. K. Jana S. Int. J. Biol. Macromol. 2015;74:85–92. doi: 10.1016/j.ijbiomac.2014.11.027. [DOI] [PubMed] [Google Scholar]
- Fan L. Jin R. Le X. Zhou X. Chen S. Liu H. Xiong Y. Microchim. Acta. 2012;176:381–387. doi: 10.1007/s00604-011-0732-y. [DOI] [Google Scholar]


