Abstract
The dielectric properties of Ca0.85Er0.1Ti1−xCo4x/3O3 (CETCox) (x = 0.00, 0.05 and 0.10), prepared by a sol–gel method, were systematically characterized. The temperature and frequency dependence of the dielectric properties showed a major effect of the grain and grain boundary. The dielectric constant and dielectric loss of CETCox decreased sharply with increasing frequency. This is referred to as the Maxwell–Wagner type of polarization in accordance with Koop's theory. As a function of temperature, the dielectric loss and the real part of permittivity decreased with increasing frequency as well as Co rate. Indeed, a classical ferroelectric behavior was observed for x = 0.00. The non-ferroelectric state of the grain boundary and its correlation with structure, however, proved the existence of a relaxor behavior for x = 0.05 and 0.10. The complex electric modulus analysis M*(ω) confirmed that the relaxation process is thermally activated. The normalized imaginary part of the modulus indicated that the relaxation process is dominated by the short range movement of charge carriers.
Frequency dependence of real (ε′) part of permittivity of CETCox for x = 0.00, 0.05 and 0.10 for T = 600 K.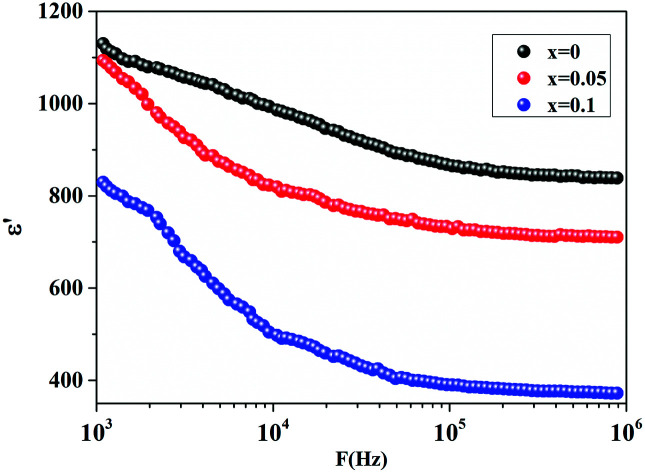
1. Introduction
Perovskite-based ferroelectric materials with the ABO3 chemical formula have been studied owing to their physical properties and their important applications in functional technologies such as actuators, sensors, memories (FRAM), capacitors, micro-electromechanical systems, energy harvesting1 and more recently in opto-electronic devices.2 ABO3 perovskites are the most important materials for piezoelectric, dielectric, ferroelectric and pyroelectric applications.3,4 Relaxor ferroelectric materials are characterized by a high frequency dispersion of dielectric permittivity where the maximum value of the temperature (Tm) of the dielectric constant shifts to higher temperatures and frequencies. The relaxor behavior is usually explained by many theoretical models, such as order-disorder model, micro–macro domain transitions model and dipole inhomogeneity model, as well as certain phenomena such as local random field, dipolar glass and supra-electricity.5,6 CaTiO3 belongs to a class of attractive materials thanks to their technological properties such as ferroelectricity, electro-mechanical-optical conversion, and photoluminescence.7 Due to its properties, CaTiO3 offers a wide range of technological applications and it can be used as a dielectric resonator in wireless communication systems8–10 and photocatalysts or of immobilizing nuclear waste, luminescent (light emitting) devices11–13 and biomaterials.14 Owing to their applications in the miniaturization of electronic devices, the dielectric materials with a high value of dielectric constant (ε′) have recently attracted much attention.15 The high permittivity (ε′) and low dielectric loss (tan δ) of CaTiO3 make it suitable for microwave dielectric applications as filters and resonators.16,17 From the X-ray diffraction, it was observed that calcium titanate (CaTiO3) has a distorted orthorhombic structure. At room temperature, CaTiO3 has a paraelectric phase. It has a dissipation factor (D) ∼10−3 and a dielectric permittivity above 180 at 1 KHz.18 Accordingly this perovskite is classified as an incipient ferroelectric.19 CaTiO3 has been extensively studied due to its interesting structural and dielectric properties. These properties are modified by suitable substitutions in site A (Ca) or site B (Ti).20–25 However, modification at the B-site has attracted surging attention owing to its important effect on the hybridization of the valence states between the O-ion and the B site ion. Among these ions, cobalt is found to be a good dopant which affects the electrical properties and show a continuous improvement in the structures of titanate and manganite perovskite.26 However, a high dielectric loss (tan δ) is a huge obstacle in many applications. Nevertheless, the number of researches devoted to solving the large tan δ problem is still very limited, and the results showed that this problem is very challenging.27,28 Recently, doping barium titanate with cobalt has been proved to lower the temperature of the ferro–paraelectric phase transition and increase the dielectric constant with a low dielectric loss.29,30 These exciting results motivated us to dope cobalt in CaTiO3 as higher dielectric constant materials can be used in capacitive components. In our work, the addition of a small amount of cobalt into CaTiO3 leads to a decrease in its dielectric loss, which makes it suitable for microwave dielectric applications as resonators and filters31 and it can also be used as a host for rare earth ions for efficient luminescence.32 In the present paper, Ca0.85Er0.1Ti1−xCo4x/3O3 (CETCox) (x = 0.00, 0.05 and 0.10), were prepared by sol–gel method. So, the purpose of the present work is to gain a deeper insight into the dielectric properties and their correlation with structural properties in the solid solution CETCox by plotting the dielectric constant and loss as a function of frequency and temperature. The Curie–Weiss law and modified Curie–Weiss law allow us to better understand the dielectric phenomenon. The electrical modulus analysis is used to study the dielectric relaxation phenomenon and the electric process of the compounds.
2. Experimental procedure
Polycrystalline samples of the solid solution CETCox (x = 0.00, 0.05 and 0.10) were prepared by sol–gel method. Highly pure powders of CaCO3, TiO2, Er2O3 and Co Cl2·6H2O were mixed in stoichiometric ratios. Details of the method of preparation and structure characterization were described in our previous work.33 Phase purity, homogeneity, and crystallinity were identified by powder X-ray diffraction (XRD) analysis using an XPERT-PRO diffract-meter with a graphite monochromatized CuKα radiation (λCuKα = 1.54 Å). The data collected in the range of 0 ≤ 2θ ≤ 100 were analyzed by the FULLPROF software based on the Rietveld method. The XRD peaks was sharp and had a high intensity, indicating that the prepared samples have a high crystalline nature with a single-phase formation. Using Rietveld refinement of the XRD data, we indexed all peaks on the basis of an orthorhombic structure, with a Pbnm space group. The experimental density was calculated from the weight and geometrical dimensions of the cylindrical pellets and compared to the theoretical density ρtheo = ZM/NAV where Z is the number of atoms in orthorhombic structure (Z = 4), M is the molecular weight NA = 6.02 × 10²³ mol−1 is Avogadro's number, and V is the volume of orthorhombic unit cell determined from X-ray measurements. The compactness was deduced from the ration C = ρexp/ρtheo. Table 1 shows the values of ρtheo, ρexp and C.
Experimental, calculated density and compactness of Ca0.85Er0.1Ti (1−x) Co4x/3O3.
| Compounds | x = 0 | x = 0.05 | x = 0.1 |
|---|---|---|---|
| Density (theo) (g cm−3) | 4.350 | 4.404 | 4.460 |
| Density (exp) (g cm−3) | 4.263 | 4.271 | 4.280 |
| Compactness: C | 0.98 | 0.97 | 0.96 |
The dielectric measurements were performed on ceramic disks (pellets having a diameter of 8 mm and a thickness of 2 mm) after sputtering aluminum electrodes on their circular faces. After this step, an Agilent 4294A impedance analyzer and a cold plate of a liquid nitrogen cooled cryostat were used to collect capacitance C and conductance G measurements over a wide range of temperatures and frequencies.
3. Results and discussion
3.1. Morphological study
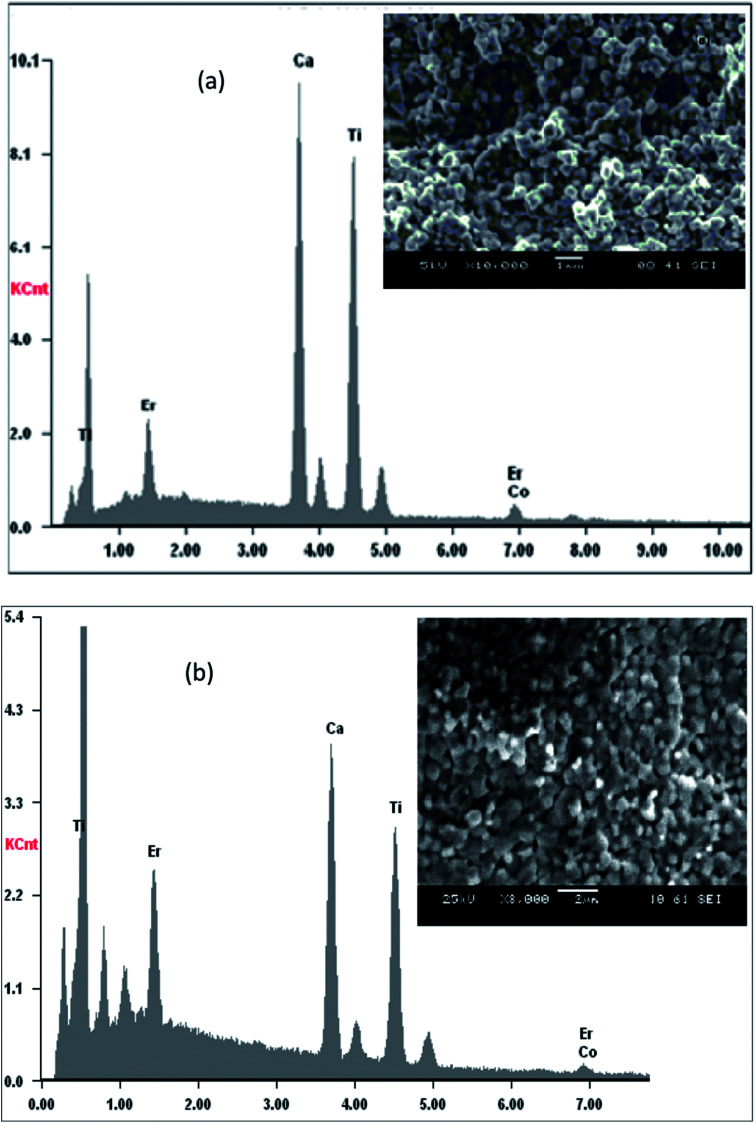
Fig. 1(a and b) shows the EDX spectra of pure and doped CaErTiO3 (for x = 0 and 0.1) respectively. EDX spectra revealed the presence of Ca, Er, Ti, Co and O elements, which confirms that there is no loss of any integrated element during sintering, within the experimental errors. A typical microstructure of CETCox (x = 0.00 and 0.10) is shown in the inset of Fig. 1(a and b) the micrograph indicated that the grains are uniformly distributed over the entire surface of the sample. It is interesting that the grain morphologies were consistent with the crystal structures.34
Fig. 1. (a and b): plot of EDX analysis of chemical species of CETCox with (a) x = 0.00, and (b) x = 0.10. Inset shows their corresponding SEM graph.
3.2. Dielectric study
3.2.1. Frequency dependence
The dielectric spectroscopic study provides insights into the structure of compounds, grain boundary, grain, transport properties and charge storage capabilities of dielectric material. The dielectric properties depend on several factors, including the chemical composition and the method of preparation, etc.35,36
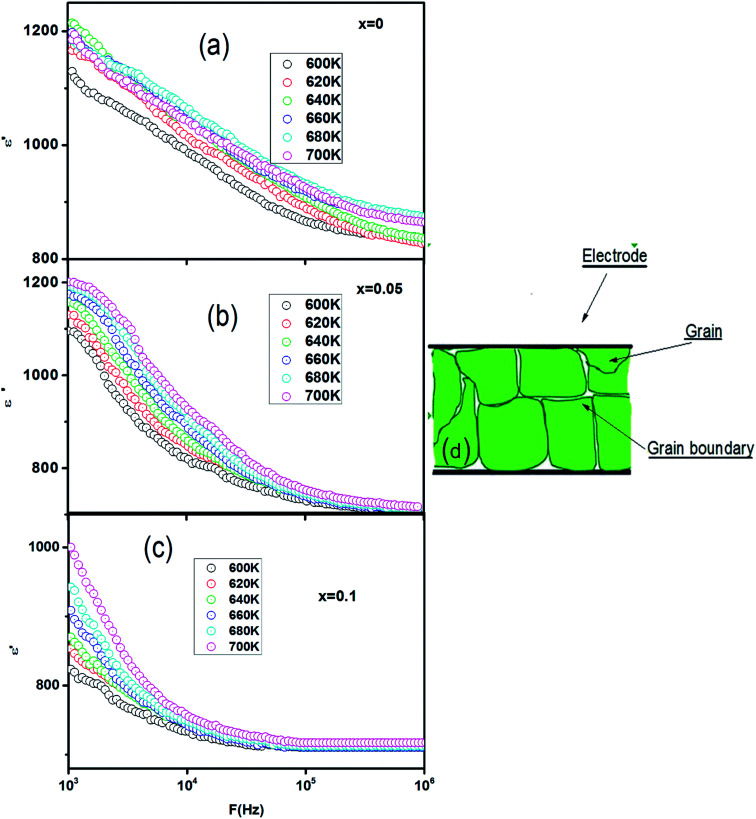
The frequency dependence of the real part (ε′) of permittivity of CETCox (x = 0.00, 0.05 and 0.10) at different temperatures is shown in Fig. 2(a–c). The dielectric constant (ε′) decreased rapidly with the increase in frequency. This decrease is due to the reduction of space charge polarization effect. Then, it remained nearly constant but, increased with increasing temperature at a given frequency. However, at low frequency the dielectric constant was high. This is due to the presence of space charge polarization at the grain boundaries, which generates a potential barrier. Then, an accumulation of charge at the grain boundary occurred, which led to higher values of the real part of permittivity.37 The dielectric dispersion can be explained by the dominance of grain boundaries' effect rather than by the grains. This is attributed to Maxwell–Wagner type of interfacial polarization in accordance with Koop's phenomenological theory.38,39
Fig. 2. (a–c): frequency dependence of real (ε′) part of permittivity of CETCox for x = 0.00, 0.05 and 0.10. (d): is a schematic structure of the samples.
The dielectric loss tangent, tan(δ), is related to the dielectric relaxation process and is given as the ratio of the imaginary part ε′′ and the real part ε′, i.e., tan(δ) = ε′′/ε′. The dielectric loss represents the energy loss and occurs when the polarization shifts behind the applied electric field caused by the grain boundaries.
In general, the dielectric loss of dielectric materials originates from three distinct factors: space charge migration (interfacial polarization contribution), direct current (DC) conduction, and movement of the molecular dipoles (dipole loss).40
To explain the decrease of the real part of permittivity at higher frequencies, we supposed that the dielectric structure is composed of low resistive grains separated by poor conducting thin grain boundaries (as illustrated in Fig. 2(d)). As a result of the applied electric field, we obtained a localized accumulation of charges, which led to the interfacial polarization.41
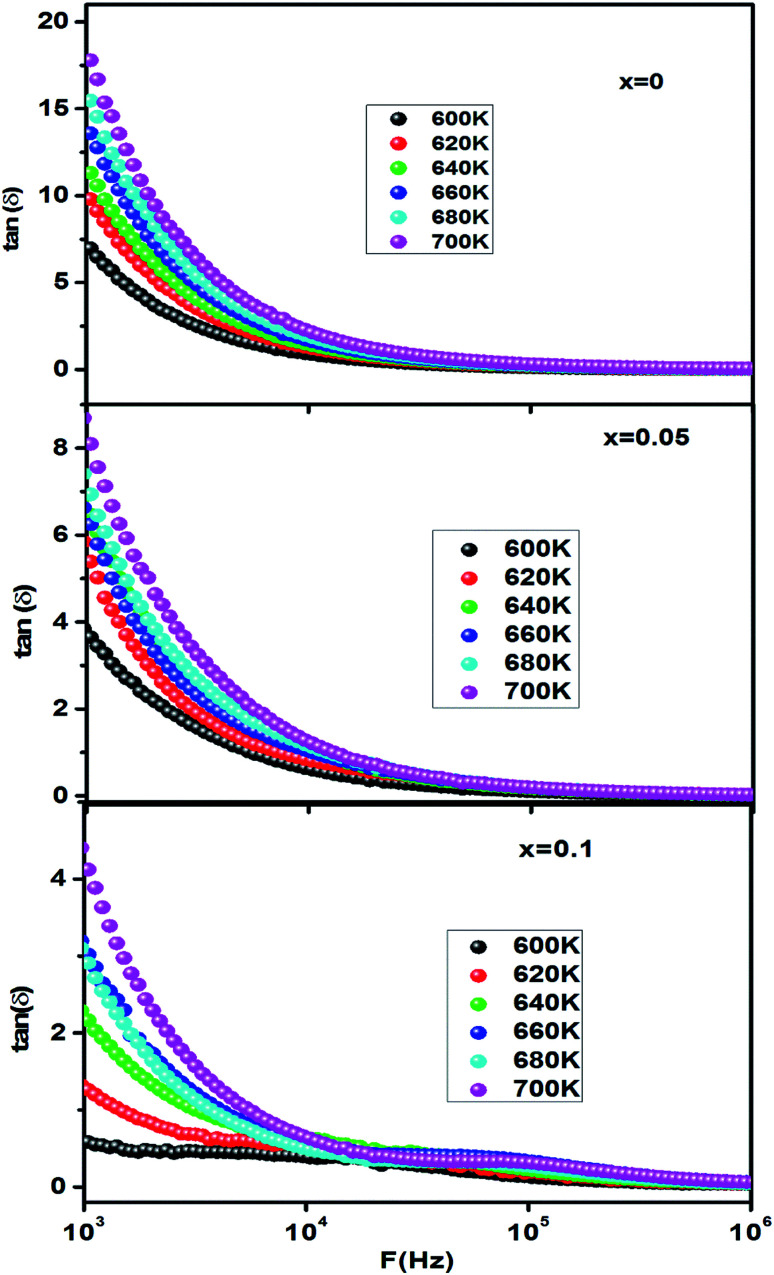
The frequency dependence of the dielectric loss tangent at different temperatures is shown in Fig. 3. The curve shows the same behavior of the dielectric constant (ε′). The high value of tan(δ) at a low frequency can be attributed to the high resistivity of grain boundaries which are more effective than the grains.
Fig. 3. Frequency dependence of dielectric loss of CETCox for x = 0.00, 0.05 and 0.10.
The ionic radius of Co3+ is the same as that of Ti4+, but it is much smaller than that of Ca2+. Co3+ ions are more likely to replace Ti4+ ions for their similar ionic size. Thus the Co2+ ions act as electron acceptors in CaTiO3 lattice and occupy Ti4+ ionic site. The molecular formula of the Co-doped CaTiO3 can be written as CaCoxTi1−xO3. As a result of this, the CaTiO3 crystal is distorted. All the above data indicate that Co-doping influences the variation of Tc. It also can be seen that εmax decreases with the increase of Co concentration. Tzing et al.42 proposed that εmax strongly depends upon the size of the grains.
In fact, the dielectric constant of the materials is linearly proportional to the average value of grain size.43 Therefore, the decrease of dielectric constant and loss tangent as a function of Co doping is due to the decrease of grain size, which is in agreement with the previous results (conduction mechanism).33 This indicates that there is a strong relation between the conduction process and the dielectric polarization in these Co doped Ti. In addition, cobalt seems also to have an effect on the processing of BaTiO3 ceramics since the grain boundary mobility decreases with Co doping due to the segregation, at the grain boundaries, of defects induced by doping.44
3.2.2. Temperature dependence
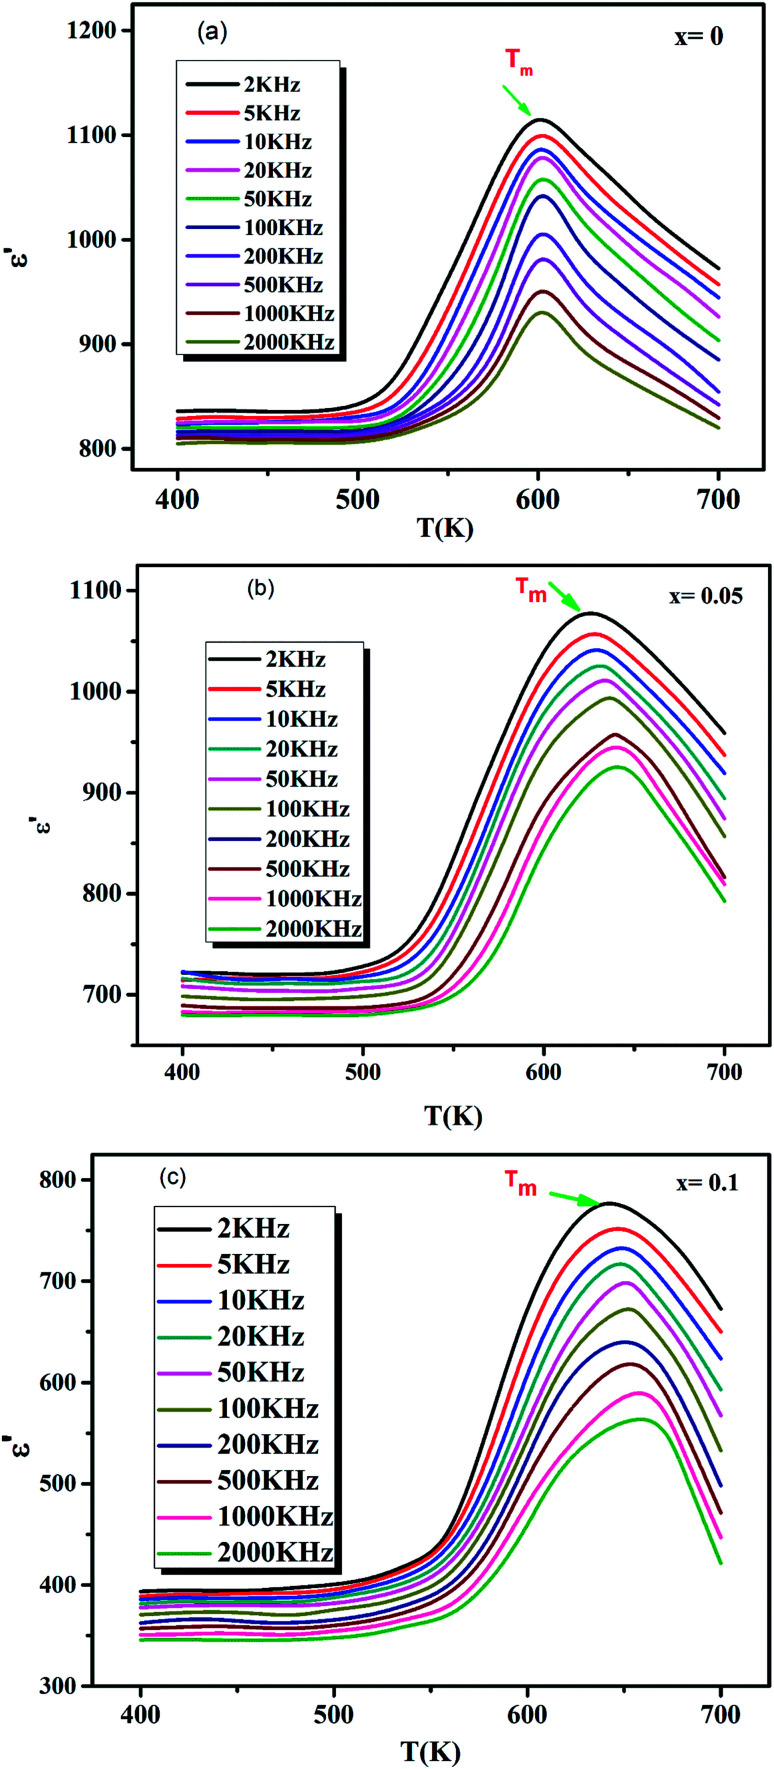
The variation of the real part (ε′) of the dielectric permittivity as a function of temperature at various frequencies (2 × 10³ to 2 × 10⁶ Hz) of CETCox with 0.00 ≤ x ≤ 0.10 samples is carefully examined and shown in Fig. 4(a–c). It is observed that ε′is frequency and temperature independent at low temperature. Then, it increases gradually with increasing temperature to its maximum value (ε′max) around 600 K, 620 K, 640 K for x = 0.00, 0.05 and 0.10, respectively, which corresponds to the transition from a ferroelectric to a paraelectric phase.45 The study of the dielectric constant indicates that for x = 0.00 (Fig. 4(a)), the transition temperature value has no variation as a function of frequency, which confirms that these compositions are of classical ferroelectric type. Fig. 4(b and c) shows that the ferroelectric relaxor characteristic of a high frequency dispersion in the vicinity of Tc, a diffuse phase transition, a small shift towards high temperatures and a decrease in the value of the permittivity as function of frequency are accentuated as the concentration of Co3+ ions increased from x = 0.05 to 0.10.46,47
Fig. 4. (a–c) Temperature dependence of dielectric constant (ε′) of CETCox at different frequencies respectively for x = 0.00, 0.05 and 0.10.
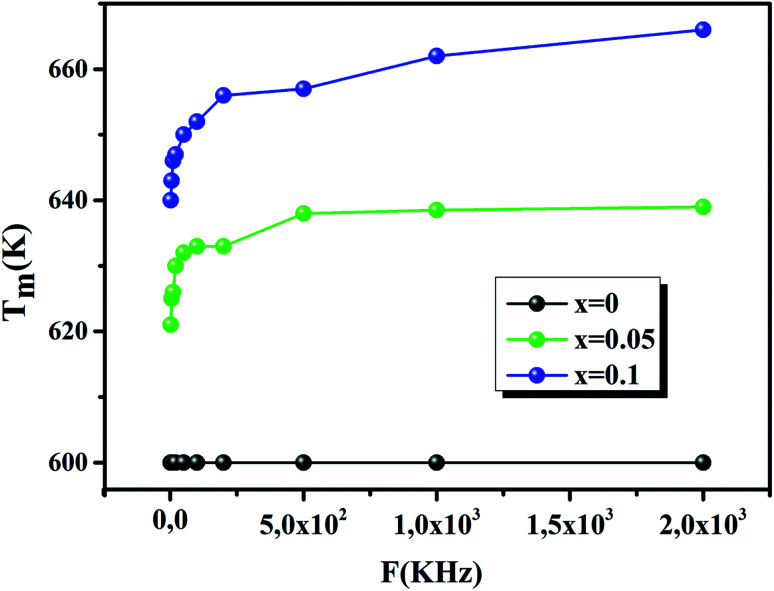
Fig. 5 shows the evolution of Tm as a function of frequency. It also shows that Tm is constant for pure CaErTiO3, confirming the classical transition, but, it increases with increasing frequency for Co doped CaErTiO3, confirming the relaxor behavior.
Fig. 5. The variation of Tm as a function of frequency for x = 0.00, 0.05 and 0.10.
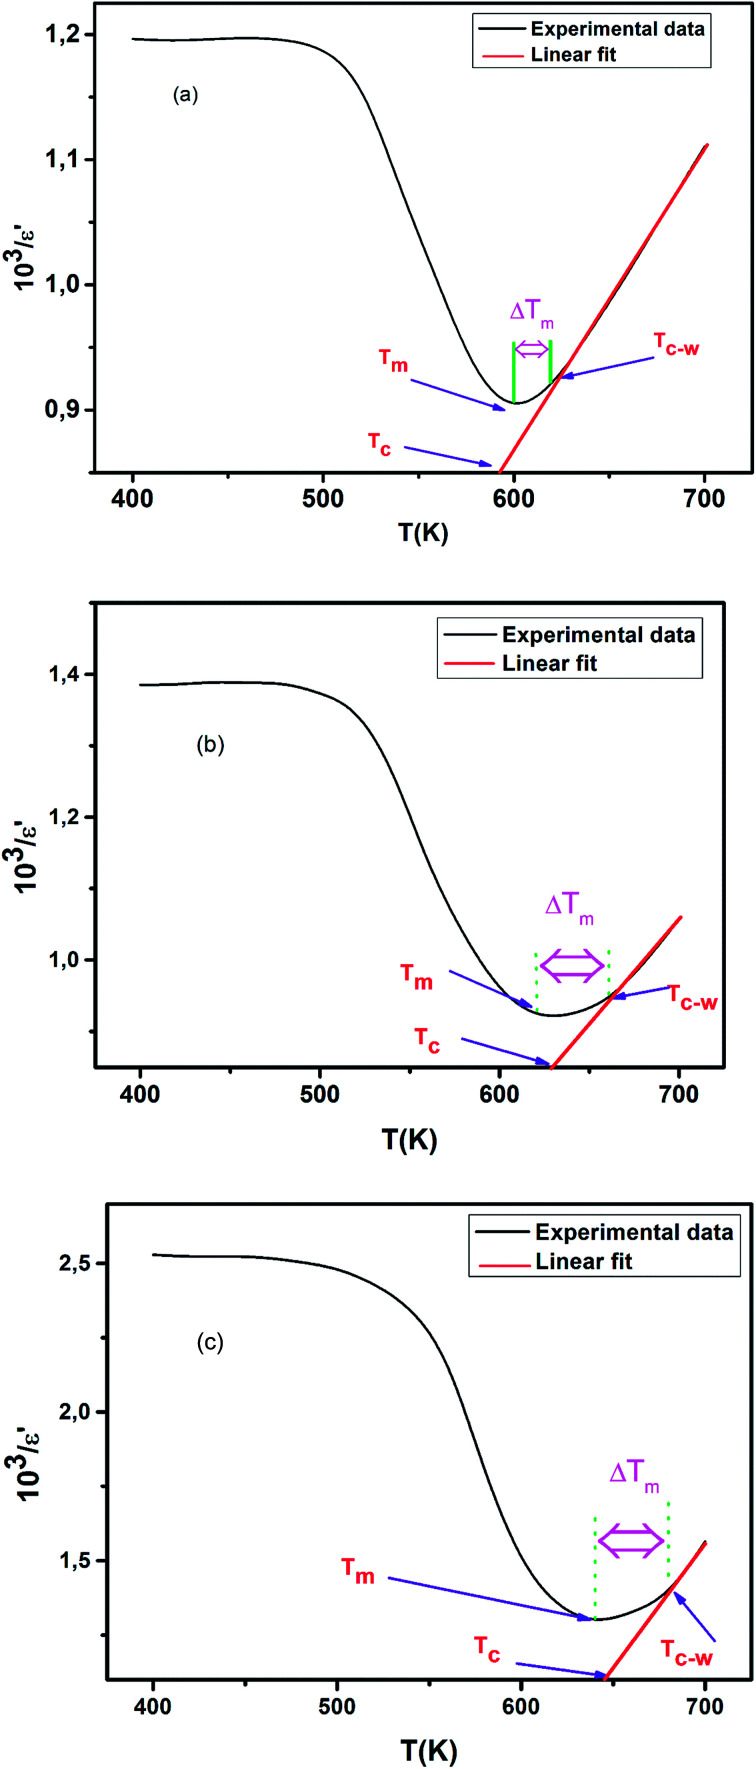
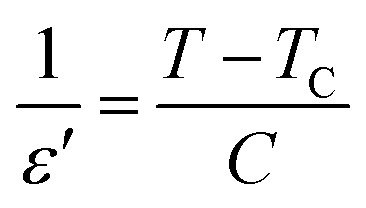
An inverse of relative permittivity (103/ε′) as a function of temperature at 2 kHz is plotted in Fig. 6(c–e) to explain the dielectric phenomenon in the solid solution CETCox by Curie–Weiss law. This method describes the ferro–paraelectric transition in the region and is expressed by the following relation:
 |
1 |
where C is the Curie–Weiss constant and Tc is the Curie–Weiss temperature.
Fig. 6. (a–c): The inverse of dielectric constant (103/ε′) as a function of temperature at 2 kHz.
To show the degree of deviation from the relation (1), we define the parameter ΔTm by the following expression:48
| ΔTm = TC–W − Tm | 2 |
Where Tm denotes the temperature of the dielectric constant maximum (ε′max) and TC–W represents the temperature from which the dielectric constant starts to deviate from the Curie–Weiss law.
Above Tc, the linear fit is examined in the paraelectric region. The fitting parameters, i.e. the Curie–Weiss constant (C) and the Curie temperature Tc are listed in Table 2 at 2 kHz.
Parameters obtained from the temperature dependence of dielectric permittivity for 2 kHz.
| X | ε′m (2 kHz) | T m (K) (2 kHz) | ΔTm (K) (2 kHz) | C (105 K) (2 kHz) | γ (2 kHz) |
|---|---|---|---|---|---|
| 0.00 | 1114 | 600 | 25 | 6.75 | 1.04 |
| 0.05 | 1084 | 620 | 36 | 4.54 | 1.75 |
| 0.10 | 776 | 640 | 40 | 2.77 | 1.86 |
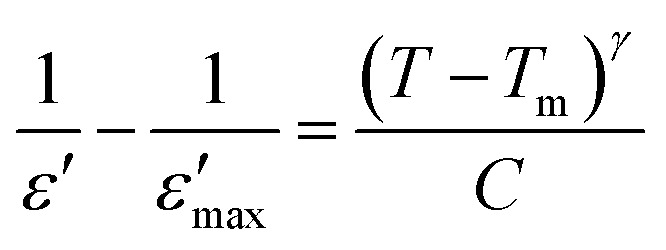
Note that the Curie–Weiss law was used to determine the degree of disorder in the solid solutions using an empirical formula developed by Uchino et al. for T > Tm. This leads us to use the modified Curie–Weiss law as given below:49
 |
3 |
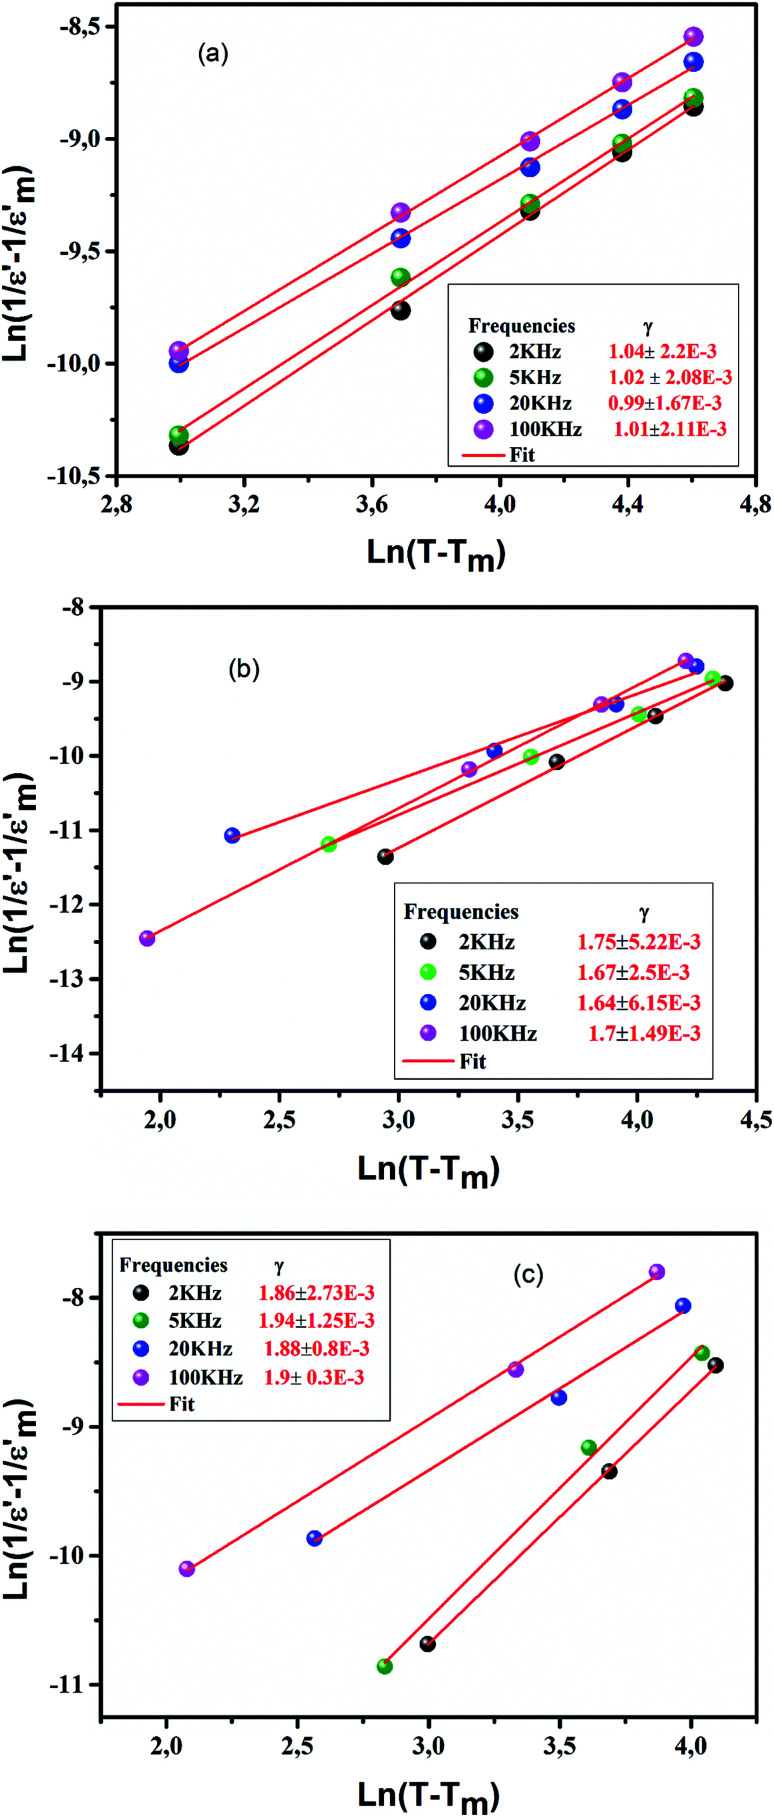
γ is the diffuseness coefficient which shows the character of the phase transition.50 For γ = 1, a classical transition in which Curie–Weiss law is obeyed, for 1 < γ < 2 is a diffuse transition and for γ = 2 is an ideal relaxor ferroelectric.51 The plots of 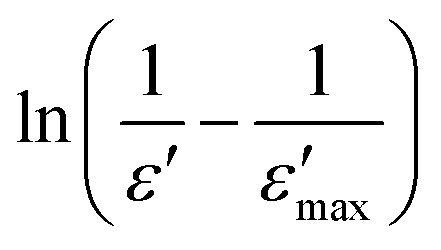 versus ln(T − Tm) for CETCox at frequencies of 2, 5, 20 and 100 kHz are displayed in Fig. 7(a–c). The same behavior is observed for the other frequencies. The γ of these frequencies for different concentration of Co are presented in Fig. 7(a–c). From this figure, we note that diffuseness coefficient γ is found to be around 1 for x = 0 which indicate a classical transition. However, γ value is between 1 and 2 (1 < γ < 2) for doped CaErTiO3, indicating a diffuse behavior. However, the obtained value of γ present an independent behavior with the effect of frequency.
Fig. 7. (a–c): the plot of ln(1/ε − 1/ε′max) as a function of ln(T − Tm) at 2, 5, 20 and 100 kHz for Ca0.85Er0.1Ti1−xCo4x/3O3.
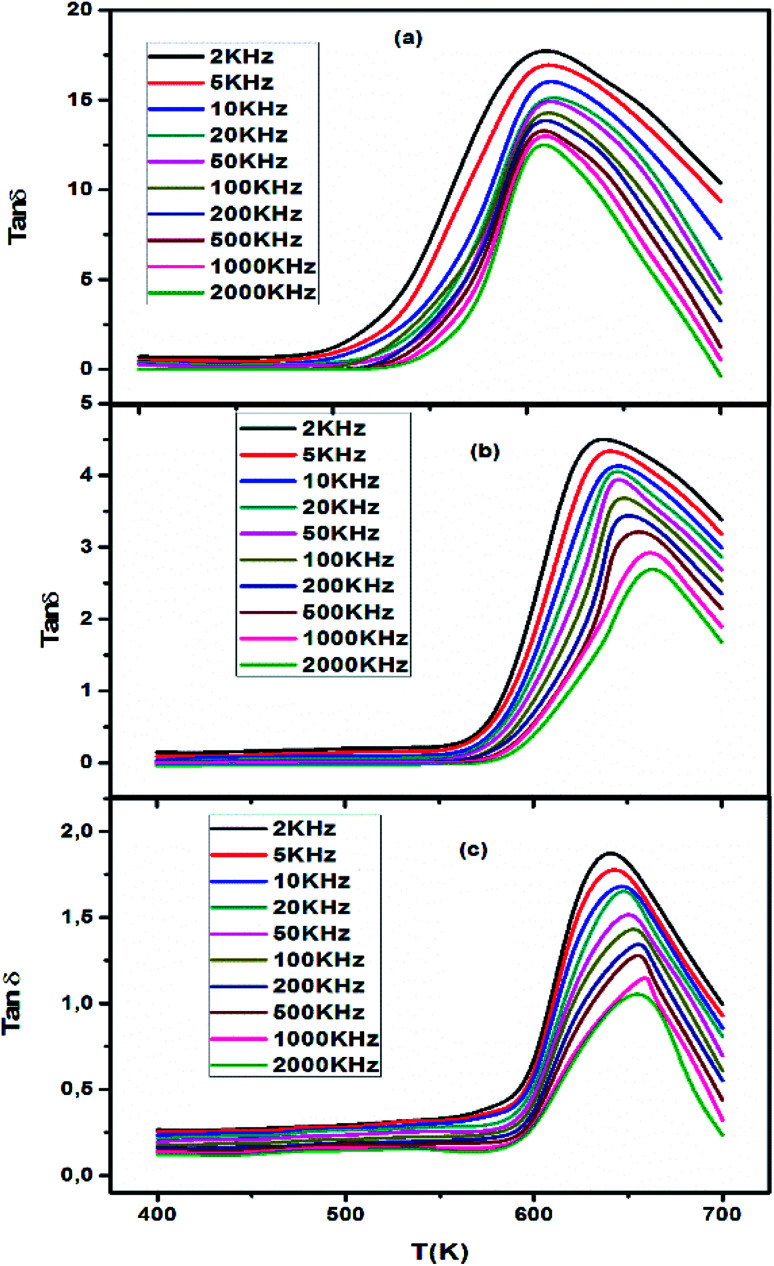
Fig. 8(a–c) shows the dielectric loss (tan δ) as a function of temperature at various frequencies. The variation of tan δ with frequency shows a similar nature as the variation of ε′ with frequency. It is seen from the figure that the dielectric loss initially decreases rapidly with increasing frequency, exhibiting a dispersion at lower frequencies, and then remains fairly constant at higher frequencies. However, with the increase in the frequency of the applied field the mechanisms of polarization such as space charge, orientation, and ions start lagging behind the field and, thus, dielectric loss decreases. Meanwhile, the variation of the dielectric loss with temperature exhibits the same nature as that of the variation of dielectric constant with temperature and could be explained in the same way as that used for discussing the dielectric constant. It is found that with the increase in temperature, the dielectric loss increases. The mobility of charge carriers increases with temperature which increases the polarization and leads to high dielectric loss. The observed higher value of dielectric loss at high temperature is due to charge accumulation at grain boundaries.47
Fig. 8. Temperature dependence of dielectric loss (tan δ) of CETCox at different frequencies.
3.3. Electrical modulus analysis
The electrical response can be analyzed by the complex electric modulus [M*(ω)] formalism. It is used to investigate the dielectric relaxation processes of the compounds. The complex electric modulus was calculated from the dielectric permittivity [ε*(ω)] using the following relation.52–55
 |
4 |
where 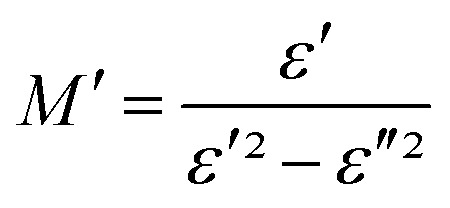 and
and 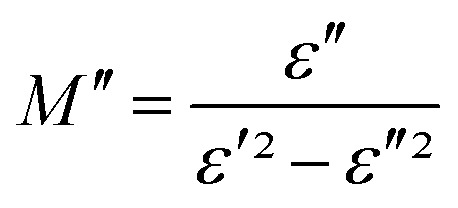 : (M′, ε′) and (M′′, ε′′) are the real and imaginary components of modulus and permittivity, respectively, and
 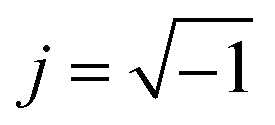 is the imaginary factor.
The physical significance of the electrical modulus is the relaxation mechanism of the electric field in the material when the electric displacement remains constant. The frequency dependent characteristics of the real (M′) and imaginary (M′′) parts of the electrical modulus are excellent methods to investigate the relaxation process.56
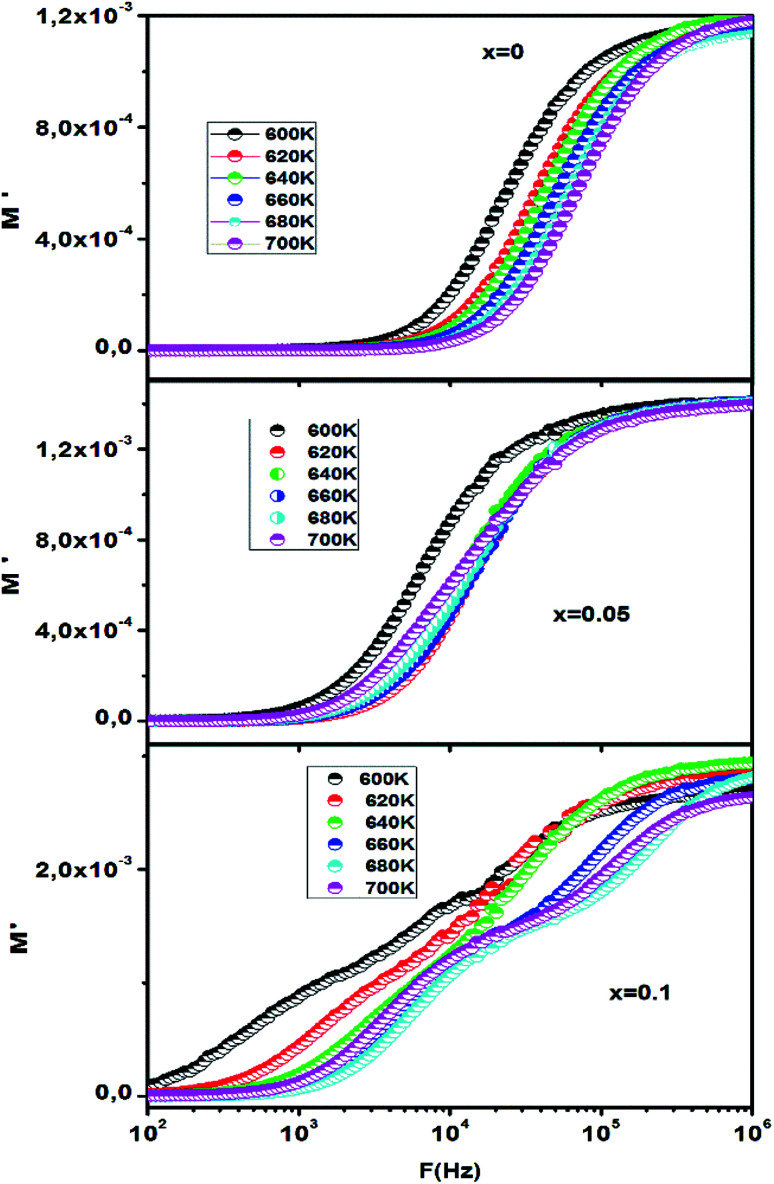
The frequency dependence of the real part (M′) of CETCox at different temperatures is shown in Fig. 9. At low frequency, the M′ value is found to be nearly zero and increases when increasing frequency. This continuous dispersion on increasing frequency can be attributed to the conduction process due to the short range mobility of charge carriers. It can also be related to the absence of the restorative force which governs the mobility of charge carriers under the action of an induced electric field.57–59 A saturation value (the plateau region) is reached at high frequency, suggesting that the electrical properties of the materials are frequency-independent. Moreover, this feature indicates the negligible contribution of electrode polarization in the synthesis of CETCox.60
Fig. 9. Frequency dependencies of M′ at different temperatures respectively for x = 0.00, 0.05 and 0.10.
We can deduce from Fig. 9 (x = 0.1) that M′ exhibits three plateau regions, which indicates the existence of three different relaxation dynamics.61 These three plateau regions existing in M′ of the modulus are correlated with the imaginary part M′′, as shown in Fig. 8 (x = 0.1).
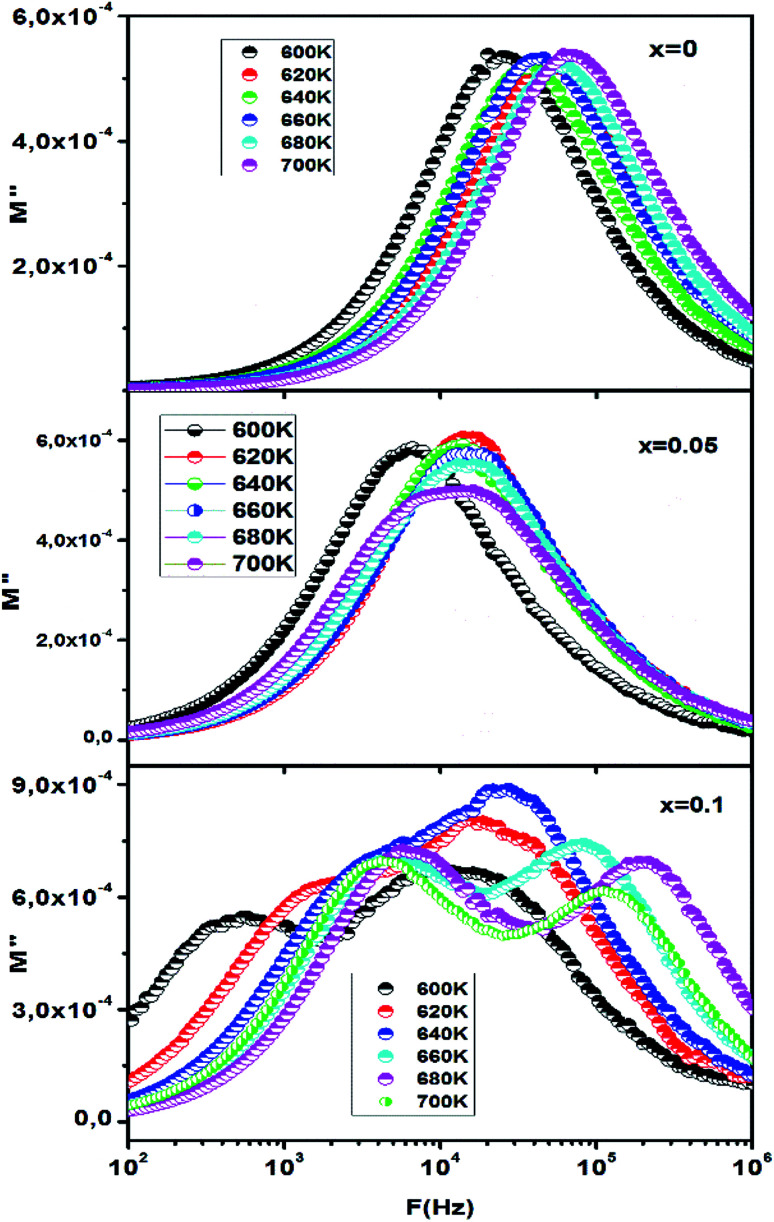
The evolution of the imaginary part (M′′) of the modulus as a function of frequency at different temperatures is shown in Fig. 10. The imaginary part of the modulus (M′′) exhibits a single relaxation peak (x = 0.00, x = 0.05), centered at the dispersion region of the real part of the modulus (M′) associated with the grain effect. For x = 0.10, it displays a flat peak response, but it is in fact a double peak response Fig. 10 (x = 0.1). The corresponding relaxation of M′′ peaks shifted to the higher frequency when increasing temperature and the charge carriers movement becomes faster, resulting in a decrease in relaxation time.18,62 This behavior confirms that the relaxation is temperature dependent, and that the charge carriers hopping is taking place.57,63 The plot of the imaginary part of the electric modulus (M′′) represents two parts. The first part, at low frequency i.e. the region on the left of the peak presents the frequencies range in which the ions can move over long distance i.e. ions can successfully jump from one site to the neighboring site. The second part, at high frequency i.e. the frequency above maximum (the region on the right of the peak) shows the region in which ions are confined to their potential wells.64
Fig. 10. Frequency dependencies of M′′ at different temperatures respectively for x = 0.00, 0.05 and 0.10.
The variation in the peak position of the real part and the imaginary part of the modulus of CETCox is related to the variation in the microstructure and cation distribution with temperature. Furthermore, the asymmetric broadening of the imaginary part peaks suggests that the conduction mechanism is related to non-Debye type.65
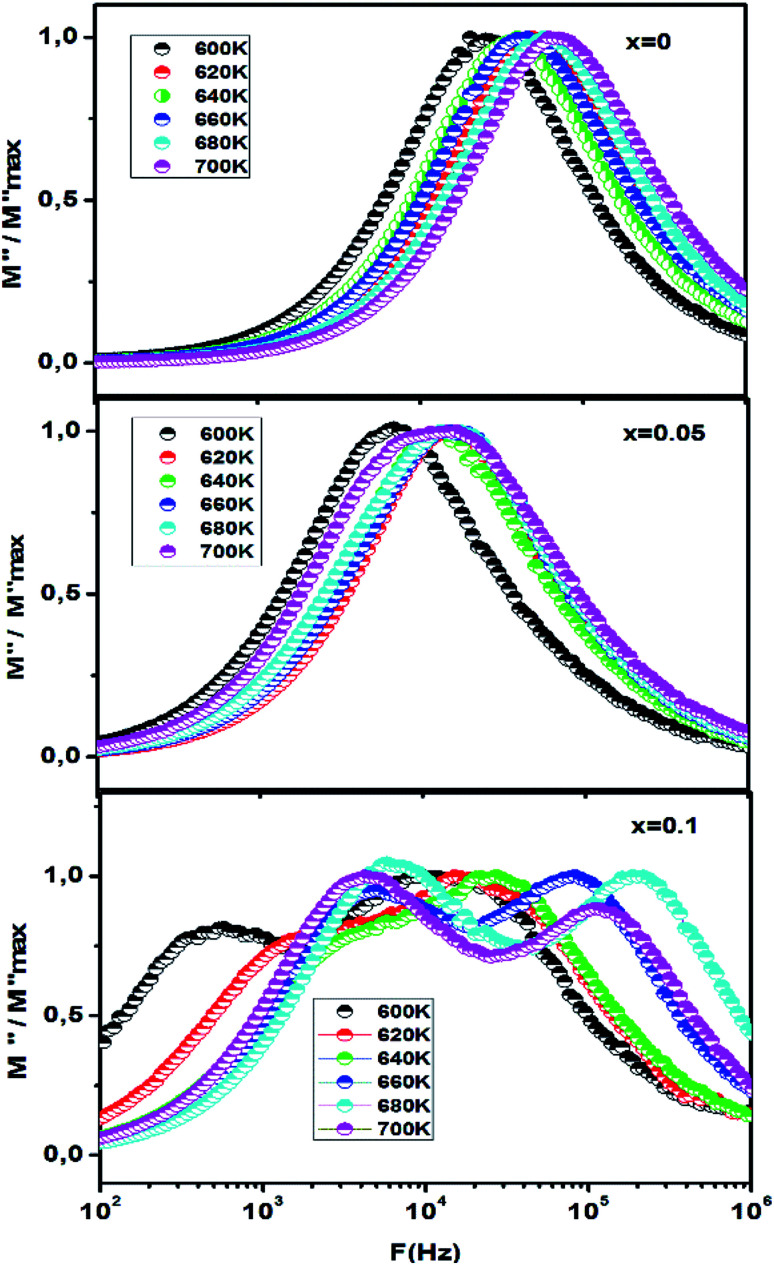
The normalized imaginary part of the modulus M′′/M′′max as a function of frequency at different temperatures is shown in Fig. 11. The normalized functions of M′′/M′′max is used to prove that the relaxation mechanism is dominated by the long-range or the short-range movement of charge carriers.66 We can notice from Fig. 11 that the separation between the normalized M′′ peaks indicates that the relaxation mechanism is dominated by the short range movement of charge carriers. In addition, the broadening of the observed peaks indicates the existence of electrical mechanism with a spread of the time relaxation processes.67
Fig. 11. The normalized imaginary part of modulus M′′/M′′maxvs. frequency plot, of CETCox for x = 0.00, 0.05 and 0.10.
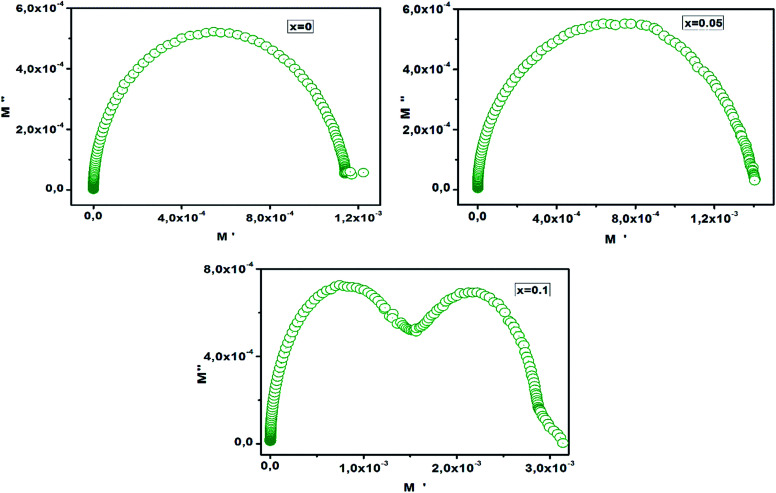
The Cole–Cole plot (M′′ vs. M′) for CETCox (x = 0.00, 0.05, 0.10) at T = 680 K is shown in Fig. 12. The Cole–Cole plot (M′′ vs. M′) is more effective than the Nyquist plot of impedance (Z′′ vs. Z′) in separating the relaxation effects from grains (conducting regions) and grain boundaries (resistive plates) in materials. We can notice from Fig. 12 the existence of one semicircle for x = 0.00 and 0.05, indicating that the grain boundaries effect is more dominant than the grain effect in the conduction mechanism.68,69 For x = 0.10 the Cole–Cole plot shows the existence of two successive semi-circular peaks. The first semicircle is attributed to the contribution of grain boundary (interfacial properties) and the second one is associated to the grain (bulk properties). This indicates the existence of two relaxation processes with two relaxation times (τ) for each relaxation.
Fig. 12. Cole–Cole (M′′ vs. M′) plot.
The relaxation time (τ) is determined from the peak height of the plot of M′′ versus frequency (Fig. 10), which reveals the short range or the long range movement of charge carriers.70 It can be calculated using the following expression: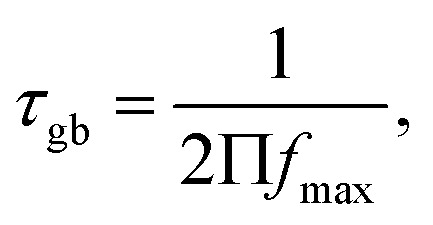 where fmax is the relaxation frequency.
The calculated value of the relaxation time is presented in Table 3.
The calculated values boundary (τ) relaxation time of CETCox at different temperature for all compounds.
| x = 0.00 | x = 0.05 | x = 0.10 | |||||||
|---|---|---|---|---|---|---|---|---|---|
| T (K) | M′′max (10−4) | f max (Hz) | τ (s) (10−5) | M′′max (10−4) | f max (Hz) | τ (s) (10−5) | M′′max (10−4) | f max (Hz) | τ (s) (10−5) |
| 600 | 5.3876 | 20 260 | 78, 556 | 5.7917 | 7727 | 2, 0597 | 6.711 | 9652 | 1, 6489 |
| 620 | 5.2041 | 39 480 | 40, 312 | 6.0695 | 12 980 | 1, 2261 | 8.0635 | 15 060 | 1, 0568 |
| 640 | 5.2273 | 45 790 | 34, 757 | 5.9102 | 13 980 | 1, 1384 | 8.8870 | 27 250 | 0, 584 |
| 660 | 5.3369 | 49 310 | 32, 276 | 5.7489 | 13 980 | 1, 1384 | 7.4190 | 82 850 | 0, 1921 |
| 680 | 5.2223 | 57 190 | 27, 829 | 5.5156 | 15 060 | 1, 0568 | 6.9366 | 111 500 | 0, 1873 |
| 700 | 5.3866 | 61 590 | 25, 841 | 4.9890 | 16 220 | 0, 9812 | 6.1743 | 187 300 | 0, 0849 |
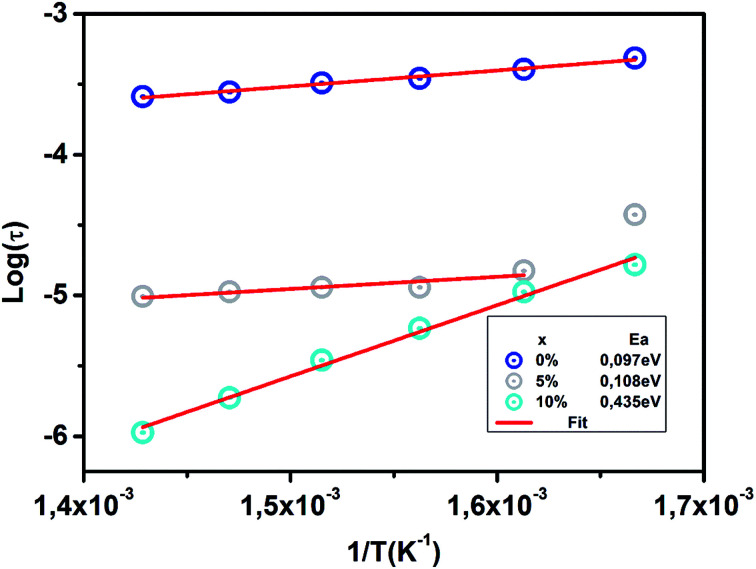
The evolution of the relaxation time of grain boundary as a function of 1/T is shown in Fig. 13.
Fig. 13. Variation of relaxation time (τ) with inverse temperature (1/T) of CETCox for x = 0.00, 0.05 and 0.10.
The activation energy in the relaxation mechanism is determined by the temperature-dependent τgb, which obeys the Arrhenius law based on the following relation: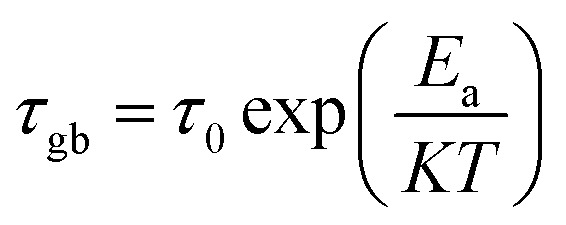 where τ0 is the pre-exponential factor, Ea is the activation energy, k is Boltzmann constant, and T is the absolute temperature.
The grain boundary activation energy value is calculated from the slope of Log(τgb) versus 1/T and mentioned in Fig. 13. The activation energy value suggests that the high-temperature dielectric relaxation is also a thermally-activated process.71 The Ea value increases with the increase of Co rate. This result can be associated with the lower value of conductivity which supports the resistive nature of doped sample. However, for higher values of x, the grain boundary thickness with high resistance increases; therefore, more energy is required for the hopping of electrons between ions.
4. Conclusion
CETCox samples were successfully synthesized by sol–gel method. The dielectric properties of CETCox were investigated. The dielectric permittivity (ε′) plot as a function of temperature shows a classic phenomenon for x = 0.00. Then, a small shift was observed for x = 0.05 and 0.10, which proves the existence of a relaxor phenomenon. The plot of the dielectric constant presents a maximum (ε′max) at high temperature explained by the space charge polarization. This fact is caused by the imperfection in materials and the mobility of ions. Results, also, show that the dielectric loss (tan δ) as a function of temperature has the same evolution of ε′. This observation confirms the relaxor process. In order to explain the dielectric phenomenon, we used the Curie–Weiss law and modified Curie–Weiss law. The electrical properties of our compounds deduced from the complex electric modulus show a conduction process due to the short range mobility of charge carriers. The imaginary part of the modulus proves that the relaxation is temperature dependent, and that the charge carriers' hopping is taking place.
Conflicts of interest
There are no conflicts to declare.
Supplementary Material
References
- Xu T. Chen L. Guo Z. Ma T. Strategic improvement of the long-term stability of perovskite materials and perovskite solar cells. Phys. Chem. Chem. Phys. 2016;18:27026–27050. doi: 10.1039/C6CP04553G. [DOI] [PubMed] [Google Scholar]
- Luo B. Wang X. Tian E. Li G. Li L. Electronic structure, optical and dielectric properties of BaTiO3/CaTiO3/SrTiO3 ferroelectric superlattices from first-principles calculations. J. Mater. Chem. C. 2015;3:8625–8633. doi: 10.1039/C5TC01622C. [DOI] [Google Scholar]
- Scott J. F. Applications of Modern Ferroelectrics. Science. 2007;315:954–959. doi: 10.1126/science.1129564. [DOI] [PubMed] [Google Scholar]
- Na Zhu X. Chen X. Tian H. Chen X. M. Atomic scale investigation of enhanced ferroelectricity in (Ba, Ca) TiO3. RSC Adv. 2017;7:22587–22591. doi: 10.1039/C7RA00662D. [DOI] [Google Scholar]
- Uchino K. Relaxor ferroelectric devices. Ferroelectrics. 1994;151:321–330. doi: 10.1080/00150199408244756. [DOI] [Google Scholar]
- Westphal V. Kleemann W. Glinchuk M. D. Diffuse Phase Transitions and Random-Field-Induced Domain States of the “Relaxor” Ferroelectric PbMg1/3Nb2/3O3. Phys. Rev. Lett. 1992;68:847–850. doi: 10.1103/PhysRevLett.68.847. [DOI] [PubMed] [Google Scholar]
- Souza A. E. Teixeira S. R. -Santos C. M. Schreiner W. H. Lisboa Filhod P. N. Longo E. Photoluminescence activity of Ba1−xCaxTiO3: dependence on particle size and morphology. J. Mater. Chem. C. 2014;2:7056–7070. doi: 10.1039/C4TC00897A. [DOI] [Google Scholar]
- Zheng H. Bagshaw H. Györgyfalva G. D. C. C. Reaney I. M. Ubic R. Yerwood J. Raman spectroscopy of B-site order–disorder in CaTiO3-based microwave ceramics. J. Eur. Ceram. Soc. 2003:2653–2659. doi: 10.1016/S0955-2219(03)00149-3. [DOI] [Google Scholar]
- Kim B. G. Cho S. M. Kim T. Y. Jang H. M. Giant Dielectric Permittivity Observed in Pb-Based Perovskite Ferroelectrics. Phys. Rev. Lett. 2001;86:3404–3406. doi: 10.1103/PhysRevLett.86.3404. [DOI] [PubMed] [Google Scholar]
- Wu J. B. Nan C. W. Lin Y. H. Deng Y. Giant Dielectric Permittivity Observed in Li and Ti Doped NiO. Phys. Rev. Lett. 2002;89:217601–217604. doi: 10.1103/PhysRevLett.89.217601. [DOI] [PubMed] [Google Scholar]
- Dong W. Li B. Wang X. An L. Li C. Chen B. Wang G. Shi Z. General Approach to Well-Defined Perovskite MTiO3 (M = Ba, Sr, Ca, and Mg) Nanostructures. J. Phys. Chem. C. 2011;115:3918–3925. [Google Scholar]
- Lazaro S. Milanez J. Figueiredo A. T. Longo V. Mastelaro V. R. Vicente F. S. Hernandes A. C. Varela J. A. Longo E. Relation between photoluminescence emission and local order-disorder in the CaTiO3 lattice modifier. Appl. Phys. Lett. 2007;90:111904–111906. doi: 10.1063/1.2713359. [DOI] [Google Scholar]
- Marques V. S. Cavalcante L. S. Sczancoski J. C. Volanti D. P. Espinosa J. W. M. Joya M. R. Santos M. R. M. C. Pizani P. S. Varela J. A. Longo E. Influence of microwave energy on structural and photoluminescent behavior of CaTiO3 powders. Solid State Sci. 2008;10:1056–1061. doi: 10.1016/j.solidstatesciences.2007.11.004. [DOI] [Google Scholar]
- Rodrigues A. P. Inoue M. Tanaka T. Miyake M. Sfer A. M. Kishimoto E. Tsujigiwa H. Rivera R. S. Nagatsuka H. Effect of CaTiO3–CaCO3 prepared by alkoxide method on cell response. J. Biomed. Mater. Res., Part A. 2009;93:297–303. doi: 10.1002/jbm.a.32551. [DOI] [PubMed] [Google Scholar]
- Sun L. Zhangb R. Wangb Z. Caob E. Zhangb Y. Juc L. Microstructure, dielectric properties and impedance spectroscopy of Ni doped CaCu3Ti4O12 ceramics. RSC Adv. 2016;6:55984–55989. doi: 10.1039/C6RA07726A. [DOI] [Google Scholar]
- Jancar B. Suvorov D. Valant M. Drazic G. Characterization of CaTiO3-NdAlO3 dielectric ceramics. J. Eur. Ceram. Soc. 2003;23:1391–1400. doi: 10.1016/S0955-2219(02)00359-X. [DOI] [Google Scholar]
- Murugesan G. Nithya R. Kalainathan S. Hussain Shamima. High temperature dielectric relaxation anomalies in Ca0.9Nd0.1Ti0.9Al0.1O3−δsingle crystals. RSC Adv. 2015;5:78414–78421. doi: 10.1039/C5RA15876A. [DOI] [Google Scholar]
- Sasaki S. Prewitt C. T. Bass J. D. Orthorhombic perovskite CaTiO3 and CdTiO3: structure and space group. Acta Crystallogr., Sect. C: Cryst. Struct. Commun. 1987;43:1668–1674. doi: 10.1107/S0108270187090620. [DOI] [Google Scholar]
- Lemanov V. V. Sotnikov A. V. Smirnova E. P. Weihnacht M. Kunze R. Perovskite CaTiO3 as an incipient ferroelectric. Solid State Commun. 1999;110:611–614. doi: 10.1016/S0038-1098(99)00153-2. [DOI] [Google Scholar]
- Tewari H. S. Parkash O. Tare V. B. Kumar D. Dielectric properties of the system Ca1−xYxTi1−xCoxO3(0.00 ≤ x ≤ 0.15) J. Mater. Sci. 1990;25:2181–2184. doi: 10.1007/BF01045786. [DOI] [Google Scholar]
- Durga C. Tewari P. H. S. Kumar D. Parkash O. Dielectric properties of the system Ca1 −xLaxTi1 −xCoxO3. Bull. Mater. Sci. 1988;11:307–313. doi: 10.1007/BF02744567. [DOI] [Google Scholar]
- Li D. Subramanian M. A. Noval tunable ferroelectric compositions: Ba1−xLnxTi1−xMxO3 (Ln=La, Sm, Gd, Dy. M=Al, Fe, Cr) Solid State Sci. 2000;2:507–512. doi: 10.1016/S1293-2558(00)01063-3. [DOI] [Google Scholar]
- Vashook V. Vasylechko L. Ulmann H. Guth U. Synthesis, crystal structure, oxygen stoichiometry, and electrical conductivity of La1−aCaaCr0.2Ti0.8O3−δ. Solid State Ionics. 2003;158:317–325. doi: 10.1016/S0167-2738(02)00766-X. [DOI] [Google Scholar]
- Hassen A. B. Rhouma F. I. H. Dhahri J. Abdelmoula N. Effect of the substitution of titanium by chrome on the structural, dielectric and optical properties in Ca0.67La0.22Ti(1−x)CrxO3 perovskites. J. Alloys Compd. 2016;663:436–443. doi: 10.1016/j.jallcom.2015.09.087. [DOI] [Google Scholar]
- Hassini A. Gervais M. Coulon J. Phuoc V. T. Gervais F. Synthesis of Ca0.25Cu0.75TiO3 and infrared characterization of role played by copper. Mater. Sci. Eng., B. 2001;87:164–168. doi: 10.1016/S0921-5107(01)00709-7. [DOI] [Google Scholar]
- Mata Osoro G. Bregiroux D. Pham Thi M. Levassort F. Mater. Lett. 2016;166:259–262. doi: 10.1016/j.matlet.2015.12.086. [DOI] [Google Scholar]
- Mazumder R. Seal A. Sen A. Maiti H. S. Ferroelectrics. 2005;326:103. doi: 10.1080/00150190500318644. [DOI] [Google Scholar]
- Feng L. X. Tang X. M. Yan Y. Y. Chen X. Z. Jiao Z. K. Cao G. H. Phys. Status Solidi A. 2006;203:22. doi: 10.1002/pssa.200622038. [DOI] [Google Scholar]
- Li Q. Qi J. Wang Y. Gui Z. Li L. J. Eur. Ceram. Soc. 2001;21:2217–2220. doi: 10.1016/S0955-2219(01)00194-7. [DOI] [Google Scholar]
- Cui B. Yu P. Tian J. Chang Z. Mater. Sci. Eng., B. 2006;133:205–208. doi: 10.1016/j.mseb.2006.07.002. [DOI] [Google Scholar]
- Jancar B. Suvorov D. Valant M. Drazic G. J. Eur. Ceram. Soc. 2003;23:1391–1400. doi: 10.1016/S0955-2219(02)00359-X. [DOI] [Google Scholar]
- Lemanski K. Gagor A. Kurnatowska M. Pazik R. Deren P. J. J. Solid State Chem. 2011;184:2713–2718. doi: 10.1016/j.jssc.2011.08.004. [DOI] [Google Scholar]
- Rayssi C. Rhouma F. I. H. Dhahri J. Khirouni K. Zaidi M. Belmabrouk H. Structural, electric and dielectric properties of Ca0.85Er0.1Ti1−xCo4x/3O3(0 ≤ x ≤ 0.1) Appl. Phys. A: Mater. Sci. Process. 2017;123:778. doi: 10.1007/s00339-017-1365-8. [DOI] [Google Scholar]
- Bourguiba F. Dhahri A. Tahri T. Dhahri J. Abdelmoula N. Taibi K. Hlil E. K. J. Alloys Compd. 2016;675:174–182. doi: 10.1016/j.jallcom.2016.03.016. [DOI] [Google Scholar]
- Chandran A. George K. C. Defect induced modifications in the optical, dielectric, and transport properties of hydrothermally prepared ZnS nanoparticles and nanorods. J. Nanopart. Res. 2014;16:2238–2255. doi: 10.1007/s11051-013-2238-5. [DOI] [Google Scholar]
- Rahaman M. D. Mia M. D. Khan M. N. I. Akther Hossain A. K. M. Study the effect of sintering temperature on structural, microstructural and electromagnetic properties of 10% Ca-doped Mn0.6Zn0.4Fe2O4. J. Magn. Magn. Mater. 2016;404:238–249. doi: 10.1016/j.jmmm.2015.12.029. [DOI] [Google Scholar]
- Abdullah Dar M. Majid K. Mujasam Batoo K. Kotnala R. K. Dielectric and impedance study of polycrystalline Li0.35−0.5XCd0.3NiXFe2.35−0.5XO4 ferrites synthesized via a citrate-gel auto combustion method. J. Alloys Compd. 2015;632:307–320. doi: 10.1016/j.jallcom.2015.01.190. [DOI] [Google Scholar]
- Koops C. G. Phys. Rev. 1951;83:121. doi: 10.1103/PhysRev.83.121. [DOI] [Google Scholar]
- Chauhan L. Shukla A. K. Sreenivas K. Dielectric and magnetic properties of Nickel ferrite ceramics using crystalline powders derived from DL alanine fuel in sol–gel auto-combustion. Ceram. Int. 2015;41:8341–8351. doi: 10.1016/j.ceramint.2015.03.014. [DOI] [Google Scholar]
- Yang K. Huang X. Huang Y. Xie L. Jiang P. Fluoro-Polymer@BaTiO3 Hybrid Nanoparticles Prepared via RAFT Polymerization: Toward Ferroelectric Polymer Nanocomposites with High Dielectric Constant and Low Dielectric Loss for Energy Storage Application. Chem. Mater. 2013;25:2327–2338. doi: 10.1021/cm4010486. [DOI] [Google Scholar]
- Rahmouni H. Smari M. Cherif B. Dhahri E. Khirouni K. Dalton Trans. 2015;44:10457–10466. doi: 10.1039/C5DT00444F. [DOI] [PubMed] [Google Scholar]
- Tzing W. H. Tuana W. H. Lin H. L. The effect of microstructure on the electrical properties of NiO-doped BaTiO3. Ceram. Int. 1999;25:425–430. doi: 10.1016/S0272-8842(98)00058-3. [DOI] [Google Scholar]
- Nayak P. Badapanda T. Singh A. K. Panigrahi S. RSC Adv. 2017;7:16319–16331. doi: 10.1039/C7RA00366H. [DOI] [Google Scholar]
- Rahaman M. N. Manalert R. J. J. Eur. Ceram. Soc. 1998;18:1063–1071. doi: 10.1016/S0955-2219(97)00215-X. [DOI] [Google Scholar]
- Yasmin S. Choudhury S. Hakim M. A. Bhuiyan A. H. Rahman M. J. Structural and dielectric properties of pure and cerium doped barium titanate. J. Ceram. Process. Res. 2011;12:387–391. [Google Scholar]
- Bahri F. Khemakhem H. Relaxor behavior and dielectric properties of Ba1−xBi2x/3Zr0.15Ti0.85O3 solid solution. J. Alloys Compd. 2014;593:202–206. doi: 10.1016/j.jallcom.2013.12.118. [DOI] [Google Scholar]
- Das P. R. Biswal L. Behera B. Choudhary R. N. P. Structural and electrical properties of Na2Pb2Eu2W2Ti4X4O30 (X = Nb, Ta) ferroelectric ceramics. Mater. Res. Bull. 2009;44:1214–1218. doi: 10.1016/j.materresbull.2009.01.013. [DOI] [Google Scholar]
- Hao J. Bai W. Li W. Zhai J. Correlation Between the Microstructure and Electrical Properties in High-Performance (Ba0. 85Ca0. 15)(Zr0. 1Ti0. 9) O3 Lead Free Piezoelectric Ceramics. J. Am. Ceram. Soc. 2012;95:1998–2006. doi: 10.1111/j.1551-2916.2012.05146.x. [DOI] [Google Scholar]
- Uchino K. Nomura S. Critical exponents of the dielectric constants in diffused-phase-transition crystals. Ferroelectr., Lett. Sect. 1982;44:55–61. doi: 10.1080/07315178208201875. [DOI] [Google Scholar]
- Megriche A. Mgaidi A. Sarkis C. Synthese Et Caracterisation De Ceramiques 0,75 Pb (Mg1/3Nb2/3)O3 – 0,25PbTiO3 Pures Et Dopees. J. Soc. Alger. Chim. 2010;20:27–34. [Google Scholar]
- Smolenskii G. A. Physical phenomena in ferroelectrics with diffused phase transition. J. Phys. Soc. Jpn. 1970;28:26. [Google Scholar]
- Macedo P. B. Moynihan C. T. Bose R. Role of ionic diffusion in polarization in vitreous ionic conductors. Phys. Chem. Glasses. 1972;13:171. [Google Scholar]
- Ganguly M. Harish Bhat M. Rao K. J. Lithium ion transport in Li2SO4–Li2O–B2O3 glasses. Phys. Chem. Glasses. 1999;40:297–304. [Google Scholar]
- Ghosh S. Ghosh A. Electrical conductivity and conductivity relaxation in mixed alkali fluoride glasses. Solid State Ionics. 2002;149:67–72. doi: 10.1016/S0167-2738(02)00170-4. [DOI] [Google Scholar]
- Lanfredi S. Saia P. S. Lebullenger R. Hernandes A. C. Electric conductivity and relaxation in fluoride, fluorophosphate and phosphate glasses: analysis by impedance spectroscopy. Solid State Ionics. 2002;146:329–339. doi: 10.1016/S0167-2738(01)01030-X. [DOI] [Google Scholar]
- Kaiser M. Magnetic and electric modulus properties of In substituted Mg–Mn–Cu ferrites. Mater. Res. Bull. 2016;73:452–458. doi: 10.1016/j.materresbull.2015.09.015. [DOI] [Google Scholar]
- Ranjan R. Kumar R. Kumar N. Behera B. Choudhary R. N. P. Impedance and electric modulus analysis of Sm-modified Pb(Zr0.55Ti0.45)1−x/4O3 ceramics. J. Alloys Compd. 2011;509:6388–6394. doi: 10.1016/j.jallcom.2011.03.003. [DOI] [Google Scholar]
- Hanief Najar M. Majid K. Investigation of the transport properties of PPy/[Co (EDTA) NH 3 Cl] · H 2 O nanocomposite prepared by chemical oxidation method. RSC Adv. 2016;6:25449–25459. doi: 10.1039/C6RA00950F. [DOI] [Google Scholar]
- Hazarika J. Kumar A. Electric modulus based relaxation dynamics and ac conductivity scaling of polypyrrole nanotubes. Synth. Met. 2014;198:239–247. doi: 10.1016/j.synthmet.2014.10.009. [DOI] [Google Scholar]
- Costa M. M. Pires Jr G. F. M. Terezo A. J. Grac M. P. F. Sombra A. S. B. Impedance and modulus studies of magnetic ceramic oxide Ba2Co2Fe12O22 (Co2Y) doped with Bi2O3. J. Appl. Phys. 2011;110:034107. doi: 10.1063/1.3615935. [DOI] [Google Scholar]
- Behera C. Das P. R. Choudhary R. N. P. Structural and Electrical Properties of Mechanothermally Synthesized NiFe2O4 Nanoceramics. J. Electron. Mater. 2014;43:3539–3549. doi: 10.1007/s11664-014-3216-0. [DOI] [Google Scholar]
- Ben Taher Y. Moutia N. Oueslati A. Gargouri M. Electrical properties, conduction mechanism and modulus of diphosphate compounds. RSC Adv. 2016;6:39750–39757. doi: 10.1039/C6RA05220G. [DOI] [Google Scholar]
- Borsa F. Torgeson D. R. Martin S. W. Patel H. K. Relaxation and fluctuations in glassy fast-ion conductors: Wide-frequency-range NMR and conductivity measurements. Phys. Rev. B: Condens. Matter Mater. Phys. 1992;46:795–800. doi: 10.1103/PhysRevB.46.795. [DOI] [PubMed] [Google Scholar]
- Schmidt R. Pandey S. Fiorenza P. Sinclair D. C. Non-stoichiometry in “CaCu3Ti4O12” (CCTO) ceramics. RSC Adv. 2013;3:14580–14589. doi: 10.1039/C3RA41319E. [DOI] [Google Scholar]
- Sinha A. Dutta A. Microstructure evolution, dielectric relaxation and scaling behavior of Dy-for-Fe substituted Ni-nanoferrites. RSC Adv. 2015;5:100330–100338. doi: 10.1039/C5RA14783B. [DOI] [Google Scholar]
- Chen A. Zhi Y. Cross L. E. Oxygen-vacancy-related low-frequency dielectric relaxation and electrical conduction in Bi: SrTiO3. Phys. Rev. B: Condens. Matter Mater. Phys. 2000;62:228–236. doi: 10.1103/PhysRevB.62.228. [DOI] [Google Scholar]
- Yadav R. S. Kuřitka I. Vilcakova J. Urbánek P. Machovsky M. Masař M. Holek M. Structural, magnetic, optical, dielectric, electrical and modulus spectroscopic characteristics of ZnFe2O4 spinel ferrite nanoparticles synthesized via honey-mediated sol-gel combustion method. J. Phys. Chem. Solids. 2017;110:87–99. doi: 10.1016/j.jpcs.2017.05.029. [DOI] [Google Scholar]
- Assar S. T. Abosheiasha H. F. El Nimr M. K. Study of the dielectric behavior of Co–Ni–Li nanoferrites. J. Magn. Magn. Mater. 2014;350:12–18. doi: 10.1016/j.jmmm.2013.09.022. [DOI] [Google Scholar]
- Hashim M. Kumar S. Ali S. Koo B. H. Chung H. Ravi Kumar, Structural, magnetic and electrical properties of Al3+ substituted Ni–Zn ferrite nanoparticles. J. Alloys Compd. 2012;511:107–114. doi: 10.1016/j.jallcom.2011.08.096. [DOI] [Google Scholar]
- Narayanan S. Baral A. K. Thangadurai V. Dielectric characteristics of fast Li ion conducting garnet-type Li5+2xLa3Nb2−xYxO12 (x = 0.25, 0.5 and 0.75) Phys. Chem. Chem. Phys. 2016;18:15418–15426. doi: 10.1039/C6CP02287A. [DOI] [PubMed] [Google Scholar]
- Singh L. Rai U. S. Mandal K. Cheol Sin B. Lee S.-I. Lee Y. Dielectric, AC-impedance, modulus studies on 0.5BaTiO3·0.5CaCu3Ti4O12 nano-composite ceramic synthesized by one-pot, glycine-assisted nitrate-gel route. Ceram. Int. 2014;40:10073–10083. doi: 10.1016/j.ceramint.2014.04.001. [DOI] [Google Scholar]


