Abstract
Rechargeable aqueous batteries are one of the most promising large-scale energy storage devices because of their environment-friendly properties and high safety advantages without using flammable and poisonous organic liquid electrolyte. In addition, rechargeable Zn–MnO2 batteries have great potential due to their low-cost resources as well as high energy density. However, dendritic growth of the zinc anode hinders the exertion of cycling stability and rate capacity in an aqueous Zn–MnO2 battery system. Here we use an electrochemical deposition method to in situ form a three-dimensional (3D) zinc anode on carbon fibers (CFs). This 3D Zn@CFs framework has lower charge transfer resistance with larger electroactive areas. Batteries based on the 3D zinc framework anode and α-MnO2 nanowire cathode present enhanced rate capacity and long cycling stability, which is promising for utilization in other zinc anode based aqueous batteries as an effective way to solve dendrite formation.
Synthesis of a 3D Zn@CFs anode through constant voltage electrodeposition to realize a dendrite-free cycling performance in an aqueous Zn/MnO2 battery.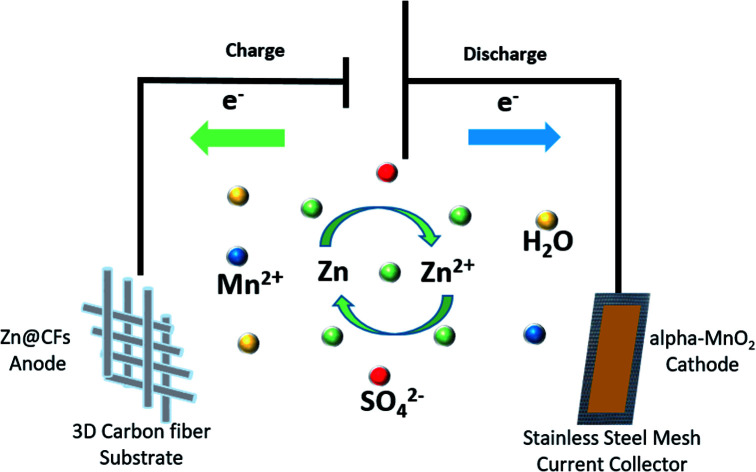
1. Introduction
Lithium ion batteries have been widely used as portable energy storage devices with high energy density and long cycle stability.1–3 However, the growing concerns about high costs, poor safety and earth-limited element resources of Li-ion batteries have revived Li-free aqueous batteries, especially in large-scale energy storage systems.4–8 Among them, battery reactions based on reversible insertion of Na+, K+, Mg2+ and Zn2+ and hybrid ions in mild aqueous electrolyte have been considered as promising alternatives, because of their high safety, material abundance, non-flammability and environmentally friendly properties.9,10 In an aqueous system, the narrow voltage window of water (1.23 V vs. SHE) restricts the options of electrode material, especially for the anode materials. Among these, rechargeable aqueous Zn/MnO2 batteries are considered as one of the most attractive alternatives which have been extensively studied for several years.11–14
Zn and Mn elements are all earth abundant with affordable prices and can be largely utilized in an aqueous energy storage system. Zn metal anode has an appropriate voltage potential (−0.76 V vs. SHE) and a high theoretical capacity (825 mA h g−1).15 In the meantime, MnO2 with α-, β- or amorphous phases is easily fabricated and the whole system is environment friendly.16,17 However, poor cycle life and the growth of Zn dendrites18–20 hinder the development and commercialization of rechargeable Zn–MnO2 batteries. Primary Zn dendrites can puncture the diaphragm, causing short circuits. Lots of approaches have been proposed to optimize these problems such as adding additives in the electrolyte to modify the deposition behavior,21,22 coating a new protective layer on the surface of Zn metal23,24 or using Zn-alloy25–27 to improve conductivity and anti-corrosion property. Unfortunately, most of the improvements are either expensive or hard to maintain a long lifespan during cell cycling.
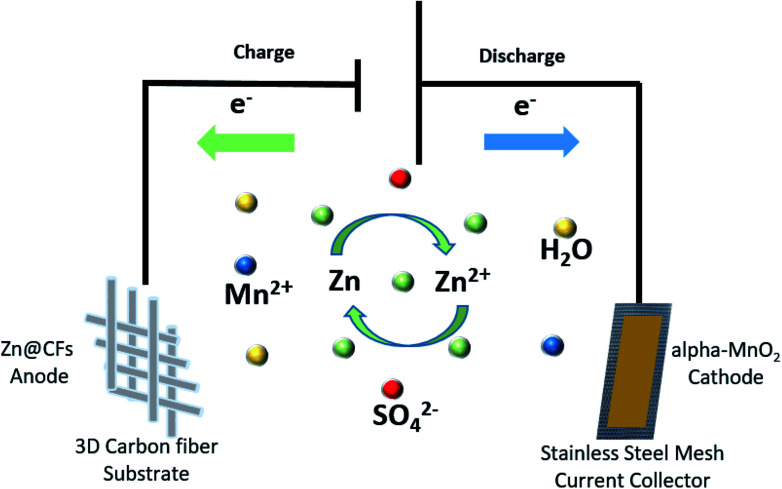
Here, a composited Zn anode is introduced by constant voltage (−1.4 V vs. SHE) electrodepositing zinc on three-dimensional (3D) carbon fibers (CFs) to solve dendrite growth issues in a Zn–MnO2 battery system during cycling. The Zn@CFs core–shell structure provides zinc anode with larger electrochemical reaction area28 and can withstand the inside strain and stress during Zn plating or stripping process. By combining this 3D dendrite-free Zn anode with the α-MnO2 nanofiber cathode, an aqueous full cell (Fig. 1) with excellent electrochemical performance is fabricated with ultra-stable cycling performance and no dendrite growth was found even after 140 cycles at a cycling current density of 308 mA cm−2. This study also provides insights to reconcile the demands for both dendrite-free structure modification engineering and good cycling stability faced in the practical use of the aqueous rechargeable Zn/MnO2 energy storage system.29–33
Fig. 1. Schematic illustration of Zn@CFs|2.0 mol l−1 ZnSO4, 0.1 mol l−1 MnSO4|α-MnO2 aqueous battery.
2. Experimental
2.1. Material synthesis
Preparation of the 3D flexible Zn@CFs anode: as schematically shown in Fig. s1,† the electrodeposition process was carried out in a three-electrode glass cell consists of a hydrophilic carbon clothes (350 μm thick, Shanghai Hesen, 99%) as working electrode, a Pt foil (Alfa, 99%) as counter electrode, a SCE as the reference electrode.34 The electrodeposition voltage was under −1.4 V (vs. SCE) for 0.5 h. The α-MnO2 nanofibers cathode was synthesized through a hydrothermal method.35 Briefly, 0.003 M MnSO4·H2O, 2 ml 0.5 M H2SO4 and 20 ml 0.1 M KMnO4 were in order added to 90 ml deionized water and then transferred to a Teflon-lined autoclave and heated at 120 °C for 12 h. The mass load of the cathode material was about 2 mg cm−2 and the deposition amount of Zn was about 7.85 mA h cm−2 (see ESI, Fig. s2 and s3†). Then, the as-prepared electrodes and the Whatman glass fiber separator were used to fabricate a Zn–MnO2 battery.
2.2. Materials characterizations
The scanning electron microscopy images and corresponding Energy Dispersive Spectrometer (EDS) and mapping images were obtained by JEOL 6701F. X-ray photoelectron spectroscopy (XPS) and X-ray diffraction (XRD) patterns were recorded by the ESCALab 250Xi spectrometer and Rigaku D/max-2500 diffractometer, respectively. The High Resolution Transmission Electron Microscopy (HRTEM) images were examined on the JEM 2100F at an accelerating voltage of 200 kV. The Brunauer–Emmett–Teller (BET) surface area was measured by nitrogen adsorption–desorption using a Quantachrome Autosorb-IQ MP.
2.3. Electrochemical characterization
Zn@CFs plating or stripping test was conducted by assembling a symmetric battery based on Zn foil as the counter/reference electrode, Zn@CFs as the working electrode. As a contrast experiment, the same amount of Zn (7.85 mA h cm−2) was deposited on a 2D stainless steel current collector as work electrode and then assembled in the same way to testify the superior cycling stability of this 3D composite structure, this control sample was named as Zn@SS. The cycling stability was measured at a current of 1 mA cm−2 for 1 h between each plating or stripping stage. CR2032-type coin full cell was assembled with Zn@CFs anode, glass fiber separator and α-MnO2 nanowire cathode. The electrolyte used in this work was a mixture of 2 M ZnSO4 and 0.1 M MnSO4 in H2O solution at a pH of 5–6. The capacity evaluation of the full cell was based on the load of cathode mass. Active materials (α-MnO2 nanowire) : conductive additive (Super P) : polytetrafluoroethylene (PTFE) were mixed in a rate of 7 : 2 : 1 to form a slurry with ethanol solution and rolled onto the stainless-steel current collector to make a cathode electrode. Cyclic voltammetry (CV) was performed by a Princeton electrochemical work station (ParSTAT MC). Galvanostatic tests were measured by using LAND cycler (Kingnuo Electronic Co., China) at room temperature.
3. Results and discussion
3.1. Zn@CFs composite anode characterization
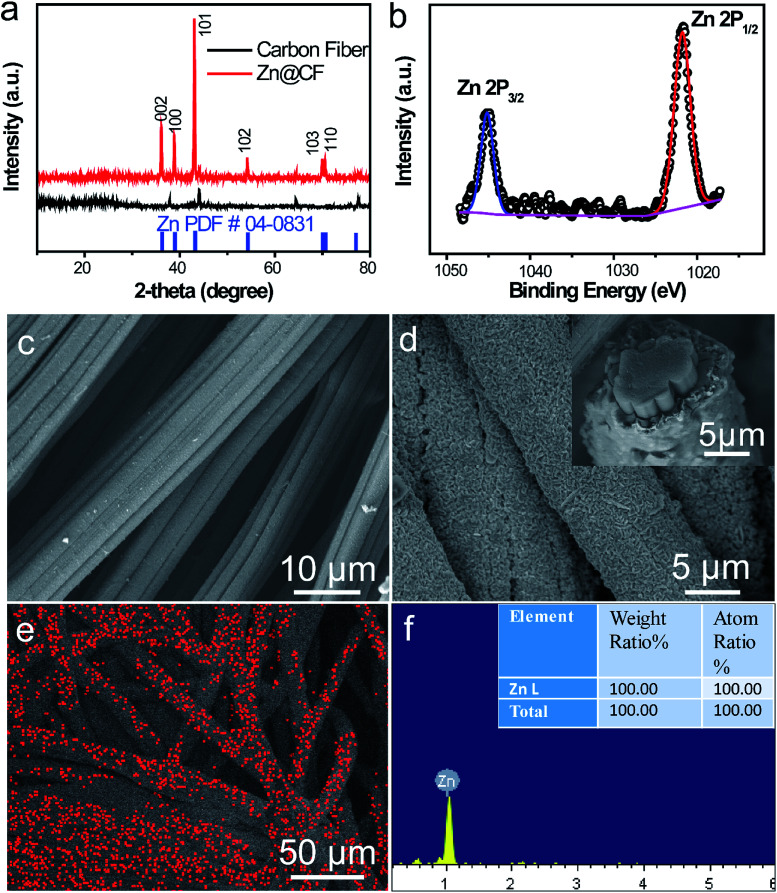
To characterize the structure of the obtained electrodes, XRD tests were performed. The patterns (Fig. 2a) of the as-prepared Zn@CFs showed that all the main peaks match with metal zinc's base peak (JCPSD: 04-0831). After deposition, carbon fibers' peaks were weakened or disappeared which indicate that a uniform deposition layer on the surface of 3D carbon fiber framework was achieved. Also, XPS spectrum (Fig. 2b) shows that two peaks at 1021.75 eV (Zn 2P1/2) and 1044.7 eV (Zn 2P3/2) were detected which were attributed to the signal of pure Zn metal. The morphology changes before and after deposition process were observed by SEM. Before deposition, the surface of carbon fiber was smooth and flat (Fig. 2c), after constant voltage deposition, a uniform Zn metal layer with a rough surface (Fig. 2d) was in situ coated on the carbon fibers. The thickness of compactly deposited Zn metal layer was about 2 μm (Fig. 2d, inner image). The mapping image (Fig. 2e) of deposited zinc was marked in red which showed that a large-scale uniform deposition of Zn on the carbon-fiber substrate. The EDS result (Fig. 2f) was well-indexed with XRD and XPS results that the one and only peak of Zn (100%) was detected on the surface of Zn@CFs.
Fig. 2. Characterizations of Zn@CFs composite anode. (a) XRD patterns of Zn@CFs and pristine carbon fiber substrate. (b) XPS spectrum of the as-prepared Zn@CFs anode. (c and d) SEM images of pristine carbon fiber substrate and Zn@CFs anode, the image inside (d) is a cross-view of Zn@CFs anode. (e and f) Mapping image and EDS test of the as-prepared Zn@CFs anode, Zn element was marked in red (e).
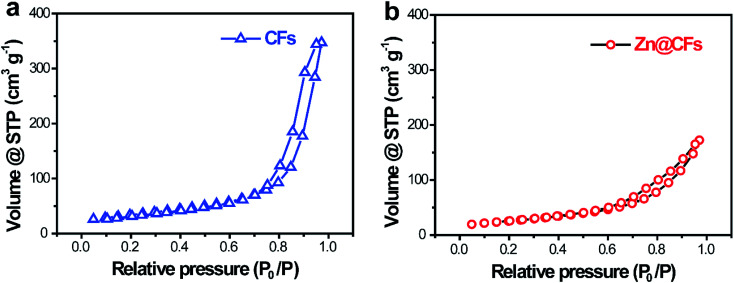
The BET isotherms of N2 adsorption and desorption were conducted at 77 K before and after Zn deposition (Fig. 3a and b). Compared with one dimensional commercialized Zn plate with a negligible active area (1.12 × 10⁻³ m2 g−1), the determined specific surface area of pristine 3D carbon fiber framework was 121.2 m2 g−1 which provide dramatically enlarged electroactive area that can lower charge transfer resistance. After deposition, the determined specific surface area of as-prepared Zn@CFs was slightly decreased to 91.3 m2 g−1 but still much higher than commercialized Zn plate. The unique composite anode design combined high electroactive area with high conductive skeleton, which lay the foundation for an effective electrochemical performance.
Fig. 3. N2 adsorption/desorption isotherms of (a) pristine carbon fiber substrate and (b) the as-prepared Zn@CFs composite anode.
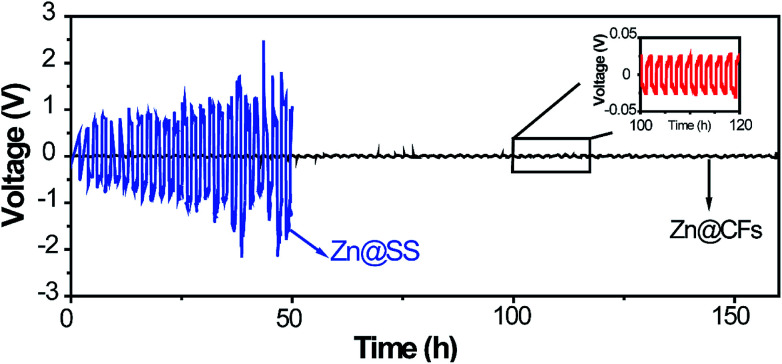
Zn@CFs plating or stripping test was conducted by assembling a symmetric battery based on Zn foil as the counter/reference electrode, Zn@CFs as working electrode. As a contrast experiment, the same amount of Zn (7.85 mA h cm−2) was deposited on a 2D stainless steel current collector (Zn@SS) as work electrode and then assemble in the same way to testify the superior cycling stability of this 3D composite structure. The cycling stability was measured at a current of 1 mA cm−2 for 1 h between each plating or stripping stage. The galvanostatic plating/stripping of Zn@CFs anode (Fig. 4) showed that an ultra-low potential fluctuation (less than 30 mV) exhibit which prove the superior electrochemical stability of this novel designed 3D framework. However, without the use 3D conductive framework, a symmetric battery based on 2D stainless steel substrate show huge unsteadiness and drastic fluctuations during plating/stripping process.
Fig. 4. Voltage profile of Zn@CFs|Zn symmetric cell (black line) and Zn@SS|Zn symmetric cell (blue line) in plating/stripping process.
3.2. α-MnO2 nanowire cathode characterization
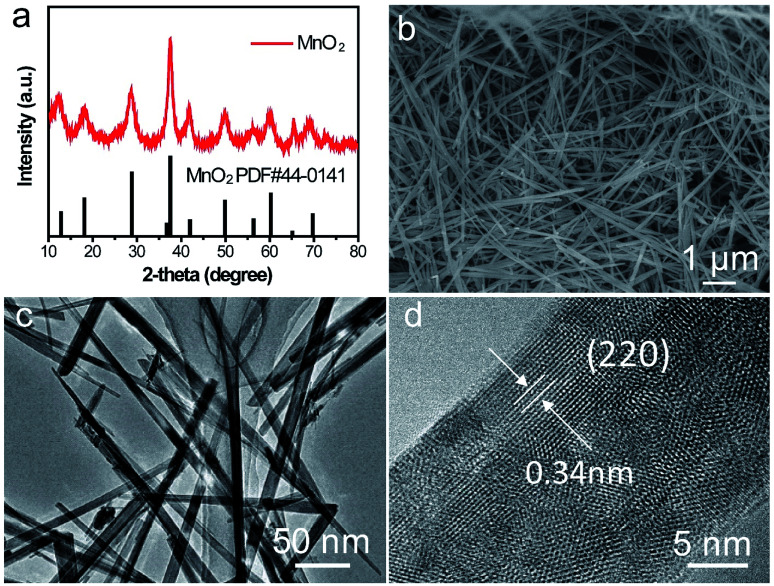
The crystalline phase of as-prepared α-MnO2 nanowire was shown in (Fig. 5a) which fully complexed with the base peak α-MnO2 (JCPDS: 44-0141). The length of the α-MnO2 nanowire was a few micrometres which was observed by SEM (Fig. 5b). TEM image of α-MnO2 nanofibers was shown in Fig. 5c with a homogeneous one-dimensional (1D) nanofibre structure and a diameter of 20 nm, lattice fringes along the (220) planes was shown in Fig. 5d, which revealed that the as-prepared α-MnO2 was highly crystalline.36
Fig. 5. Characterizations of α-MnO2 nanowire cathode. (a) XRD patterns of the as-prepared α-MnO2, (b) SEM image, (c) TEM image and (d) magnified TEM image.
3.3. Zn@CFs anode|α-MnO2 cathode full cell characterization
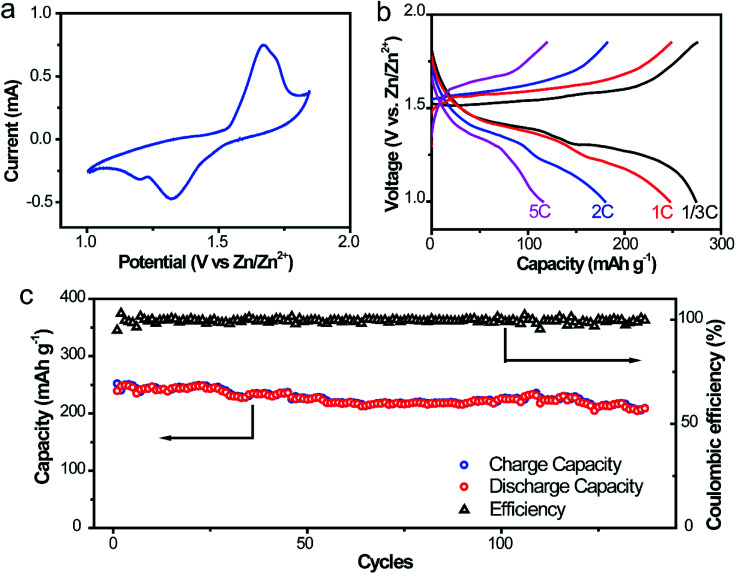
To further ascertain the superiority in liberating the electrochemical property and cycling stability of this Zn@CFs anode, a full aqueous battery with α-MnO2 nanofiber cathode in a mild aqueous electrolyte was assembled. The capacity evaluation of the full cell was based on the load of cathode mass and the theoretical capacity of α-MnO2 was 308 mA h g−1 (1C). The operational voltage window of the system was evaluated by voltammetry at 0.5 mV s−1 in Fig. 6a, which two pairs of redox peaks are consistent with the two plateaux in the charge/discharge curves in Fig. 6b. Decent capacities of 275.2, 248.2, 182.0 mA h g−1 were delivered for the full cells at different current rates of 1/3C, 1C and 2C, respectively. Even at a high rate of 5C, a discharge capacity of 119.3 mA h g−1 was obtained, which showed an excellent rate capability of this system. For the long-term cycling performance (Fig. 6c) at a rate of 1C, the initial discharge capacity was 239.4 mA h g−1 and after 140 cycles, the corresponding capacity retention was 86.8%. This high-rate performance could be ascribed to the stabilization and excellent kinetics 3D anode framework design with lower charge transfer resistance and larger electroactive areas. The comparison of the electrical performance of the as-obtained Zn@CFs/MnO2 aqueous battery with previous reported Zn2+ ion aqueous battery systems was listed on Table S1.†
Fig. 6. (a) CV scanning profile at 0.5 mV s−1 (b) galvanostatic discharging/charging profiles at 1/3, 1, 2, 5C rate, respectively. (c) Cycling performances of Zn@CFs|α-MnO2 full cell at 1C rate.
The morphology changes of a commercialized zinc plate anode before and after cycling test were shown in (Fig. s4a and b†). During the cycling process, Zn dendrite was formed because of uneven deposition and increasing irreversible side-reactions during the charging–discharging processes, which led to battery failures. This result confirmed that Zn@CFs anode reconciled the stability with excellent electrical performance. The structure stability of this 3D framework electrode was tested by comparing the morphology Zn@CFs before and after cycling test. Through SEM images (Fig. s4c and d†), it can be seen that even after 140 cycles at 1C, the compact 3D structure remained and Zn still preferentially deposited on the surface of CFs without any structure collapse or dendrite growth.
4. Conclusion
In conclusion, we have proposed a novel three-dimensional structure of zinc anode through constant voltage electrodeposition method on a conductive carbon skeleton, which offers lower charge transfer resistance and larger electroactive areas in suppressing zinc dendritic growth. Full batteries based on this 3D Zn@CFs anode and α-MnO2 exhibit an excellent rate capability and a long-term cycling stability at high rates. This design strategy will inspire a deep comprehension of integral structure of Zn-based aqueous battery for other aqueous large-scale energy storage systems.
Conflicts of interest
The authors declare that they have no conflict of interest.
Supplementary Material
Acknowledgments
This wok was supported by the Basic Science Center Project of National Natural Science Foundation of China under grant No. 51788104, the National Key R&D Program of China (Grant No. 2016YFA0202500), the National Natural Science Foundation of China (21773264, 51672281) and the “Transformational Technologies for Clean Energy and Demonstration”, Strategic Priority Research Program of the Chinese Academy of Sciences (Grant No. XDA 21070300).
Electronic supplementary information (ESI) available. See DOI: 10.1039/c8ra03226b
Notes and references
- Goodenough J. B. Kim Y. Chem. Mater. 2010;22:587–603. doi: 10.1021/cm901452z. [DOI] [Google Scholar]
- Lin D. Liu Y. Cui Y. Nat. Nanotechnol. 2017;12:194–206. doi: 10.1038/nnano.2017.16. [DOI] [PubMed] [Google Scholar]
- Tarascon J. M. Armand M. Nature. 2001;414:359–367. doi: 10.1038/35104644. [DOI] [PubMed] [Google Scholar]
- Guduru R. K. Icaza J. C. Nanomaterials. 2016;6:3. doi: 10.3390/nano6030041. [DOI] [PMC free article] [PubMed] [Google Scholar]
- Liu J. Zhang J.-G. Yang Z. Lemmon J. P. Imhoff C. Graff G. L. Li L. Hu J. Wang C. Xiao J. Xia G. Viswanathan V. V. Baskaran S. Sprenkle V. Li X. Shao Y. Schwenzer B. Adv. Funct. Mater. 2013;23:929–946. doi: 10.1002/adfm.201200690. [DOI] [Google Scholar]
- He W. Luo X. Evans D. Busby J. Garvey S. Parkes D. Wang J. Appl. Energy. 2017;208:745–757. doi: 10.1016/j.apenergy.2017.09.074. [DOI] [Google Scholar]
- Kapila S. Oni A. O. Kumar A. Energy. 2017;140:656–672. doi: 10.1016/j.energy.2017.08.117. [DOI] [Google Scholar]
- Laslett D. Carter C. Creagh C. Jennings P. Renewable Energy. 2017;113:713–731. doi: 10.1016/j.renene.2017.06.023. [DOI] [Google Scholar]
- Yan M. He P. Chen Y. Wang S. Wei Q. Zhao K. Xu X. An Q. Shuang Y. Shao Y. Mueller K. T. Mai L. Liu J. Yang J. Adv. Mater. 2018;30:1703725. doi: 10.1002/adma.201703725. [DOI] [PubMed] [Google Scholar]
- Zhang N. Cheng F. Liu J. Wang L. Long X. Liu X. Li F. Chen J. Nat. Commun. 2017;8:405. doi: 10.1038/s41467-017-00467-x. [DOI] [PMC free article] [PubMed] [Google Scholar]
- Xu C. Li B. Du H. Kang F. Angew. Chem., Int. Ed. 2012;51:933–935. doi: 10.1002/anie.201106307. [DOI] [PubMed] [Google Scholar]
- Li H. Xu C. Han C. Chen Y. Wei C. Li B. Kang F. J. Electrochem. Soc. 2015;162:A1439–A1444. doi: 10.1149/2.0141508jes. [DOI] [Google Scholar]
- Han C. He Y.-B. Liu M. Li B. Yang Q.-H. Wong C.-P. Kang F. J. Mater. Chem. A. 2017;5:6368–6381. [Google Scholar]
- Li H. Han C. Huang Y. Huang Y. Zhu M. Pei Z. Xue Q. Wang Z. Liu Z. Tang Z. Wang Y. Kang F. Li B. Zhi C. Energy Environ. Sci. 2018;11:941–951. [Google Scholar]
- Kim H. Jeong G. Kim Y.-U. Kim J.-H. Park C.-M. Sohn H.-J. Chem. Soc. Rev. 2013;42:9011–9034. doi: 10.1039/C3CS60177C. [DOI] [PubMed] [Google Scholar]
- Xu C. Du H. Li B. Kang F. Zeng Y. Electrochem. Solid-State Lett. 2009;12:A61–A65. doi: 10.1149/1.3065967. [DOI] [Google Scholar]
- Alfaruqi M. H. Mathew V. Gim J. Kim S. Song J. Baboo J. P. Choi S. H. Kim J. Chem. Mater. 2015;27:3609–3620. doi: 10.1021/cm504717p. [DOI] [Google Scholar]
- Parker J. F. Nelson E. S. Wattendorf M. D. Chervin C. N. Long J. W. Rolison D. R. ACS Appl. Mater. Interfaces. 2014;6:19471–19476. doi: 10.1021/am505266c. [DOI] [PubMed] [Google Scholar]
- Shen Y. W. Kordesch K. J. Power Sources. 2000;87:162–166. doi: 10.1016/S0378-7753(99)00476-0. [DOI] [Google Scholar]
- Ito Y. Nyce M. Plivelich R. Klein M. Steingart D. Banerjee S. J. Power Sources. 2011;196:2340–2345. doi: 10.1016/j.jpowsour.2010.09.065. [DOI] [Google Scholar]
- Lee C. W. Sathiyanarayanan K. Eom S. W. Kim H. S. Yun M. S. J. Power Sources. 2006;160:161–164. doi: 10.1016/j.jpowsour.2006.01.070. [DOI] [Google Scholar]
- Azhagurajan M. Nakata A. Arai H. Ogumi Z. Kajita T. Itoh T. Itaya K. J. Electrochem. Soc. 2017;164:A2407–A2417. doi: 10.1149/2.0221712jes. [DOI] [Google Scholar]
- Gonzalez M. A. Trocoli R. Pavlovic I. Barriga C. La Mantia F. Electrochem. Commun. 2016;68:1–4. doi: 10.1016/j.elecom.2016.04.006. [DOI] [PubMed] [Google Scholar]
- Hoang T. K. A. Nam Long D. T. Cho J. H. Su J. Y. J. Lee C. Lu C. Chen P. Chemsuschem. 2017;10:2816–2822. doi: 10.1002/cssc.201700441. [DOI] [PubMed] [Google Scholar]
- Varzi A. Mattarozzi L. Cattarin S. Guerriero P. Passerini S. Adv. Energy Mater. 2018;8:1701706. doi: 10.1002/aenm.201701706. [DOI] [Google Scholar]
- Shuai S. Guo E. Wang M. Callaghan M. D. Jing T. Zheng Q. Lee P. D. Metall. Mater. Trans. A. 2016;47:4368–4373. doi: 10.1007/s11661-016-3618-0. [DOI] [Google Scholar]
- Wang M. Y. Xu Y. J. Jing T. Peng G. Y. Fu Y. N. Chawla N. Scr. Mater. 2012;67:629–632. doi: 10.1016/j.scriptamat.2012.07.031. [DOI] [Google Scholar]
- Wang L.-P. Li N.-W. Wang T.-S. Yin Y.-X. Guo Y.-G. Wang C.-R. Electrochim. Acta. 2017;244:172–177. doi: 10.1016/j.electacta.2017.05.072. [DOI] [Google Scholar]
- Lu Y. Goodenough J. B. Kim Y. J. Am. Chem. Soc. 2011;133:5756–5759. doi: 10.1021/ja201118f. [DOI] [PubMed] [Google Scholar]
- Abad J. Santos F. Tafur J. P. Urbina A. Roman E. Gonzalez-Martinez J. F. Rubio-Zuazo J. Castro G. R. Fernandez Romero A. J. J. Power Sources. 2017;363:199–208. doi: 10.1016/j.jpowsour.2017.07.082. [DOI] [Google Scholar]
- Qiu W. Li Y. You A. Zhang Z. Li G. Lu X. Tong Y. J. Mater. Chem. A. 2017;5:14838–14846. [Google Scholar]
- Sun W. Wang F. Hou S. Yang C. Fan X. Ma Z. Gao T. Han F. Hu R. Zhu M. Wang C. J. Am. Chem. Soc. 2017;139:9775–9778. doi: 10.1021/jacs.7b04471. [DOI] [PubMed] [Google Scholar]
- Zeng Y. Zhang X. Meng Y. Yu M. Yi J. Wu Y. Lu X. Tong Y. Adv. Mater. 2017;29:1700274. doi: 10.1002/adma.201700274. [DOI] [PubMed] [Google Scholar]
- Wang X. Wang F. Wang L. Li M. Wang Y. Chen B. Zhu Y. Fu L. Zha L. Zhang L. Wu Y. Huang W. Adv. Mater. 2016;28:4904–4911. doi: 10.1002/adma.201505370. [DOI] [PubMed] [Google Scholar]
- Pan H. Shao Y. Yan P. Cheng Y. Han K. S. Nie Z. Wang C. Yang J. Li X. Bhattacharya P. Mueller K. T. Liu J. Nat. Energy. 2016;1:16309. [Google Scholar]
- Zhong K. Zhang B. Luo S. Wen W. Li H. Huang X. Chen L. J. Power Sources. 2011;196:6802–6808. doi: 10.1016/j.jpowsour.2010.10.031. [DOI] [Google Scholar]
Associated Data
This section collects any data citations, data availability statements, or supplementary materials included in this article.


